Darby borough, PA Map & Demographics
Darby borough Overview
$21,057
PER CAPITA INCOME
$55,837
AVG FAMILY INCOME
$45,511
AVG HOUSEHOLD INCOME
5.2%
WAGE / INCOME GAP [ % ]
94.8¢/ $1
WAGE / INCOME GAP [ $ ]
0.44
INEQUALITY / GINI INDEX
10,682
TOTAL POPULATION
4,755
MALE POPULATION
5,927
FEMALE POPULATION
80.23
MALES / 100 FEMALES
124.65
FEMALES / 100 MALES
33.7
MEDIAN AGE
3.9
AVG FAMILY SIZE
2.9
AVG HOUSEHOLD SIZE
4,541
LABOR FORCE [ PEOPLE ]
58.7%
PERCENT IN LABOR FORCE
13.9%
UNEMPLOYMENT RATE
Income in Darby borough
Income Overview in Darby borough
Per Capita Income in Darby borough is $21,057, while median incomes of families and households are $55,837 and $45,511 respectively.
| Characteristic | Number | Measure |
| Per Capita Income | 10,682 | $21,057 |
| Median Family Income | 2,115 | $55,837 |
| Mean Family Income | 2,115 | $60,753 |
| Median Household Income | 3,563 | $45,511 |
| Mean Household Income | 3,563 | $57,249 |
| Income Deficit | 2,115 | $0 |
| Wage / Income Gap (%) | 10,682 | 5.22% |
| Wage / Income Gap ($) | 10,682 | 94.78¢ per $1 |
| Gini / Inequality Index | 10,682 | 0.44 |
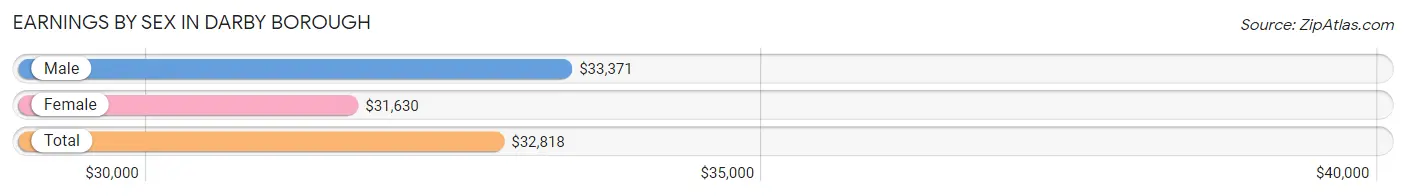
Earnings by Sex in Darby borough
Average Earnings in Darby borough are $32,818, $33,371 for men and $31,630 for women, a difference of 5.2%.
| Sex | Number | Average Earnings |
| Male | 1,954 (44.3%) | $33,371 |
| Female | 2,462 (55.7%) | $31,630 |
| Total | 4,416 (100.0%) | $32,818 |
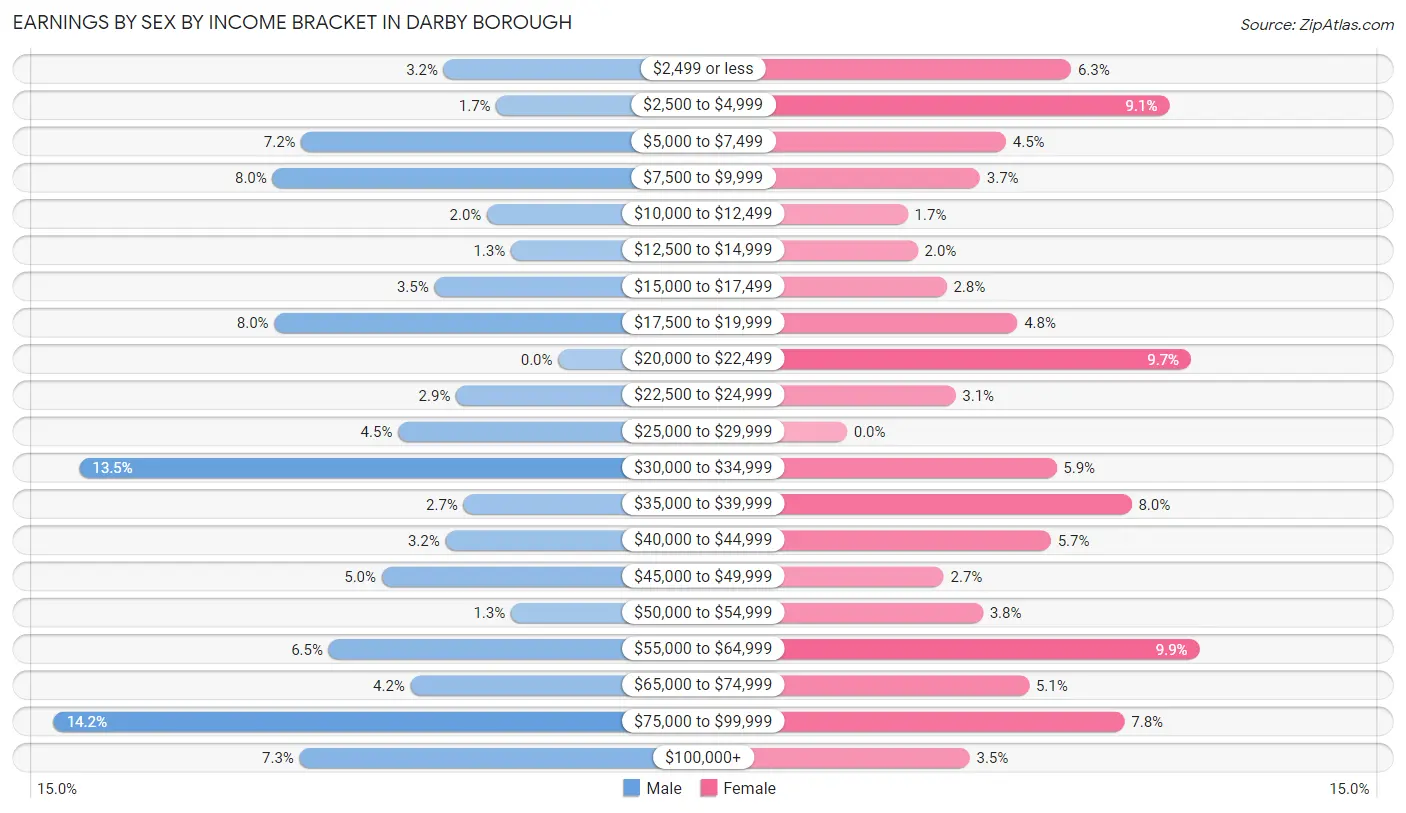
Earnings by Sex by Income Bracket in Darby borough
The most common earnings brackets in Darby borough are $75,000 to $99,999 for men (277 | 14.2%) and $55,000 to $64,999 for women (244 | 9.9%).
| Income | Male | Female |
| $2,499 or less | 63 (3.2%) | 155 (6.3%) |
| $2,500 to $4,999 | 34 (1.7%) | 223 (9.1%) |
| $5,000 to $7,499 | 141 (7.2%) | 110 (4.5%) |
| $7,500 to $9,999 | 157 (8.0%) | 92 (3.7%) |
| $10,000 to $12,499 | 39 (2.0%) | 42 (1.7%) |
| $12,500 to $14,999 | 26 (1.3%) | 49 (2.0%) |
| $15,000 to $17,499 | 68 (3.5%) | 69 (2.8%) |
| $17,500 to $19,999 | 156 (8.0%) | 118 (4.8%) |
| $20,000 to $22,499 | 0 (0.0%) | 238 (9.7%) |
| $22,500 to $24,999 | 56 (2.9%) | 75 (3.0%) |
| $25,000 to $29,999 | 88 (4.5%) | 0 (0.0%) |
| $30,000 to $34,999 | 263 (13.5%) | 145 (5.9%) |
| $35,000 to $39,999 | 52 (2.7%) | 197 (8.0%) |
| $40,000 to $44,999 | 62 (3.2%) | 141 (5.7%) |
| $45,000 to $49,999 | 97 (5.0%) | 67 (2.7%) |
| $50,000 to $54,999 | 26 (1.3%) | 94 (3.8%) |
| $55,000 to $64,999 | 126 (6.5%) | 244 (9.9%) |
| $65,000 to $74,999 | 81 (4.2%) | 126 (5.1%) |
| $75,000 to $99,999 | 277 (14.2%) | 192 (7.8%) |
| $100,000+ | 142 (7.3%) | 85 (3.5%) |
| Total | 1,954 (100.0%) | 2,462 (100.0%) |
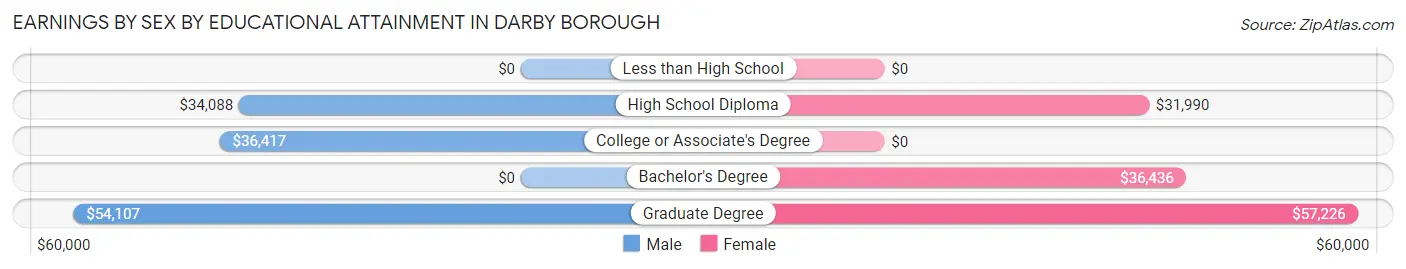
Earnings by Sex by Educational Attainment in Darby borough
Average earnings in Darby borough are $35,144 for men and $35,165 for women, a difference of 0.1%. Men with an educational attainment of graduate degree enjoy the highest average annual earnings of $54,107, while those with high school diploma education earn the least with $34,088. Women with an educational attainment of graduate degree earn the most with the average annual earnings of $57,226, while those with high school diploma education have the smallest earnings of $31,990.
| Educational Attainment | Male Income | Female Income |
| Less than High School | - | - |
| High School Diploma | $34,088 | $31,990 |
| College or Associate's Degree | $36,417 | $0 |
| Bachelor's Degree | - | - |
| Graduate Degree | $54,107 | $57,226 |
| Total | $35,144 | $35,165 |
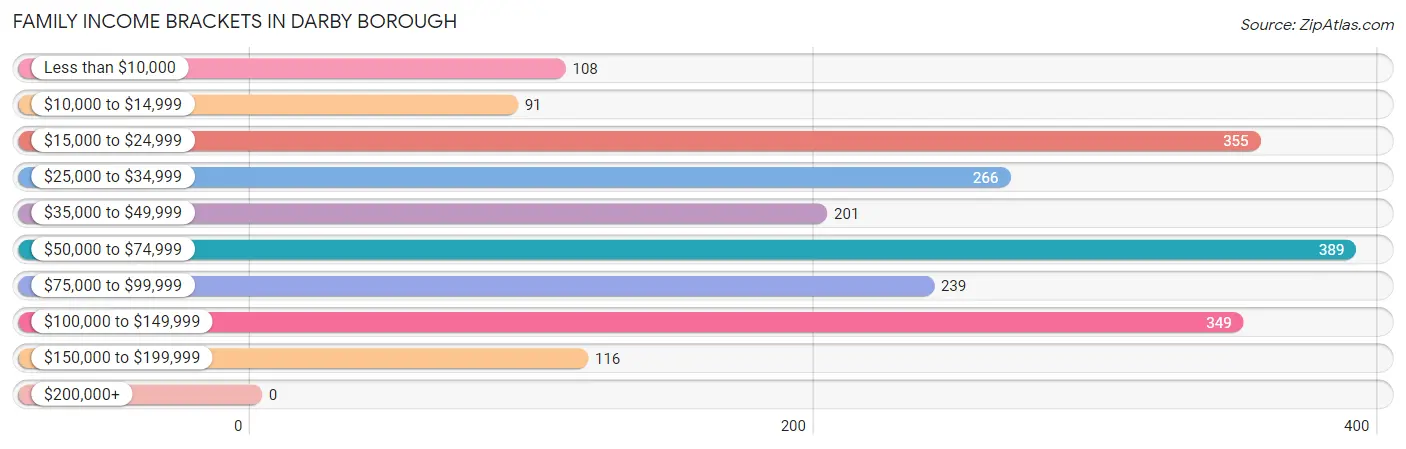
Family Income in Darby borough
Family Income Brackets in Darby borough
According to the Darby borough family income data, there are 389 families falling into the $50,000 to $74,999 income range, which is the most common income bracket and makes up 18.4% of all families.
| Income Bracket | # Families | % Families |
| Less than $10,000 | 108 | 5.1% |
| $10,000 to $14,999 | 91 | 4.3% |
| $15,000 to $24,999 | 355 | 16.8% |
| $25,000 to $34,999 | 266 | 12.6% |
| $35,000 to $49,999 | 201 | 9.5% |
| $50,000 to $74,999 | 389 | 18.4% |
| $75,000 to $99,999 | 239 | 11.3% |
| $100,000 to $149,999 | 349 | 16.5% |
| $150,000 to $199,999 | 116 | 5.5% |
| $200,000+ | 0 | 0.0% |
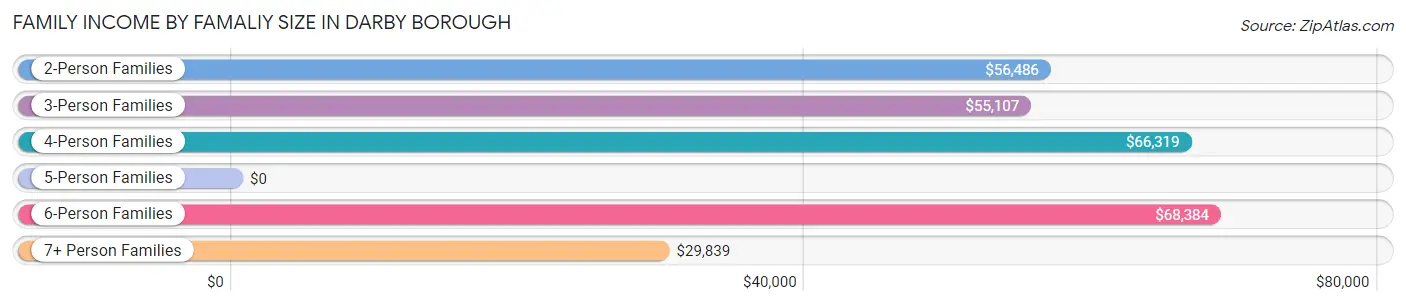
Family Income by Famaliy Size in Darby borough
6-person families (106 | 5.0%) account for the highest median family income in Darby borough with $68,384 per family, while 2-person families (840 | 39.7%) have the highest median income of $28,243 per family member.
| Income Bracket | # Families | Median Income |
| 2-Person Families | 840 (39.7%) | $56,486 |
| 3-Person Families | 433 (20.5%) | $55,107 |
| 4-Person Families | 420 (19.9%) | $66,319 |
| 5-Person Families | 200 (9.5%) | $0 |
| 6-Person Families | 106 (5.0%) | $68,384 |
| 7+ Person Families | 116 (5.5%) | $29,839 |
| Total | 2,115 (100.0%) | $55,837 |
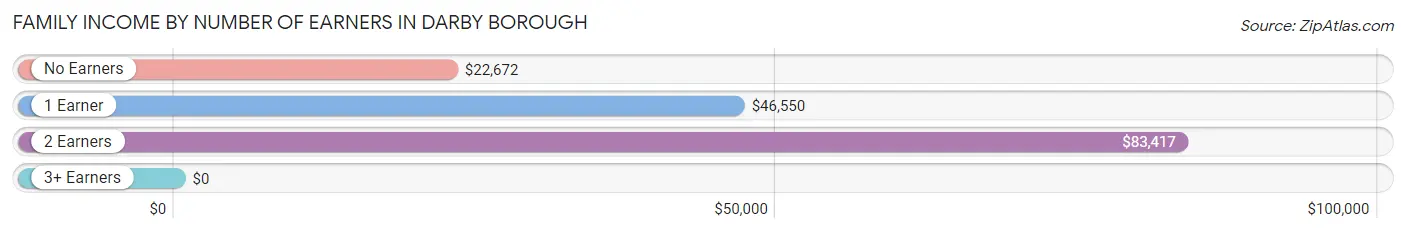
Family Income by Number of Earners in Darby borough
| Number of Earners | # Families | Median Income |
| No Earners | 335 (15.8%) | $22,672 |
| 1 Earner | 989 (46.8%) | $46,550 |
| 2 Earners | 639 (30.2%) | $83,417 |
| 3+ Earners | 152 (7.2%) | $0 |
| Total | 2,115 (100.0%) | $55,837 |
Household Income in Darby borough
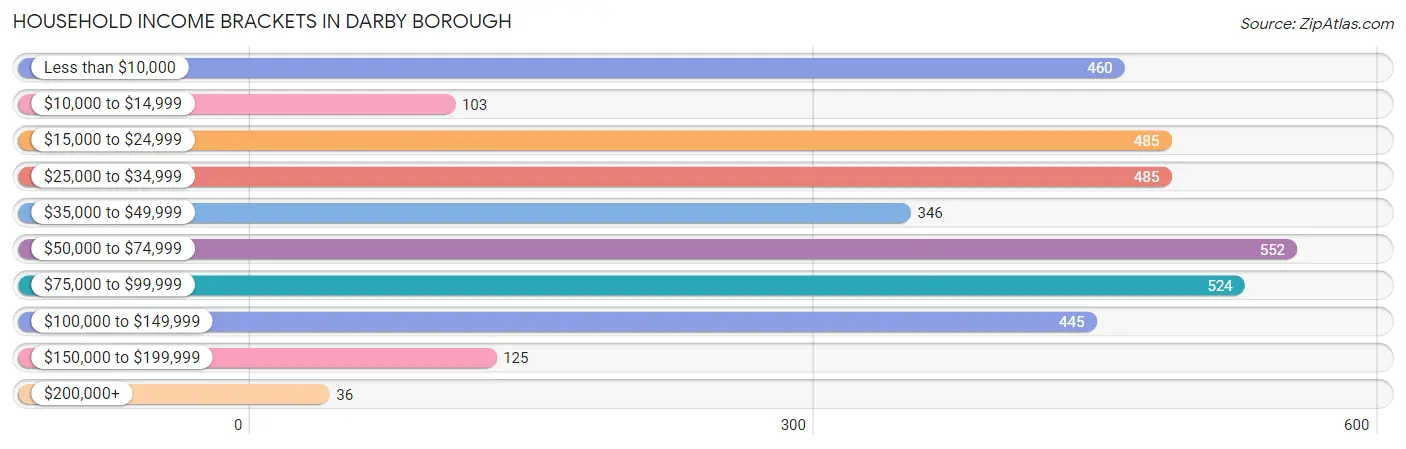
Household Income Brackets in Darby borough
With 552 households falling in the category, the $50,000 to $74,999 income range is the most frequent in Darby borough, accounting for 15.5% of all households. In contrast, only 36 households (1.0%) fall into the $200,000+ income bracket, making it the least populous group.
| Income Bracket | # Households | % Households |
| Less than $10,000 | 460 | 12.9% |
| $10,000 to $14,999 | 103 | 2.9% |
| $15,000 to $24,999 | 485 | 13.6% |
| $25,000 to $34,999 | 485 | 13.6% |
| $35,000 to $49,999 | 346 | 9.7% |
| $50,000 to $74,999 | 552 | 15.5% |
| $75,000 to $99,999 | 524 | 14.7% |
| $100,000 to $149,999 | 445 | 12.5% |
| $150,000 to $199,999 | 125 | 3.5% |
| $200,000+ | 36 | 1.0% |
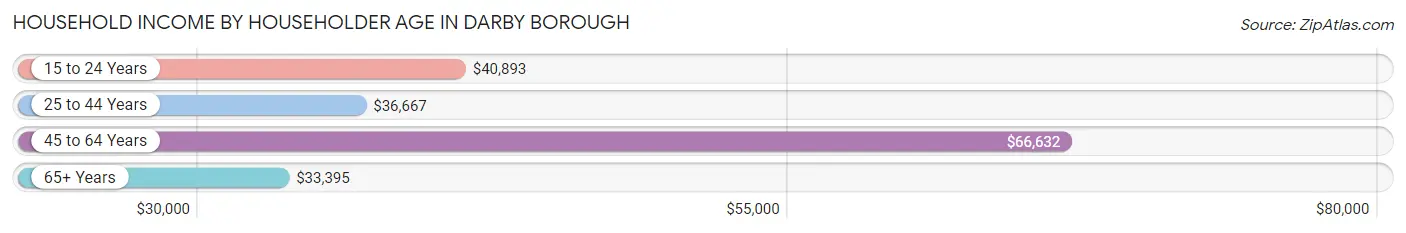
Household Income by Householder Age in Darby borough
The median household income in Darby borough is $45,511, with the highest median household income of $66,632 found in the 45 to 64 years age bracket for the primary householder. A total of 1,401 households (39.3%) fall into this category. Meanwhile, the 65+ years age bracket for the primary householder has the lowest median household income of $33,395, with 664 households (18.6%) in this group.
| Income Bracket | # Households | Median Income |
| 15 to 24 Years | 60 (1.7%) | $40,893 |
| 25 to 44 Years | 1,438 (40.4%) | $36,667 |
| 45 to 64 Years | 1,401 (39.3%) | $66,632 |
| 65+ Years | 664 (18.6%) | $33,395 |
| Total | 3,563 (100.0%) | $45,511 |
Poverty in Darby borough
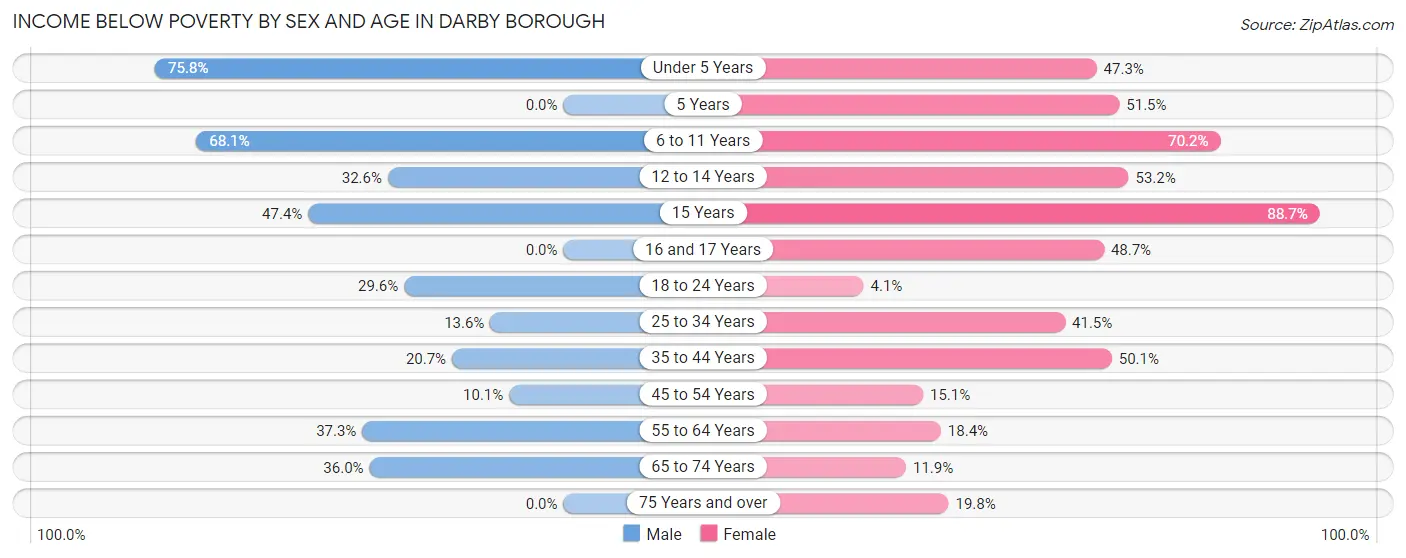
Income Below Poverty by Sex and Age in Darby borough
With 26.5% poverty level for males and 39.9% for females among the residents of Darby borough, under 5 year old males and 15 year old females are the most vulnerable to poverty, with 97 males (75.8%) and 133 females (88.7%) in their respective age groups living below the poverty level.
| Age Bracket | Male | Female |
| Under 5 Years | 97 (75.8%) | 123 (47.3%) |
| 5 Years | 0 (0.0%) | 85 (51.5%) |
| 6 to 11 Years | 363 (68.1%) | 550 (70.2%) |
| 12 to 14 Years | 58 (32.6%) | 206 (53.2%) |
| 15 Years | 9 (47.4%) | 133 (88.7%) |
| 16 and 17 Years | 0 (0.0%) | 109 (48.7%) |
| 18 to 24 Years | 144 (29.6%) | 14 (4.1%) |
| 25 to 34 Years | 88 (13.6%) | 303 (41.4%) |
| 35 to 44 Years | 98 (20.7%) | 449 (50.1%) |
| 45 to 54 Years | 56 (10.1%) | 98 (15.1%) |
| 55 to 64 Years | 230 (37.3%) | 122 (18.4%) |
| 65 to 74 Years | 90 (36.0%) | 23 (11.9%) |
| 75 Years and over | 0 (0.0%) | 43 (19.8%) |
| Total | 1,233 (26.5%) | 2,258 (39.9%) |
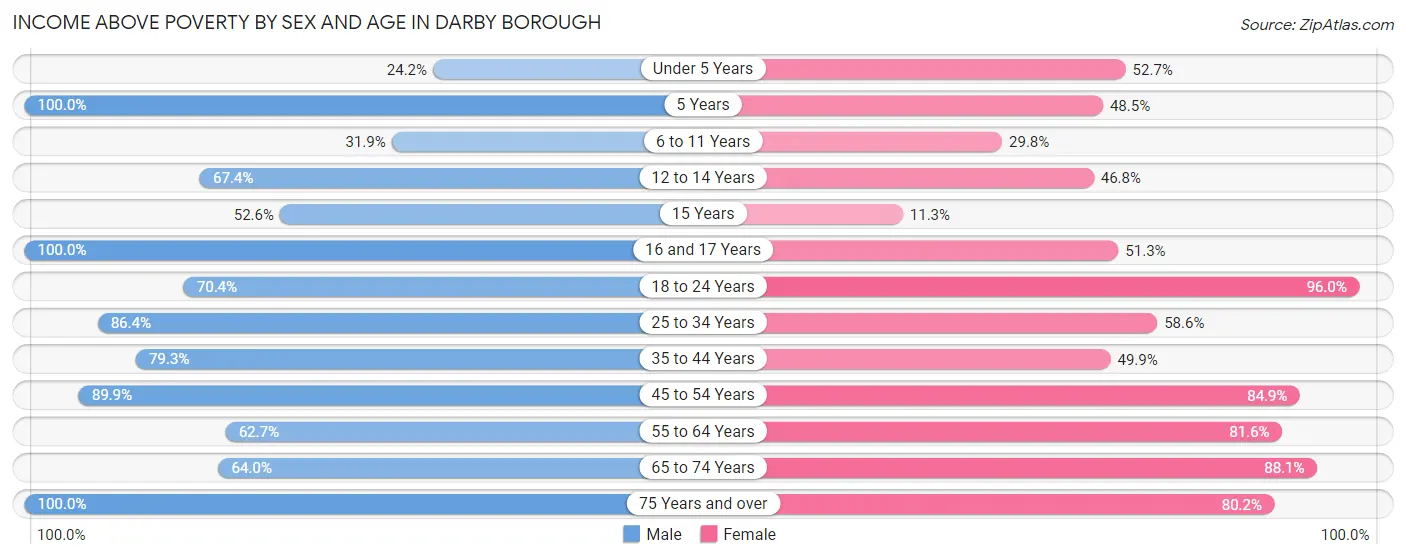
Income Above Poverty by Sex and Age in Darby borough
According to the poverty statistics in Darby borough, males aged 5 years and females aged 18 to 24 years are the age groups that are most secure financially, with 100.0% of males and 96.0% of females in these age groups living above the poverty line.
| Age Bracket | Male | Female |
| Under 5 Years | 31 (24.2%) | 137 (52.7%) |
| 5 Years | 343 (100.0%) | 80 (48.5%) |
| 6 to 11 Years | 170 (31.9%) | 233 (29.8%) |
| 12 to 14 Years | 120 (67.4%) | 181 (46.8%) |
| 15 Years | 10 (52.6%) | 17 (11.3%) |
| 16 and 17 Years | 110 (100.0%) | 115 (51.3%) |
| 18 to 24 Years | 343 (70.4%) | 332 (96.0%) |
| 25 to 34 Years | 560 (86.4%) | 428 (58.6%) |
| 35 to 44 Years | 376 (79.3%) | 447 (49.9%) |
| 45 to 54 Years | 500 (89.9%) | 552 (84.9%) |
| 55 to 64 Years | 386 (62.7%) | 541 (81.6%) |
| 65 to 74 Years | 160 (64.0%) | 170 (88.1%) |
| 75 Years and over | 315 (100.0%) | 174 (80.2%) |
| Total | 3,424 (73.5%) | 3,407 (60.1%) |
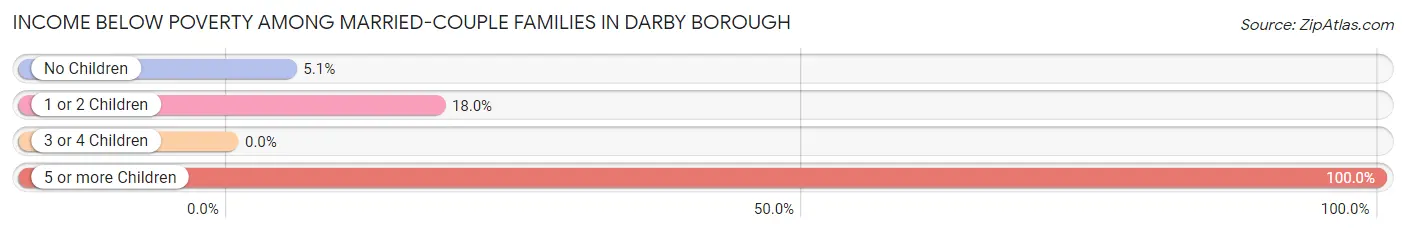
Income Below Poverty Among Married-Couple Families in Darby borough
The poverty statistics for married-couple families in Darby borough show that 12.3% or 73 of the total 591 families live below the poverty line. Families with 5 or more children have the highest poverty rate of 100.0%, comprising of 25 families. On the other hand, families with 3 or 4 children have the lowest poverty rate of 0.0%, which includes 0 families.
| Children | Above Poverty | Below Poverty |
| No Children | 355 (94.9%) | 19 (5.1%) |
| 1 or 2 Children | 132 (82.0%) | 29 (18.0%) |
| 3 or 4 Children | 31 (100.0%) | 0 (0.0%) |
| 5 or more Children | 0 (0.0%) | 25 (100.0%) |
| Total | 518 (87.6%) | 73 (12.3%) |
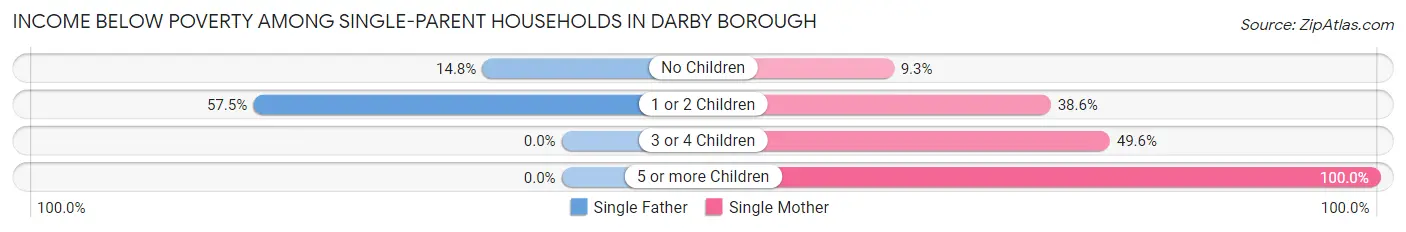
Income Below Poverty Among Single-Parent Households in Darby borough
According to the poverty data in Darby borough, 34.0% or 71 single-father households and 36.6% or 482 single-mother households are living below the poverty line. Among single-father households, those with 1 or 2 children have the highest poverty rate, with 54 households (57.5%) experiencing poverty. Likewise, among single-mother households, those with 5 or more children have the highest poverty rate, with 91 households (100.0%) falling below the poverty line.
| Children | Single Father | Single Mother |
| No Children | 17 (14.8%) | 34 (9.3%) |
| 1 or 2 Children | 54 (57.5%) | 241 (38.6%) |
| 3 or 4 Children | 0 (0.0%) | 116 (49.6%) |
| 5 or more Children | 0 (0.0%) | 91 (100.0%) |
| Total | 71 (34.0%) | 482 (36.6%) |
Income Below Poverty Among Married-Couple vs Single-Parent Households in Darby borough
The poverty data for Darby borough shows that 73 of the married-couple family households (12.3%) and 553 of the single-parent households (36.3%) are living below the poverty level. Within the married-couple family households, those with 5 or more children have the highest poverty rate, with 25 households (100.0%) falling below the poverty line. Among the single-parent households, those with 5 or more children have the highest poverty rate, with 91 household (100.0%) living below poverty.
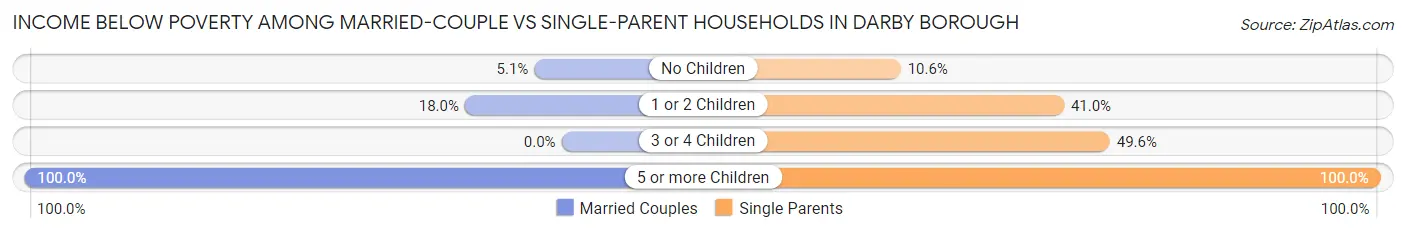
| Children | Married-Couple Families | Single-Parent Households |
| No Children | 19 (5.1%) | 51 (10.6%) |
| 1 or 2 Children | 29 (18.0%) | 295 (41.0%) |
| 3 or 4 Children | 0 (0.0%) | 116 (49.6%) |
| 5 or more Children | 25 (100.0%) | 91 (100.0%) |
| Total | 73 (12.3%) | 553 (36.3%) |
Race in Darby borough
The most populous races in Darby borough are Black / African American (9,253 | 86.6%), White / Caucasian (895 | 8.4%), and Two or more Races (479 | 4.5%).
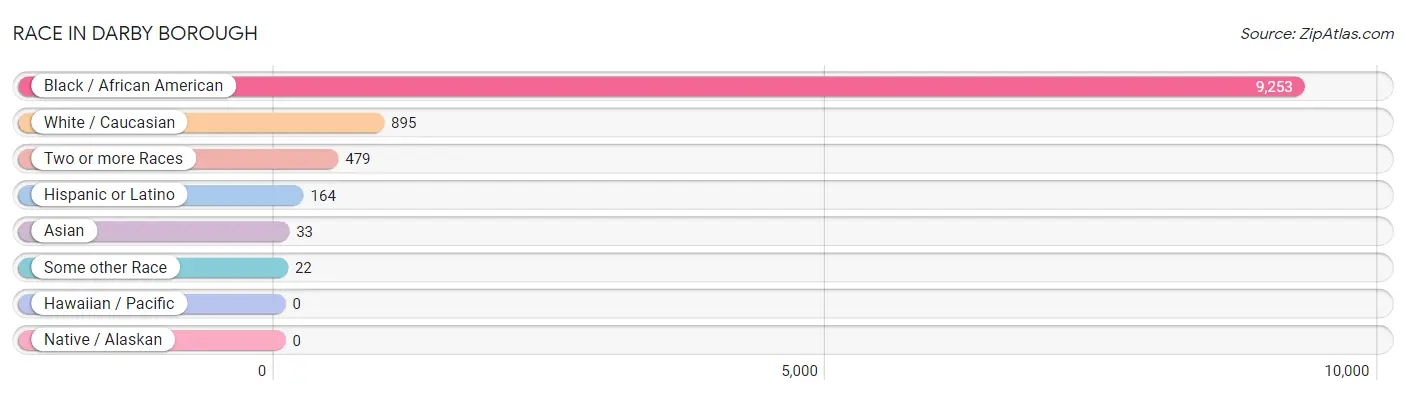
| Race | # Population | % Population |
| Asian | 33 | 0.3% |
| Black / African American | 9,253 | 86.6% |
| Hawaiian / Pacific | 0 | 0.0% |
| Hispanic or Latino | 164 | 1.5% |
| Native / Alaskan | 0 | 0.0% |
| White / Caucasian | 895 | 8.4% |
| Two or more Races | 479 | 4.5% |
| Some other Race | 22 | 0.2% |
| Total | 10,682 | 100.0% |
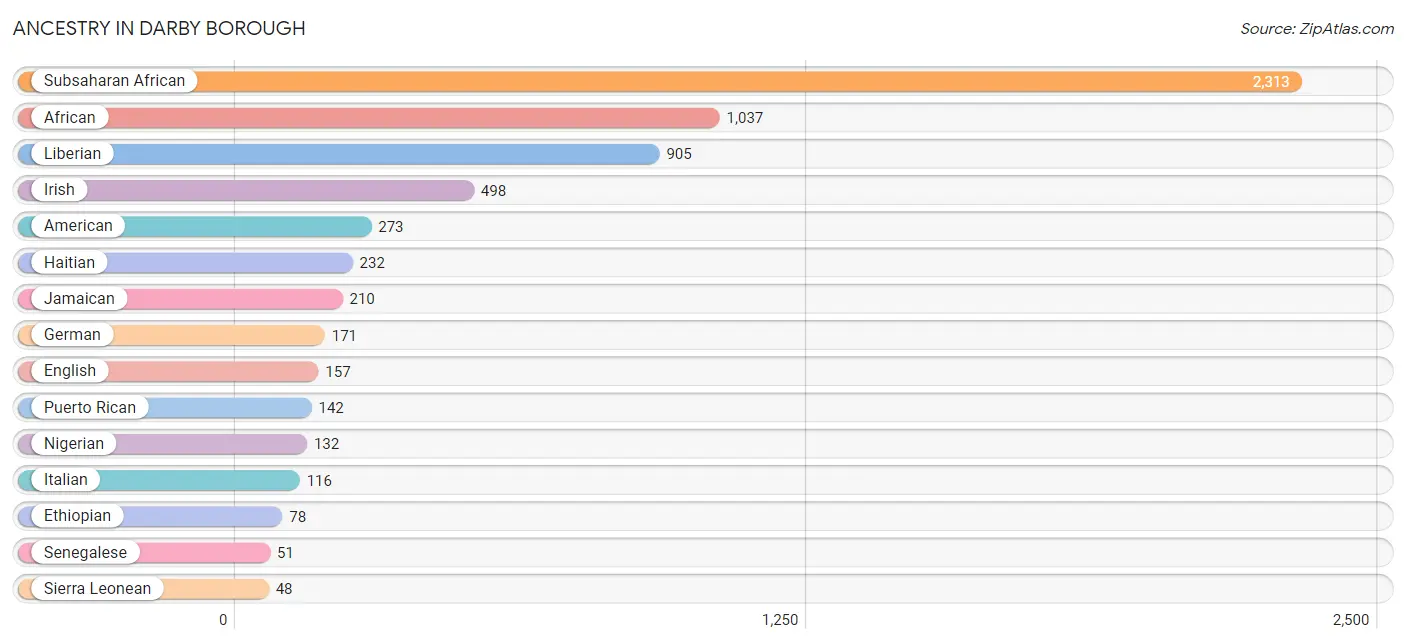
Ancestry in Darby borough
The most populous ancestries reported in Darby borough are Subsaharan African (2,313 | 21.6%), African (1,037 | 9.7%), Liberian (905 | 8.5%), Irish (498 | 4.7%), and American (273 | 2.6%), together accounting for 47.0% of all Darby borough residents.
| Ancestry | # Population | % Population |
| African | 1,037 | 9.7% |
| American | 273 | 2.6% |
| Central American | 7 | 0.1% |
| Czech | 1 | 0.0% |
| Dominican | 15 | 0.1% |
| Dutch | 27 | 0.3% |
| English | 157 | 1.5% |
| Ethiopian | 78 | 0.7% |
| French | 13 | 0.1% |
| French Canadian | 5 | 0.1% |
| German | 171 | 1.6% |
| Haitian | 232 | 2.2% |
| Irish | 498 | 4.7% |
| Italian | 116 | 1.1% |
| Jamaican | 210 | 2.0% |
| Kenyan | 36 | 0.3% |
| Liberian | 905 | 8.5% |
| Lithuanian | 9 | 0.1% |
| Malaysian | 24 | 0.2% |
| Nigerian | 132 | 1.2% |
| Pennsylvania German | 10 | 0.1% |
| Polish | 22 | 0.2% |
| Puerto Rican | 142 | 1.3% |
| Russian | 1 | 0.0% |
| Scottish | 43 | 0.4% |
| Senegalese | 51 | 0.5% |
| Sierra Leonean | 48 | 0.4% |
| Sri Lankan | 9 | 0.1% |
| Subsaharan African | 2,313 | 21.6% |
| Swedish | 26 | 0.2% |
| U.S. Virgin Islander | 30 | 0.3% |
| Ugandan | 2 | 0.0% |
| Welsh | 7 | 0.1% | View All 33 Rows |
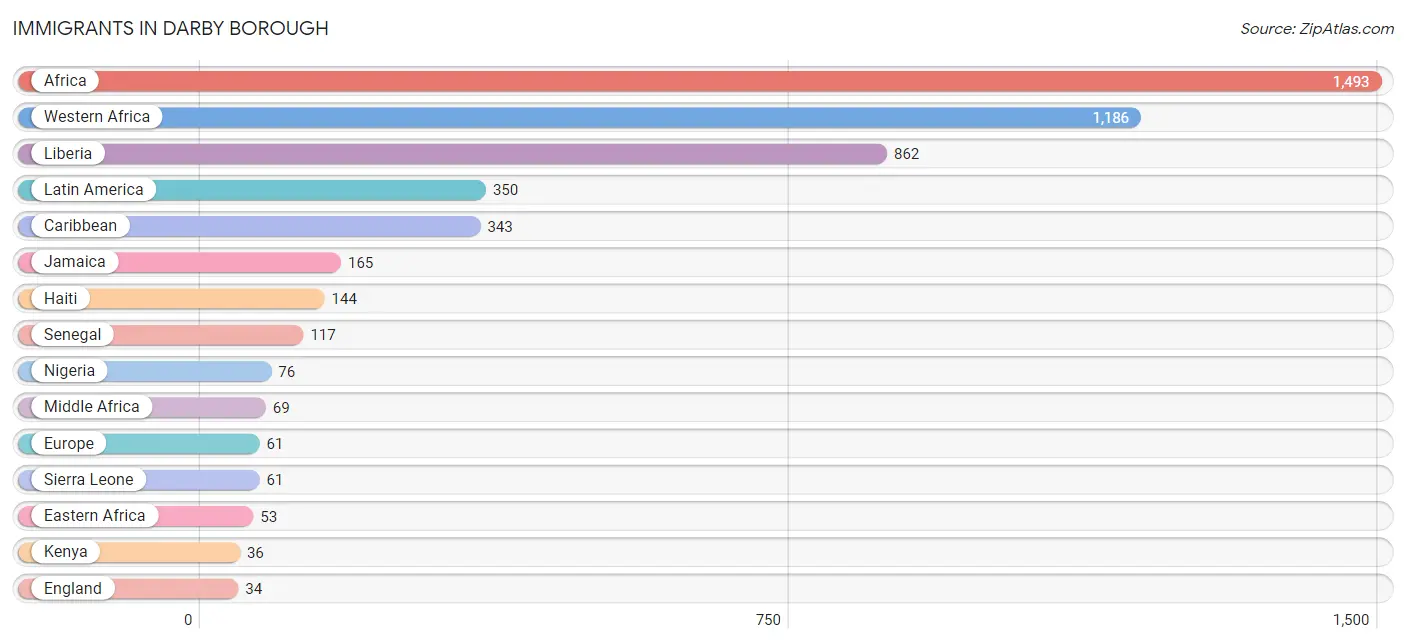
Immigrants in Darby borough
The most numerous immigrant groups reported in Darby borough came from Africa (1,493 | 14.0%), Western Africa (1,186 | 11.1%), Liberia (862 | 8.1%), Latin America (350 | 3.3%), and Caribbean (343 | 3.2%), together accounting for 39.6% of all Darby borough residents.
| Immigration Origin | # Population | % Population |
| Africa | 1,493 | 14.0% |
| Asia | 24 | 0.2% |
| Barbados | 22 | 0.2% |
| Caribbean | 343 | 3.2% |
| Central America | 7 | 0.1% |
| Dominican Republic | 7 | 0.1% |
| Eastern Africa | 53 | 0.5% |
| Eastern Asia | 9 | 0.1% |
| Egypt | 4 | 0.0% |
| England | 34 | 0.3% |
| Ethiopia | 9 | 0.1% |
| Europe | 61 | 0.6% |
| Guatemala | 7 | 0.1% |
| Haiti | 144 | 1.3% |
| Jamaica | 165 | 1.5% |
| Kenya | 36 | 0.3% |
| Korea | 9 | 0.1% |
| Laos | 15 | 0.1% |
| Latin America | 350 | 3.3% |
| Liberia | 862 | 8.1% |
| Middle Africa | 69 | 0.6% |
| Netherlands | 27 | 0.3% |
| Nigeria | 76 | 0.7% |
| Northern Africa | 4 | 0.0% |
| Northern Europe | 34 | 0.3% |
| Senegal | 117 | 1.1% |
| Sierra Leone | 61 | 0.6% |
| South Eastern Asia | 15 | 0.1% |
| Trinidad and Tobago | 5 | 0.1% |
| Uganda | 2 | 0.0% |
| Western Africa | 1,186 | 11.1% |
| Western Europe | 27 | 0.3% | View All 32 Rows |
Sex and Age in Darby borough
Sex and Age in Darby borough
The most populous age groups in Darby borough are 5 to 9 Years (737 | 15.5%) for men and 10 to 14 Years (677 | 11.4%) for women.
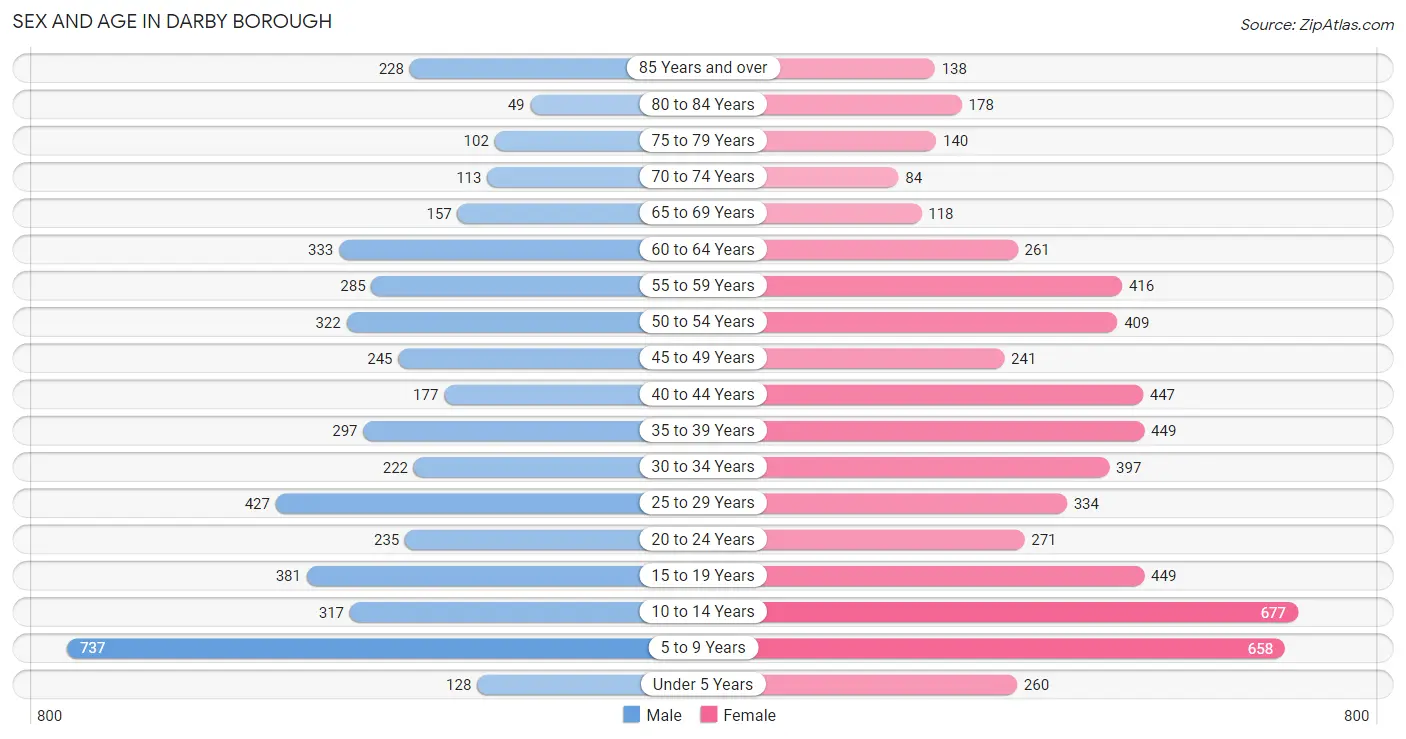
| Age Bracket | Male | Female |
| Under 5 Years | 128 (2.7%) | 260 (4.4%) |
| 5 to 9 Years | 737 (15.5%) | 658 (11.1%) |
| 10 to 14 Years | 317 (6.7%) | 677 (11.4%) |
| 15 to 19 Years | 381 (8.0%) | 449 (7.6%) |
| 20 to 24 Years | 235 (4.9%) | 271 (4.6%) |
| 25 to 29 Years | 427 (9.0%) | 334 (5.6%) |
| 30 to 34 Years | 222 (4.7%) | 397 (6.7%) |
| 35 to 39 Years | 297 (6.2%) | 449 (7.6%) |
| 40 to 44 Years | 177 (3.7%) | 447 (7.5%) |
| 45 to 49 Years | 245 (5.1%) | 241 (4.1%) |
| 50 to 54 Years | 322 (6.8%) | 409 (6.9%) |
| 55 to 59 Years | 285 (6.0%) | 416 (7.0%) |
| 60 to 64 Years | 333 (7.0%) | 261 (4.4%) |
| 65 to 69 Years | 157 (3.3%) | 118 (2.0%) |
| 70 to 74 Years | 113 (2.4%) | 84 (1.4%) |
| 75 to 79 Years | 102 (2.1%) | 140 (2.4%) |
| 80 to 84 Years | 49 (1.0%) | 178 (3.0%) |
| 85 Years and over | 228 (4.8%) | 138 (2.3%) |
| Total | 4,755 (100.0%) | 5,927 (100.0%) |
Families and Households in Darby borough
Median Family Size in Darby borough
The median family size in Darby borough is 3.91 persons per family, with single female/mother families (1,315 | 62.2%) accounting for the largest median family size of 4.36 persons per family. On the other hand, single male/father families (209 | 9.9%) represent the smallest median family size with 3.15 persons per family.
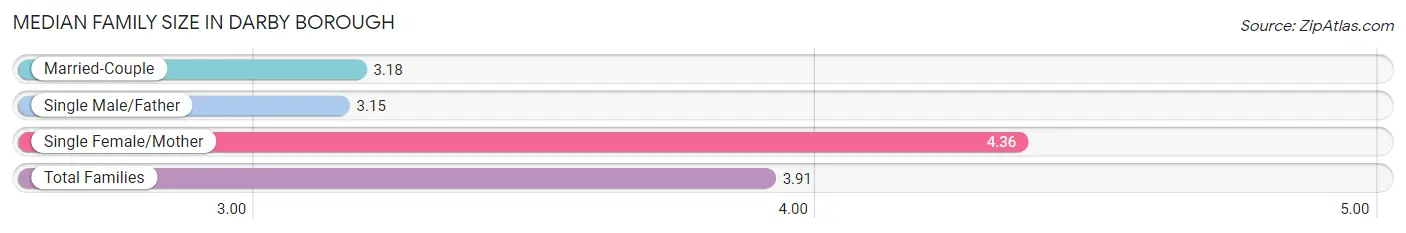
| Family Type | # Families | Family Size |
| Married-Couple | 591 (27.9%) | 3.18 |
| Single Male/Father | 209 (9.9%) | 3.15 |
| Single Female/Mother | 1,315 (62.2%) | 4.36 |
| Total Families | 2,115 (100.0%) | 3.91 |
Median Household Size in Darby borough
The median household size in Darby borough is 2.87 persons per household, with single female/mother households (1,315 | 36.9%) accounting for the largest median household size of 4.53 persons per household. non-family households (1,448 | 40.6%) represent the smallest median household size with 1.15 persons per household.
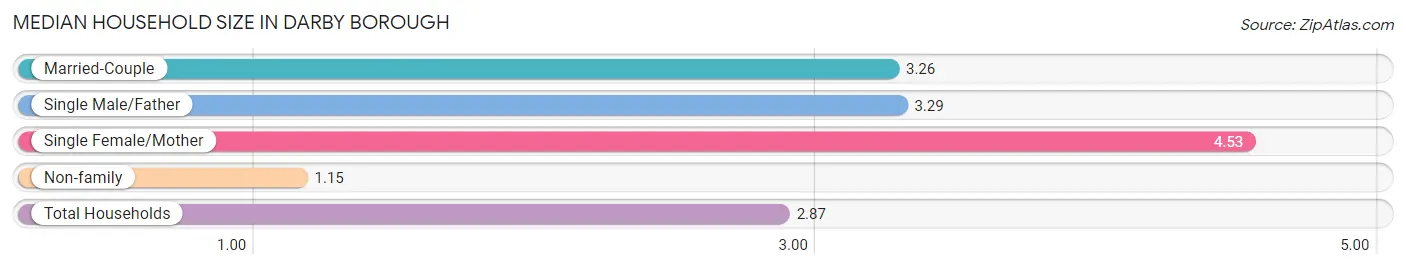
| Household Type | # Households | Household Size |
| Married-Couple | 591 (16.6%) | 3.26 |
| Single Male/Father | 209 (5.9%) | 3.29 |
| Single Female/Mother | 1,315 (36.9%) | 4.53 |
| Non-family | 1,448 (40.6%) | 1.15 |
| Total Households | 3,563 (100.0%) | 2.87 |
Household Size by Marriage Status in Darby borough
Out of a total of 3,563 households in Darby borough, 2,115 (59.4%) are family households, while 1,448 (40.6%) are nonfamily households. The most numerous type of family households are 2-person households, comprising 806, and the most common type of nonfamily households are 1-person households, comprising 1,245.
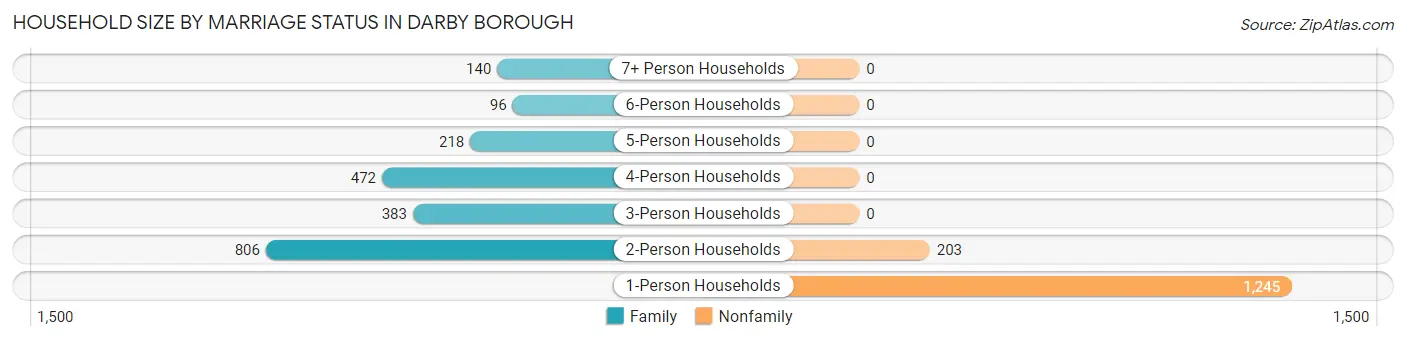
| Household Size | Family Households | Nonfamily Households |
| 1-Person Households | - | 1,245 (34.9%) |
| 2-Person Households | 806 (22.6%) | 203 (5.7%) |
| 3-Person Households | 383 (10.7%) | 0 (0.0%) |
| 4-Person Households | 472 (13.3%) | 0 (0.0%) |
| 5-Person Households | 218 (6.1%) | 0 (0.0%) |
| 6-Person Households | 96 (2.7%) | 0 (0.0%) |
| 7+ Person Households | 140 (3.9%) | 0 (0.0%) |
| Total | 2,115 (59.4%) | 1,448 (40.6%) |
Female Fertility in Darby borough
Fertility by Age in Darby borough
Average fertility rate in Darby borough is 41.0 births per 1,000 women. Women in the age bracket of 35 to 50 years have the highest fertility rate with 56.0 births per 1,000 women. Women in the age bracket of 35 to 50 years acount for 60.6% of all women with births.
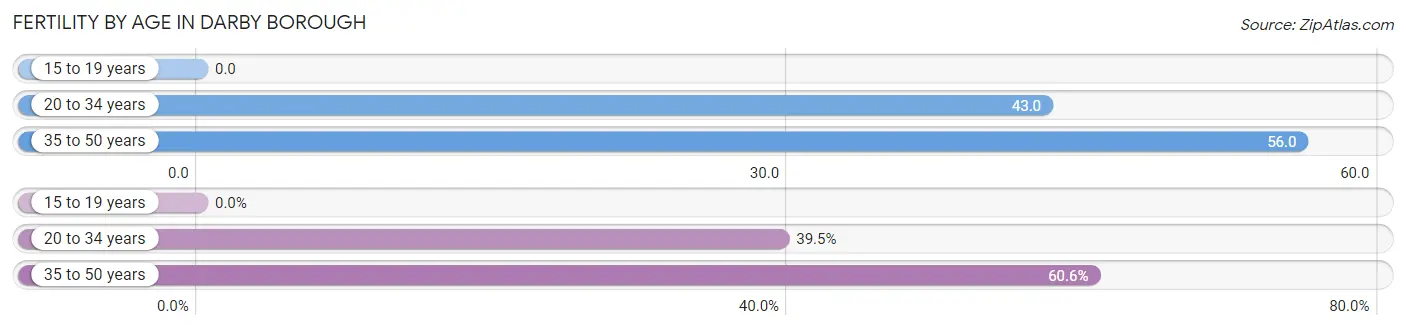
| Age Bracket | Women with Births | Births / 1,000 Women |
| 15 to 19 years | 0 (0.0%) | 0.0 |
| 20 to 34 years | 43 (39.5%) | 43.0 |
| 35 to 50 years | 66 (60.6%) | 56.0 |
| Total | 109 (100.0%) | 41.0 |
Fertility by Age by Marriage Status in Darby borough
43.1% of women with births (109) in Darby borough are married. The highest percentage of unmarried women with births falls into 35 to 50 years age bracket with 93.9% of them unmarried at the time of birth, while the lowest percentage of unmarried women with births belong to 20 to 34 years age bracket with 0.0% of them unmarried.
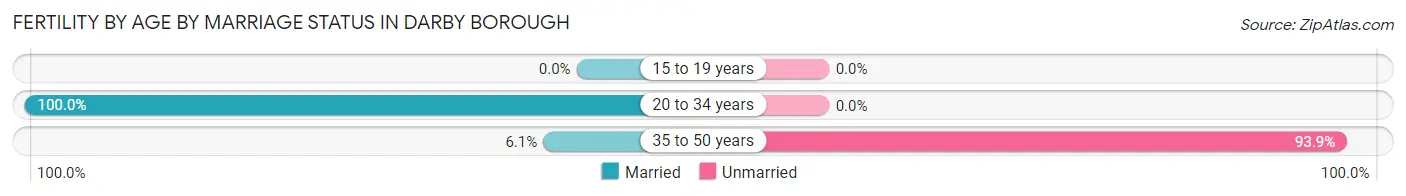
| Age Bracket | Married | Unmarried |
| 15 to 19 years | 0 (0.0%) | 0 (0.0%) |
| 20 to 34 years | 43 (100.0%) | 0 (0.0%) |
| 35 to 50 years | 4 (6.1%) | 62 (93.9%) |
| Total | 47 (43.1%) | 62 (56.9%) |
Fertility by Education in Darby borough
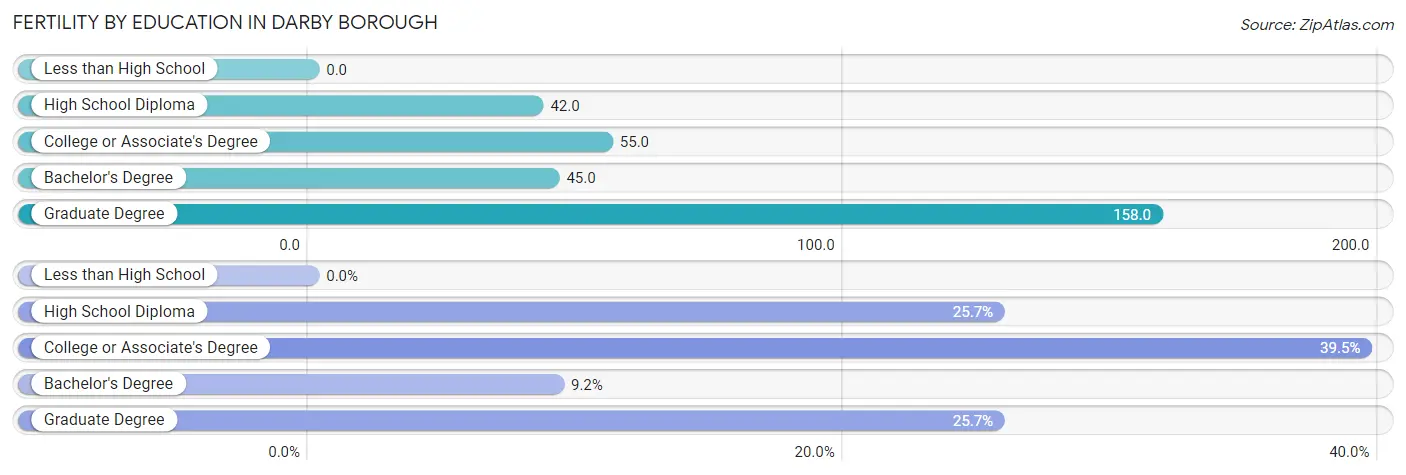
| Educational Attainment | Women with Births | Births / 1,000 Women |
| Less than High School | 0 (0.0%) | 0.0 |
| High School Diploma | 28 (25.7%) | 42.0 |
| College or Associate's Degree | 43 (39.5%) | 55.0 |
| Bachelor's Degree | 10 (9.2%) | 45.0 |
| Graduate Degree | 28 (25.7%) | 158.0 |
| Total | 109 (100.0%) | 41.0 |
Fertility by Education by Marriage Status in Darby borough
56.9% of women with births in Darby borough are unmarried. Women with the educational attainment of college or associate's degree are most likely to be married with 100.0% of them married at childbirth, while women with the educational attainment of bachelor's degree are least likely to be married with 100.0% of them unmarried at childbirth.
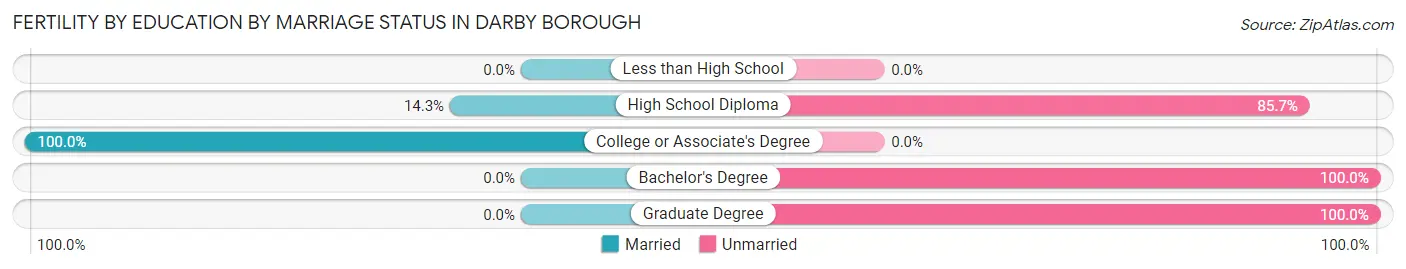
| Educational Attainment | Married | Unmarried |
| Less than High School | 0 (0.0%) | 0 (0.0%) |
| High School Diploma | 4 (14.3%) | 24 (85.7%) |
| College or Associate's Degree | 43 (100.0%) | 0 (0.0%) |
| Bachelor's Degree | 0 (0.0%) | 10 (100.0%) |
| Graduate Degree | 0 (0.0%) | 28 (100.0%) |
| Total | 47 (43.1%) | 62 (56.9%) |
Employment Characteristics in Darby borough
Employment by Class of Employer in Darby borough
Among the 3,792 employed individuals in Darby borough, private company employees (2,475 | 65.3%), not-for-profit organizations (582 | 15.3%), and local government employees (261 | 6.9%) make up the most common classes of employment.
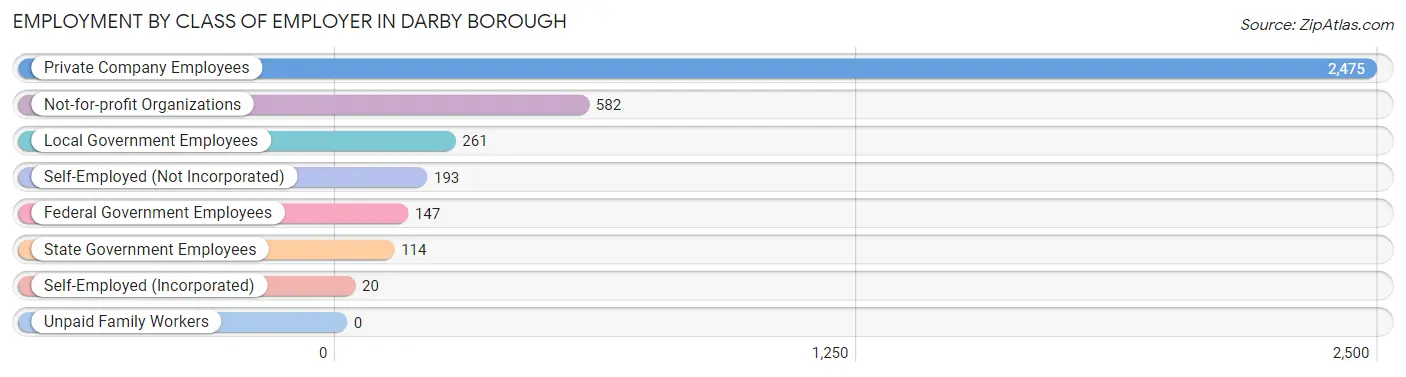
| Employer Class | # Employees | % Employees |
| Private Company Employees | 2,475 | 65.3% |
| Self-Employed (Incorporated) | 20 | 0.5% |
| Self-Employed (Not Incorporated) | 193 | 5.1% |
| Not-for-profit Organizations | 582 | 15.3% |
| Local Government Employees | 261 | 6.9% |
| State Government Employees | 114 | 3.0% |
| Federal Government Employees | 147 | 3.9% |
| Unpaid Family Workers | 0 | 0.0% |
| Total | 3,792 | 100.0% |
Employment Status by Age in Darby borough
According to the labor force statistics for Darby borough, out of the total population over 16 years of age (7,736), 58.7% or 4,541 individuals are in the labor force, with 13.9% or 631 of them unemployed. The age group with the highest labor force participation rate is 25 to 29 years, with 82.8% or 630 individuals in the labor force. Within the labor force, the 16 to 19 years age range has the highest percentage of unemployed individuals, with 46.8% or 104 of them being unemployed.
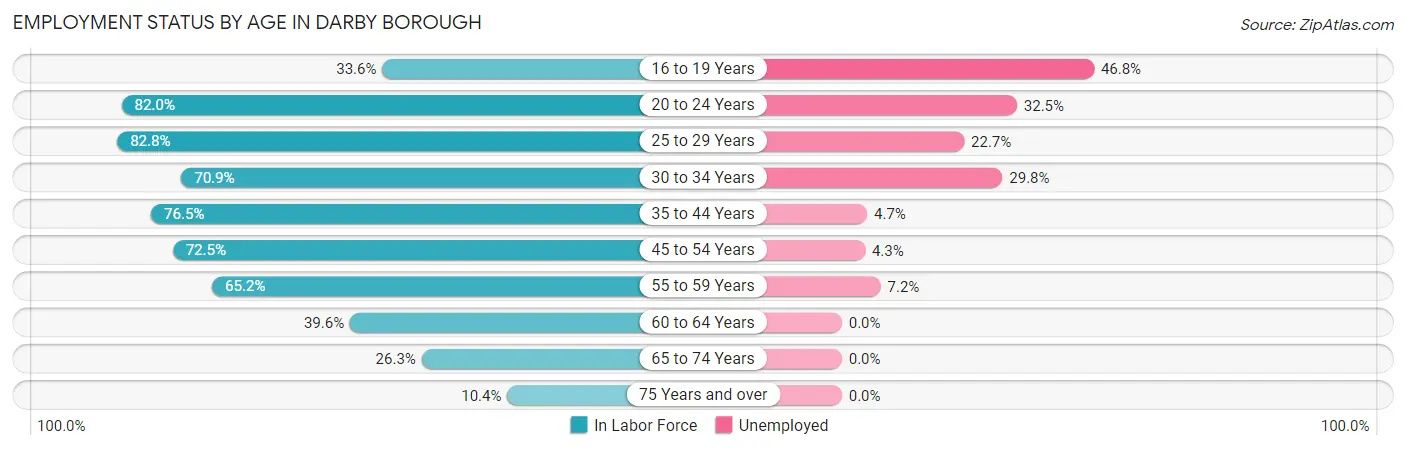
| Age Bracket | In Labor Force | Unemployed |
| 16 to 19 Years | 222 (33.6%) | 104 (46.8%) |
| 20 to 24 Years | 415 (82.0%) | 135 (32.5%) |
| 25 to 29 Years | 630 (82.8%) | 143 (22.7%) |
| 30 to 34 Years | 439 (70.9%) | 131 (29.8%) |
| 35 to 44 Years | 1,048 (76.5%) | 49 (4.7%) |
| 45 to 54 Years | 882 (72.5%) | 38 (4.3%) |
| 55 to 59 Years | 457 (65.2%) | 33 (7.2%) |
| 60 to 64 Years | 235 (39.6%) | 0 (0.0%) |
| 65 to 74 Years | 124 (26.3%) | 0 (0.0%) |
| 75 Years and over | 87 (10.4%) | 0 (0.0%) |
| Total | 4,541 (58.7%) | 631 (13.9%) |
Employment Status by Educational Attainment in Darby borough
According to labor force statistics for Darby borough, 70.1% of individuals (3,689) out of the total population between 25 and 64 years of age (5,262) are in the labor force, with 10.7% or 395 of them being unemployed. The group with the highest labor force participation rate are those with the educational attainment of bachelor's degree or higher, with 82.3% or 744 individuals in the labor force. Within the labor force, individuals with high school diploma education have the highest percentage of unemployment, with 17.0% or 218 of them being unemployed.
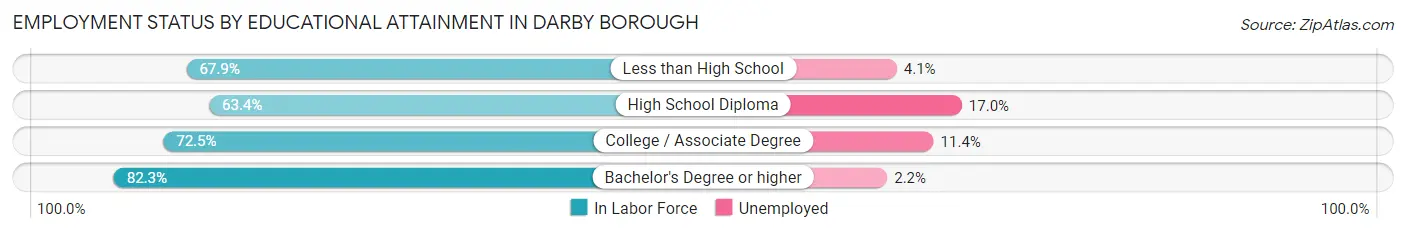
| Educational Attainment | In Labor Force | Unemployed |
| Less than High School | 415 (67.9%) | 25 (4.1%) |
| High School Diploma | 1,281 (63.4%) | 343 (17.0%) |
| College / Associate Degree | 1,252 (72.5%) | 197 (11.4%) |
| Bachelor's Degree or higher | 744 (82.3%) | 20 (2.2%) |
| Total | 3,689 (70.1%) | 563 (10.7%) |
Employment Occupations by Sex in Darby borough
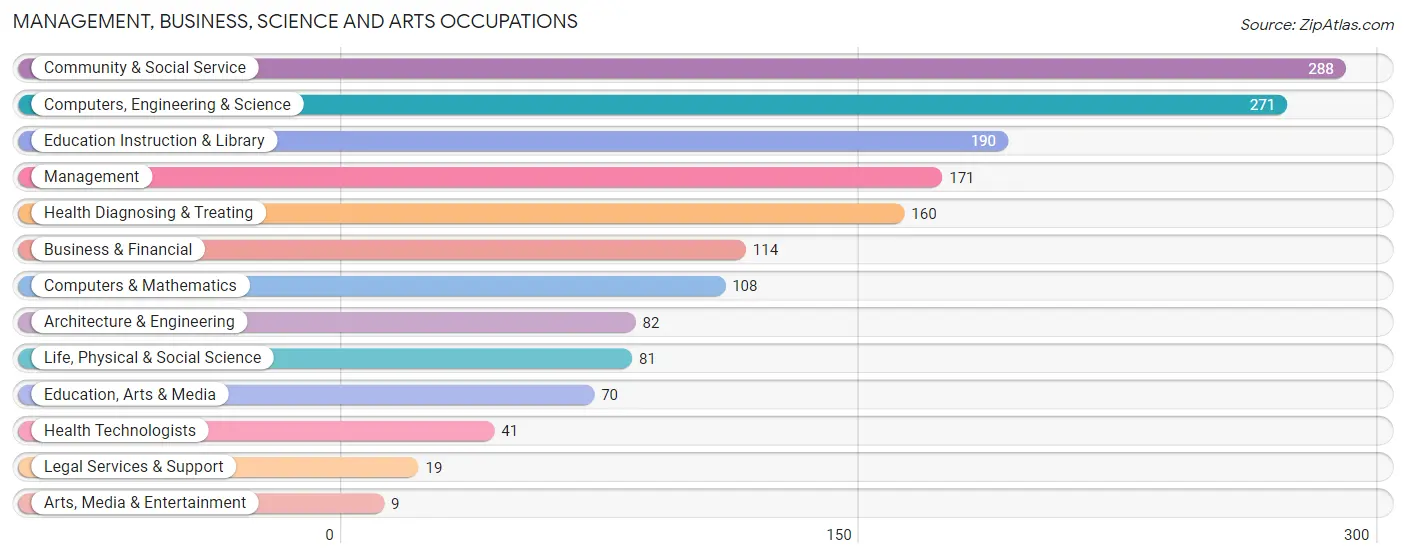
Management, Business, Science and Arts Occupations
The most common Management, Business, Science and Arts occupations in Darby borough are Community & Social Service (288 | 7.4%), Computers, Engineering & Science (271 | 6.9%), Education Instruction & Library (190 | 4.9%), Management (171 | 4.4%), and Health Diagnosing & Treating (160 | 4.1%).
Management, Business, Science and Arts Occupations by Sex
Within the Management, Business, Science and Arts occupations in Darby borough, the most male-oriented occupations are Life, Physical & Social Science (100.0%), Arts, Media & Entertainment (100.0%), and Computers & Mathematics (73.2%), while the most female-oriented occupations are Legal Services & Support (100.0%), Health Diagnosing & Treating (100.0%), and Health Technologists (100.0%).
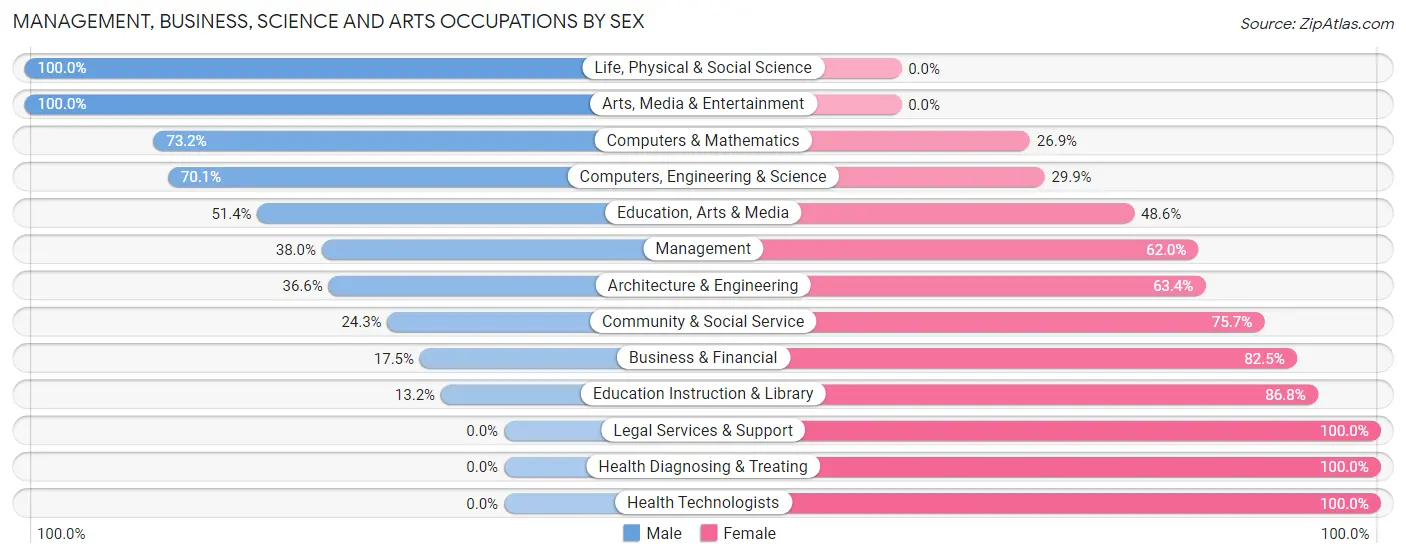
| Occupation | Male | Female |
| Management | 65 (38.0%) | 106 (62.0%) |
| Business & Financial | 20 (17.5%) | 94 (82.5%) |
| Computers, Engineering & Science | 190 (70.1%) | 81 (29.9%) |
| Computers & Mathematics | 79 (73.2%) | 29 (26.9%) |
| Architecture & Engineering | 30 (36.6%) | 52 (63.4%) |
| Life, Physical & Social Science | 81 (100.0%) | 0 (0.0%) |
| Community & Social Service | 70 (24.3%) | 218 (75.7%) |
| Education, Arts & Media | 36 (51.4%) | 34 (48.6%) |
| Legal Services & Support | 0 (0.0%) | 19 (100.0%) |
| Education Instruction & Library | 25 (13.2%) | 165 (86.8%) |
| Arts, Media & Entertainment | 9 (100.0%) | 0 (0.0%) |
| Health Diagnosing & Treating | 0 (0.0%) | 160 (100.0%) |
| Health Technologists | 0 (0.0%) | 41 (100.0%) |
| Total (Category) | 345 (34.4%) | 659 (65.6%) |
| Total (Overall) | 1,831 (46.9%) | 2,075 (53.1%) |
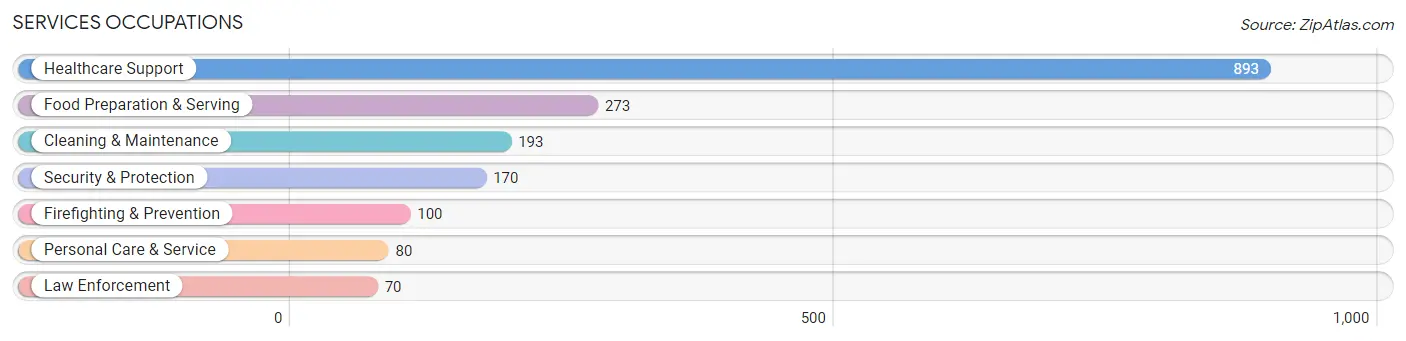
Services Occupations
The most common Services occupations in Darby borough are Healthcare Support (893 | 22.9%), Food Preparation & Serving (273 | 7.0%), Cleaning & Maintenance (193 | 4.9%), Security & Protection (170 | 4.3%), and Firefighting & Prevention (100 | 2.6%).
Services Occupations by Sex
Within the Services occupations in Darby borough, the most male-oriented occupations are Law Enforcement (85.7%), Personal Care & Service (85.0%), and Food Preparation & Serving (62.3%), while the most female-oriented occupations are Healthcare Support (77.0%), Firefighting & Prevention (66.0%), and Security & Protection (44.7%).
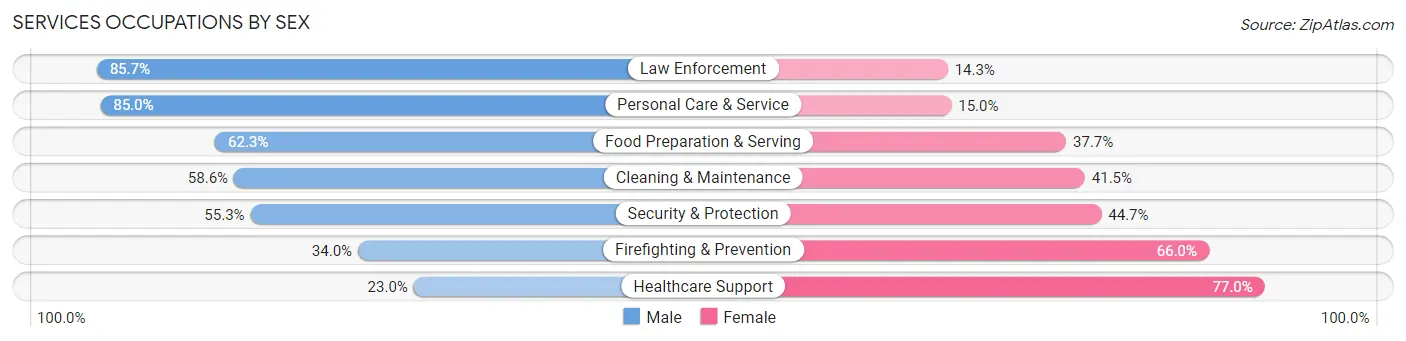
| Occupation | Male | Female |
| Healthcare Support | 205 (23.0%) | 688 (77.0%) |
| Security & Protection | 94 (55.3%) | 76 (44.7%) |
| Firefighting & Prevention | 34 (34.0%) | 66 (66.0%) |
| Law Enforcement | 60 (85.7%) | 10 (14.3%) |
| Food Preparation & Serving | 170 (62.3%) | 103 (37.7%) |
| Cleaning & Maintenance | 113 (58.6%) | 80 (41.4%) |
| Personal Care & Service | 68 (85.0%) | 12 (15.0%) |
| Total (Category) | 650 (40.4%) | 959 (59.6%) |
| Total (Overall) | 1,831 (46.9%) | 2,075 (53.1%) |
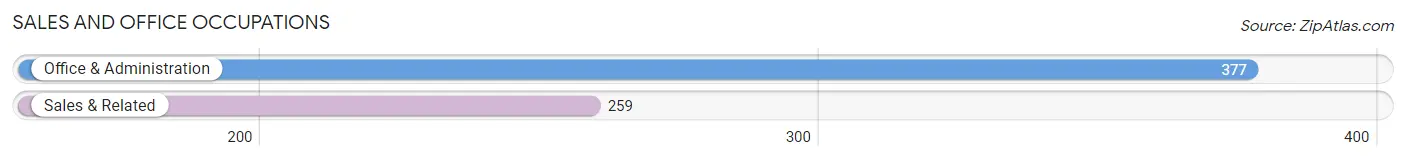
Sales and Office Occupations
The most common Sales and Office occupations in Darby borough are Office & Administration (377 | 9.7%), and Sales & Related (259 | 6.6%).
Sales and Office Occupations by Sex
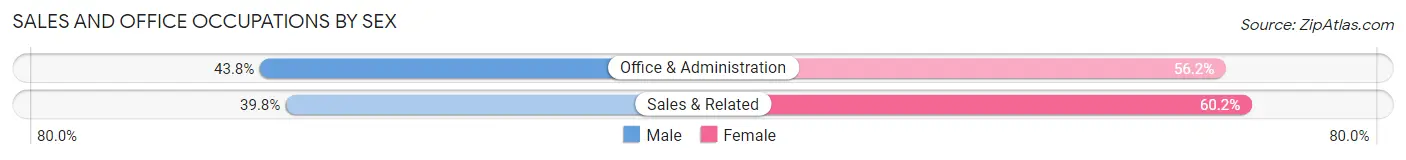
| Occupation | Male | Female |
| Sales & Related | 103 (39.8%) | 156 (60.2%) |
| Office & Administration | 165 (43.8%) | 212 (56.2%) |
| Total (Category) | 268 (42.1%) | 368 (57.9%) |
| Total (Overall) | 1,831 (46.9%) | 2,075 (53.1%) |
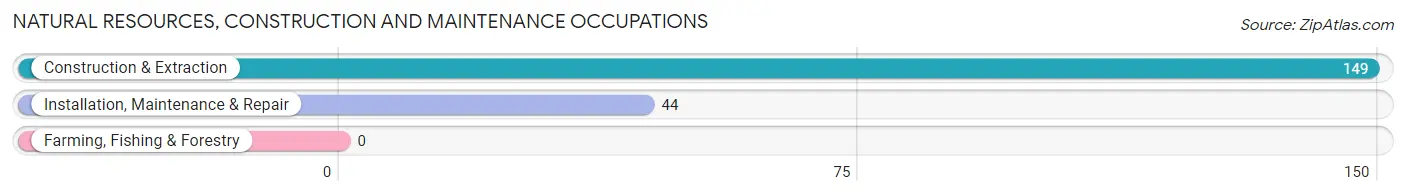
Natural Resources, Construction and Maintenance Occupations
The most common Natural Resources, Construction and Maintenance occupations in Darby borough are Construction & Extraction (149 | 3.8%), and Installation, Maintenance & Repair (44 | 1.1%).
Natural Resources, Construction and Maintenance Occupations by Sex
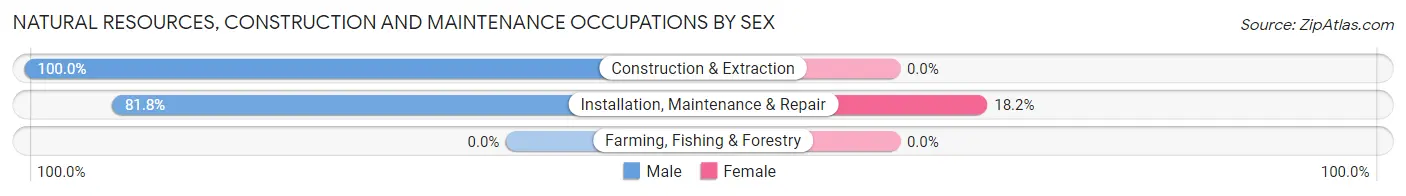
| Occupation | Male | Female |
| Farming, Fishing & Forestry | 0 (0.0%) | 0 (0.0%) |
| Construction & Extraction | 149 (100.0%) | 0 (0.0%) |
| Installation, Maintenance & Repair | 36 (81.8%) | 8 (18.2%) |
| Total (Category) | 185 (95.9%) | 8 (4.2%) |
| Total (Overall) | 1,831 (46.9%) | 2,075 (53.1%) |
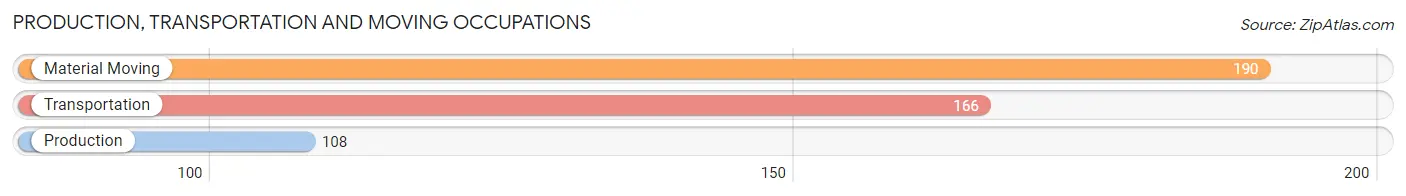
Production, Transportation and Moving Occupations
The most common Production, Transportation and Moving occupations in Darby borough are Material Moving (190 | 4.9%), Transportation (166 | 4.3%), and Production (108 | 2.8%).
Production, Transportation and Moving Occupations by Sex
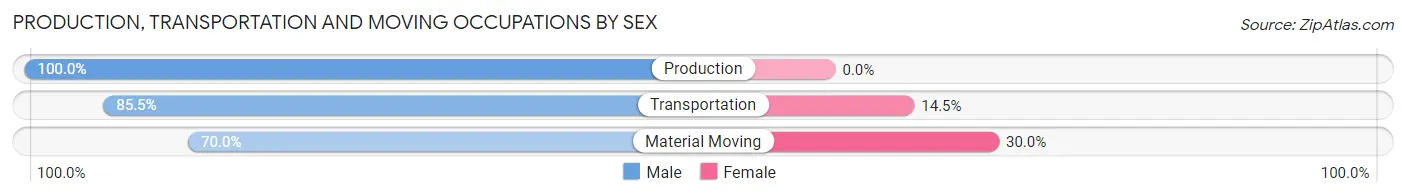
| Occupation | Male | Female |
| Production | 108 (100.0%) | 0 (0.0%) |
| Transportation | 142 (85.5%) | 24 (14.5%) |
| Material Moving | 133 (70.0%) | 57 (30.0%) |
| Total (Category) | 383 (82.5%) | 81 (17.5%) |
| Total (Overall) | 1,831 (46.9%) | 2,075 (53.1%) |
Employment Industries by Sex in Darby borough
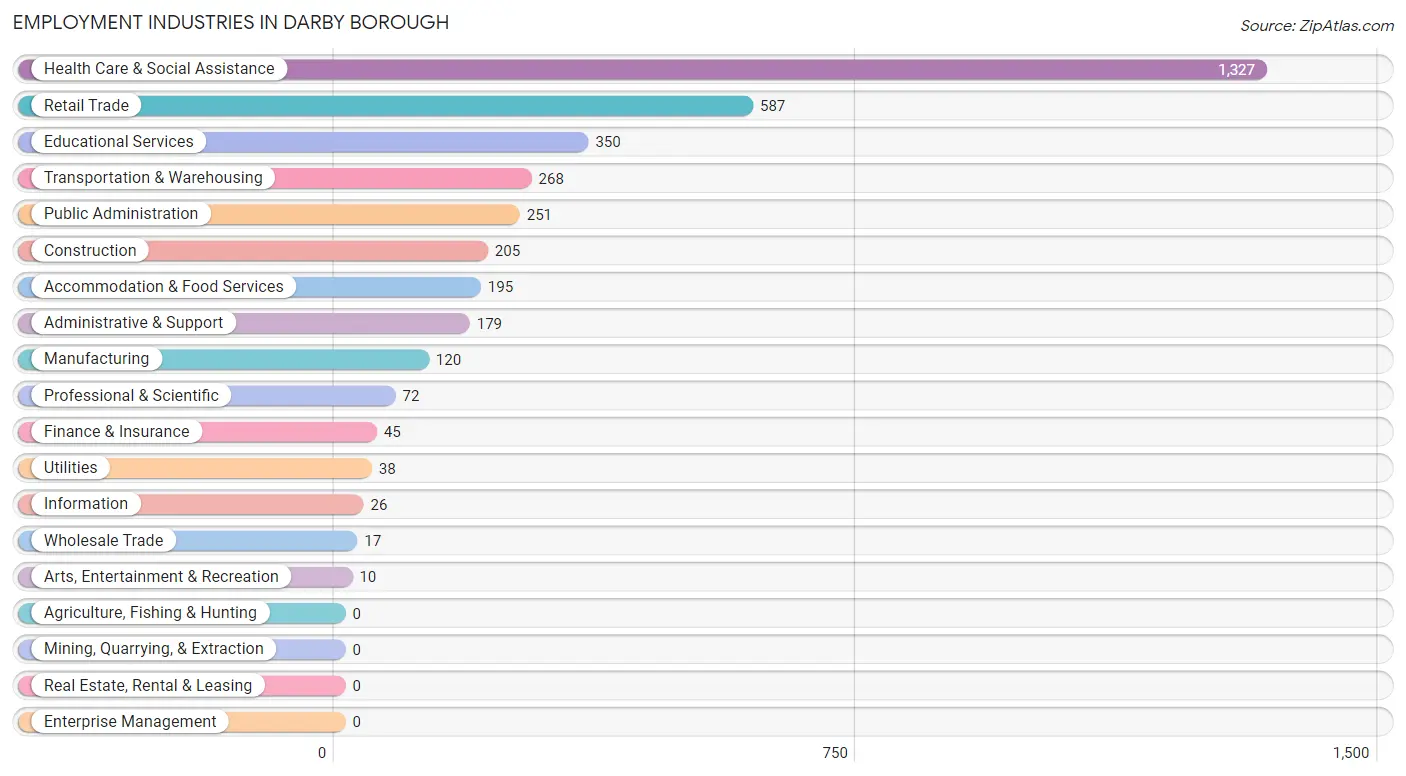
Employment Industries in Darby borough
The major employment industries in Darby borough include Health Care & Social Assistance (1,327 | 34.0%), Retail Trade (587 | 15.0%), Educational Services (350 | 9.0%), Transportation & Warehousing (268 | 6.9%), and Public Administration (251 | 6.4%).
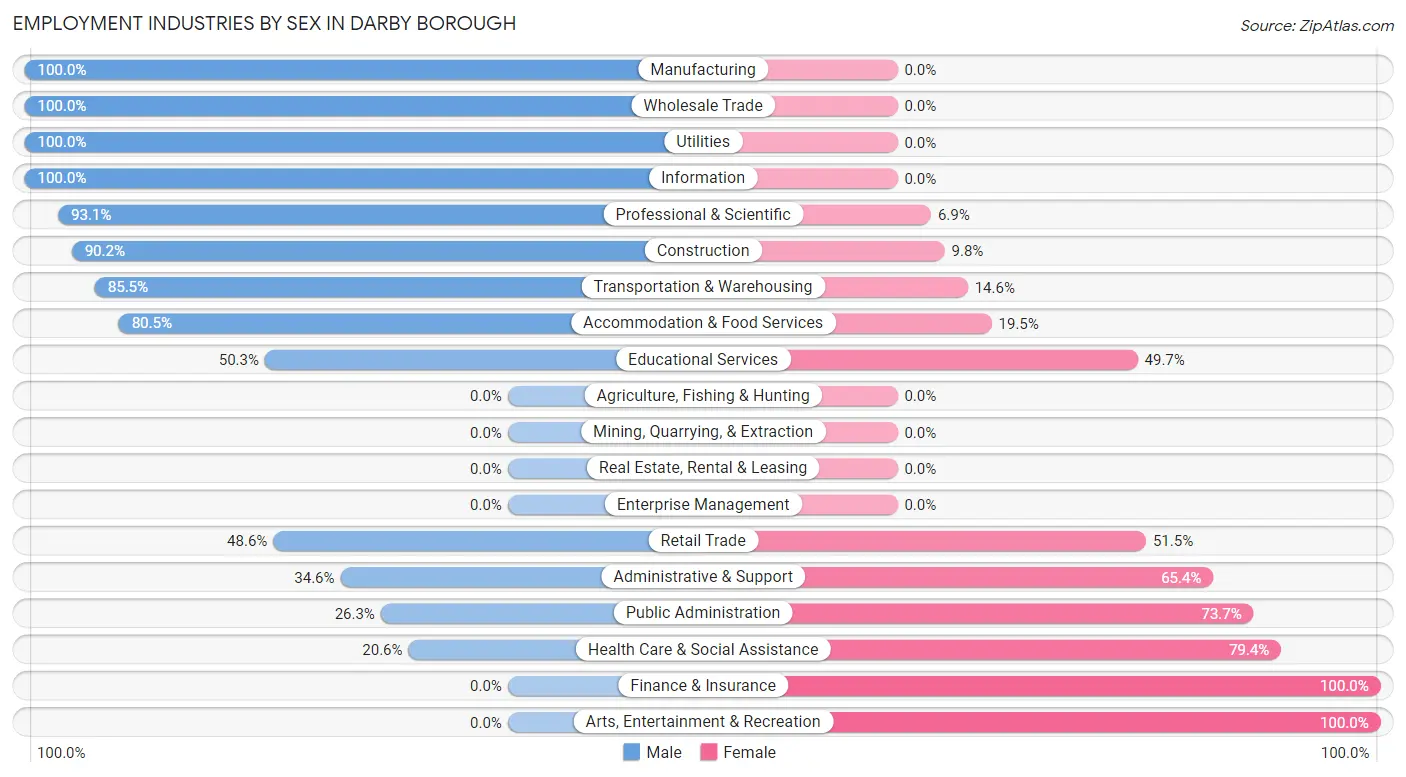
Employment Industries by Sex in Darby borough
The Darby borough industries that see more men than women are Manufacturing (100.0%), Wholesale Trade (100.0%), and Utilities (100.0%), whereas the industries that tend to have a higher number of women are Finance & Insurance (100.0%), Arts, Entertainment & Recreation (100.0%), and Health Care & Social Assistance (79.4%).
| Industry | Male | Female |
| Agriculture, Fishing & Hunting | 0 (0.0%) | 0 (0.0%) |
| Mining, Quarrying, & Extraction | 0 (0.0%) | 0 (0.0%) |
| Construction | 185 (90.2%) | 20 (9.8%) |
| Manufacturing | 120 (100.0%) | 0 (0.0%) |
| Wholesale Trade | 17 (100.0%) | 0 (0.0%) |
| Retail Trade | 285 (48.5%) | 302 (51.4%) |
| Transportation & Warehousing | 229 (85.5%) | 39 (14.5%) |
| Utilities | 38 (100.0%) | 0 (0.0%) |
| Information | 26 (100.0%) | 0 (0.0%) |
| Finance & Insurance | 0 (0.0%) | 45 (100.0%) |
| Real Estate, Rental & Leasing | 0 (0.0%) | 0 (0.0%) |
| Professional & Scientific | 67 (93.1%) | 5 (6.9%) |
| Enterprise Management | 0 (0.0%) | 0 (0.0%) |
| Administrative & Support | 62 (34.6%) | 117 (65.4%) |
| Educational Services | 176 (50.3%) | 174 (49.7%) |
| Health Care & Social Assistance | 273 (20.6%) | 1,054 (79.4%) |
| Arts, Entertainment & Recreation | 0 (0.0%) | 10 (100.0%) |
| Accommodation & Food Services | 157 (80.5%) | 38 (19.5%) |
| Public Administration | 66 (26.3%) | 185 (73.7%) |
| Total | 1,831 (46.9%) | 2,075 (53.1%) |
Education in Darby borough
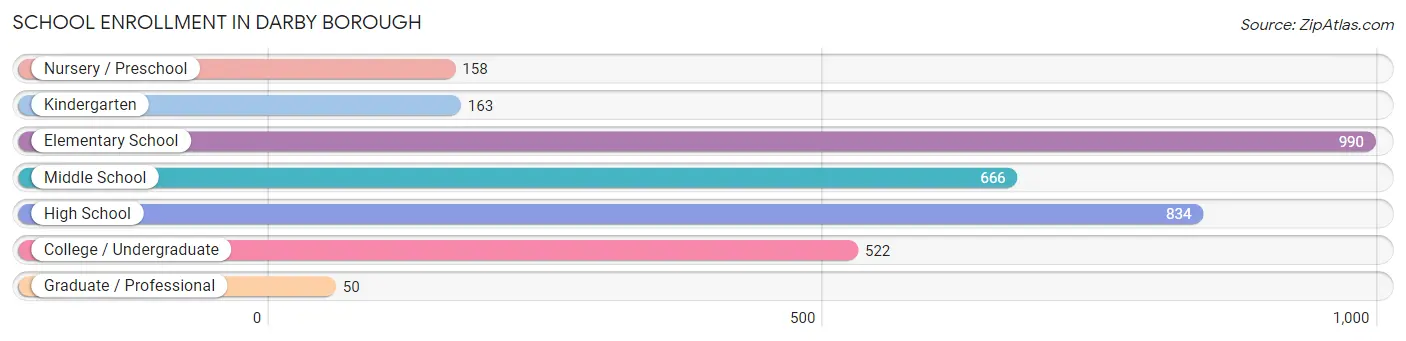
School Enrollment in Darby borough
The most common levels of schooling among the 3,383 students in Darby borough are elementary school (990 | 29.3%), high school (834 | 24.6%), and middle school (666 | 19.7%).
| School Level | # Students | % Students |
| Nursery / Preschool | 158 | 4.7% |
| Kindergarten | 163 | 4.8% |
| Elementary School | 990 | 29.3% |
| Middle School | 666 | 19.7% |
| High School | 834 | 24.6% |
| College / Undergraduate | 522 | 15.4% |
| Graduate / Professional | 50 | 1.5% |
| Total | 3,383 | 100.0% |
School Enrollment by Age by Funding Source in Darby borough
Out of a total of 3,383 students who are enrolled in schools in Darby borough, 447 (13.2%) attend a private institution, while the remaining 2,936 (86.8%) are enrolled in public schools. The age group of 35 years and over has the highest likelihood of being enrolled in private schools, with 91 (49.2% in the age bracket) enrolled. Conversely, the age group of 3 to 4 year olds has the lowest likelihood of being enrolled in a private school, with 97 (100.0% in the age bracket) attending a public institution.
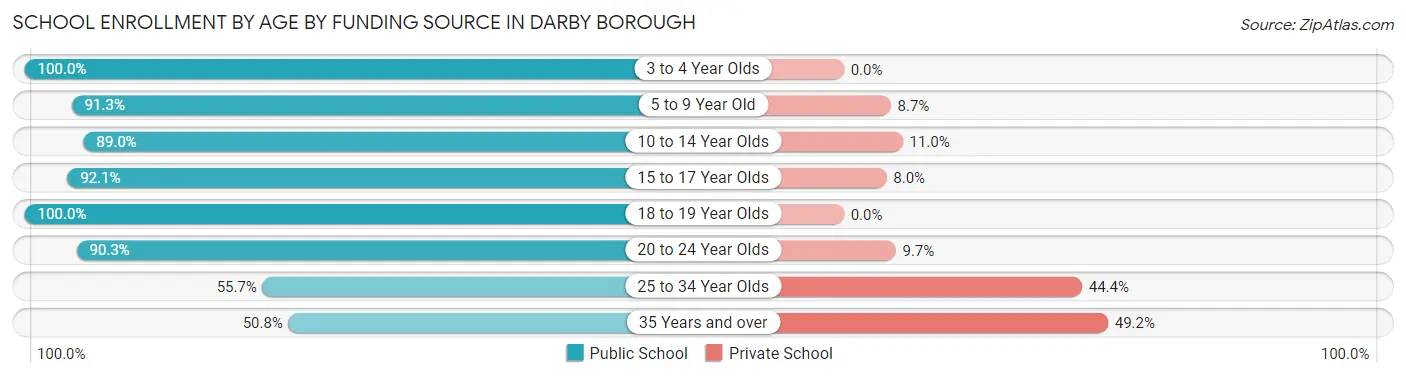
| Age Bracket | Public School | Private School |
| 3 to 4 Year Olds | 97 (100.0%) | 0 (0.0%) |
| 5 to 9 Year Old | 950 (91.3%) | 91 (8.7%) |
| 10 to 14 Year Olds | 869 (89.0%) | 107 (11.0%) |
| 15 to 17 Year Olds | 463 (92.0%) | 40 (8.0%) |
| 18 to 19 Year Olds | 206 (100.0%) | 0 (0.0%) |
| 20 to 24 Year Olds | 131 (90.3%) | 14 (9.7%) |
| 25 to 34 Year Olds | 128 (55.6%) | 102 (44.4%) |
| 35 Years and over | 94 (50.8%) | 91 (49.2%) |
| Total | 2,936 (86.8%) | 447 (13.2%) |
Educational Attainment by Field of Study in Darby borough
Business (198 | 16.2%), visual & performing arts (161 | 13.2%), bio, nature & agricultural (156 | 12.8%), science & technology (151 | 12.4%), and social sciences (104 | 8.5%) are the most common fields of study among 1,219 individuals in Darby borough who have obtained a bachelor's degree or higher.
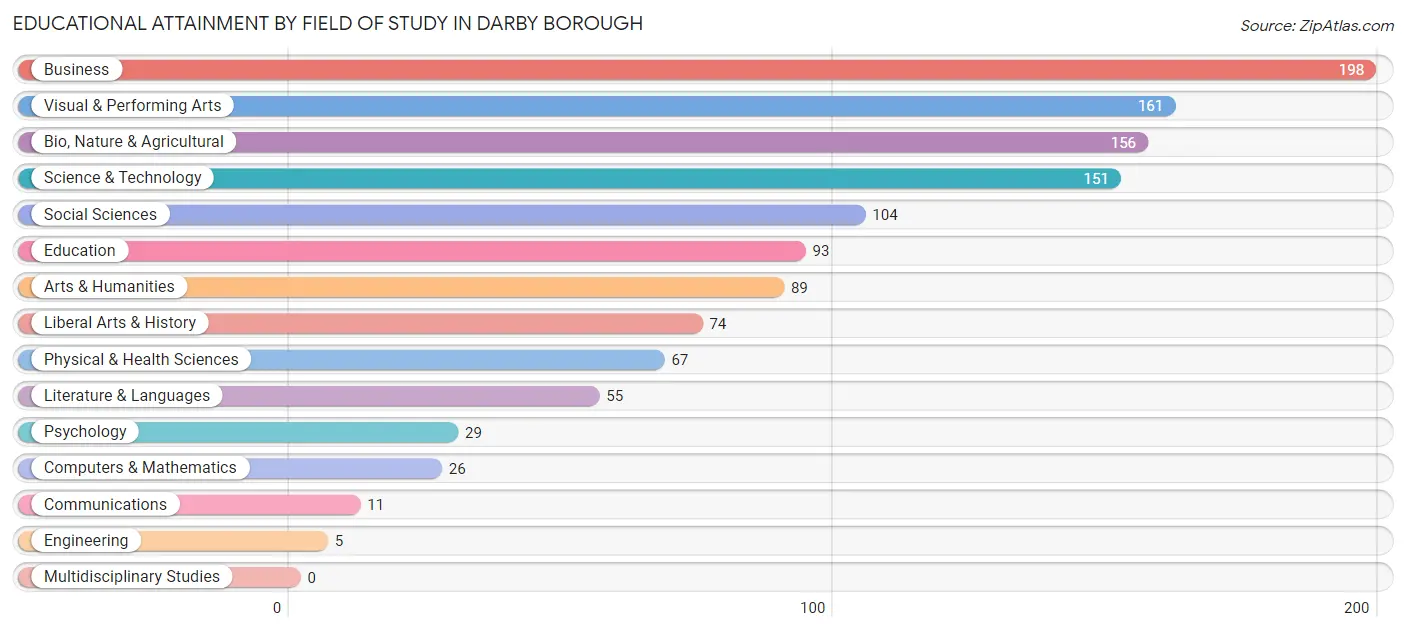
| Field of Study | # Graduates | % Graduates |
| Computers & Mathematics | 26 | 2.1% |
| Bio, Nature & Agricultural | 156 | 12.8% |
| Physical & Health Sciences | 67 | 5.5% |
| Psychology | 29 | 2.4% |
| Social Sciences | 104 | 8.5% |
| Engineering | 5 | 0.4% |
| Multidisciplinary Studies | 0 | 0.0% |
| Science & Technology | 151 | 12.4% |
| Business | 198 | 16.2% |
| Education | 93 | 7.6% |
| Literature & Languages | 55 | 4.5% |
| Liberal Arts & History | 74 | 6.1% |
| Visual & Performing Arts | 161 | 13.2% |
| Communications | 11 | 0.9% |
| Arts & Humanities | 89 | 7.3% |
| Total | 1,219 | 100.0% |
Transportation & Commute in Darby borough
Vehicle Availability by Sex in Darby borough
The most prevalent vehicle ownership categories in Darby borough are males with 2 vehicles (599, accounting for 34.6%) and females with 2 vehicles (506, making up 30.0%).
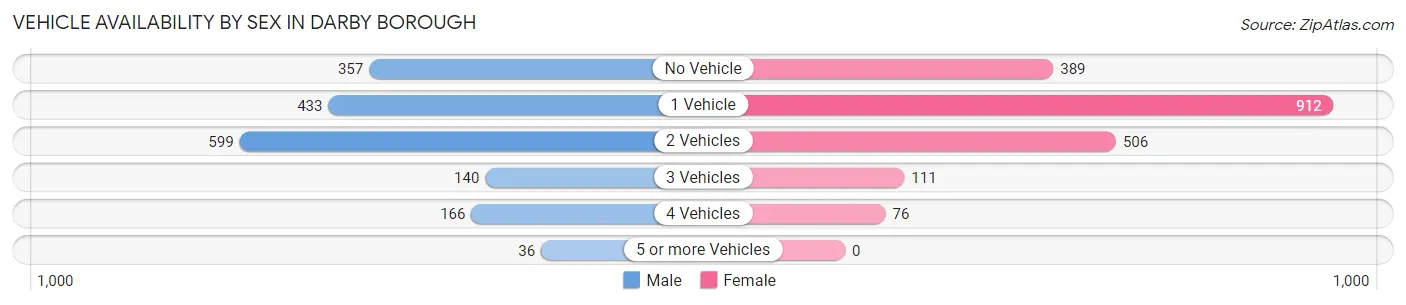
| Vehicles Available | Male | Female |
| No Vehicle | 357 (20.6%) | 389 (19.5%) |
| 1 Vehicle | 433 (25.0%) | 912 (45.7%) |
| 2 Vehicles | 599 (34.6%) | 506 (25.4%) |
| 3 Vehicles | 140 (8.1%) | 111 (5.6%) |
| 4 Vehicles | 166 (9.6%) | 76 (3.8%) |
| 5 or more Vehicles | 36 (2.1%) | 0 (0.0%) |
| Total | 1,731 (100.0%) | 1,994 (100.0%) |
Commute Time in Darby borough
The most frequently occuring commute durations in Darby borough are 30 to 34 minutes (730 commuters, 21.6%), 60 to 89 minutes (572 commuters, 17.0%), and 45 to 59 minutes (412 commuters, 12.2%).
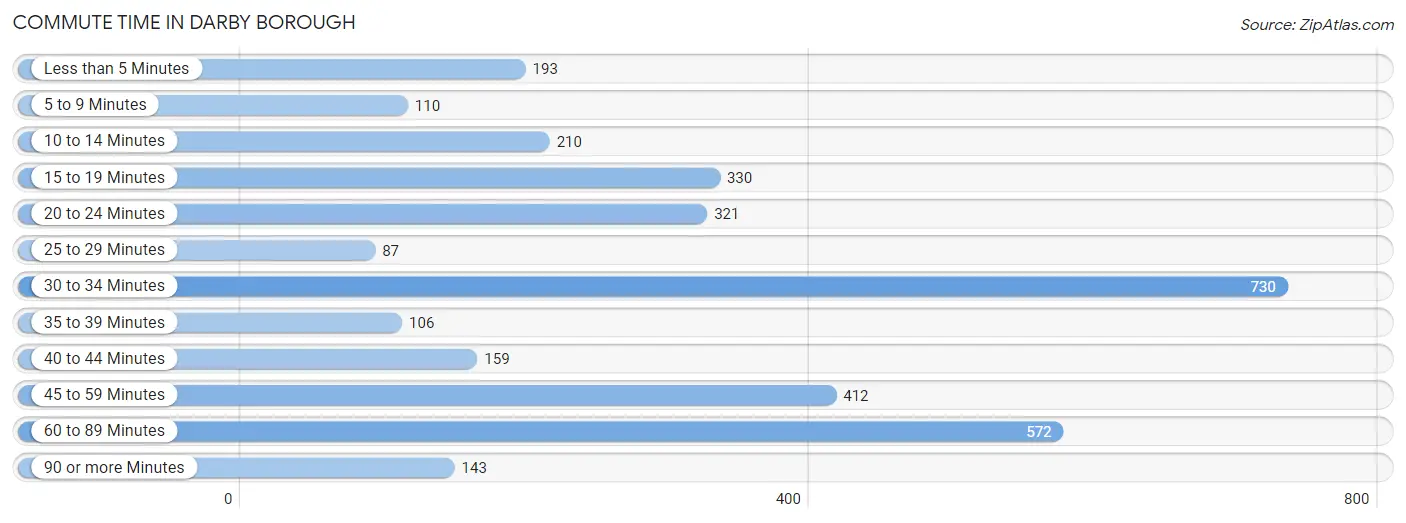
| Commute Time | # Commuters | % Commuters |
| Less than 5 Minutes | 193 | 5.7% |
| 5 to 9 Minutes | 110 | 3.3% |
| 10 to 14 Minutes | 210 | 6.2% |
| 15 to 19 Minutes | 330 | 9.8% |
| 20 to 24 Minutes | 321 | 9.5% |
| 25 to 29 Minutes | 87 | 2.6% |
| 30 to 34 Minutes | 730 | 21.6% |
| 35 to 39 Minutes | 106 | 3.1% |
| 40 to 44 Minutes | 159 | 4.7% |
| 45 to 59 Minutes | 412 | 12.2% |
| 60 to 89 Minutes | 572 | 17.0% |
| 90 or more Minutes | 143 | 4.2% |
Commute Time by Sex in Darby borough
The most common commute times in Darby borough are 15 to 19 minutes (263 commuters, 16.0%) for males and 30 to 34 minutes (486 commuters, 28.2%) for females.
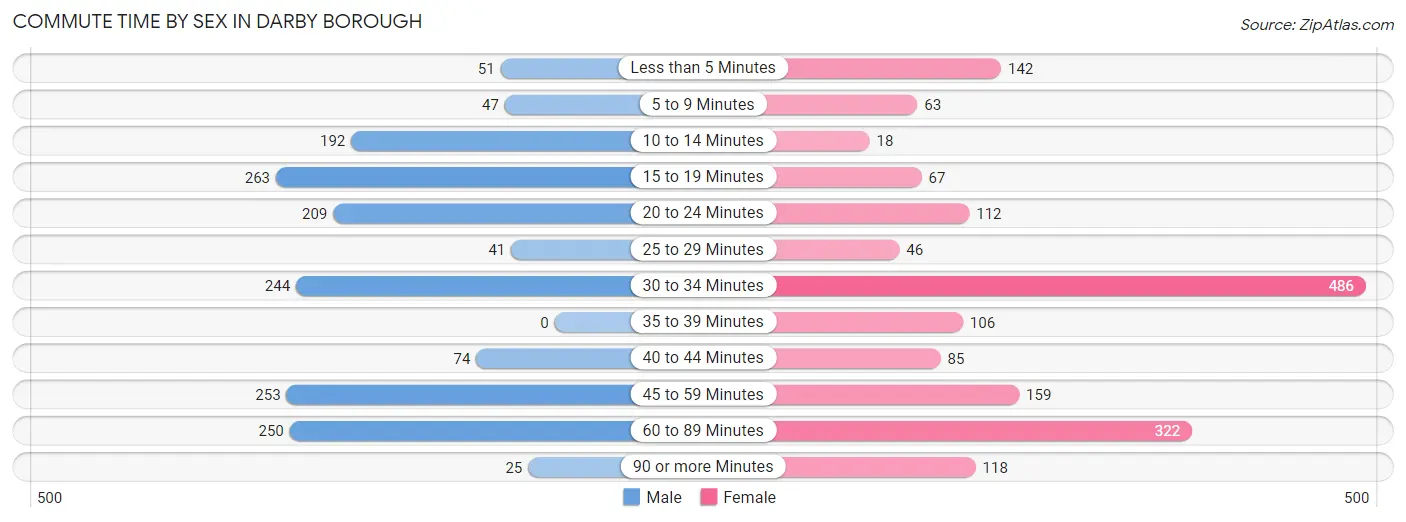
| Commute Time | Male | Female |
| Less than 5 Minutes | 51 (3.1%) | 142 (8.2%) |
| 5 to 9 Minutes | 47 (2.9%) | 63 (3.6%) |
| 10 to 14 Minutes | 192 (11.6%) | 18 (1.0%) |
| 15 to 19 Minutes | 263 (16.0%) | 67 (3.9%) |
| 20 to 24 Minutes | 209 (12.7%) | 112 (6.5%) |
| 25 to 29 Minutes | 41 (2.5%) | 46 (2.7%) |
| 30 to 34 Minutes | 244 (14.8%) | 486 (28.2%) |
| 35 to 39 Minutes | 0 (0.0%) | 106 (6.1%) |
| 40 to 44 Minutes | 74 (4.5%) | 85 (4.9%) |
| 45 to 59 Minutes | 253 (15.3%) | 159 (9.2%) |
| 60 to 89 Minutes | 250 (15.2%) | 322 (18.7%) |
| 90 or more Minutes | 25 (1.5%) | 118 (6.8%) |
Time of Departure to Work by Sex in Darby borough
The most frequent times of departure to work in Darby borough are 4:00 PM to 11:59 PM (273, 16.6%) for males and 12:00 PM to 3:59 PM (466, 27.0%) for females.
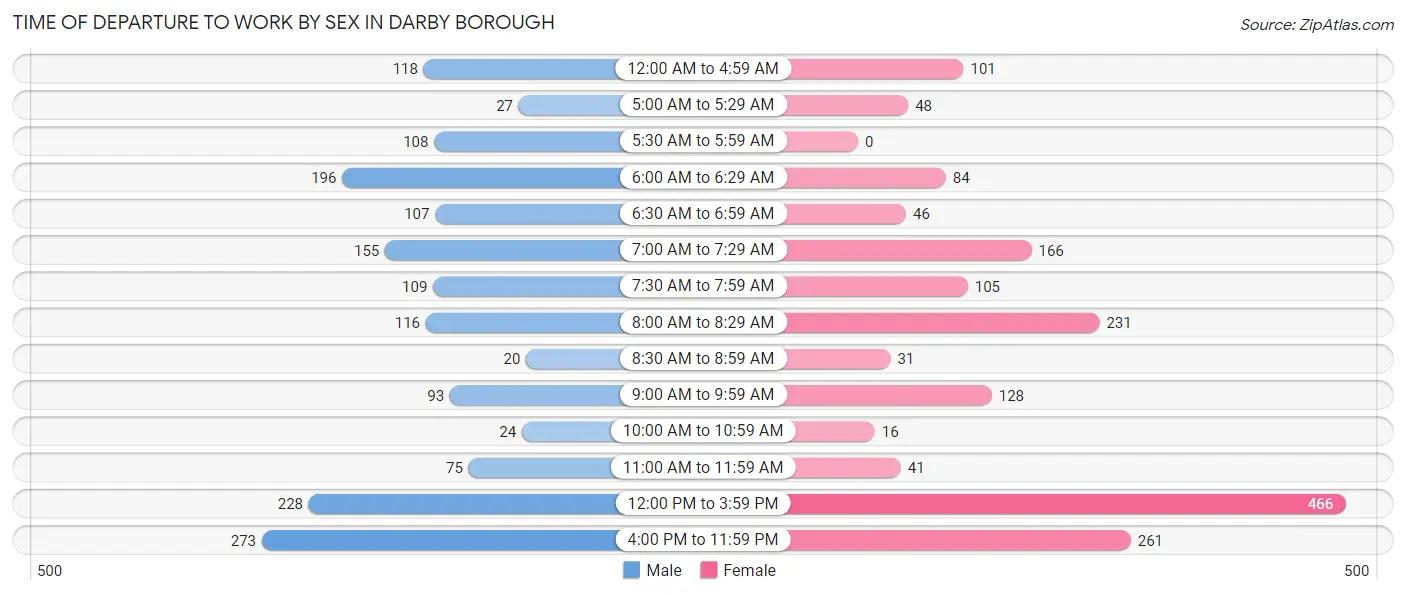
| Time of Departure | Male | Female |
| 12:00 AM to 4:59 AM | 118 (7.2%) | 101 (5.9%) |
| 5:00 AM to 5:29 AM | 27 (1.6%) | 48 (2.8%) |
| 5:30 AM to 5:59 AM | 108 (6.6%) | 0 (0.0%) |
| 6:00 AM to 6:29 AM | 196 (11.9%) | 84 (4.9%) |
| 6:30 AM to 6:59 AM | 107 (6.5%) | 46 (2.7%) |
| 7:00 AM to 7:29 AM | 155 (9.4%) | 166 (9.6%) |
| 7:30 AM to 7:59 AM | 109 (6.6%) | 105 (6.1%) |
| 8:00 AM to 8:29 AM | 116 (7.0%) | 231 (13.4%) |
| 8:30 AM to 8:59 AM | 20 (1.2%) | 31 (1.8%) |
| 9:00 AM to 9:59 AM | 93 (5.6%) | 128 (7.4%) |
| 10:00 AM to 10:59 AM | 24 (1.5%) | 16 (0.9%) |
| 11:00 AM to 11:59 AM | 75 (4.5%) | 41 (2.4%) |
| 12:00 PM to 3:59 PM | 228 (13.8%) | 466 (27.0%) |
| 4:00 PM to 11:59 PM | 273 (16.6%) | 261 (15.1%) |
| Total | 1,649 (100.0%) | 1,724 (100.0%) |
Housing Occupancy in Darby borough
Occupancy by Ownership in Darby borough
Of the total 3,563 dwellings in Darby borough, owner-occupied units account for 1,784 (50.1%), while renter-occupied units make up 1,779 (49.9%).
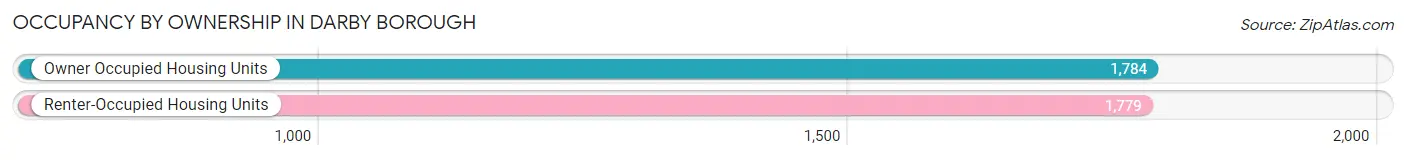
| Occupancy | # Housing Units | % Housing Units |
| Owner Occupied Housing Units | 1,784 | 50.1% |
| Renter-Occupied Housing Units | 1,779 | 49.9% |
| Total Occupied Housing Units | 3,563 | 100.0% |
Occupancy by Household Size in Darby borough
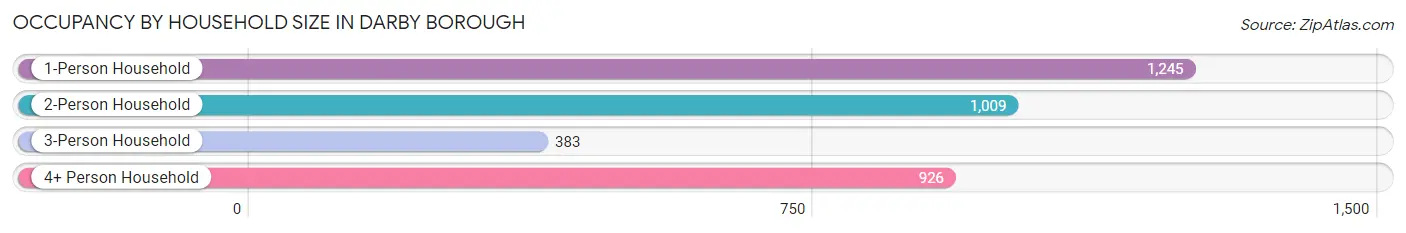
| Household Size | # Housing Units | % Housing Units |
| 1-Person Household | 1,245 | 34.9% |
| 2-Person Household | 1,009 | 28.3% |
| 3-Person Household | 383 | 10.7% |
| 4+ Person Household | 926 | 26.0% |
| Total Housing Units | 3,563 | 100.0% |
Occupancy by Ownership by Household Size in Darby borough
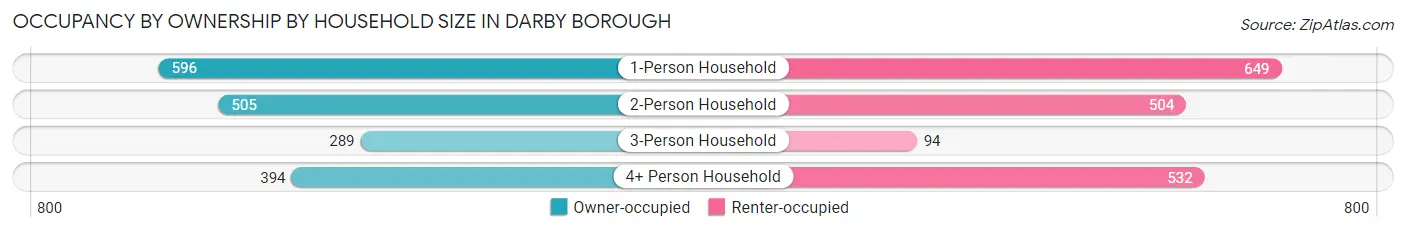
| Household Size | Owner-occupied | Renter-occupied |
| 1-Person Household | 596 (47.9%) | 649 (52.1%) |
| 2-Person Household | 505 (50.0%) | 504 (49.9%) |
| 3-Person Household | 289 (75.5%) | 94 (24.5%) |
| 4+ Person Household | 394 (42.5%) | 532 (57.5%) |
| Total Housing Units | 1,784 (50.1%) | 1,779 (49.9%) |
Occupancy by Educational Attainment in Darby borough
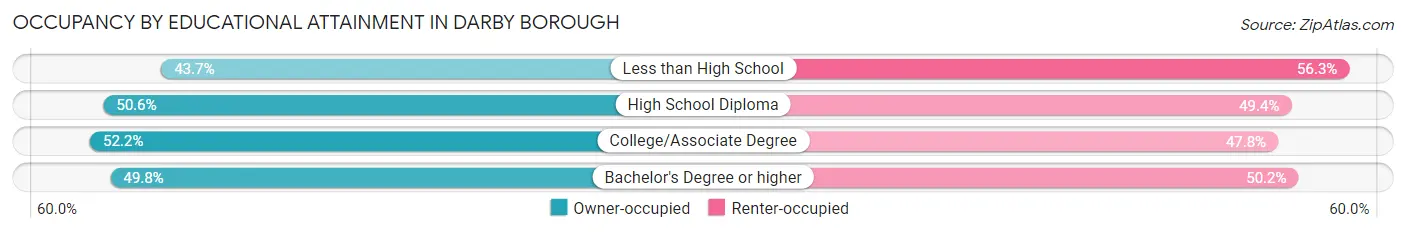
| Household Size | Owner-occupied | Renter-occupied |
| Less than High School | 213 (43.7%) | 274 (56.3%) |
| High School Diploma | 560 (50.6%) | 546 (49.4%) |
| College/Associate Degree | 650 (52.2%) | 595 (47.8%) |
| Bachelor's Degree or higher | 361 (49.8%) | 364 (50.2%) |
Occupancy by Age of Householder in Darby borough
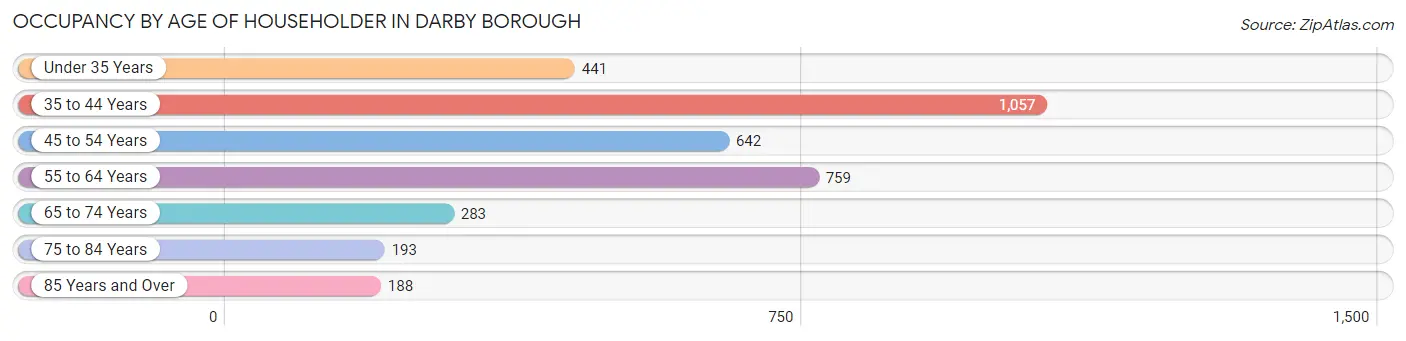
| Age Bracket | # Households | % Households |
| Under 35 Years | 441 | 12.4% |
| 35 to 44 Years | 1,057 | 29.7% |
| 45 to 54 Years | 642 | 18.0% |
| 55 to 64 Years | 759 | 21.3% |
| 65 to 74 Years | 283 | 7.9% |
| 75 to 84 Years | 193 | 5.4% |
| 85 Years and Over | 188 | 5.3% |
| Total | 3,563 | 100.0% |
Housing Finances in Darby borough
Median Income by Occupancy in Darby borough
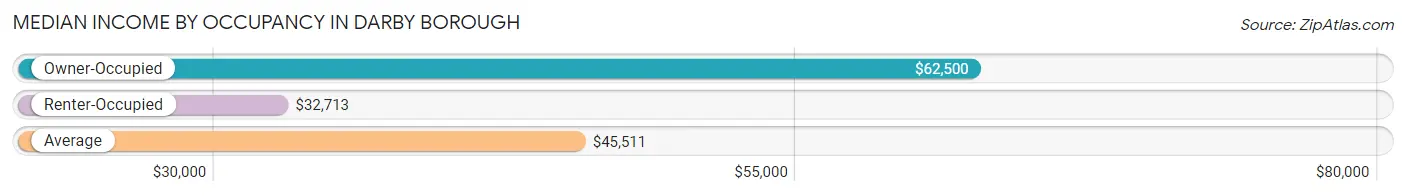
| Occupancy Type | # Households | Median Income |
| Owner-Occupied | 1,784 (50.1%) | $62,500 |
| Renter-Occupied | 1,779 (49.9%) | $32,713 |
| Average | 3,563 (100.0%) | $45,511 |
Occupancy by Householder Income Bracket in Darby borough
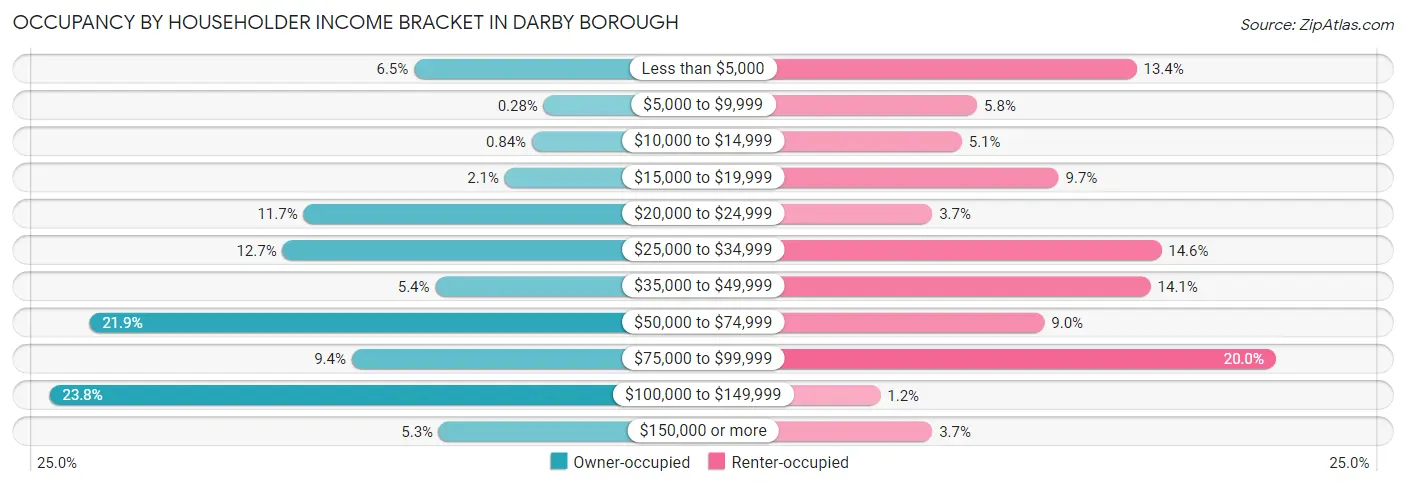
| Income Bracket | Owner-occupied | Renter-occupied |
| Less than $5,000 | 115 (6.5%) | 238 (13.4%) |
| $5,000 to $9,999 | 5 (0.3%) | 103 (5.8%) |
| $10,000 to $14,999 | 15 (0.8%) | 90 (5.1%) |
| $15,000 to $19,999 | 38 (2.1%) | 172 (9.7%) |
| $20,000 to $24,999 | 209 (11.7%) | 65 (3.6%) |
| $25,000 to $34,999 | 227 (12.7%) | 259 (14.6%) |
| $35,000 to $49,999 | 97 (5.4%) | 250 (14.1%) |
| $50,000 to $74,999 | 391 (21.9%) | 160 (9.0%) |
| $75,000 to $99,999 | 168 (9.4%) | 356 (20.0%) |
| $100,000 to $149,999 | 425 (23.8%) | 21 (1.2%) |
| $150,000 or more | 94 (5.3%) | 65 (3.6%) |
| Total | 1,784 (100.0%) | 1,779 (100.0%) |
Monthly Housing Cost Tiers in Darby borough
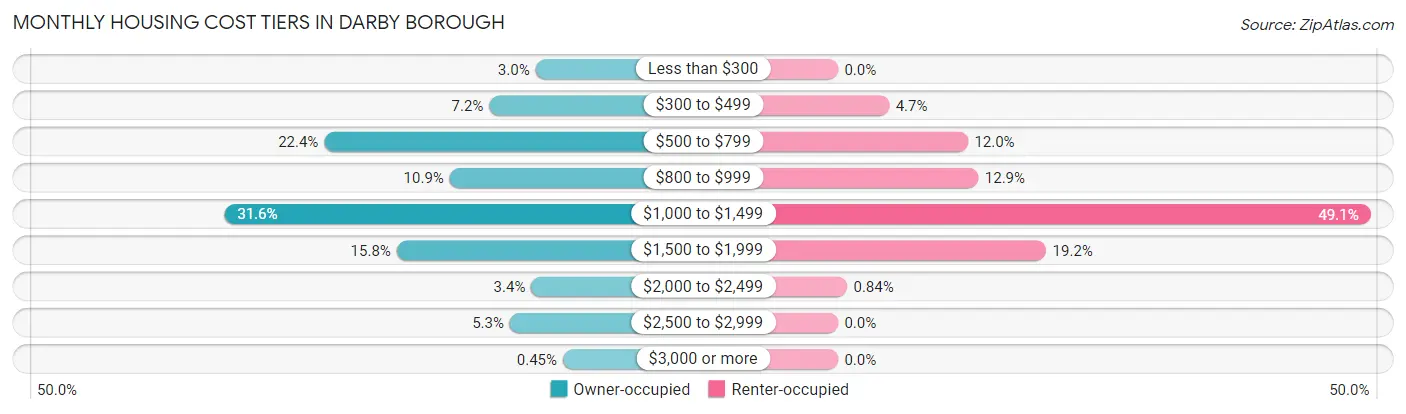
| Monthly Cost | Owner-occupied | Renter-occupied |
| Less than $300 | 53 (3.0%) | 0 (0.0%) |
| $300 to $499 | 129 (7.2%) | 84 (4.7%) |
| $500 to $799 | 400 (22.4%) | 213 (12.0%) |
| $800 to $999 | 194 (10.9%) | 230 (12.9%) |
| $1,000 to $1,499 | 564 (31.6%) | 873 (49.1%) |
| $1,500 to $1,999 | 281 (15.8%) | 341 (19.2%) |
| $2,000 to $2,499 | 60 (3.4%) | 15 (0.8%) |
| $2,500 to $2,999 | 95 (5.3%) | 0 (0.0%) |
| $3,000 or more | 8 (0.4%) | 0 (0.0%) |
| Total | 1,784 (100.0%) | 1,779 (100.0%) |
Physical Housing Characteristics in Darby borough
Housing Structures in Darby borough
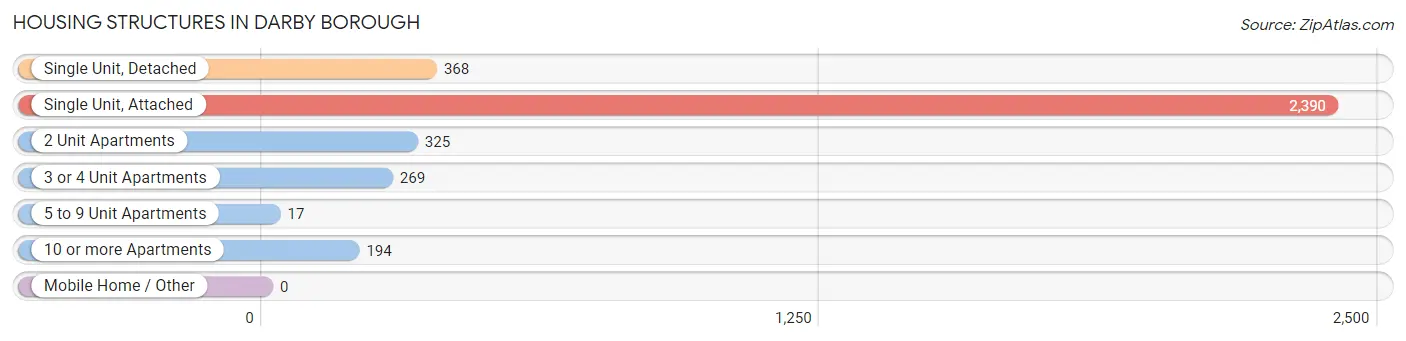
| Structure Type | # Housing Units | % Housing Units |
| Single Unit, Detached | 368 | 10.3% |
| Single Unit, Attached | 2,390 | 67.1% |
| 2 Unit Apartments | 325 | 9.1% |
| 3 or 4 Unit Apartments | 269 | 7.5% |
| 5 to 9 Unit Apartments | 17 | 0.5% |
| 10 or more Apartments | 194 | 5.4% |
| Mobile Home / Other | 0 | 0.0% |
| Total | 3,563 | 100.0% |
Housing Structures by Occupancy in Darby borough
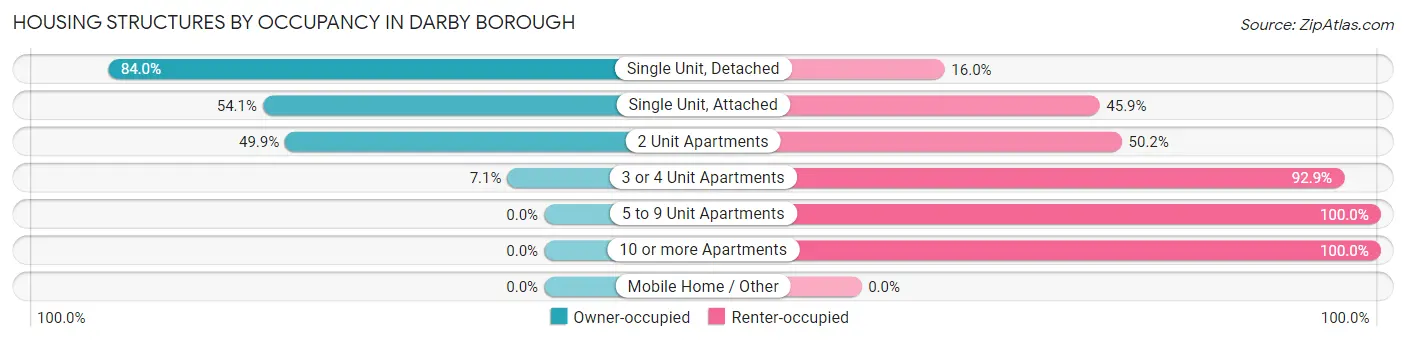
| Structure Type | Owner-occupied | Renter-occupied |
| Single Unit, Detached | 309 (84.0%) | 59 (16.0%) |
| Single Unit, Attached | 1,294 (54.1%) | 1,096 (45.9%) |
| 2 Unit Apartments | 162 (49.8%) | 163 (50.1%) |
| 3 or 4 Unit Apartments | 19 (7.1%) | 250 (92.9%) |
| 5 to 9 Unit Apartments | 0 (0.0%) | 17 (100.0%) |
| 10 or more Apartments | 0 (0.0%) | 194 (100.0%) |
| Mobile Home / Other | 0 (0.0%) | 0 (0.0%) |
| Total | 1,784 (50.1%) | 1,779 (49.9%) |
Housing Structures by Number of Rooms in Darby borough
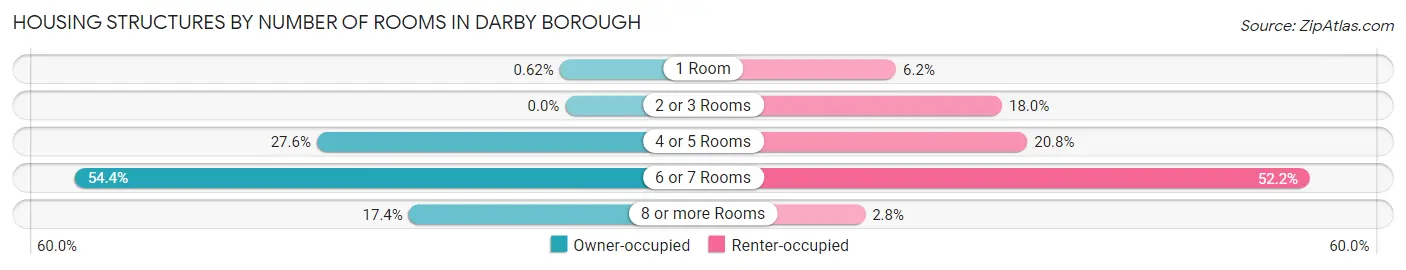
| Number of Rooms | Owner-occupied | Renter-occupied |
| 1 Room | 11 (0.6%) | 111 (6.2%) |
| 2 or 3 Rooms | 0 (0.0%) | 320 (18.0%) |
| 4 or 5 Rooms | 492 (27.6%) | 370 (20.8%) |
| 6 or 7 Rooms | 971 (54.4%) | 928 (52.2%) |
| 8 or more Rooms | 310 (17.4%) | 50 (2.8%) |
| Total | 1,784 (100.0%) | 1,779 (100.0%) |
Housing Structure by Heating Type in Darby borough
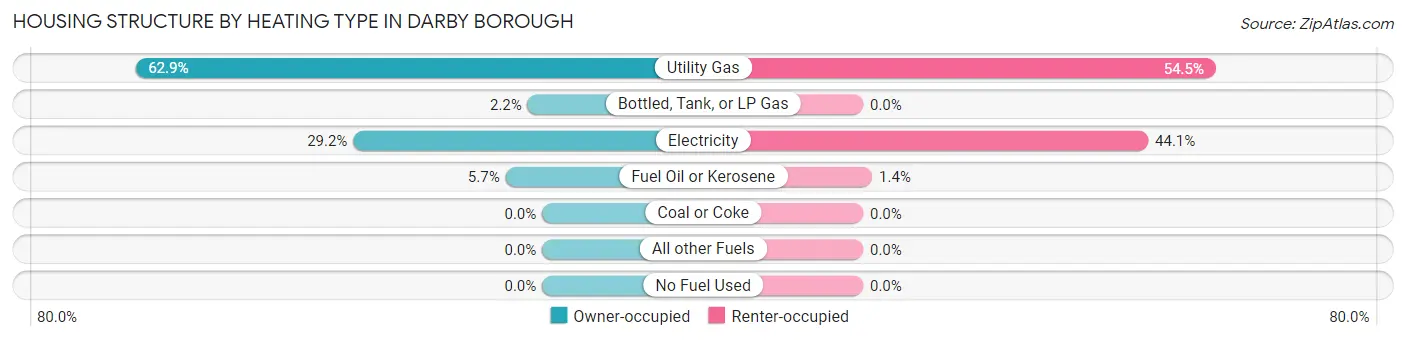
| Heating Type | Owner-occupied | Renter-occupied |
| Utility Gas | 1,122 (62.9%) | 970 (54.5%) |
| Bottled, Tank, or LP Gas | 40 (2.2%) | 0 (0.0%) |
| Electricity | 521 (29.2%) | 784 (44.1%) |
| Fuel Oil or Kerosene | 101 (5.7%) | 25 (1.4%) |
| Coal or Coke | 0 (0.0%) | 0 (0.0%) |
| All other Fuels | 0 (0.0%) | 0 (0.0%) |
| No Fuel Used | 0 (0.0%) | 0 (0.0%) |
| Total | 1,784 (100.0%) | 1,779 (100.0%) |
Household Vehicle Usage in Darby borough
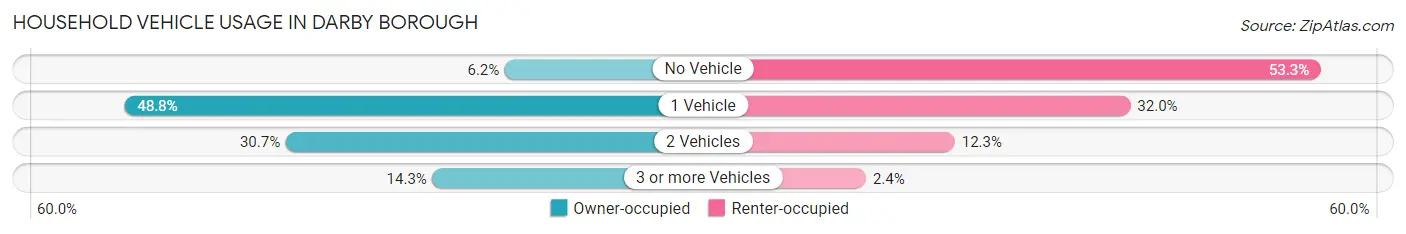
| Vehicles per Household | Owner-occupied | Renter-occupied |
| No Vehicle | 110 (6.2%) | 949 (53.3%) |
| 1 Vehicle | 871 (48.8%) | 569 (32.0%) |
| 2 Vehicles | 548 (30.7%) | 219 (12.3%) |
| 3 or more Vehicles | 255 (14.3%) | 42 (2.4%) |
| Total | 1,784 (100.0%) | 1,779 (100.0%) |
Real Estate & Mortgages in Darby borough
Real Estate and Mortgage Overview in Darby borough
| Characteristic | Without Mortgage | With Mortgage |
| Housing Units | 620 | 1,164 |
| Median Property Value | $85,100 | $116,100 |
| Median Household Income | $56,719 | $94 |
| Monthly Housing Costs | $629 | $8 |
| Real Estate Taxes | $3,287 | $117 |
Property Value by Mortgage Status in Darby borough
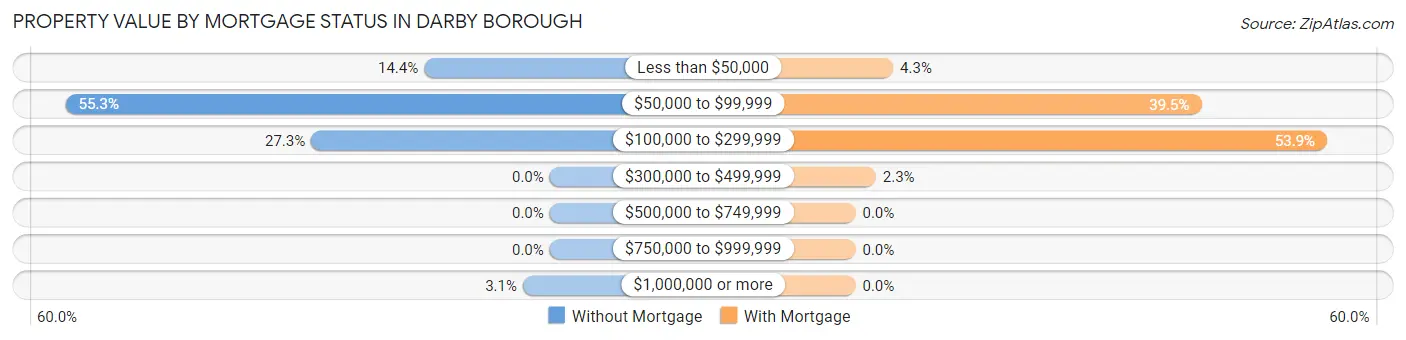
| Property Value | Without Mortgage | With Mortgage |
| Less than $50,000 | 89 (14.3%) | 50 (4.3%) |
| $50,000 to $99,999 | 343 (55.3%) | 460 (39.5%) |
| $100,000 to $299,999 | 169 (27.3%) | 627 (53.9%) |
| $300,000 to $499,999 | 0 (0.0%) | 27 (2.3%) |
| $500,000 to $749,999 | 0 (0.0%) | 0 (0.0%) |
| $750,000 to $999,999 | 0 (0.0%) | 0 (0.0%) |
| $1,000,000 or more | 19 (3.1%) | 0 (0.0%) |
| Total | 620 (100.0%) | 1,164 (100.0%) |
Household Income by Mortgage Status in Darby borough
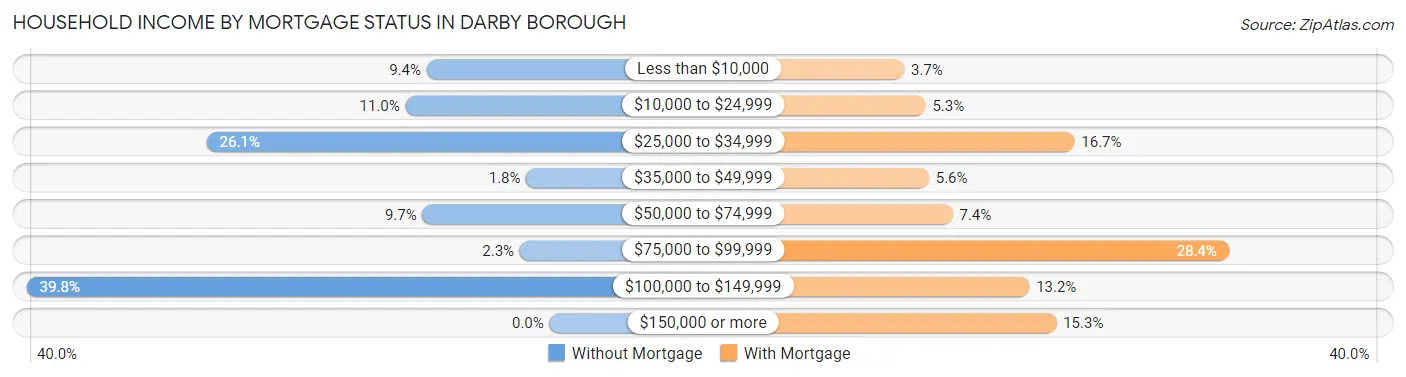
| Household Income | Without Mortgage | With Mortgage |
| Less than $10,000 | 58 (9.3%) | 43 (3.7%) |
| $10,000 to $24,999 | 68 (11.0%) | 62 (5.3%) |
| $25,000 to $34,999 | 162 (26.1%) | 194 (16.7%) |
| $35,000 to $49,999 | 11 (1.8%) | 65 (5.6%) |
| $50,000 to $74,999 | 60 (9.7%) | 86 (7.4%) |
| $75,000 to $99,999 | 14 (2.3%) | 331 (28.4%) |
| $100,000 to $149,999 | 247 (39.8%) | 154 (13.2%) |
| $150,000 or more | 0 (0.0%) | 178 (15.3%) |
| Total | 620 (100.0%) | 1,164 (100.0%) |
Property Value to Household Income Ratio in Darby borough
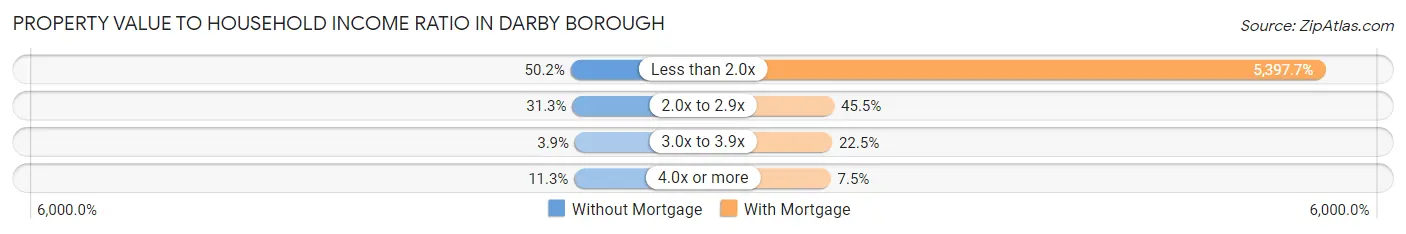
| Value-to-Income Ratio | Without Mortgage | With Mortgage |
| Less than 2.0x | 311 (50.2%) | 62,829 (5,397.7%) |
| 2.0x to 2.9x | 194 (31.3%) | 530 (45.5%) |
| 3.0x to 3.9x | 24 (3.9%) | 262 (22.5%) |
| 4.0x or more | 70 (11.3%) | 87 (7.5%) |
| Total | 620 (100.0%) | 1,164 (100.0%) |
Real Estate Taxes by Mortgage Status in Darby borough
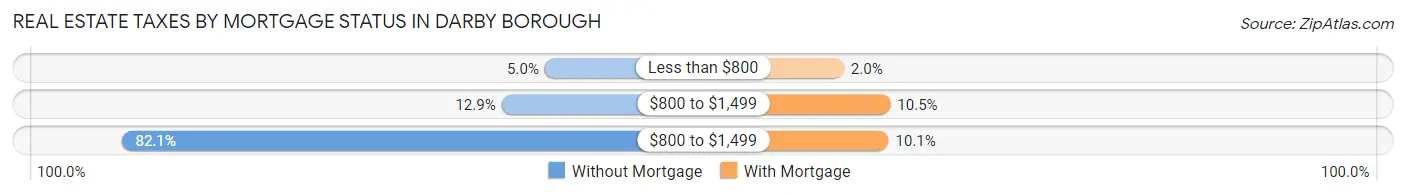
| Property Taxes | Without Mortgage | With Mortgage |
| Less than $800 | 31 (5.0%) | 23 (2.0%) |
| $800 to $1,499 | 80 (12.9%) | 122 (10.5%) |
| $800 to $1,499 | 509 (82.1%) | 118 (10.1%) |
| Total | 620 (100.0%) | 1,164 (100.0%) |
Health & Disability in Darby borough
Health Insurance Coverage by Age in Darby borough
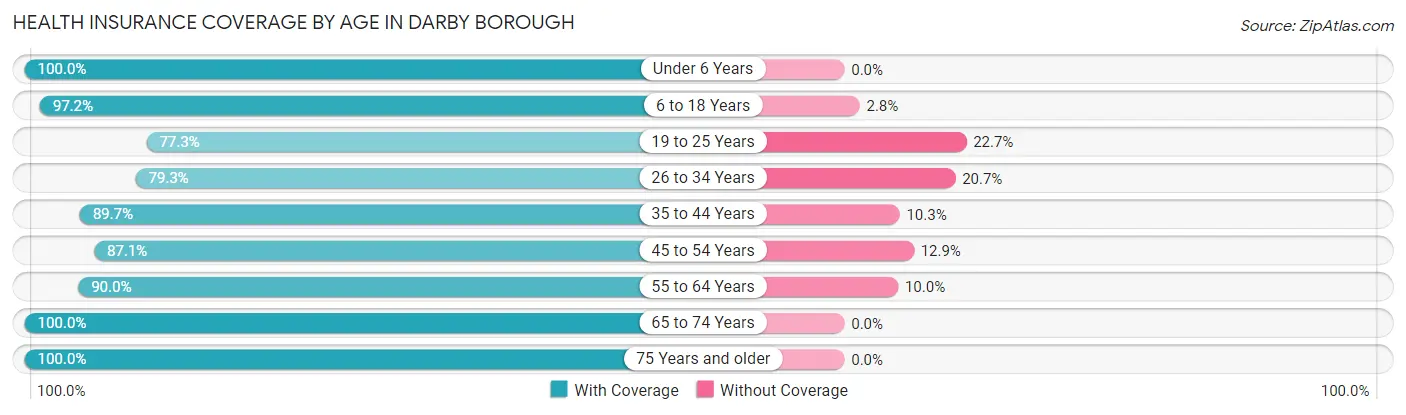
| Age Bracket | With Coverage | Without Coverage |
| Under 6 Years | 896 (100.0%) | 0 (0.0%) |
| 6 to 18 Years | 2,433 (97.2%) | 71 (2.8%) |
| 19 to 25 Years | 690 (77.3%) | 203 (22.7%) |
| 26 to 34 Years | 951 (79.3%) | 248 (20.7%) |
| 35 to 44 Years | 1,229 (89.7%) | 141 (10.3%) |
| 45 to 54 Years | 1,050 (87.1%) | 156 (12.9%) |
| 55 to 64 Years | 1,151 (90.0%) | 128 (10.0%) |
| 65 to 74 Years | 443 (100.0%) | 0 (0.0%) |
| 75 Years and older | 532 (100.0%) | 0 (0.0%) |
| Total | 9,375 (90.8%) | 947 (9.2%) |
Health Insurance Coverage by Citizenship Status in Darby borough
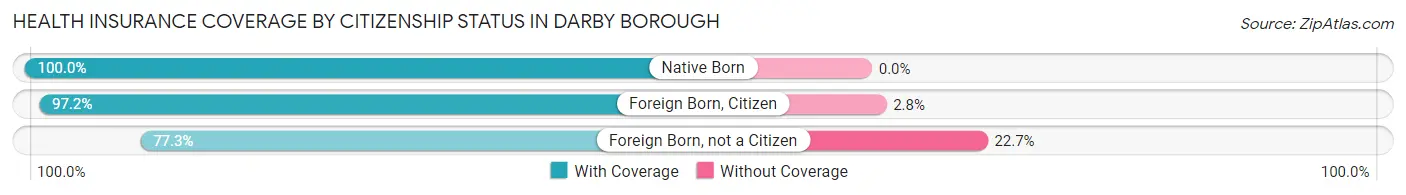
| Citizenship Status | With Coverage | Without Coverage |
| Native Born | 896 (100.0%) | 0 (0.0%) |
| Foreign Born, Citizen | 2,433 (97.2%) | 71 (2.8%) |
| Foreign Born, not a Citizen | 690 (77.3%) | 203 (22.7%) |
Health Insurance Coverage by Household Income in Darby borough
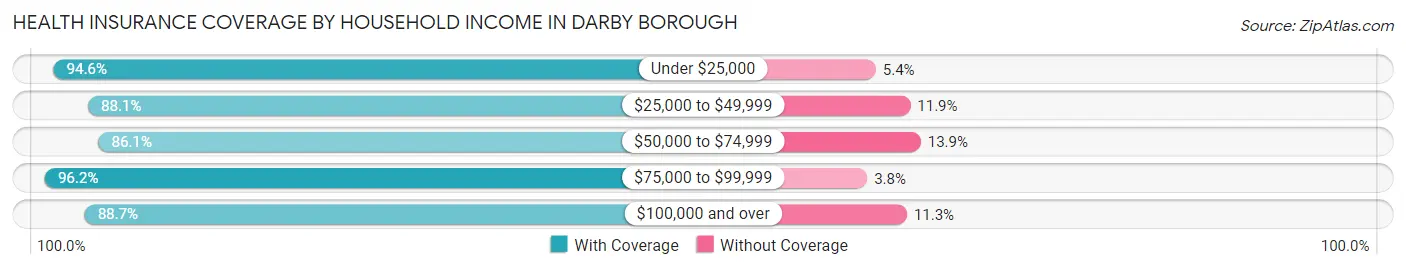
| Household Income | With Coverage | Without Coverage |
| Under $25,000 | 2,087 (94.6%) | 120 (5.4%) |
| $25,000 to $49,999 | 2,314 (88.1%) | 313 (11.9%) |
| $50,000 to $74,999 | 1,541 (86.1%) | 248 (13.9%) |
| $75,000 to $99,999 | 1,834 (96.2%) | 73 (3.8%) |
| $100,000 and over | 1,520 (88.7%) | 193 (11.3%) |
Public vs Private Health Insurance Coverage by Age in Darby borough
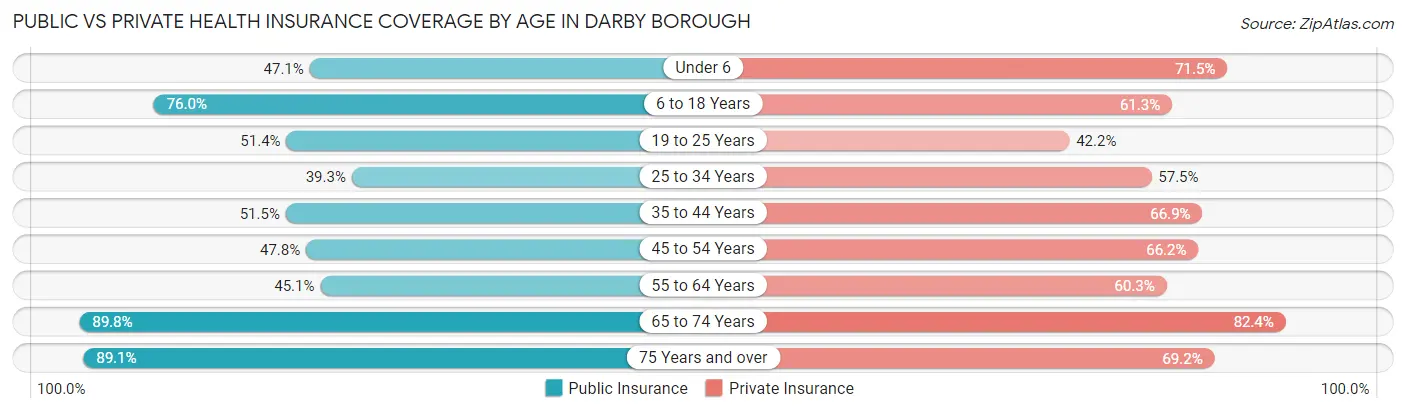
| Age Bracket | Public Insurance | Private Insurance |
| Under 6 | 422 (47.1%) | 641 (71.5%) |
| 6 to 18 Years | 1,904 (76.0%) | 1,535 (61.3%) |
| 19 to 25 Years | 459 (51.4%) | 377 (42.2%) |
| 25 to 34 Years | 471 (39.3%) | 689 (57.5%) |
| 35 to 44 Years | 706 (51.5%) | 917 (66.9%) |
| 45 to 54 Years | 576 (47.8%) | 798 (66.2%) |
| 55 to 64 Years | 577 (45.1%) | 771 (60.3%) |
| 65 to 74 Years | 398 (89.8%) | 365 (82.4%) |
| 75 Years and over | 474 (89.1%) | 368 (69.2%) |
| Total | 5,987 (58.0%) | 6,461 (62.6%) |
Disability Status by Sex by Age in Darby borough
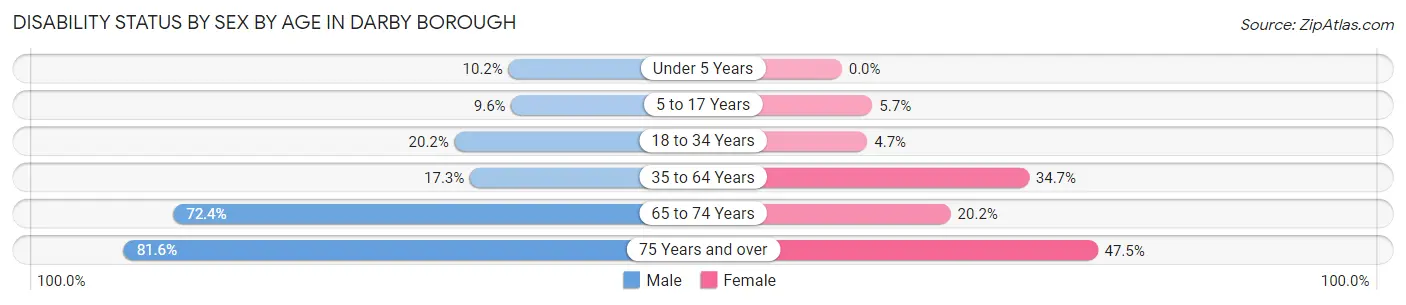
| Age Bracket | Male | Female |
| Under 5 Years | 13 (10.2%) | 0 (0.0%) |
| 5 to 17 Years | 114 (9.6%) | 97 (5.7%) |
| 18 to 34 Years | 229 (20.2%) | 51 (4.7%) |
| 35 to 64 Years | 285 (17.3%) | 767 (34.7%) |
| 65 to 74 Years | 181 (72.4%) | 39 (20.2%) |
| 75 Years and over | 257 (81.6%) | 103 (47.5%) |
Disability Class by Sex by Age in Darby borough
Disability Class: Hearing Difficulty
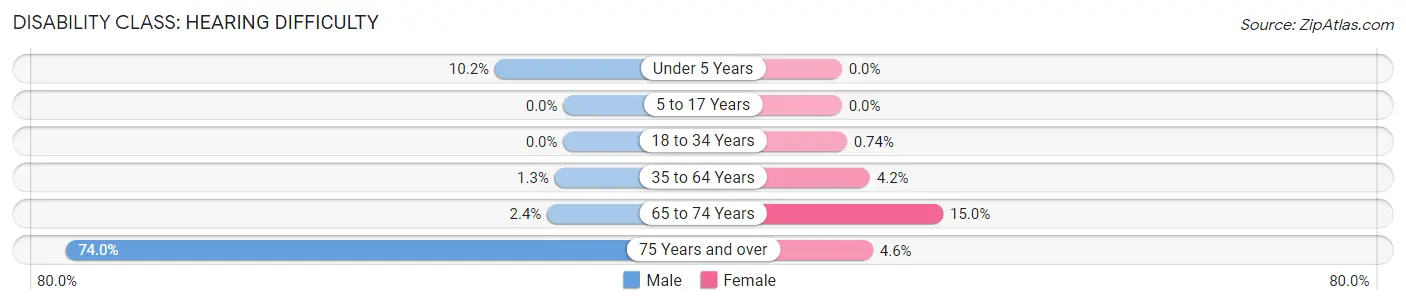
| Age Bracket | Male | Female |
| Under 5 Years | 13 (10.2%) | 0 (0.0%) |
| 5 to 17 Years | 0 (0.0%) | 0 (0.0%) |
| 18 to 34 Years | 0 (0.0%) | 8 (0.7%) |
| 35 to 64 Years | 21 (1.3%) | 92 (4.2%) |
| 65 to 74 Years | 6 (2.4%) | 29 (15.0%) |
| 75 Years and over | 233 (74.0%) | 10 (4.6%) |
Disability Class: Vision Difficulty
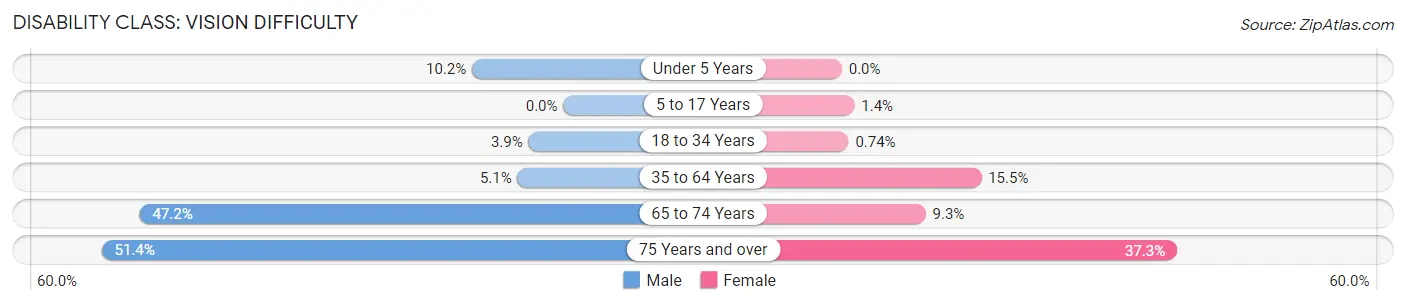
| Age Bracket | Male | Female |
| Under 5 Years | 13 (10.2%) | 0 (0.0%) |
| 5 to 17 Years | 0 (0.0%) | 24 (1.4%) |
| 18 to 34 Years | 44 (3.9%) | 8 (0.7%) |
| 35 to 64 Years | 84 (5.1%) | 343 (15.5%) |
| 65 to 74 Years | 118 (47.2%) | 18 (9.3%) |
| 75 Years and over | 162 (51.4%) | 81 (37.3%) |
Disability Class: Cognitive Difficulty
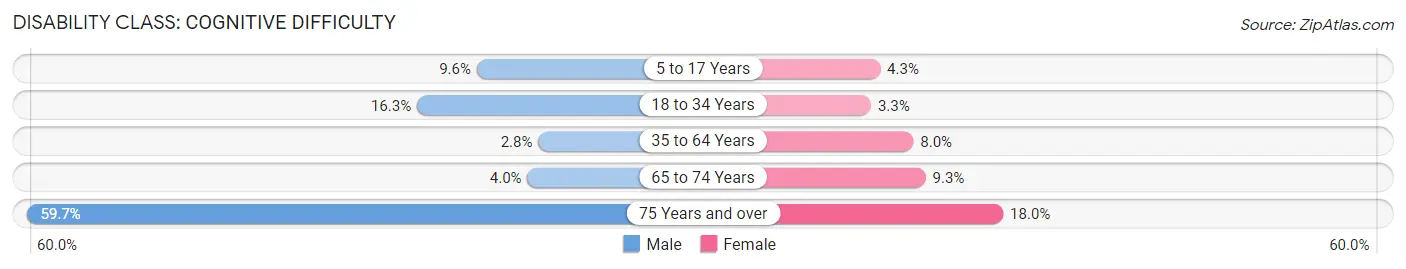
| Age Bracket | Male | Female |
| 5 to 17 Years | 114 (9.6%) | 73 (4.3%) |
| 18 to 34 Years | 185 (16.3%) | 35 (3.3%) |
| 35 to 64 Years | 46 (2.8%) | 176 (8.0%) |
| 65 to 74 Years | 10 (4.0%) | 18 (9.3%) |
| 75 Years and over | 188 (59.7%) | 39 (18.0%) |
Disability Class: Ambulatory Difficulty
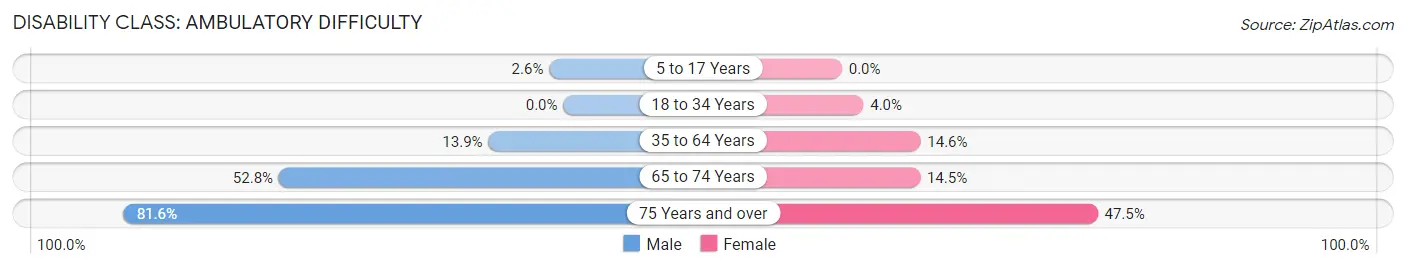
| Age Bracket | Male | Female |
| 5 to 17 Years | 31 (2.6%) | 0 (0.0%) |
| 18 to 34 Years | 0 (0.0%) | 43 (4.0%) |
| 35 to 64 Years | 229 (13.9%) | 322 (14.6%) |
| 65 to 74 Years | 132 (52.8%) | 28 (14.5%) |
| 75 Years and over | 257 (81.6%) | 103 (47.5%) |
Disability Class: Self-Care Difficulty
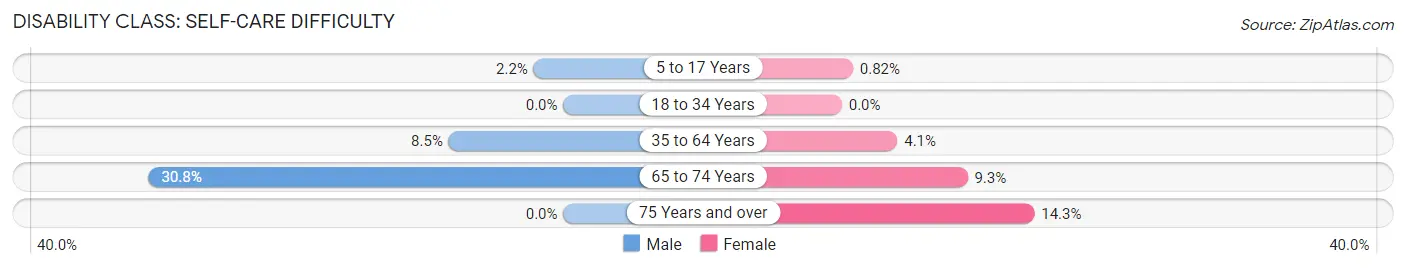
| Age Bracket | Male | Female |
| 5 to 17 Years | 26 (2.2%) | 14 (0.8%) |
| 18 to 34 Years | 0 (0.0%) | 0 (0.0%) |
| 35 to 64 Years | 140 (8.5%) | 91 (4.1%) |
| 65 to 74 Years | 77 (30.8%) | 18 (9.3%) |
| 75 Years and over | 0 (0.0%) | 31 (14.3%) |
Technology Access in Darby borough
Computing Device Access in Darby borough
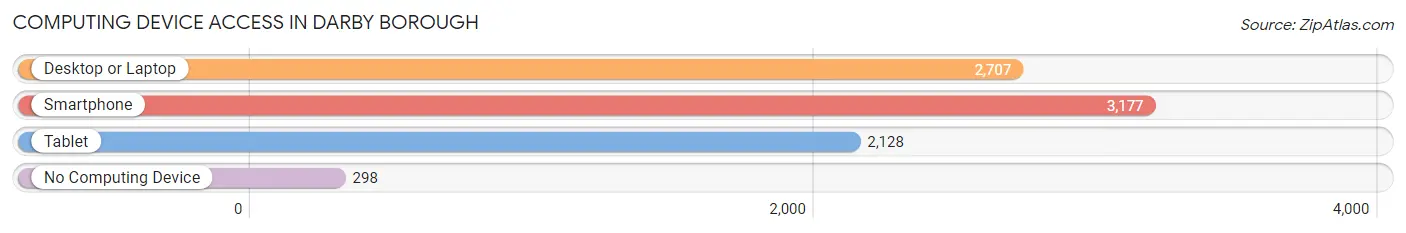
| Device Type | # Households | % Households |
| Desktop or Laptop | 2,707 | 76.0% |
| Smartphone | 3,177 | 89.2% |
| Tablet | 2,128 | 59.7% |
| No Computing Device | 298 | 8.4% |
| Total | 3,563 | 100.0% |
Internet Access in Darby borough
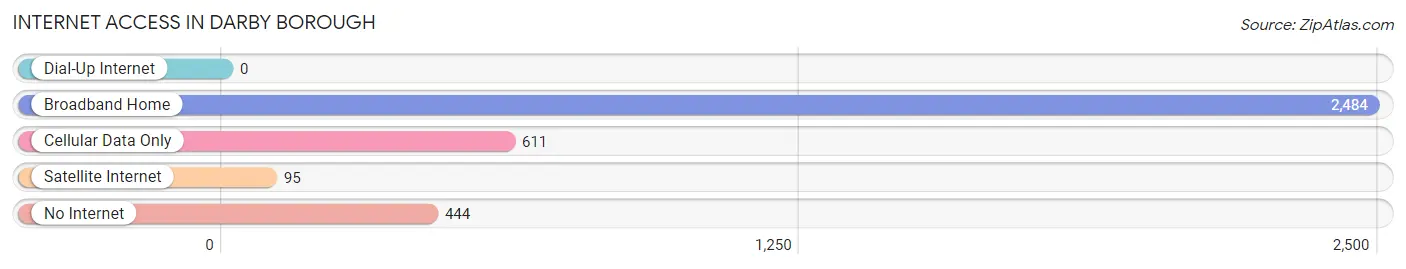
| Internet Type | # Households | % Households |
| Dial-Up Internet | 0 | 0.0% |
| Broadband Home | 2,484 | 69.7% |
| Cellular Data Only | 611 | 17.2% |
| Satellite Internet | 95 | 2.7% |
| No Internet | 444 | 12.5% |
| Total | 3,563 | 100.0% |
Darby borough Summary
Darby Borough is a small borough located in Delaware County, Pennsylvania. It is part of the Philadelphia metropolitan area and is located just south of the city of Philadelphia. The borough has a population of 10,299 as of the 2010 census.
History
The area that is now Darby Borough was first settled in 1682 by William Darby, an English Quaker. The area was originally part of Darby Township, which was established in 1690. In 1854, the area was incorporated as a borough. The borough was named after William Darby, who was the first settler in the area.
The borough was an important industrial center in the 19th and early 20th centuries. It was home to several factories, including the Darby Iron Works, which produced iron products for the Union Army during the Civil War. The borough also had several mills, including a paper mill, a flour mill, and a cotton mill.
Geography
Darby Borough is located in southeastern Pennsylvania, about 5 miles south of the city of Philadelphia. It is bordered by the boroughs of Collingdale, Sharon Hill, and Folcroft, and by the townships of Upper Darby and Darby. The borough has a total area of 1.2 square miles, all of which is land.
The borough is located in the Delaware Valley, which is part of the Atlantic Coastal Plain. The terrain is generally flat, with some rolling hills. The borough is located in the Piedmont region of Pennsylvania, which is characterized by rolling hills and valleys.
Economy
The economy of Darby Borough is largely based on manufacturing and retail. The borough is home to several factories, including a paper mill, a flour mill, and a cotton mill. The borough also has several retail stores, including a grocery store, a hardware store, and a pharmacy.
The borough also has several restaurants, including a pizza shop, a Chinese restaurant, and a Mexican restaurant. The borough also has several banks, including a Wells Fargo branch and a PNC Bank branch.
Demographics
As of the 2010 census, the population of Darby Borough was 10,299. The racial makeup of the borough was 57.3% White, 33.2% African American, 0.3% Native American, 1.2% Asian, 0.1% Pacific Islander, 5.2% from other races, and 2.9% from two or more races. Hispanic or Latino of any race were 11.2% of the population.
The median household income in the borough was $37,941, and the median family income was $45,941. About 20.3% of families and 24.2% of the population were below the poverty line, including 33.3% of those under age 18 and 11.2% of those age 65 or over.
The borough is served by the Darby School District, which includes two elementary schools, a middle school, and a high school. The borough is also home to several churches, including the Darby Presbyterian Church, the Darby United Methodist Church, and the Darby Baptist Church.
Common Questions
What is Per Capita Income in Darby borough?
Per Capita income in Darby borough is $21,057.
What is the Median Family Income in Darby borough?
Median Family Income in Darby borough is $55,837.
What is the Median Household income in Darby borough?
Median Household Income in Darby borough is $45,511.
What is Income or Wage Gap in Darby borough?
Income or Wage Gap in Darby borough is 5.2%.
Women in Darby borough earn 94.8 cents for every dollar earned by a man.
What is Inequality or Gini Index in Darby borough?
Inequality or Gini Index in Darby borough is 0.44.
What is the Total Population of Darby borough?
Total Population of Darby borough is 10,682.
What is the Total Male Population of Darby borough?
Total Male Population of Darby borough is 4,755.
What is the Total Female Population of Darby borough?
Total Female Population of Darby borough is 5,927.
What is the Ratio of Males per 100 Females in Darby borough?
There are 80.23 Males per 100 Females in Darby borough.
What is the Ratio of Females per 100 Males in Darby borough?
There are 124.65 Females per 100 Males in Darby borough.
What is the Median Population Age in Darby borough?
Median Population Age in Darby borough is 33.7 Years.
What is the Average Family Size in Darby borough
Average Family Size in Darby borough is 3.9 People.
What is the Average Household Size in Darby borough
Average Household Size in Darby borough is 2.9 People.
How Large is the Labor Force in Darby borough?
There are 4,541 People in the Labor Forcein in Darby borough.
What is the Percentage of People in the Labor Force in Darby borough?
58.7% of People are in the Labor Force in Darby borough.
What is the Unemployment Rate in Darby borough?
Unemployment Rate in Darby borough is 13.9%.