East Pittsburgh borough, PA Map & Demographics
East Pittsburgh borough Overview
$21,343
PER CAPITA INCOME
$34,247
AVG FAMILY INCOME
$35,483
AVG HOUSEHOLD INCOME
15.5%
WAGE / INCOME GAP [ % ]
84.5¢/ $1
WAGE / INCOME GAP [ $ ]
0.43
INEQUALITY / GINI INDEX
1,866
TOTAL POPULATION
822
MALE POPULATION
1,044
FEMALE POPULATION
78.74
MALES / 100 FEMALES
127.01
FEMALES / 100 MALES
32.7
MEDIAN AGE
2.9
AVG FAMILY SIZE
2.3
AVG HOUSEHOLD SIZE
774
LABOR FORCE [ PEOPLE ]
57.8%
PERCENT IN LABOR FORCE
5.4%
UNEMPLOYMENT RATE
Income in East Pittsburgh borough
Income Overview in East Pittsburgh borough
Per Capita Income in East Pittsburgh borough is $21,343, while median incomes of families and households are $34,247 and $35,483 respectively.
| Characteristic | Number | Measure |
| Per Capita Income | 1,866 | $21,343 |
| Median Family Income | 481 | $34,247 |
| Mean Family Income | 481 | $42,161 |
| Median Household Income | 809 | $35,483 |
| Mean Household Income | 809 | $45,457 |
| Income Deficit | 481 | $0 |
| Wage / Income Gap (%) | 1,866 | 15.49% |
| Wage / Income Gap ($) | 1,866 | 84.51¢ per $1 |
| Gini / Inequality Index | 1,866 | 0.43 |
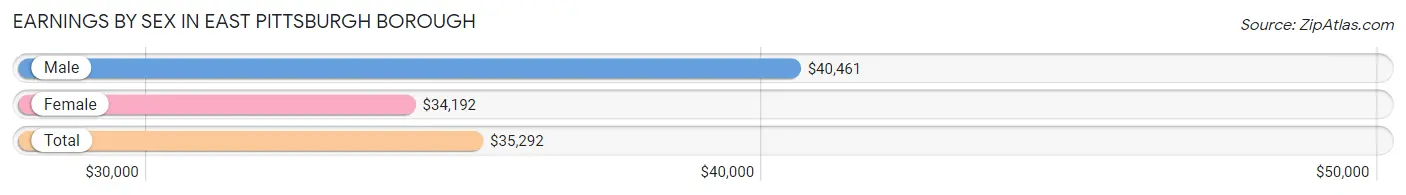
Earnings by Sex in East Pittsburgh borough
Average Earnings in East Pittsburgh borough are $35,292, $40,461 for men and $34,192 for women, a difference of 15.5%.
| Sex | Number | Average Earnings |
| Male | 374 (46.5%) | $40,461 |
| Female | 430 (53.5%) | $34,192 |
| Total | 804 (100.0%) | $35,292 |
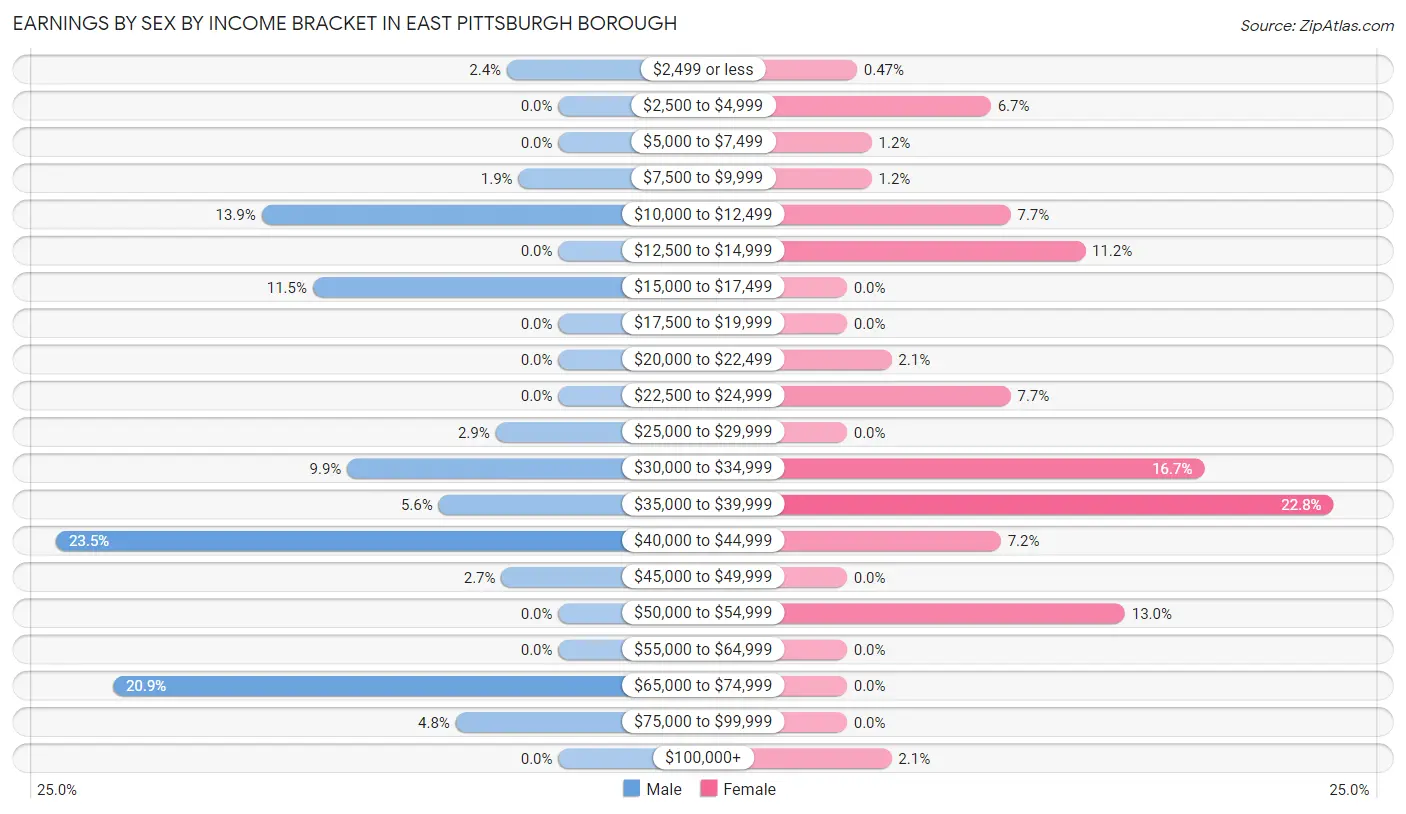
Earnings by Sex by Income Bracket in East Pittsburgh borough
The most common earnings brackets in East Pittsburgh borough are $40,000 to $44,999 for men (88 | 23.5%) and $35,000 to $39,999 for women (98 | 22.8%).
| Income | Male | Female |
| $2,499 or less | 9 (2.4%) | 2 (0.5%) |
| $2,500 to $4,999 | 0 (0.0%) | 29 (6.7%) |
| $5,000 to $7,499 | 0 (0.0%) | 5 (1.2%) |
| $7,500 to $9,999 | 7 (1.9%) | 5 (1.2%) |
| $10,000 to $12,499 | 52 (13.9%) | 33 (7.7%) |
| $12,500 to $14,999 | 0 (0.0%) | 48 (11.2%) |
| $15,000 to $17,499 | 43 (11.5%) | 0 (0.0%) |
| $17,500 to $19,999 | 0 (0.0%) | 0 (0.0%) |
| $20,000 to $22,499 | 0 (0.0%) | 9 (2.1%) |
| $22,500 to $24,999 | 0 (0.0%) | 33 (7.7%) |
| $25,000 to $29,999 | 11 (2.9%) | 0 (0.0%) |
| $30,000 to $34,999 | 37 (9.9%) | 72 (16.7%) |
| $35,000 to $39,999 | 21 (5.6%) | 98 (22.8%) |
| $40,000 to $44,999 | 88 (23.5%) | 31 (7.2%) |
| $45,000 to $49,999 | 10 (2.7%) | 0 (0.0%) |
| $50,000 to $54,999 | 0 (0.0%) | 56 (13.0%) |
| $55,000 to $64,999 | 0 (0.0%) | 0 (0.0%) |
| $65,000 to $74,999 | 78 (20.9%) | 0 (0.0%) |
| $75,000 to $99,999 | 18 (4.8%) | 0 (0.0%) |
| $100,000+ | 0 (0.0%) | 9 (2.1%) |
| Total | 374 (100.0%) | 430 (100.0%) |
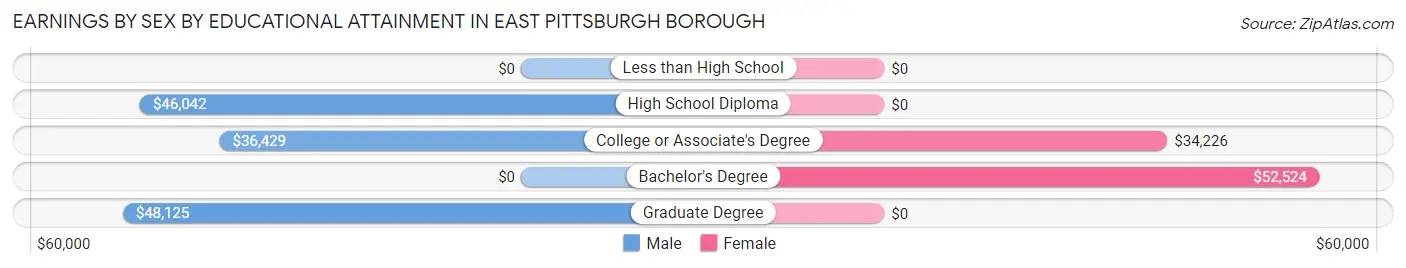
Earnings by Sex by Educational Attainment in East Pittsburgh borough
Average earnings in East Pittsburgh borough are $42,550 for men and $34,654 for women, a difference of 18.6%. Men with an educational attainment of graduate degree enjoy the highest average annual earnings of $48,125, while those with college or associate's degree education earn the least with $36,429. Women with an educational attainment of bachelor's degree earn the most with the average annual earnings of $52,524, while those with college or associate's degree education have the smallest earnings of $34,226.
| Educational Attainment | Male Income | Female Income |
| Less than High School | - | - |
| High School Diploma | $46,042 | $0 |
| College or Associate's Degree | $36,429 | $34,226 |
| Bachelor's Degree | - | - |
| Graduate Degree | $48,125 | $0 |
| Total | $42,550 | $34,654 |
Family Income in East Pittsburgh borough
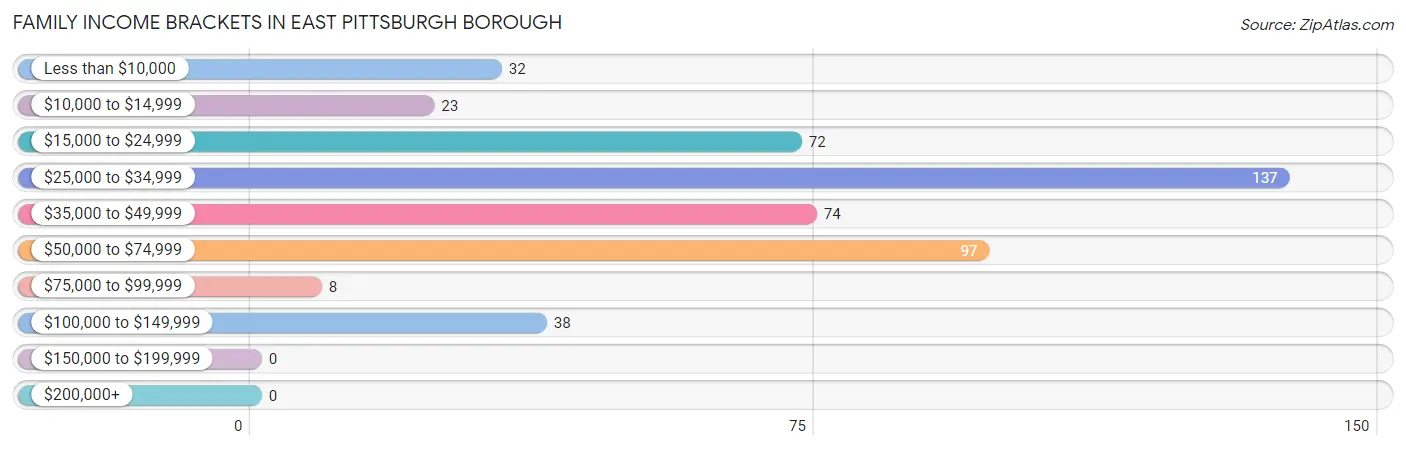
Family Income Brackets in East Pittsburgh borough
According to the East Pittsburgh borough family income data, there are 137 families falling into the $25,000 to $34,999 income range, which is the most common income bracket and makes up 28.5% of all families.
| Income Bracket | # Families | % Families |
| Less than $10,000 | 32 | 6.7% |
| $10,000 to $14,999 | 23 | 4.8% |
| $15,000 to $24,999 | 72 | 15.0% |
| $25,000 to $34,999 | 137 | 28.5% |
| $35,000 to $49,999 | 74 | 15.4% |
| $50,000 to $74,999 | 97 | 20.2% |
| $75,000 to $99,999 | 8 | 1.7% |
| $100,000 to $149,999 | 38 | 7.9% |
| $150,000 to $199,999 | 0 | 0.0% |
| $200,000+ | 0 | 0.0% |
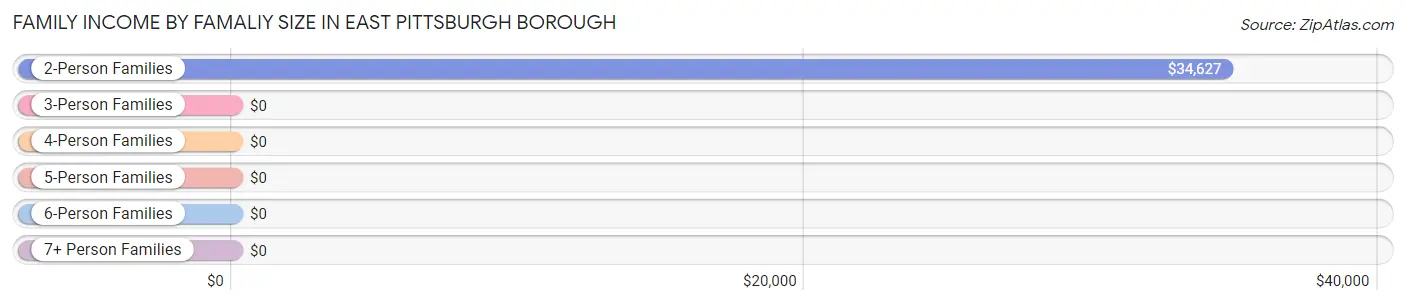
Family Income by Famaliy Size in East Pittsburgh borough
2-person families (279 | 58.0%) account for the highest median family income in East Pittsburgh borough with $34,627 per family, while 2-person families (279 | 58.0%) have the highest median income of $17,314 per family member.
| Income Bracket | # Families | Median Income |
| 2-Person Families | 279 (58.0%) | $34,627 |
| 3-Person Families | 151 (31.4%) | $0 |
| 4-Person Families | 29 (6.0%) | $0 |
| 5-Person Families | 22 (4.6%) | $0 |
| 6-Person Families | 0 (0.0%) | $0 |
| 7+ Person Families | 0 (0.0%) | $0 |
| Total | 481 (100.0%) | $34,247 |
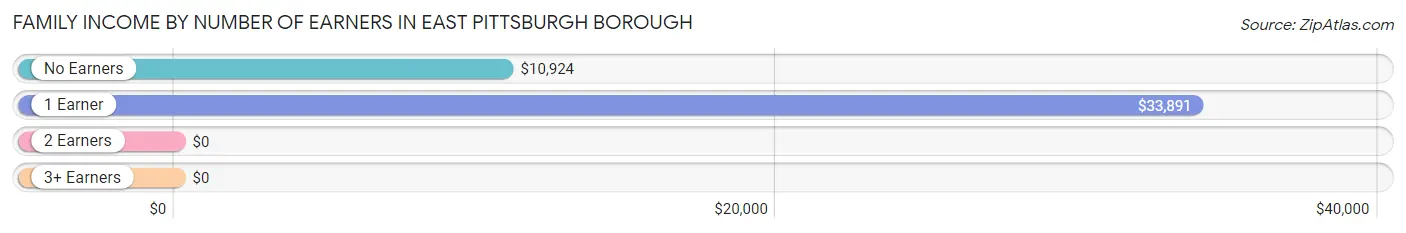
Family Income by Number of Earners in East Pittsburgh borough
| Number of Earners | # Families | Median Income |
| No Earners | 61 (12.7%) | $10,924 |
| 1 Earner | 329 (68.4%) | $33,891 |
| 2 Earners | 91 (18.9%) | $0 |
| 3+ Earners | 0 (0.0%) | $0 |
| Total | 481 (100.0%) | $34,247 |
Household Income in East Pittsburgh borough
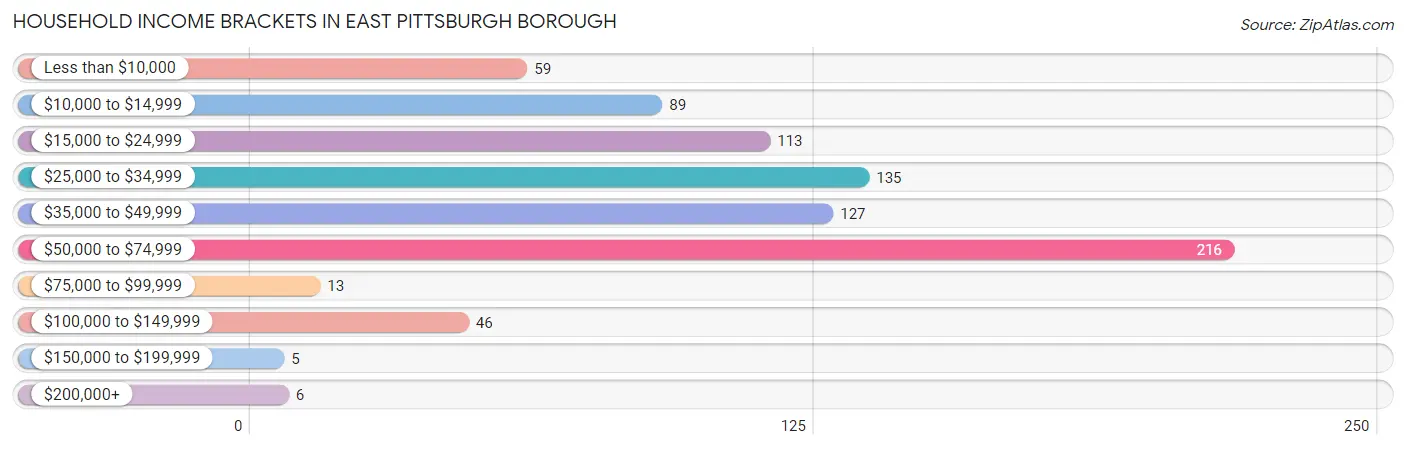
Household Income Brackets in East Pittsburgh borough
With 216 households falling in the category, the $50,000 to $74,999 income range is the most frequent in East Pittsburgh borough, accounting for 26.7% of all households. In contrast, only 5 households (0.6%) fall into the $150,000 to $199,999 income bracket, making it the least populous group.
| Income Bracket | # Households | % Households |
| Less than $10,000 | 59 | 7.3% |
| $10,000 to $14,999 | 89 | 11.0% |
| $15,000 to $24,999 | 113 | 14.0% |
| $25,000 to $34,999 | 135 | 16.7% |
| $35,000 to $49,999 | 127 | 15.7% |
| $50,000 to $74,999 | 216 | 26.7% |
| $75,000 to $99,999 | 13 | 1.6% |
| $100,000 to $149,999 | 46 | 5.7% |
| $150,000 to $199,999 | 5 | 0.6% |
| $200,000+ | 6 | 0.7% |
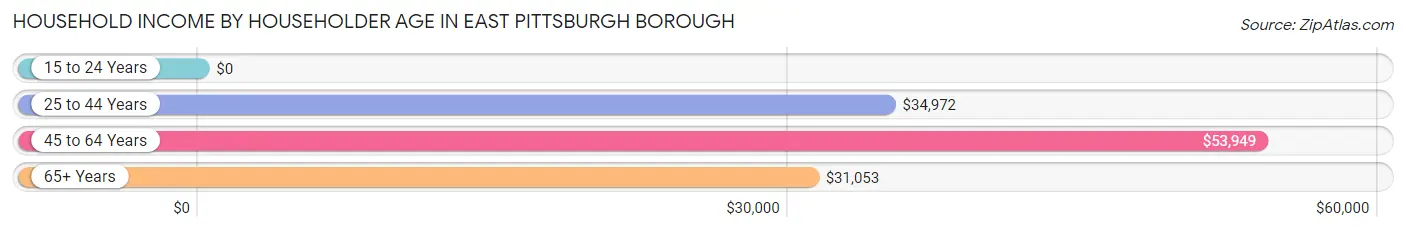
Household Income by Householder Age in East Pittsburgh borough
The median household income in East Pittsburgh borough is $35,483, with the highest median household income of $53,949 found in the 45 to 64 years age bracket for the primary householder. A total of 219 households (27.1%) fall into this category. Meanwhile, the 15 to 24 years age bracket for the primary householder has the lowest median household income of $0, with 25 households (3.1%) in this group.
| Income Bracket | # Households | Median Income |
| 15 to 24 Years | 25 (3.1%) | $0 |
| 25 to 44 Years | 375 (46.4%) | $34,972 |
| 45 to 64 Years | 219 (27.1%) | $53,949 |
| 65+ Years | 190 (23.5%) | $31,053 |
| Total | 809 (100.0%) | $35,483 |
Poverty in East Pittsburgh borough
Income Below Poverty by Sex and Age in East Pittsburgh borough
With 38.3% poverty level for males and 26.3% for females among the residents of East Pittsburgh borough, 16 and 17 year old males and 15 year old females are the most vulnerable to poverty, with 30 males (100.0%) and 35 females (100.0%) in their respective age groups living below the poverty level.
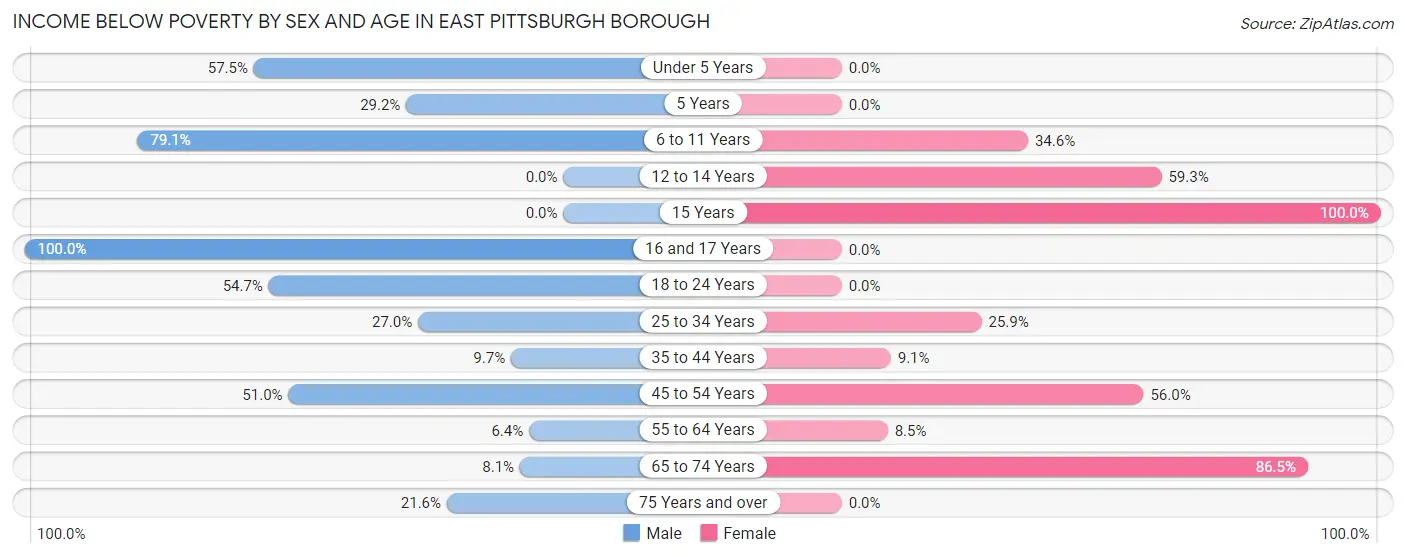
| Age Bracket | Male | Female |
| Under 5 Years | 27 (57.5%) | 0 (0.0%) |
| 5 Years | 7 (29.2%) | 0 (0.0%) |
| 6 to 11 Years | 83 (79.0%) | 47 (34.6%) |
| 12 to 14 Years | 0 (0.0%) | 54 (59.3%) |
| 15 Years | 0 (0.0%) | 35 (100.0%) |
| 16 and 17 Years | 30 (100.0%) | 0 (0.0%) |
| 18 to 24 Years | 35 (54.7%) | 0 (0.0%) |
| 25 to 34 Years | 24 (27.0%) | 62 (25.9%) |
| 35 to 44 Years | 7 (9.7%) | 9 (9.1%) |
| 45 to 54 Years | 74 (51.0%) | 14 (56.0%) |
| 55 to 64 Years | 7 (6.4%) | 19 (8.5%) |
| 65 to 74 Years | 5 (8.1%) | 32 (86.5%) |
| 75 Years and over | 16 (21.6%) | 0 (0.0%) |
| Total | 315 (38.3%) | 272 (26.3%) |
Income Above Poverty by Sex and Age in East Pittsburgh borough
According to the poverty statistics in East Pittsburgh borough, males aged 55 to 64 years and females aged under 5 years are the age groups that are most secure financially, with 93.6% of males and 100.0% of females in these age groups living above the poverty line.
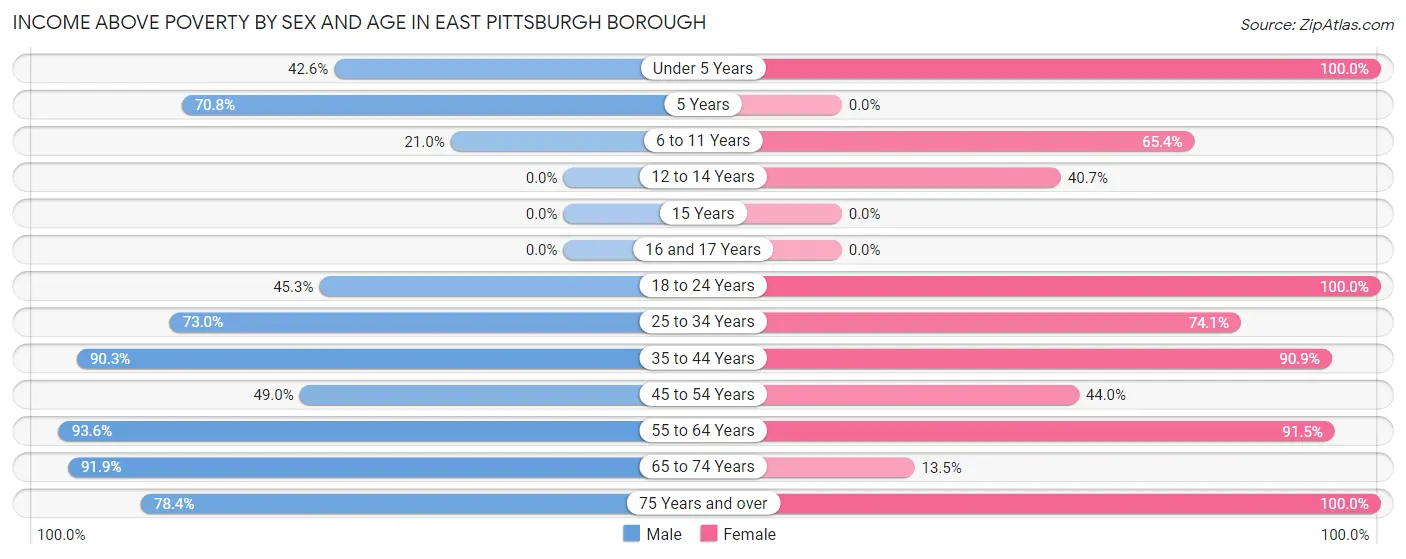
| Age Bracket | Male | Female |
| Under 5 Years | 20 (42.5%) | 80 (100.0%) |
| 5 Years | 17 (70.8%) | 0 (0.0%) |
| 6 to 11 Years | 22 (20.9%) | 89 (65.4%) |
| 12 to 14 Years | 0 (0.0%) | 37 (40.7%) |
| 15 Years | 0 (0.0%) | 0 (0.0%) |
| 16 and 17 Years | 0 (0.0%) | 0 (0.0%) |
| 18 to 24 Years | 29 (45.3%) | 24 (100.0%) |
| 25 to 34 Years | 65 (73.0%) | 177 (74.1%) |
| 35 to 44 Years | 65 (90.3%) | 90 (90.9%) |
| 45 to 54 Years | 71 (49.0%) | 11 (44.0%) |
| 55 to 64 Years | 103 (93.6%) | 204 (91.5%) |
| 65 to 74 Years | 57 (91.9%) | 5 (13.5%) |
| 75 Years and over | 58 (78.4%) | 46 (100.0%) |
| Total | 507 (61.7%) | 763 (73.7%) |
Income Below Poverty Among Married-Couple Families in East Pittsburgh borough
The poverty statistics for married-couple families in East Pittsburgh borough show that 11.9% or 5 of the total 42 families live below the poverty line. Families with no children have the highest poverty rate of 11.9%, comprising of 5 families. On the other hand, families with no children have the lowest poverty rate of 11.9%, which includes 5 families.
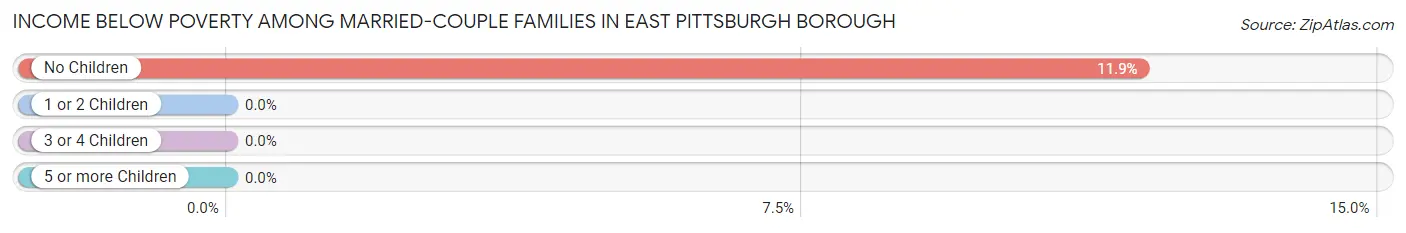
| Children | Above Poverty | Below Poverty |
| No Children | 37 (88.1%) | 5 (11.9%) |
| 1 or 2 Children | 0 (0.0%) | 0 (0.0%) |
| 3 or 4 Children | 0 (0.0%) | 0 (0.0%) |
| 5 or more Children | 0 (0.0%) | 0 (0.0%) |
| Total | 37 (88.1%) | 5 (11.9%) |
Income Below Poverty Among Single-Parent Households in East Pittsburgh borough
According to the poverty data in East Pittsburgh borough, 43.7% or 45 single-father households and 22.9% or 77 single-mother households are living below the poverty line. Among single-father households, those with 1 or 2 children have the highest poverty rate, with 23 households (100.0%) experiencing poverty. Likewise, among single-mother households, those with 3 or 4 children have the highest poverty rate, with 22 households (51.2%) falling below the poverty line.
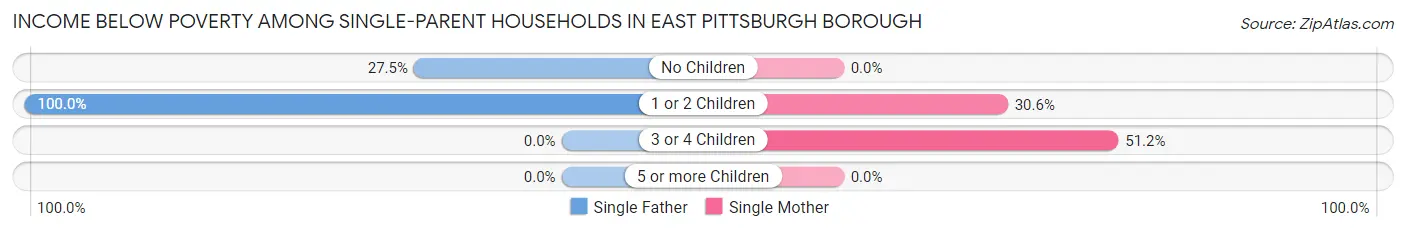
| Children | Single Father | Single Mother |
| No Children | 22 (27.5%) | 0 (0.0%) |
| 1 or 2 Children | 23 (100.0%) | 55 (30.6%) |
| 3 or 4 Children | 0 (0.0%) | 22 (51.2%) |
| 5 or more Children | 0 (0.0%) | 0 (0.0%) |
| Total | 45 (43.7%) | 77 (22.9%) |
Income Below Poverty Among Married-Couple vs Single-Parent Households in East Pittsburgh borough
The poverty data for East Pittsburgh borough shows that 5 of the married-couple family households (11.9%) and 122 of the single-parent households (27.8%) are living below the poverty level. Within the married-couple family households, those with no children have the highest poverty rate, with 5 households (11.9%) falling below the poverty line. Among the single-parent households, those with 3 or 4 children have the highest poverty rate, with 22 household (51.2%) living below poverty.
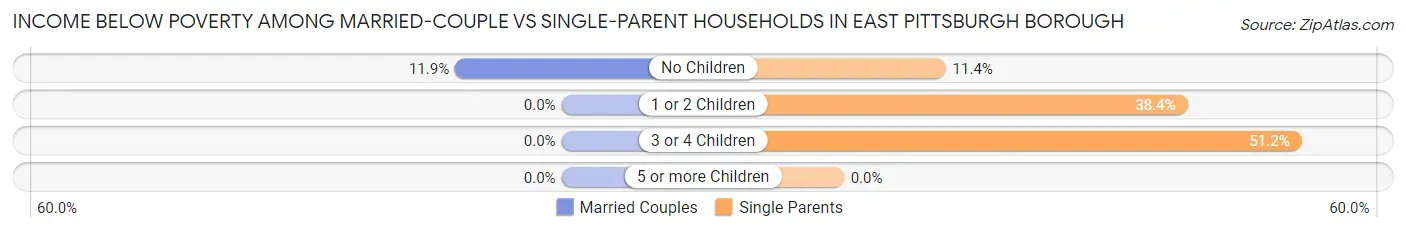
| Children | Married-Couple Families | Single-Parent Households |
| No Children | 5 (11.9%) | 22 (11.4%) |
| 1 or 2 Children | 0 (0.0%) | 78 (38.4%) |
| 3 or 4 Children | 0 (0.0%) | 22 (51.2%) |
| 5 or more Children | 0 (0.0%) | 0 (0.0%) |
| Total | 5 (11.9%) | 122 (27.8%) |
Race in East Pittsburgh borough
The most populous races in East Pittsburgh borough are Black / African American (1,268 | 67.9%), White / Caucasian (508 | 27.2%), and Two or more Races (90 | 4.8%).
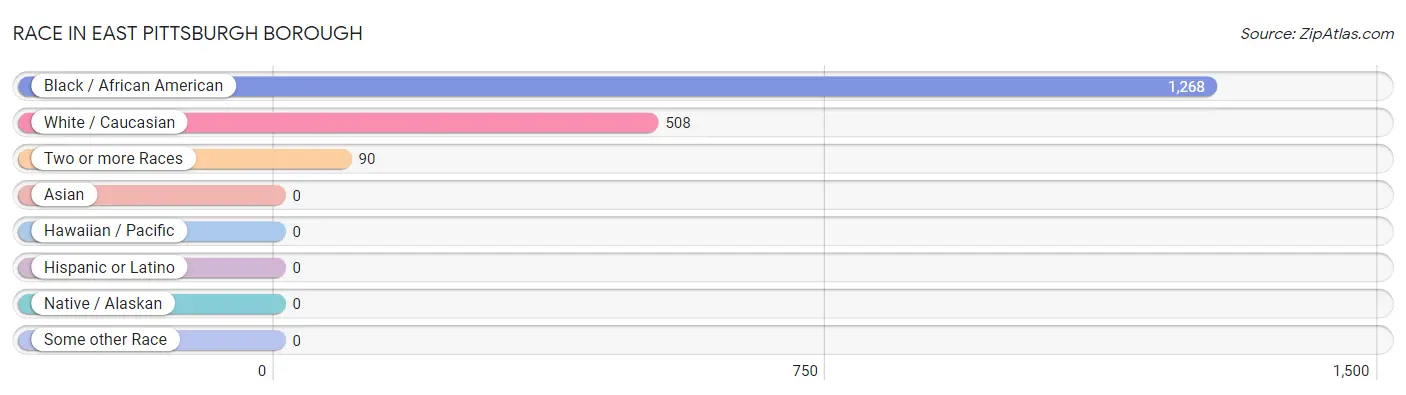
| Race | # Population | % Population |
| Asian | 0 | 0.0% |
| Black / African American | 1,268 | 67.9% |
| Hawaiian / Pacific | 0 | 0.0% |
| Hispanic or Latino | 0 | 0.0% |
| Native / Alaskan | 0 | 0.0% |
| White / Caucasian | 508 | 27.2% |
| Two or more Races | 90 | 4.8% |
| Some other Race | 0 | 0.0% |
| Total | 1,866 | 100.0% |
Ancestry in East Pittsburgh borough
The most populous ancestries reported in East Pittsburgh borough are Irish (195 | 10.4%), African (160 | 8.6%), Subsaharan African (160 | 8.6%), Croatian (98 | 5.2%), and English (94 | 5.0%), together accounting for 37.9% of all East Pittsburgh borough residents.

| Ancestry | # Population | % Population |
| African | 160 | 8.6% |
| American | 14 | 0.7% |
| Blackfeet | 15 | 0.8% |
| British | 5 | 0.3% |
| Croatian | 98 | 5.2% |
| Dutch | 8 | 0.4% |
| English | 94 | 5.0% |
| French | 7 | 0.4% |
| German | 41 | 2.2% |
| Hungarian | 5 | 0.3% |
| Irish | 195 | 10.4% |
| Italian | 68 | 3.6% |
| Lithuanian | 5 | 0.3% |
| Polish | 79 | 4.2% |
| Slavic | 7 | 0.4% |
| Slovak | 58 | 3.1% |
| Subsaharan African | 160 | 8.6% |
| Thai | 35 | 1.9% |
| Welsh | 6 | 0.3% | View All 19 Rows |
Immigrants in East Pittsburgh borough
The most numerous immigrant groups reported in East Pittsburgh borough came from Europe (15 | 0.8%), Italy (15 | 0.8%), Southern Europe (15 | 0.8%), Latin America (8 | 0.4%), and South America (8 | 0.4%), together accounting for 3.3% of all East Pittsburgh borough residents.
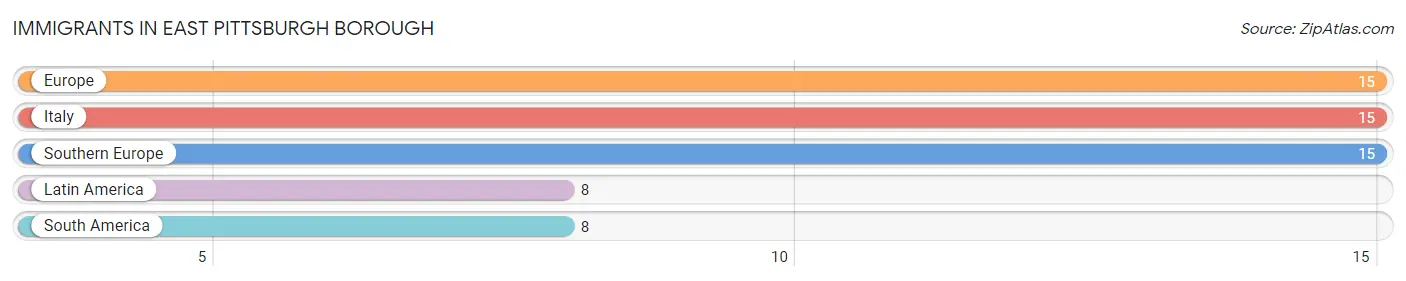
| Immigration Origin | # Population | % Population |
| Europe | 15 | 0.8% |
| Italy | 15 | 0.8% |
| Latin America | 8 | 0.4% |
| South America | 8 | 0.4% |
| Southern Europe | 15 | 0.8% | View All 5 Rows |
Sex and Age in East Pittsburgh borough
Sex and Age in East Pittsburgh borough
The most populous age groups in East Pittsburgh borough are 5 to 9 Years (107 | 13.0%) for men and 10 to 14 Years (212 | 20.3%) for women.
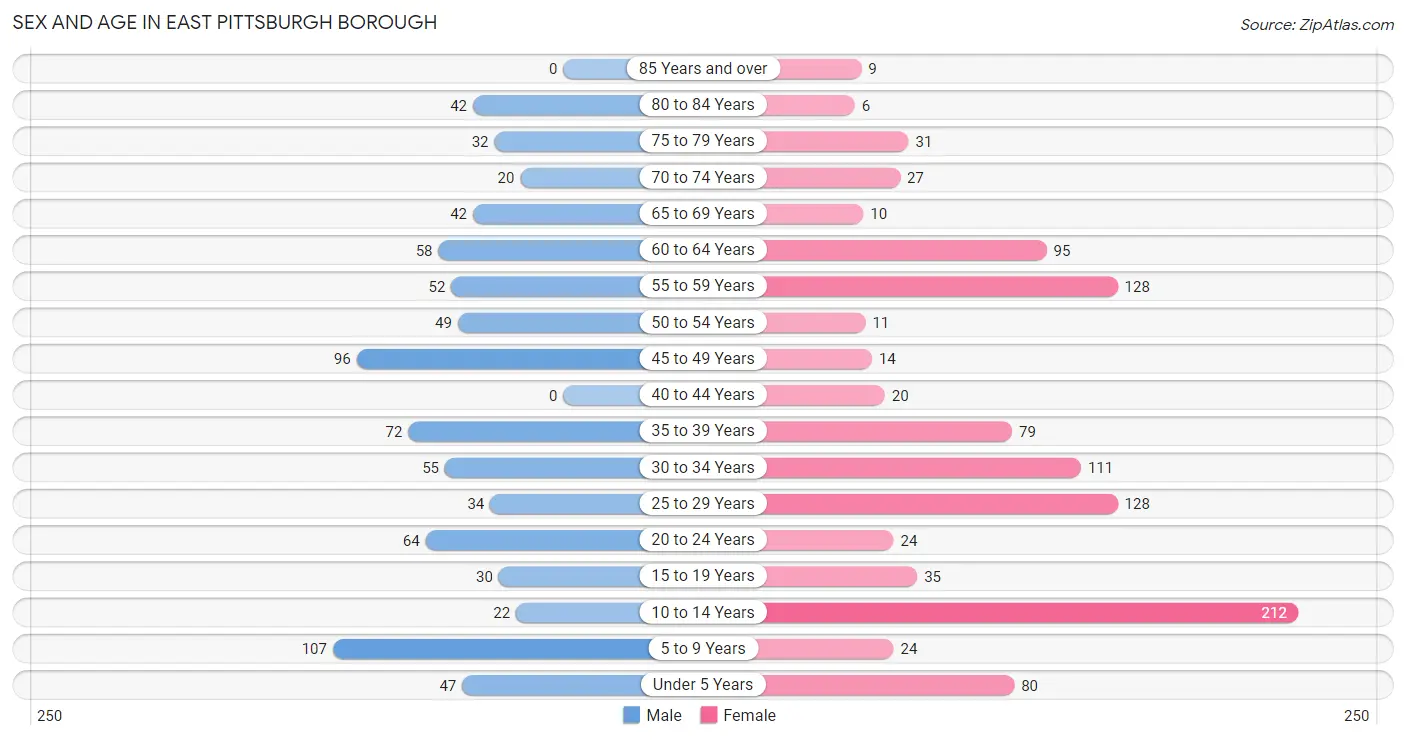
| Age Bracket | Male | Female |
| Under 5 Years | 47 (5.7%) | 80 (7.7%) |
| 5 to 9 Years | 107 (13.0%) | 24 (2.3%) |
| 10 to 14 Years | 22 (2.7%) | 212 (20.3%) |
| 15 to 19 Years | 30 (3.6%) | 35 (3.4%) |
| 20 to 24 Years | 64 (7.8%) | 24 (2.3%) |
| 25 to 29 Years | 34 (4.1%) | 128 (12.3%) |
| 30 to 34 Years | 55 (6.7%) | 111 (10.6%) |
| 35 to 39 Years | 72 (8.8%) | 79 (7.6%) |
| 40 to 44 Years | 0 (0.0%) | 20 (1.9%) |
| 45 to 49 Years | 96 (11.7%) | 14 (1.3%) |
| 50 to 54 Years | 49 (6.0%) | 11 (1.1%) |
| 55 to 59 Years | 52 (6.3%) | 128 (12.3%) |
| 60 to 64 Years | 58 (7.1%) | 95 (9.1%) |
| 65 to 69 Years | 42 (5.1%) | 10 (1.0%) |
| 70 to 74 Years | 20 (2.4%) | 27 (2.6%) |
| 75 to 79 Years | 32 (3.9%) | 31 (3.0%) |
| 80 to 84 Years | 42 (5.1%) | 6 (0.6%) |
| 85 Years and over | 0 (0.0%) | 9 (0.9%) |
| Total | 822 (100.0%) | 1,044 (100.0%) |
Families and Households in East Pittsburgh borough
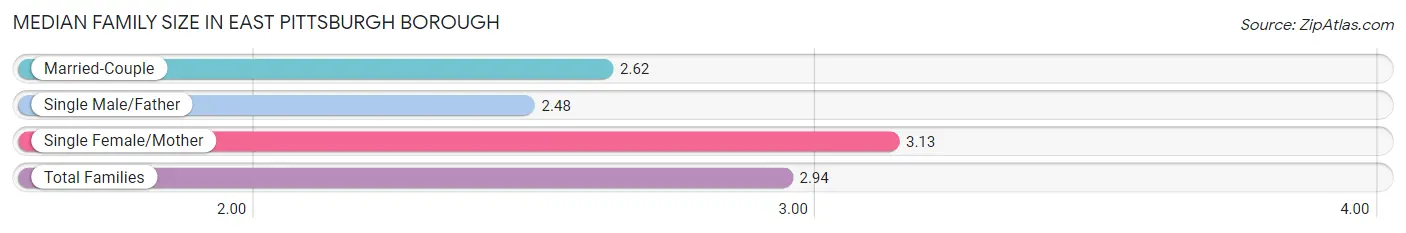
Median Family Size in East Pittsburgh borough
The median family size in East Pittsburgh borough is 2.94 persons per family, with single female/mother families (336 | 69.9%) accounting for the largest median family size of 3.13 persons per family. On the other hand, single male/father families (103 | 21.4%) represent the smallest median family size with 2.48 persons per family.
| Family Type | # Families | Family Size |
| Married-Couple | 42 (8.7%) | 2.62 |
| Single Male/Father | 103 (21.4%) | 2.48 |
| Single Female/Mother | 336 (69.9%) | 3.13 |
| Total Families | 481 (100.0%) | 2.94 |
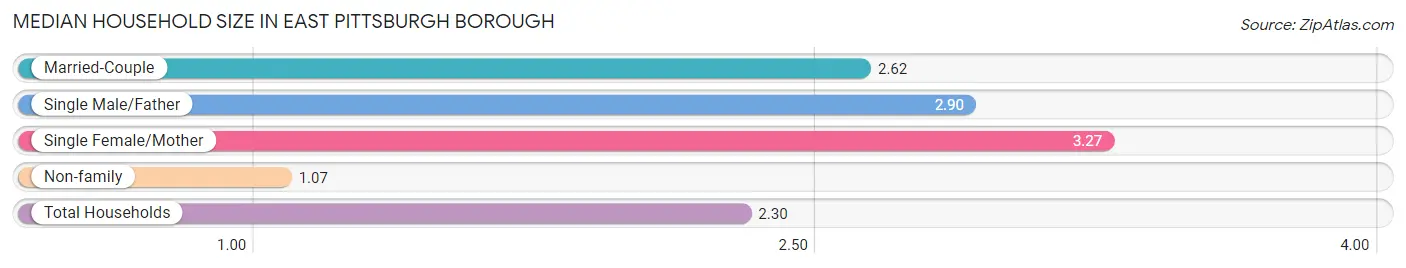
Median Household Size in East Pittsburgh borough
The median household size in East Pittsburgh borough is 2.30 persons per household, with single female/mother households (336 | 41.5%) accounting for the largest median household size of 3.27 persons per household. non-family households (328 | 40.5%) represent the smallest median household size with 1.07 persons per household.
| Household Type | # Households | Household Size |
| Married-Couple | 42 (5.2%) | 2.62 |
| Single Male/Father | 103 (12.7%) | 2.90 |
| Single Female/Mother | 336 (41.5%) | 3.27 |
| Non-family | 328 (40.5%) | 1.07 |
| Total Households | 809 (100.0%) | 2.30 |
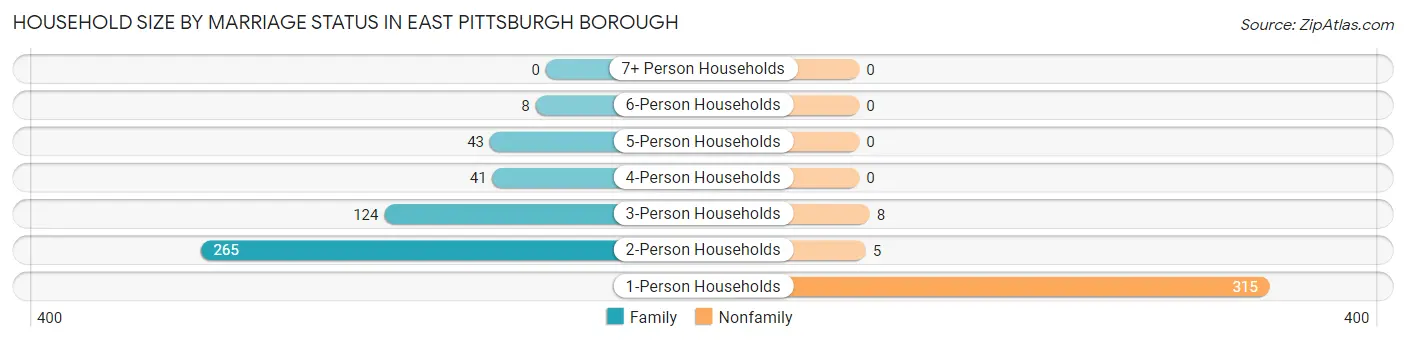
Household Size by Marriage Status in East Pittsburgh borough
Out of a total of 809 households in East Pittsburgh borough, 481 (59.5%) are family households, while 328 (40.5%) are nonfamily households. The most numerous type of family households are 2-person households, comprising 265, and the most common type of nonfamily households are 1-person households, comprising 315.
| Household Size | Family Households | Nonfamily Households |
| 1-Person Households | - | 315 (38.9%) |
| 2-Person Households | 265 (32.8%) | 5 (0.6%) |
| 3-Person Households | 124 (15.3%) | 8 (1.0%) |
| 4-Person Households | 41 (5.1%) | 0 (0.0%) |
| 5-Person Households | 43 (5.3%) | 0 (0.0%) |
| 6-Person Households | 8 (1.0%) | 0 (0.0%) |
| 7+ Person Households | 0 (0.0%) | 0 (0.0%) |
| Total | 481 (59.5%) | 328 (40.5%) |
Female Fertility in East Pittsburgh borough
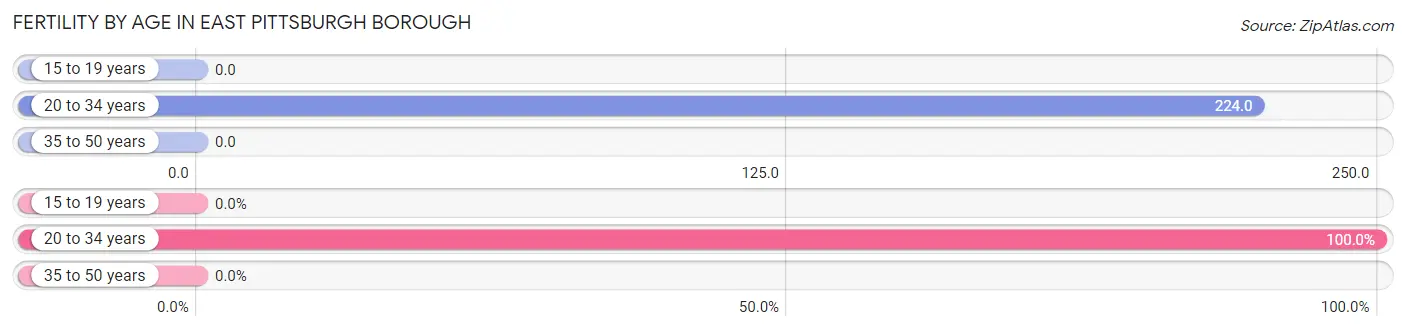
Fertility by Age in East Pittsburgh borough
Average fertility rate in East Pittsburgh borough is 144.0 births per 1,000 women. Women in the age bracket of 20 to 34 years have the highest fertility rate with 224.0 births per 1,000 women. Women in the age bracket of 20 to 34 years acount for 100.0% of all women with births.
| Age Bracket | Women with Births | Births / 1,000 Women |
| 15 to 19 years | 0 (0.0%) | 0.0 |
| 20 to 34 years | 59 (100.0%) | 224.0 |
| 35 to 50 years | 0 (0.0%) | 0.0 |
| Total | 59 (100.0%) | 144.0 |
Fertility by Age by Marriage Status in East Pittsburgh borough
37.3% of women with births (59) in East Pittsburgh borough are married. The highest percentage of unmarried women with births falls into 20 to 34 years age bracket with 62.7% of them unmarried at the time of birth, while the lowest percentage of unmarried women with births belong to 20 to 34 years age bracket with 62.7% of them unmarried.
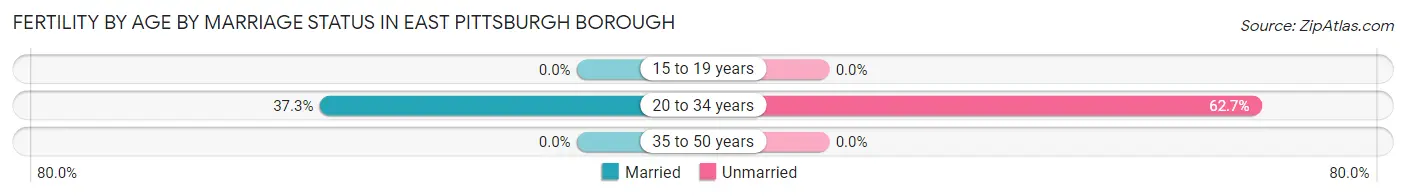
| Age Bracket | Married | Unmarried |
| 15 to 19 years | 0 (0.0%) | 0 (0.0%) |
| 20 to 34 years | 22 (37.3%) | 37 (62.7%) |
| 35 to 50 years | 0 (0.0%) | 0 (0.0%) |
| Total | 22 (37.3%) | 37 (62.7%) |
Fertility by Education in East Pittsburgh borough
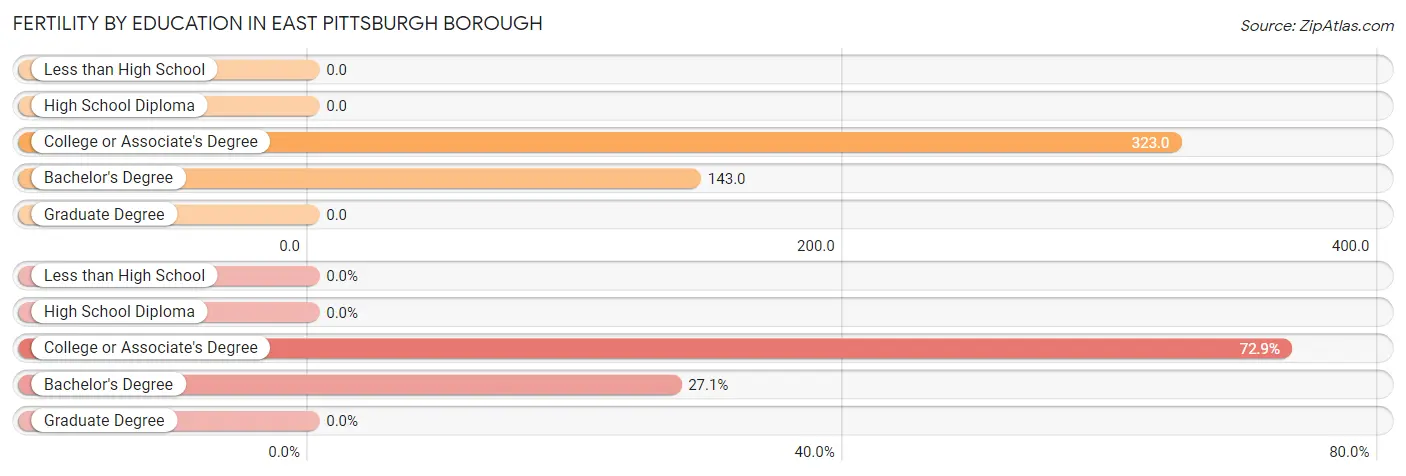
| Educational Attainment | Women with Births | Births / 1,000 Women |
| Less than High School | 0 (0.0%) | 0.0 |
| High School Diploma | 0 (0.0%) | 0.0 |
| College or Associate's Degree | 43 (72.9%) | 323.0 |
| Bachelor's Degree | 16 (27.1%) | 143.0 |
| Graduate Degree | 0 (0.0%) | 0.0 |
| Total | 59 (100.0%) | 144.0 |
Fertility by Education by Marriage Status in East Pittsburgh borough
62.7% of women with births in East Pittsburgh borough are unmarried. Women with the educational attainment of college or associate's degree are most likely to be married with 51.2% of them married at childbirth, while women with the educational attainment of bachelor's degree are least likely to be married with 100.0% of them unmarried at childbirth.
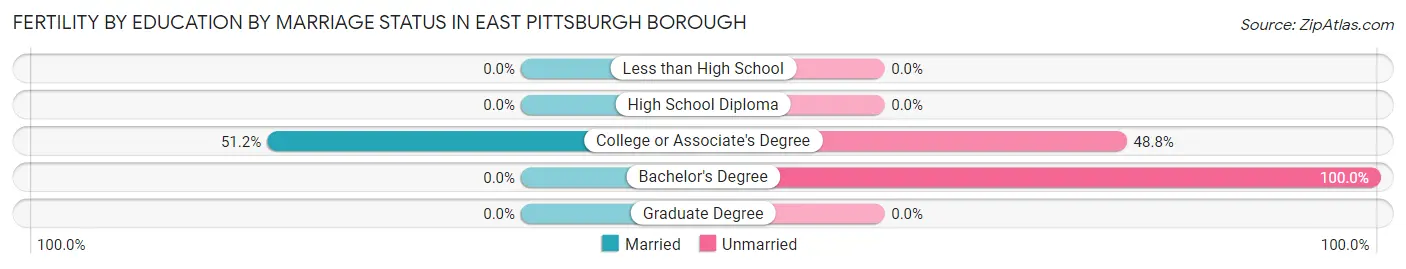
| Educational Attainment | Married | Unmarried |
| Less than High School | 0 (0.0%) | 0 (0.0%) |
| High School Diploma | 0 (0.0%) | 0 (0.0%) |
| College or Associate's Degree | 22 (51.2%) | 21 (48.8%) |
| Bachelor's Degree | 0 (0.0%) | 16 (100.0%) |
| Graduate Degree | 0 (0.0%) | 0 (0.0%) |
| Total | 22 (37.3%) | 37 (62.7%) |
Employment Characteristics in East Pittsburgh borough
Employment by Class of Employer in East Pittsburgh borough
Among the 689 employed individuals in East Pittsburgh borough, private company employees (396 | 57.5%), not-for-profit organizations (110 | 16.0%), and local government employees (89 | 12.9%) make up the most common classes of employment.
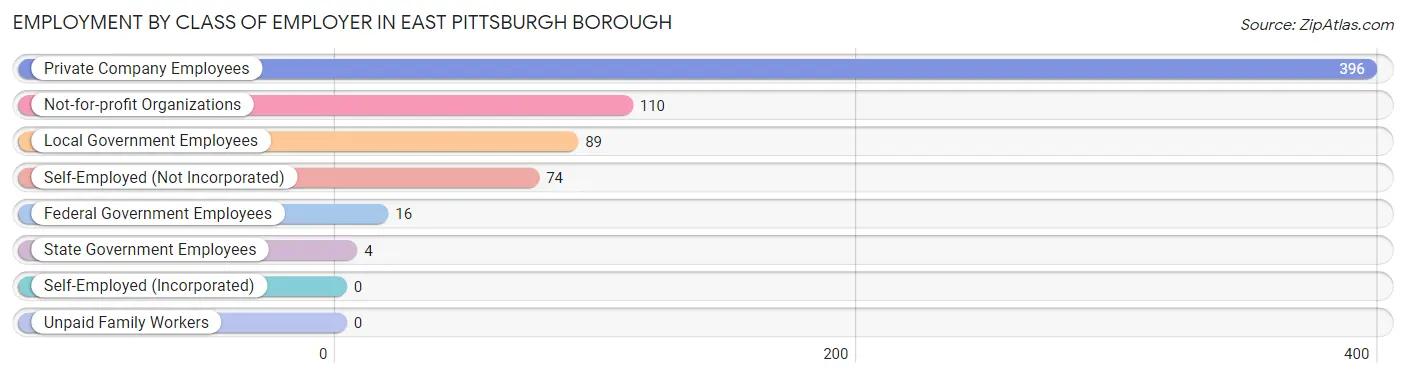
| Employer Class | # Employees | % Employees |
| Private Company Employees | 396 | 57.5% |
| Self-Employed (Incorporated) | 0 | 0.0% |
| Self-Employed (Not Incorporated) | 74 | 10.7% |
| Not-for-profit Organizations | 110 | 16.0% |
| Local Government Employees | 89 | 12.9% |
| State Government Employees | 4 | 0.6% |
| Federal Government Employees | 16 | 2.3% |
| Unpaid Family Workers | 0 | 0.0% |
| Total | 689 | 100.0% |
Employment Status by Age in East Pittsburgh borough
According to the labor force statistics for East Pittsburgh borough, out of the total population over 16 years of age (1,339), 57.8% or 774 individuals are in the labor force, with 5.4% or 42 of them unemployed. The age group with the highest labor force participation rate is 20 to 24 years, with 100.0% or 88 individuals in the labor force. Within the labor force, the 30 to 34 years age range has the highest percentage of unemployed individuals, with 18.7% or 31 of them being unemployed.
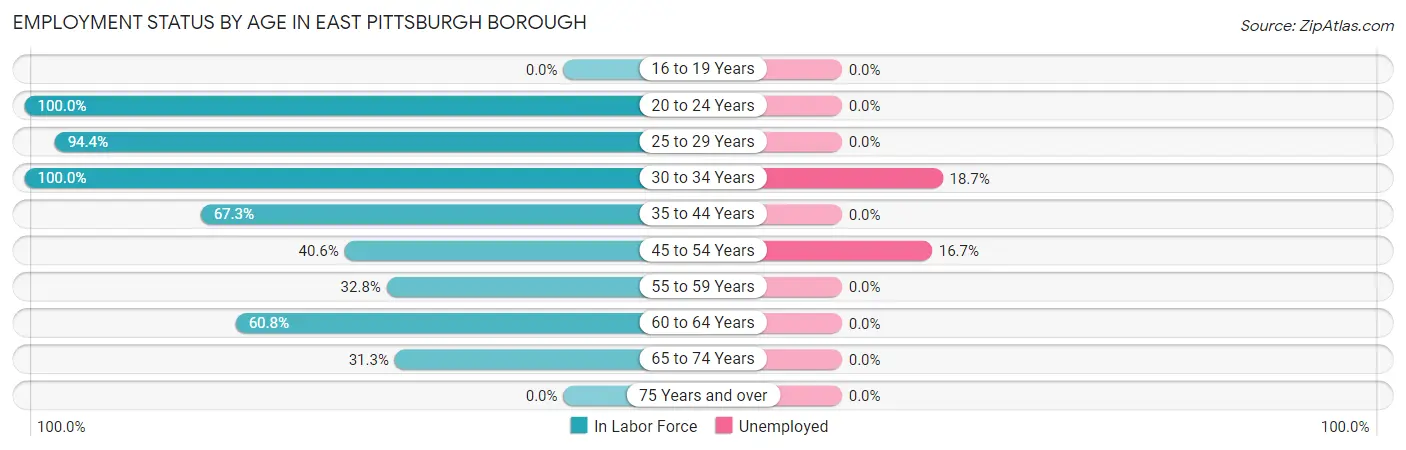
| Age Bracket | In Labor Force | Unemployed |
| 16 to 19 Years | 0 (0.0%) | 0 (0.0%) |
| 20 to 24 Years | 88 (100.0%) | 0 (0.0%) |
| 25 to 29 Years | 153 (94.4%) | 0 (0.0%) |
| 30 to 34 Years | 166 (100.0%) | 31 (18.7%) |
| 35 to 44 Years | 115 (67.3%) | 0 (0.0%) |
| 45 to 54 Years | 69 (40.6%) | 12 (16.7%) |
| 55 to 59 Years | 59 (32.8%) | 0 (0.0%) |
| 60 to 64 Years | 93 (60.8%) | 0 (0.0%) |
| 65 to 74 Years | 31 (31.3%) | 0 (0.0%) |
| 75 Years and over | 0 (0.0%) | 0 (0.0%) |
| Total | 774 (57.8%) | 42 (5.4%) |
Employment Status by Educational Attainment in East Pittsburgh borough
According to labor force statistics for East Pittsburgh borough, 65.4% of individuals (655) out of the total population between 25 and 64 years of age (1,002) are in the labor force, with 6.3% or 41 of them being unemployed. The group with the highest labor force participation rate are those with the educational attainment of less than high school, with 100.0% or 9 individuals in the labor force. Within the labor force, individuals with college / associate degree education have the highest percentage of unemployment, with 10.6% or 32 of them being unemployed.
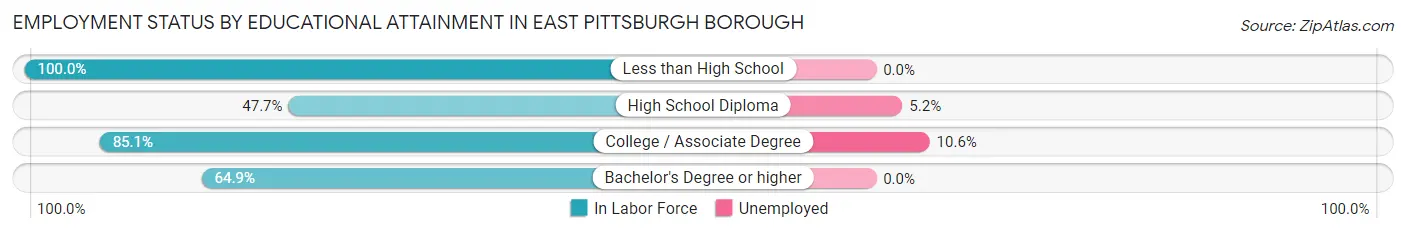
| Educational Attainment | In Labor Force | Unemployed |
| Less than High School | 9 (100.0%) | 0 (0.0%) |
| High School Diploma | 194 (47.7%) | 21 (5.2%) |
| College / Associate Degree | 302 (85.1%) | 38 (10.6%) |
| Bachelor's Degree or higher | 150 (64.9%) | 0 (0.0%) |
| Total | 655 (65.4%) | 63 (6.3%) |
Employment Occupations by Sex in East Pittsburgh borough
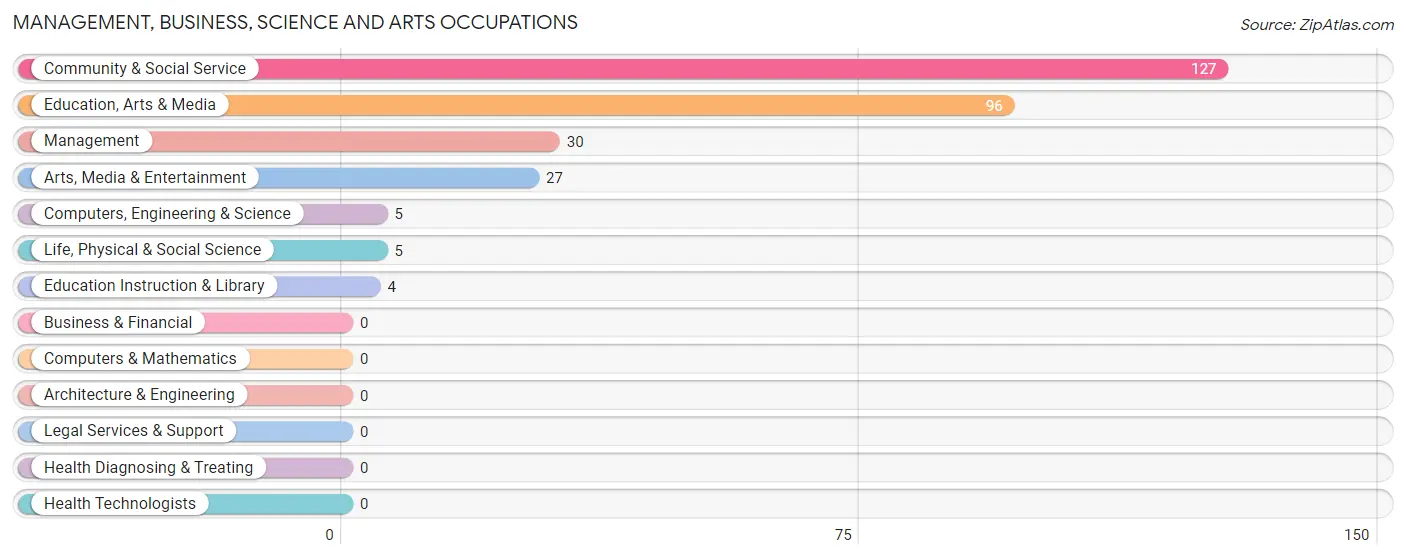
Management, Business, Science and Arts Occupations
The most common Management, Business, Science and Arts occupations in East Pittsburgh borough are Community & Social Service (127 | 17.5%), Education, Arts & Media (96 | 13.3%), Management (30 | 4.1%), Arts, Media & Entertainment (27 | 3.7%), and Computers, Engineering & Science (5 | 0.7%).
Management, Business, Science and Arts Occupations by Sex
Within the Management, Business, Science and Arts occupations in East Pittsburgh borough, the most male-oriented occupations are Computers, Engineering & Science (100.0%), Life, Physical & Social Science (100.0%), and Education Instruction & Library (100.0%), while the most female-oriented occupations are Management (100.0%), Education, Arts & Media (100.0%), and Community & Social Service (75.6%).
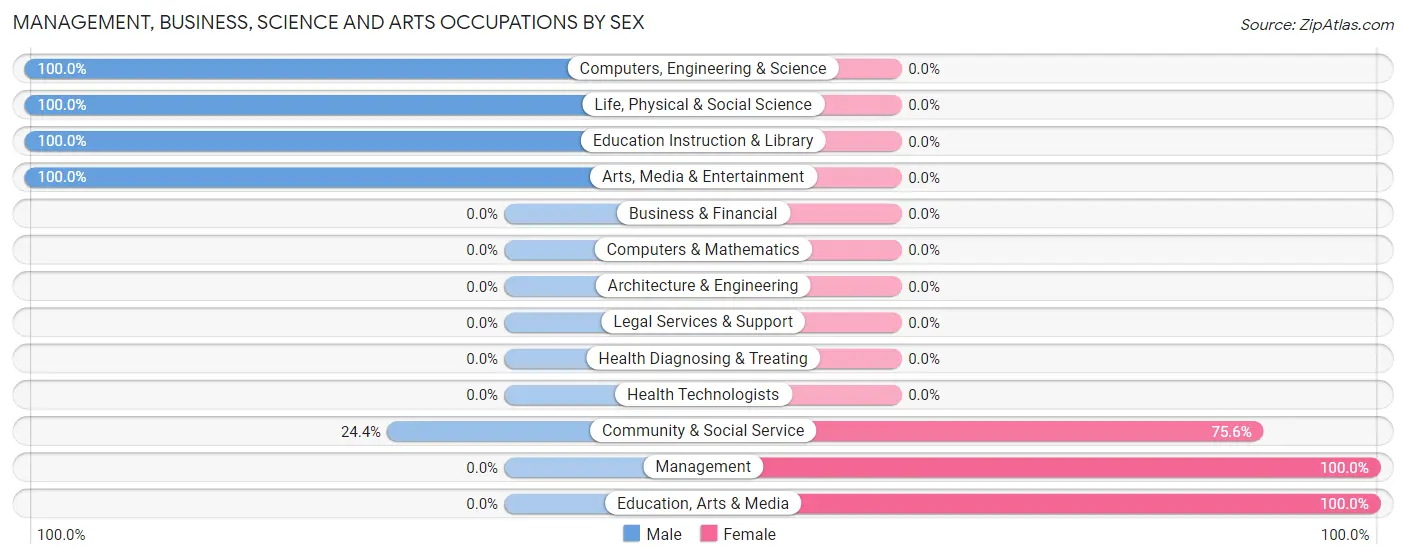
| Occupation | Male | Female |
| Management | 0 (0.0%) | 30 (100.0%) |
| Business & Financial | 0 (0.0%) | 0 (0.0%) |
| Computers, Engineering & Science | 5 (100.0%) | 0 (0.0%) |
| Computers & Mathematics | 0 (0.0%) | 0 (0.0%) |
| Architecture & Engineering | 0 (0.0%) | 0 (0.0%) |
| Life, Physical & Social Science | 5 (100.0%) | 0 (0.0%) |
| Community & Social Service | 31 (24.4%) | 96 (75.6%) |
| Education, Arts & Media | 0 (0.0%) | 96 (100.0%) |
| Legal Services & Support | 0 (0.0%) | 0 (0.0%) |
| Education Instruction & Library | 4 (100.0%) | 0 (0.0%) |
| Arts, Media & Entertainment | 27 (100.0%) | 0 (0.0%) |
| Health Diagnosing & Treating | 0 (0.0%) | 0 (0.0%) |
| Health Technologists | 0 (0.0%) | 0 (0.0%) |
| Total (Category) | 36 (22.2%) | 126 (77.8%) |
| Total (Overall) | 294 (40.6%) | 430 (59.4%) |
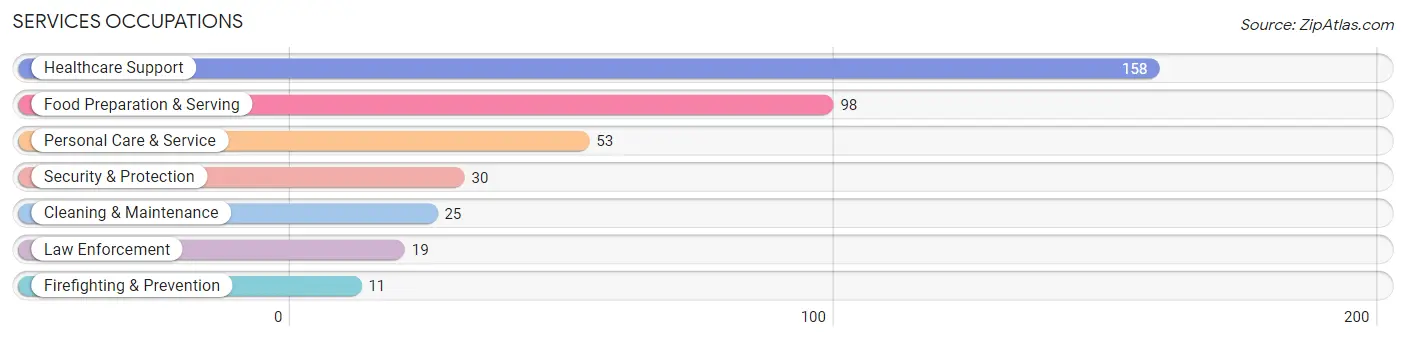
Services Occupations
The most common Services occupations in East Pittsburgh borough are Healthcare Support (158 | 21.8%), Food Preparation & Serving (98 | 13.5%), Personal Care & Service (53 | 7.3%), Security & Protection (30 | 4.1%), and Cleaning & Maintenance (25 | 3.5%).
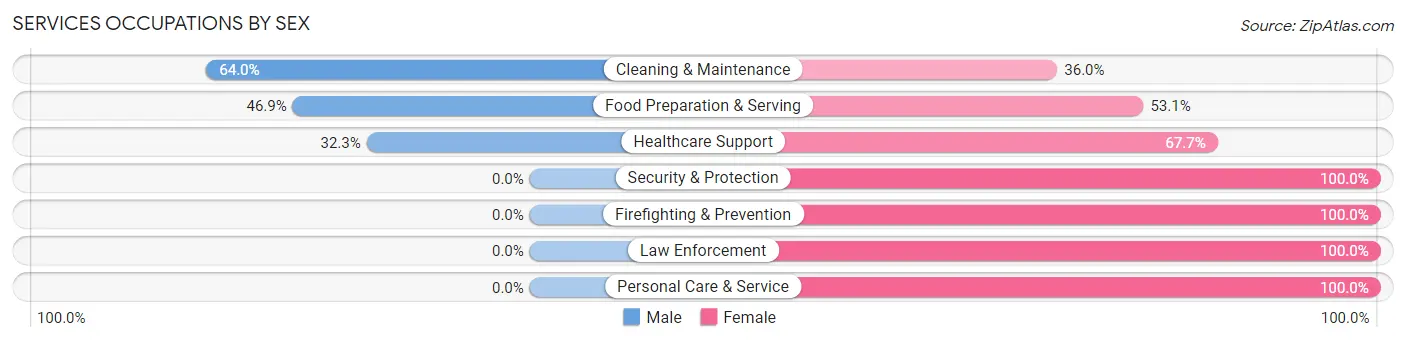
Services Occupations by Sex
Within the Services occupations in East Pittsburgh borough, the most male-oriented occupations are Cleaning & Maintenance (64.0%), Food Preparation & Serving (46.9%), and Healthcare Support (32.3%), while the most female-oriented occupations are Security & Protection (100.0%), Firefighting & Prevention (100.0%), and Law Enforcement (100.0%).
| Occupation | Male | Female |
| Healthcare Support | 51 (32.3%) | 107 (67.7%) |
| Security & Protection | 0 (0.0%) | 30 (100.0%) |
| Firefighting & Prevention | 0 (0.0%) | 11 (100.0%) |
| Law Enforcement | 0 (0.0%) | 19 (100.0%) |
| Food Preparation & Serving | 46 (46.9%) | 52 (53.1%) |
| Cleaning & Maintenance | 16 (64.0%) | 9 (36.0%) |
| Personal Care & Service | 0 (0.0%) | 53 (100.0%) |
| Total (Category) | 113 (31.0%) | 251 (69.0%) |
| Total (Overall) | 294 (40.6%) | 430 (59.4%) |
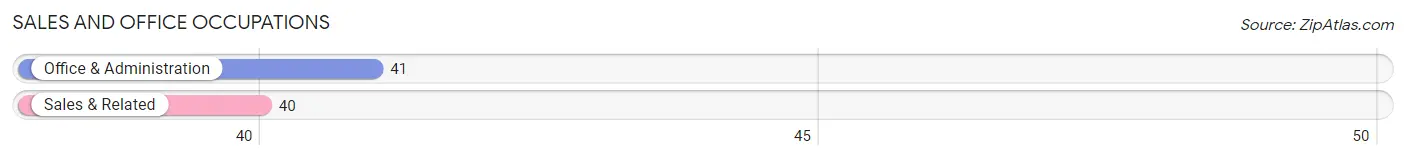
Sales and Office Occupations
The most common Sales and Office occupations in East Pittsburgh borough are Office & Administration (41 | 5.7%), and Sales & Related (40 | 5.5%).
Sales and Office Occupations by Sex
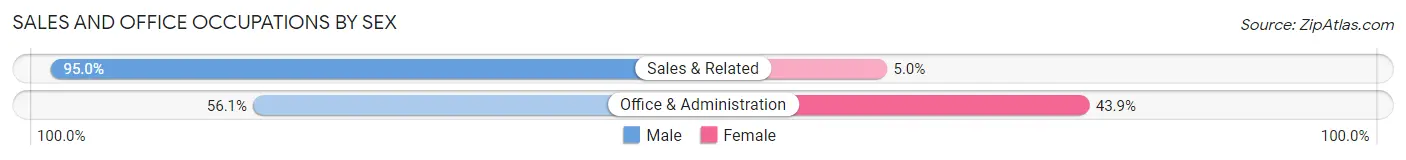
| Occupation | Male | Female |
| Sales & Related | 38 (95.0%) | 2 (5.0%) |
| Office & Administration | 23 (56.1%) | 18 (43.9%) |
| Total (Category) | 61 (75.3%) | 20 (24.7%) |
| Total (Overall) | 294 (40.6%) | 430 (59.4%) |
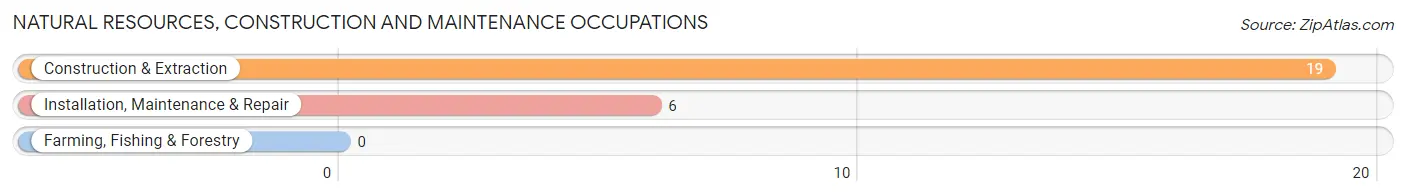
Natural Resources, Construction and Maintenance Occupations
The most common Natural Resources, Construction and Maintenance occupations in East Pittsburgh borough are Construction & Extraction (19 | 2.6%), and Installation, Maintenance & Repair (6 | 0.8%).
Natural Resources, Construction and Maintenance Occupations by Sex
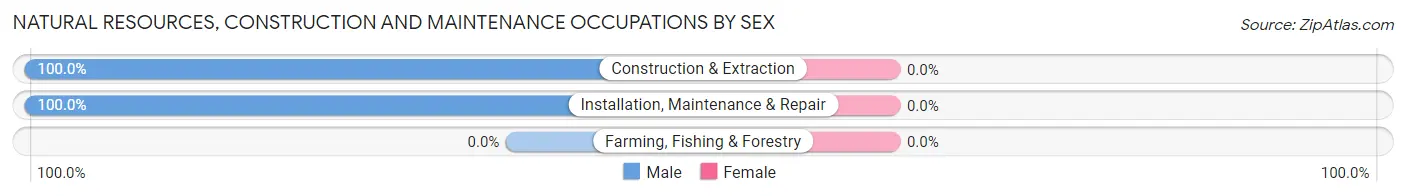
| Occupation | Male | Female |
| Farming, Fishing & Forestry | 0 (0.0%) | 0 (0.0%) |
| Construction & Extraction | 19 (100.0%) | 0 (0.0%) |
| Installation, Maintenance & Repair | 6 (100.0%) | 0 (0.0%) |
| Total (Category) | 25 (100.0%) | 0 (0.0%) |
| Total (Overall) | 294 (40.6%) | 430 (59.4%) |
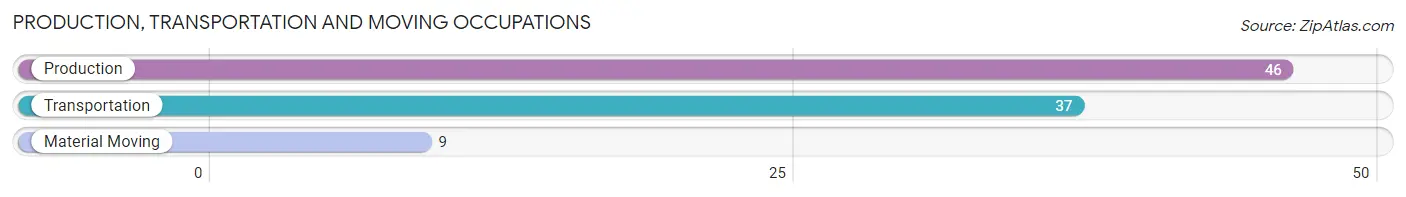
Production, Transportation and Moving Occupations
The most common Production, Transportation and Moving occupations in East Pittsburgh borough are Production (46 | 6.4%), Transportation (37 | 5.1%), and Material Moving (9 | 1.2%).
Production, Transportation and Moving Occupations by Sex
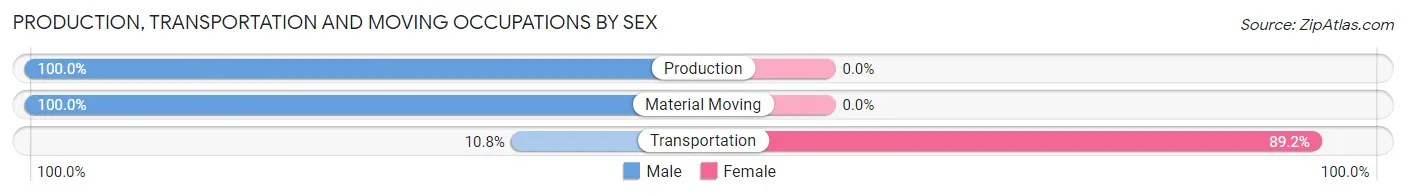
| Occupation | Male | Female |
| Production | 46 (100.0%) | 0 (0.0%) |
| Transportation | 4 (10.8%) | 33 (89.2%) |
| Material Moving | 9 (100.0%) | 0 (0.0%) |
| Total (Category) | 59 (64.1%) | 33 (35.9%) |
| Total (Overall) | 294 (40.6%) | 430 (59.4%) |
Employment Industries by Sex in East Pittsburgh borough
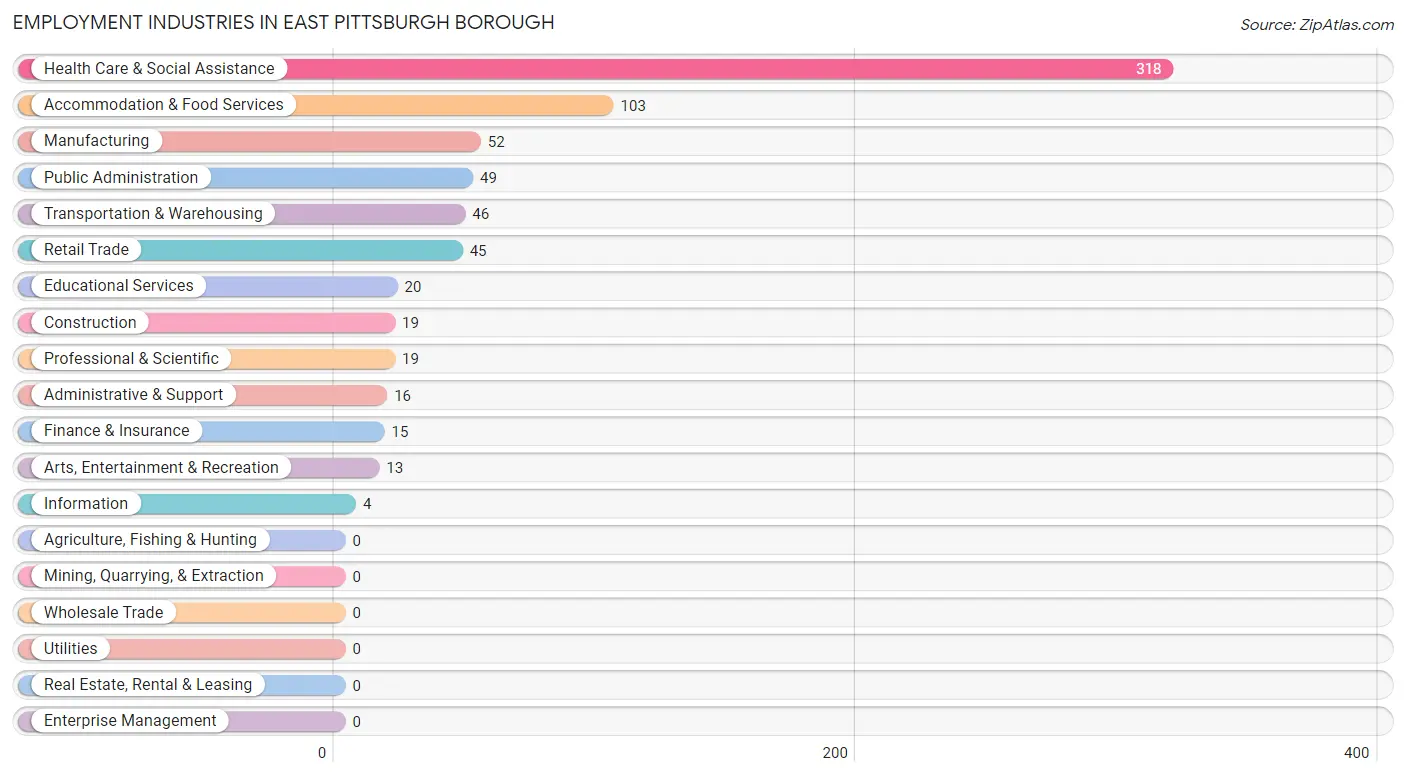
Employment Industries in East Pittsburgh borough
The major employment industries in East Pittsburgh borough include Health Care & Social Assistance (318 | 43.9%), Accommodation & Food Services (103 | 14.2%), Manufacturing (52 | 7.2%), Public Administration (49 | 6.8%), and Transportation & Warehousing (46 | 6.4%).
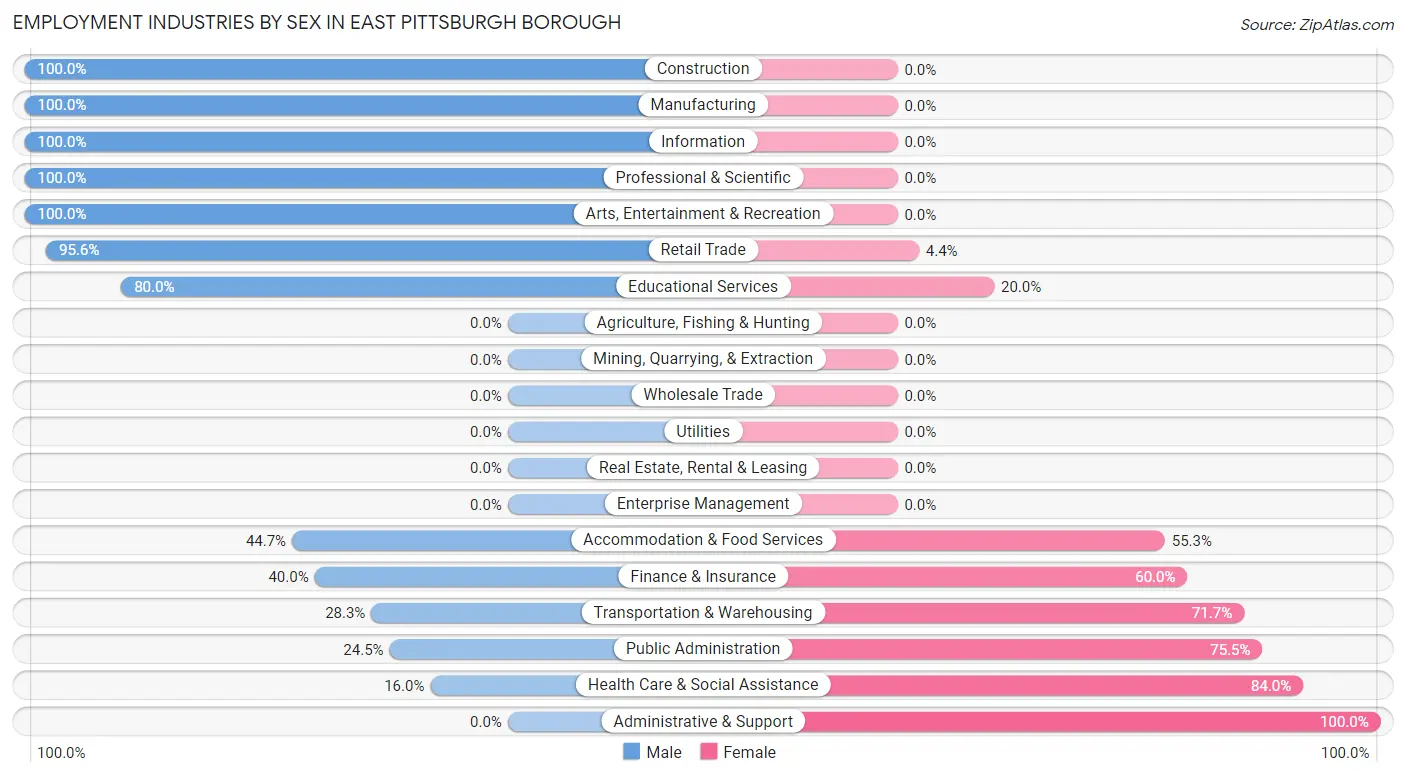
Employment Industries by Sex in East Pittsburgh borough
The East Pittsburgh borough industries that see more men than women are Construction (100.0%), Manufacturing (100.0%), and Information (100.0%), whereas the industries that tend to have a higher number of women are Administrative & Support (100.0%), Health Care & Social Assistance (84.0%), and Public Administration (75.5%).
| Industry | Male | Female |
| Agriculture, Fishing & Hunting | 0 (0.0%) | 0 (0.0%) |
| Mining, Quarrying, & Extraction | 0 (0.0%) | 0 (0.0%) |
| Construction | 19 (100.0%) | 0 (0.0%) |
| Manufacturing | 52 (100.0%) | 0 (0.0%) |
| Wholesale Trade | 0 (0.0%) | 0 (0.0%) |
| Retail Trade | 43 (95.6%) | 2 (4.4%) |
| Transportation & Warehousing | 13 (28.3%) | 33 (71.7%) |
| Utilities | 0 (0.0%) | 0 (0.0%) |
| Information | 4 (100.0%) | 0 (0.0%) |
| Finance & Insurance | 6 (40.0%) | 9 (60.0%) |
| Real Estate, Rental & Leasing | 0 (0.0%) | 0 (0.0%) |
| Professional & Scientific | 19 (100.0%) | 0 (0.0%) |
| Enterprise Management | 0 (0.0%) | 0 (0.0%) |
| Administrative & Support | 0 (0.0%) | 16 (100.0%) |
| Educational Services | 16 (80.0%) | 4 (20.0%) |
| Health Care & Social Assistance | 51 (16.0%) | 267 (84.0%) |
| Arts, Entertainment & Recreation | 13 (100.0%) | 0 (0.0%) |
| Accommodation & Food Services | 46 (44.7%) | 57 (55.3%) |
| Public Administration | 12 (24.5%) | 37 (75.5%) |
| Total | 294 (40.6%) | 430 (59.4%) |
Education in East Pittsburgh borough
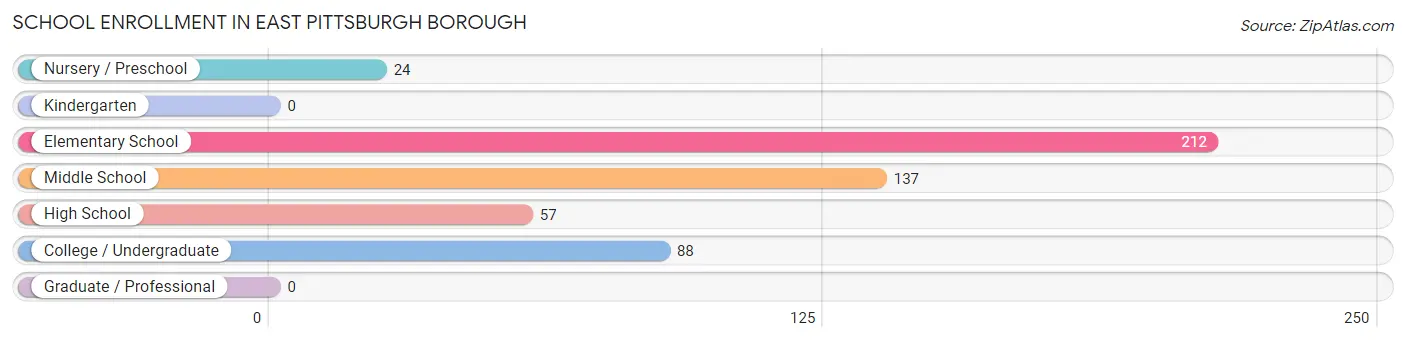
School Enrollment in East Pittsburgh borough
The most common levels of schooling among the 518 students in East Pittsburgh borough are elementary school (212 | 40.9%), middle school (137 | 26.5%), and college / undergraduate (88 | 17.0%).
| School Level | # Students | % Students |
| Nursery / Preschool | 24 | 4.6% |
| Kindergarten | 0 | 0.0% |
| Elementary School | 212 | 40.9% |
| Middle School | 137 | 26.5% |
| High School | 57 | 11.0% |
| College / Undergraduate | 88 | 17.0% |
| Graduate / Professional | 0 | 0.0% |
| Total | 518 | 100.0% |
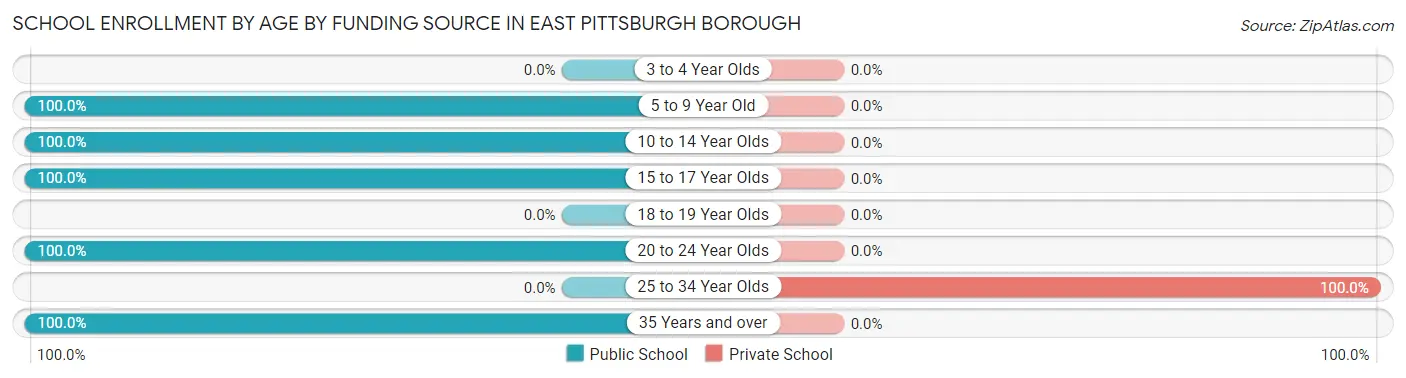
School Enrollment by Age by Funding Source in East Pittsburgh borough
Out of a total of 518 students who are enrolled in schools in East Pittsburgh borough, 5 (1.0%) attend a private institution, while the remaining 513 (99.0%) are enrolled in public schools. The age group of 25 to 34 year olds has the highest likelihood of being enrolled in private schools, with 5 (100.0% in the age bracket) enrolled. Conversely, the age group of 5 to 9 year old has the lowest likelihood of being enrolled in a private school, with 131 (100.0% in the age bracket) attending a public institution.
| Age Bracket | Public School | Private School |
| 3 to 4 Year Olds | 0 (0.0%) | 0 (0.0%) |
| 5 to 9 Year Old | 131 (100.0%) | 0 (0.0%) |
| 10 to 14 Year Olds | 234 (100.0%) | 0 (0.0%) |
| 15 to 17 Year Olds | 65 (100.0%) | 0 (0.0%) |
| 18 to 19 Year Olds | 0 (0.0%) | 0 (0.0%) |
| 20 to 24 Year Olds | 58 (100.0%) | 0 (0.0%) |
| 25 to 34 Year Olds | 0 (0.0%) | 5 (100.0%) |
| 35 Years and over | 25 (100.0%) | 0 (0.0%) |
| Total | 513 (99.0%) | 5 (1.0%) |
Educational Attainment by Field of Study in East Pittsburgh borough
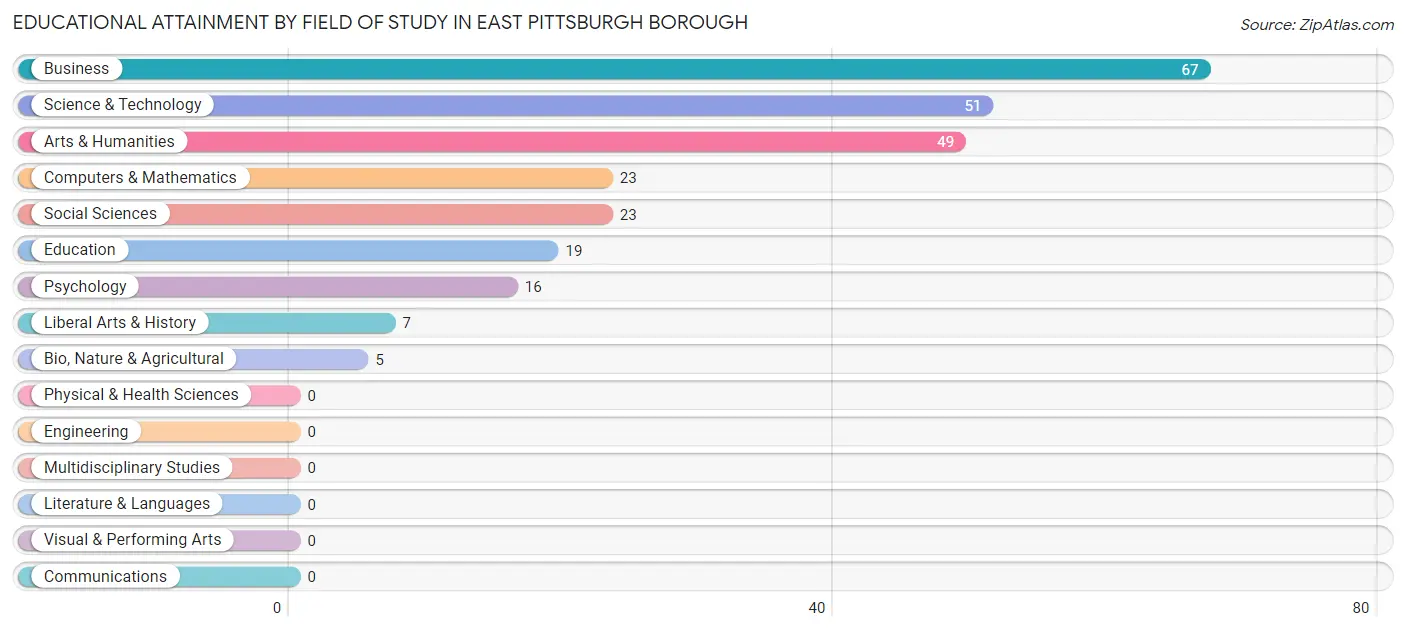
Business (67 | 25.8%), science & technology (51 | 19.6%), arts & humanities (49 | 18.9%), computers & mathematics (23 | 8.8%), and social sciences (23 | 8.8%) are the most common fields of study among 260 individuals in East Pittsburgh borough who have obtained a bachelor's degree or higher.
| Field of Study | # Graduates | % Graduates |
| Computers & Mathematics | 23 | 8.8% |
| Bio, Nature & Agricultural | 5 | 1.9% |
| Physical & Health Sciences | 0 | 0.0% |
| Psychology | 16 | 6.1% |
| Social Sciences | 23 | 8.8% |
| Engineering | 0 | 0.0% |
| Multidisciplinary Studies | 0 | 0.0% |
| Science & Technology | 51 | 19.6% |
| Business | 67 | 25.8% |
| Education | 19 | 7.3% |
| Literature & Languages | 0 | 0.0% |
| Liberal Arts & History | 7 | 2.7% |
| Visual & Performing Arts | 0 | 0.0% |
| Communications | 0 | 0.0% |
| Arts & Humanities | 49 | 18.9% |
| Total | 260 | 100.0% |
Transportation & Commute in East Pittsburgh borough
Vehicle Availability by Sex in East Pittsburgh borough
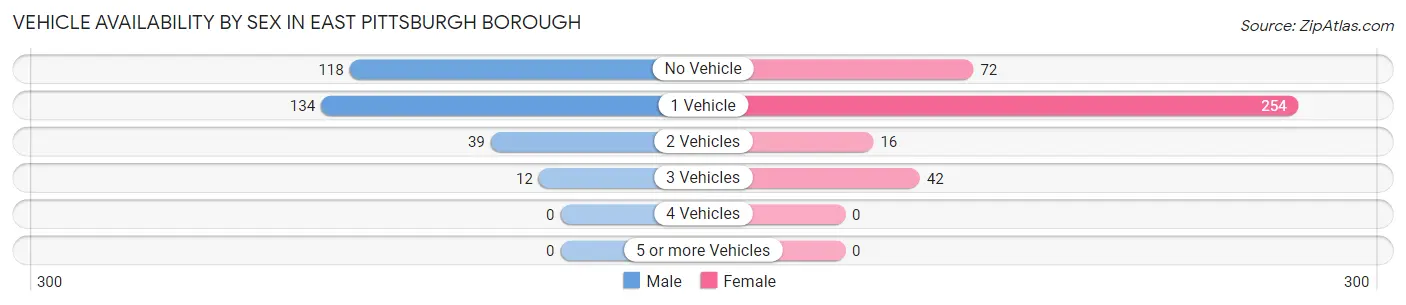
The most prevalent vehicle ownership categories in East Pittsburgh borough are males with 1 vehicle (134, accounting for 44.2%) and females with 1 vehicle (254, making up 34.9%).
| Vehicles Available | Male | Female |
| No Vehicle | 118 (38.9%) | 72 (18.8%) |
| 1 Vehicle | 134 (44.2%) | 254 (66.1%) |
| 2 Vehicles | 39 (12.9%) | 16 (4.2%) |
| 3 Vehicles | 12 (4.0%) | 42 (10.9%) |
| 4 Vehicles | 0 (0.0%) | 0 (0.0%) |
| 5 or more Vehicles | 0 (0.0%) | 0 (0.0%) |
| Total | 303 (100.0%) | 384 (100.0%) |
Commute Time in East Pittsburgh borough
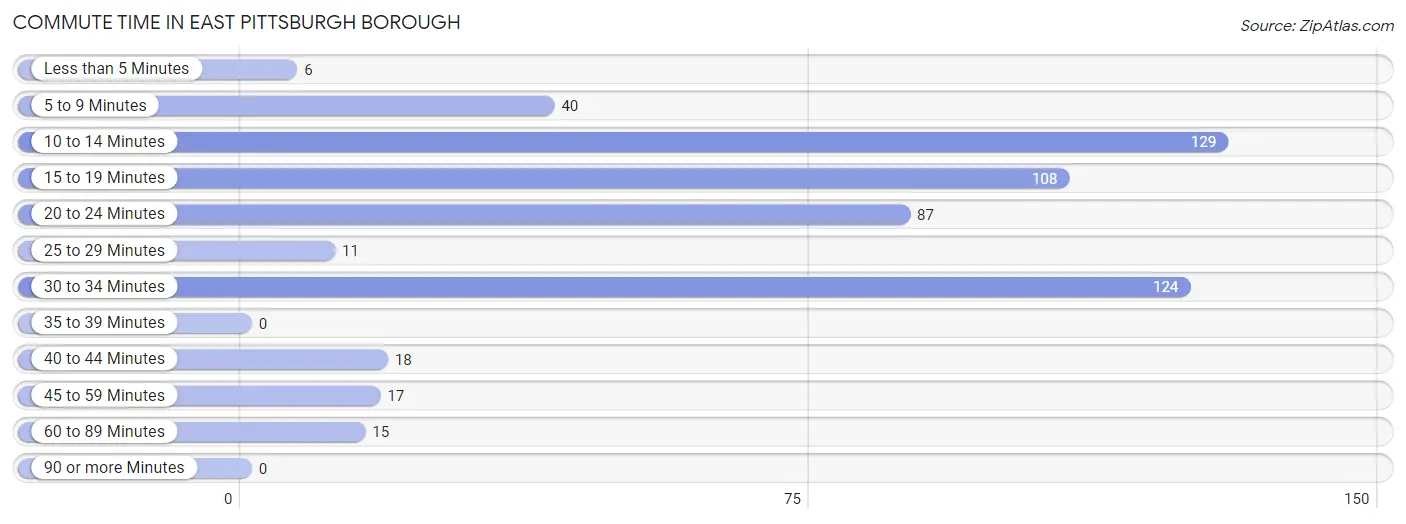
The most frequently occuring commute durations in East Pittsburgh borough are 10 to 14 minutes (129 commuters, 23.2%), 30 to 34 minutes (124 commuters, 22.3%), and 15 to 19 minutes (108 commuters, 19.5%).
| Commute Time | # Commuters | % Commuters |
| Less than 5 Minutes | 6 | 1.1% |
| 5 to 9 Minutes | 40 | 7.2% |
| 10 to 14 Minutes | 129 | 23.2% |
| 15 to 19 Minutes | 108 | 19.5% |
| 20 to 24 Minutes | 87 | 15.7% |
| 25 to 29 Minutes | 11 | 2.0% |
| 30 to 34 Minutes | 124 | 22.3% |
| 35 to 39 Minutes | 0 | 0.0% |
| 40 to 44 Minutes | 18 | 3.2% |
| 45 to 59 Minutes | 17 | 3.1% |
| 60 to 89 Minutes | 15 | 2.7% |
| 90 or more Minutes | 0 | 0.0% |
Commute Time by Sex in East Pittsburgh borough
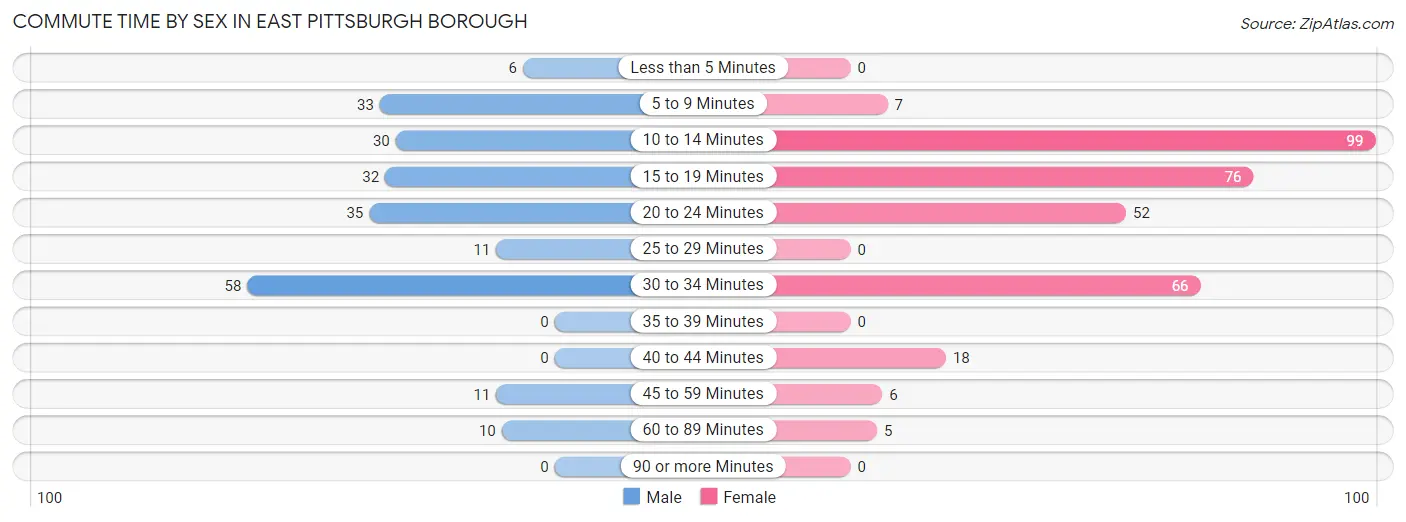
The most common commute times in East Pittsburgh borough are 30 to 34 minutes (58 commuters, 25.7%) for males and 10 to 14 minutes (99 commuters, 30.1%) for females.
| Commute Time | Male | Female |
| Less than 5 Minutes | 6 (2.6%) | 0 (0.0%) |
| 5 to 9 Minutes | 33 (14.6%) | 7 (2.1%) |
| 10 to 14 Minutes | 30 (13.3%) | 99 (30.1%) |
| 15 to 19 Minutes | 32 (14.2%) | 76 (23.1%) |
| 20 to 24 Minutes | 35 (15.5%) | 52 (15.8%) |
| 25 to 29 Minutes | 11 (4.9%) | 0 (0.0%) |
| 30 to 34 Minutes | 58 (25.7%) | 66 (20.1%) |
| 35 to 39 Minutes | 0 (0.0%) | 0 (0.0%) |
| 40 to 44 Minutes | 0 (0.0%) | 18 (5.5%) |
| 45 to 59 Minutes | 11 (4.9%) | 6 (1.8%) |
| 60 to 89 Minutes | 10 (4.4%) | 5 (1.5%) |
| 90 or more Minutes | 0 (0.0%) | 0 (0.0%) |
Time of Departure to Work by Sex in East Pittsburgh borough
The most frequent times of departure to work in East Pittsburgh borough are 12:00 AM to 4:59 AM (44, 19.5%) for males and 9:00 AM to 9:59 AM (122, 37.1%) for females.
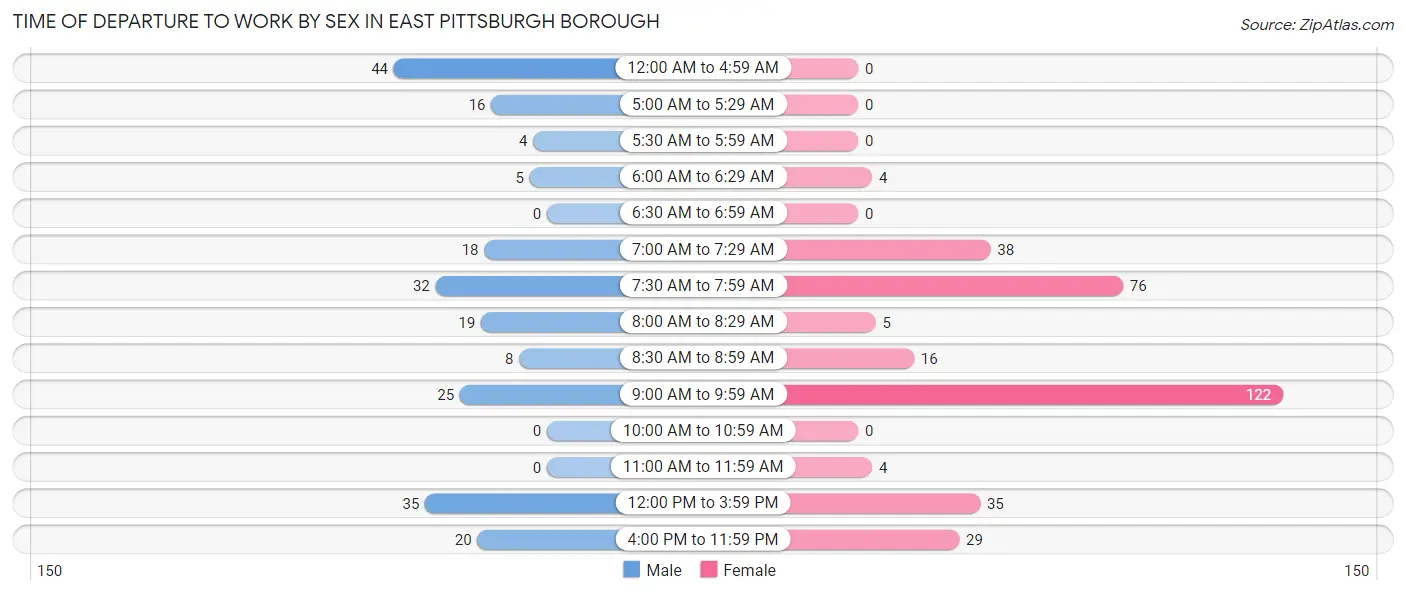
| Time of Departure | Male | Female |
| 12:00 AM to 4:59 AM | 44 (19.5%) | 0 (0.0%) |
| 5:00 AM to 5:29 AM | 16 (7.1%) | 0 (0.0%) |
| 5:30 AM to 5:59 AM | 4 (1.8%) | 0 (0.0%) |
| 6:00 AM to 6:29 AM | 5 (2.2%) | 4 (1.2%) |
| 6:30 AM to 6:59 AM | 0 (0.0%) | 0 (0.0%) |
| 7:00 AM to 7:29 AM | 18 (8.0%) | 38 (11.6%) |
| 7:30 AM to 7:59 AM | 32 (14.2%) | 76 (23.1%) |
| 8:00 AM to 8:29 AM | 19 (8.4%) | 5 (1.5%) |
| 8:30 AM to 8:59 AM | 8 (3.5%) | 16 (4.9%) |
| 9:00 AM to 9:59 AM | 25 (11.1%) | 122 (37.1%) |
| 10:00 AM to 10:59 AM | 0 (0.0%) | 0 (0.0%) |
| 11:00 AM to 11:59 AM | 0 (0.0%) | 4 (1.2%) |
| 12:00 PM to 3:59 PM | 35 (15.5%) | 35 (10.6%) |
| 4:00 PM to 11:59 PM | 20 (8.8%) | 29 (8.8%) |
| Total | 226 (100.0%) | 329 (100.0%) |
Housing Occupancy in East Pittsburgh borough
Occupancy by Ownership in East Pittsburgh borough
Of the total 809 dwellings in East Pittsburgh borough, owner-occupied units account for 233 (28.8%), while renter-occupied units make up 576 (71.2%).
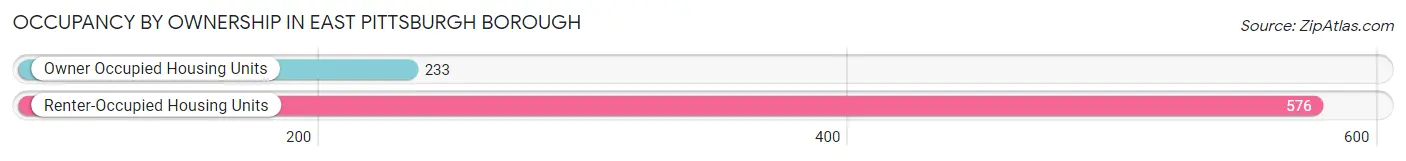
| Occupancy | # Housing Units | % Housing Units |
| Owner Occupied Housing Units | 233 | 28.8% |
| Renter-Occupied Housing Units | 576 | 71.2% |
| Total Occupied Housing Units | 809 | 100.0% |
Occupancy by Household Size in East Pittsburgh borough
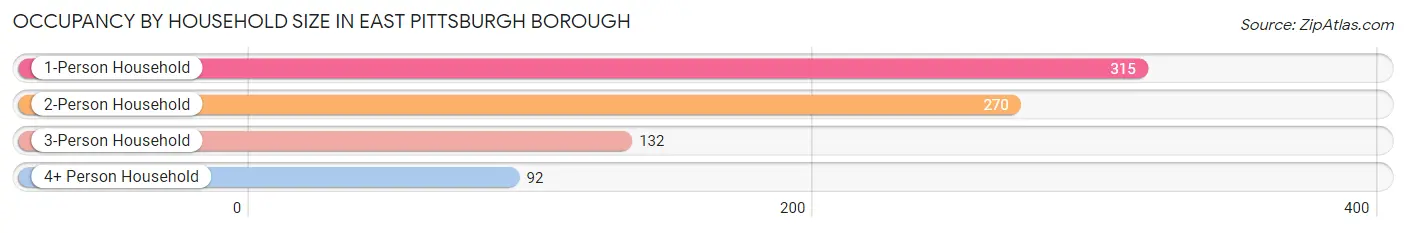
| Household Size | # Housing Units | % Housing Units |
| 1-Person Household | 315 | 38.9% |
| 2-Person Household | 270 | 33.4% |
| 3-Person Household | 132 | 16.3% |
| 4+ Person Household | 92 | 11.4% |
| Total Housing Units | 809 | 100.0% |
Occupancy by Ownership by Household Size in East Pittsburgh borough
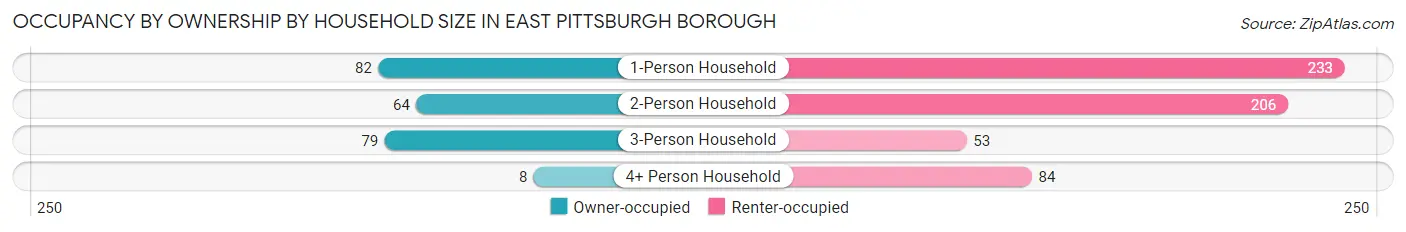
| Household Size | Owner-occupied | Renter-occupied |
| 1-Person Household | 82 (26.0%) | 233 (74.0%) |
| 2-Person Household | 64 (23.7%) | 206 (76.3%) |
| 3-Person Household | 79 (59.9%) | 53 (40.2%) |
| 4+ Person Household | 8 (8.7%) | 84 (91.3%) |
| Total Housing Units | 233 (28.8%) | 576 (71.2%) |
Occupancy by Educational Attainment in East Pittsburgh borough
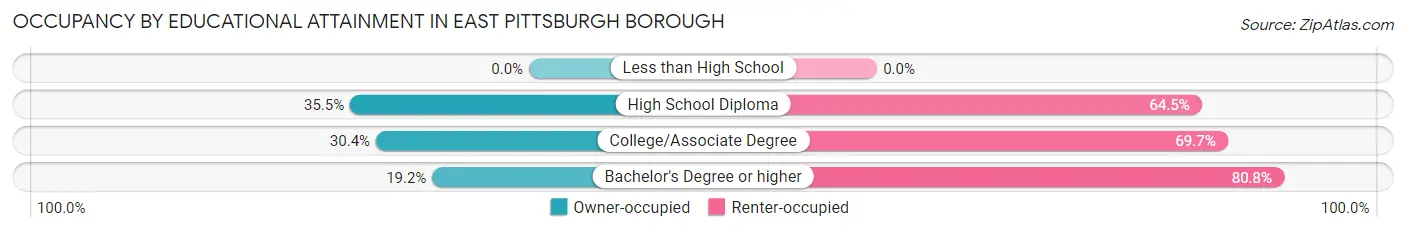
| Household Size | Owner-occupied | Renter-occupied |
| Less than High School | 0 (0.0%) | 0 (0.0%) |
| High School Diploma | 66 (35.5%) | 120 (64.5%) |
| College/Associate Degree | 129 (30.3%) | 296 (69.7%) |
| Bachelor's Degree or higher | 38 (19.2%) | 160 (80.8%) |
Occupancy by Age of Householder in East Pittsburgh borough
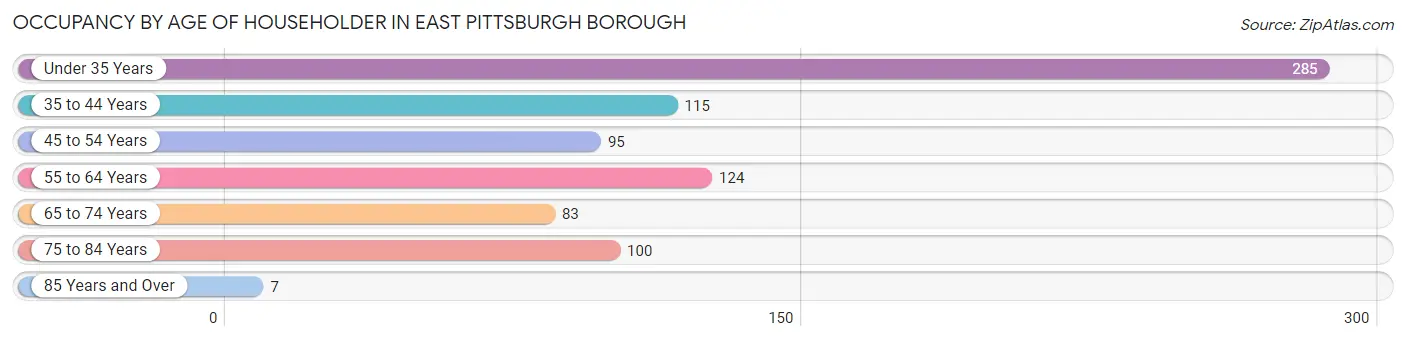
| Age Bracket | # Households | % Households |
| Under 35 Years | 285 | 35.2% |
| 35 to 44 Years | 115 | 14.2% |
| 45 to 54 Years | 95 | 11.7% |
| 55 to 64 Years | 124 | 15.3% |
| 65 to 74 Years | 83 | 10.3% |
| 75 to 84 Years | 100 | 12.4% |
| 85 Years and Over | 7 | 0.9% |
| Total | 809 | 100.0% |
Housing Finances in East Pittsburgh borough
Median Income by Occupancy in East Pittsburgh borough
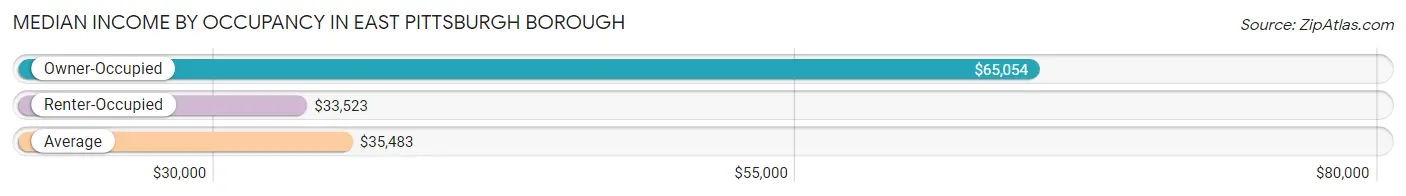
| Occupancy Type | # Households | Median Income |
| Owner-Occupied | 233 (28.8%) | $65,054 |
| Renter-Occupied | 576 (71.2%) | $33,523 |
| Average | 809 (100.0%) | $35,483 |
Occupancy by Householder Income Bracket in East Pittsburgh borough
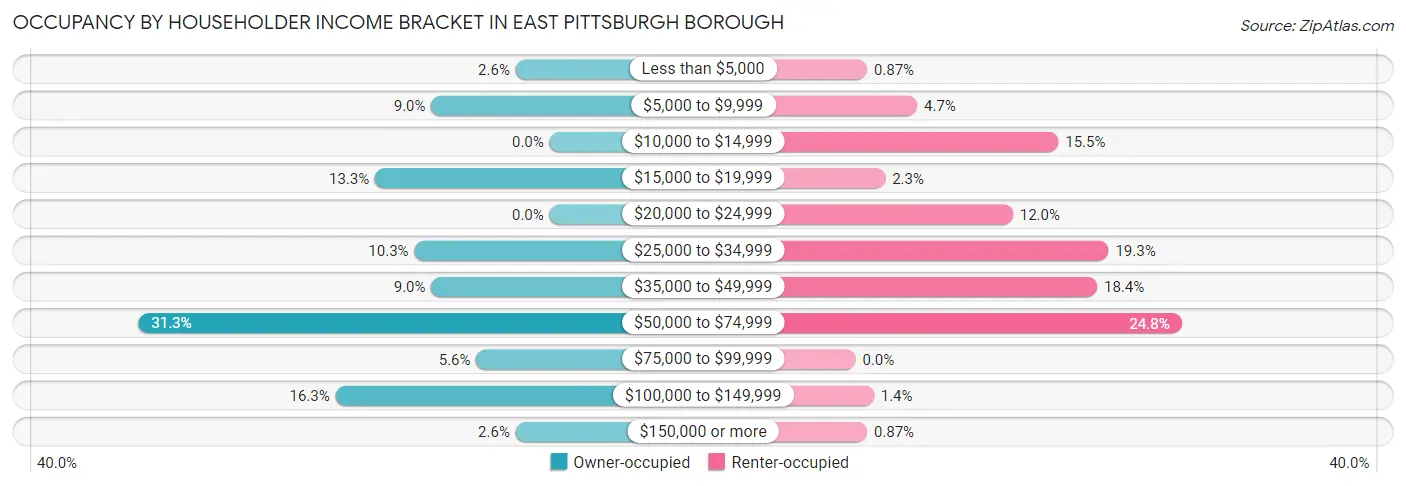
| Income Bracket | Owner-occupied | Renter-occupied |
| Less than $5,000 | 6 (2.6%) | 5 (0.9%) |
| $5,000 to $9,999 | 21 (9.0%) | 27 (4.7%) |
| $10,000 to $14,999 | 0 (0.0%) | 89 (15.4%) |
| $15,000 to $19,999 | 31 (13.3%) | 13 (2.3%) |
| $20,000 to $24,999 | 0 (0.0%) | 69 (12.0%) |
| $25,000 to $34,999 | 24 (10.3%) | 111 (19.3%) |
| $35,000 to $49,999 | 21 (9.0%) | 106 (18.4%) |
| $50,000 to $74,999 | 73 (31.3%) | 143 (24.8%) |
| $75,000 to $99,999 | 13 (5.6%) | 0 (0.0%) |
| $100,000 to $149,999 | 38 (16.3%) | 8 (1.4%) |
| $150,000 or more | 6 (2.6%) | 5 (0.9%) |
| Total | 233 (100.0%) | 576 (100.0%) |
Monthly Housing Cost Tiers in East Pittsburgh borough
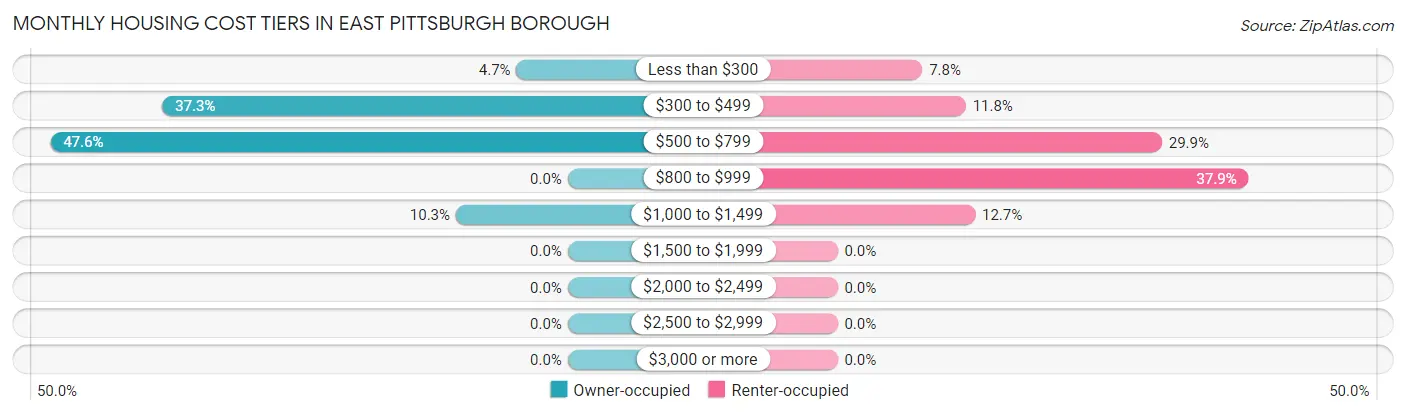
| Monthly Cost | Owner-occupied | Renter-occupied |
| Less than $300 | 11 (4.7%) | 45 (7.8%) |
| $300 to $499 | 87 (37.3%) | 68 (11.8%) |
| $500 to $799 | 111 (47.6%) | 172 (29.9%) |
| $800 to $999 | 0 (0.0%) | 218 (37.9%) |
| $1,000 to $1,499 | 24 (10.3%) | 73 (12.7%) |
| $1,500 to $1,999 | 0 (0.0%) | 0 (0.0%) |
| $2,000 to $2,499 | 0 (0.0%) | 0 (0.0%) |
| $2,500 to $2,999 | 0 (0.0%) | 0 (0.0%) |
| $3,000 or more | 0 (0.0%) | 0 (0.0%) |
| Total | 233 (100.0%) | 576 (100.0%) |
Physical Housing Characteristics in East Pittsburgh borough
Housing Structures in East Pittsburgh borough
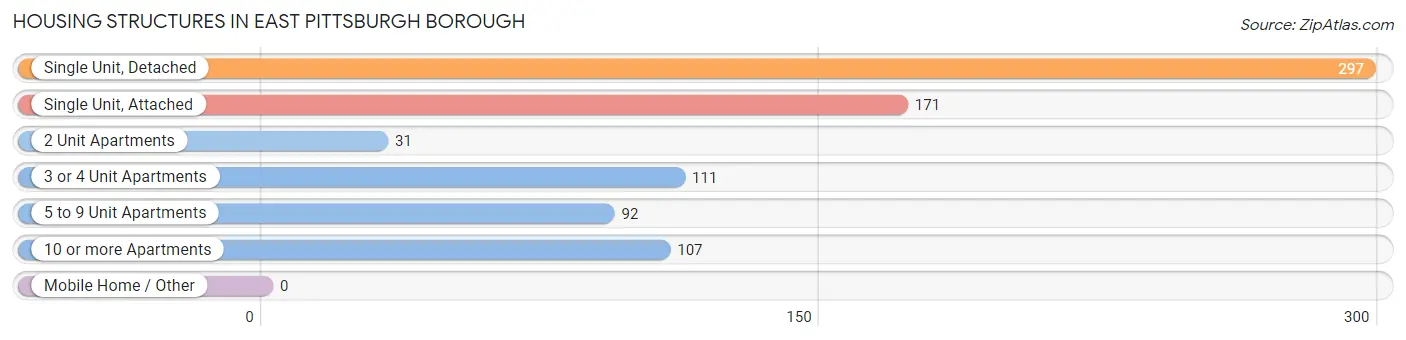
| Structure Type | # Housing Units | % Housing Units |
| Single Unit, Detached | 297 | 36.7% |
| Single Unit, Attached | 171 | 21.1% |
| 2 Unit Apartments | 31 | 3.8% |
| 3 or 4 Unit Apartments | 111 | 13.7% |
| 5 to 9 Unit Apartments | 92 | 11.4% |
| 10 or more Apartments | 107 | 13.2% |
| Mobile Home / Other | 0 | 0.0% |
| Total | 809 | 100.0% |
Housing Structures by Occupancy in East Pittsburgh borough
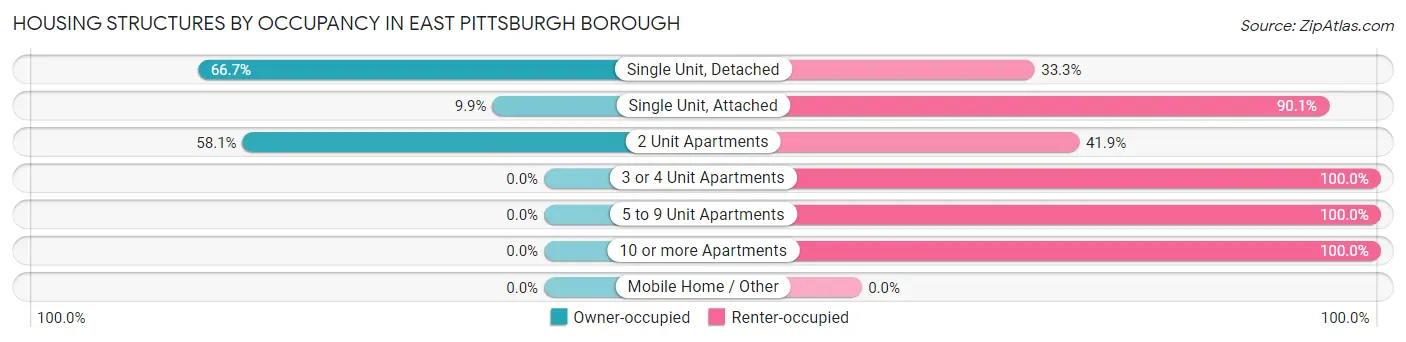
| Structure Type | Owner-occupied | Renter-occupied |
| Single Unit, Detached | 198 (66.7%) | 99 (33.3%) |
| Single Unit, Attached | 17 (9.9%) | 154 (90.1%) |
| 2 Unit Apartments | 18 (58.1%) | 13 (41.9%) |
| 3 or 4 Unit Apartments | 0 (0.0%) | 111 (100.0%) |
| 5 to 9 Unit Apartments | 0 (0.0%) | 92 (100.0%) |
| 10 or more Apartments | 0 (0.0%) | 107 (100.0%) |
| Mobile Home / Other | 0 (0.0%) | 0 (0.0%) |
| Total | 233 (28.8%) | 576 (71.2%) |
Housing Structures by Number of Rooms in East Pittsburgh borough
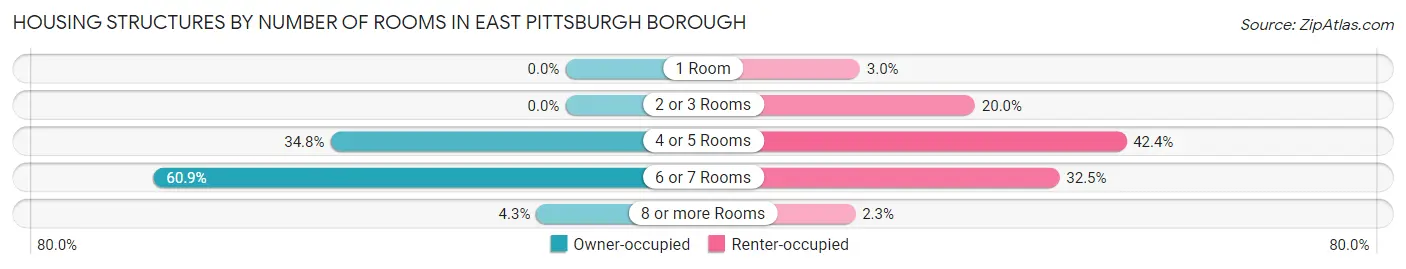
| Number of Rooms | Owner-occupied | Renter-occupied |
| 1 Room | 0 (0.0%) | 17 (2.9%) |
| 2 or 3 Rooms | 0 (0.0%) | 115 (20.0%) |
| 4 or 5 Rooms | 81 (34.8%) | 244 (42.4%) |
| 6 or 7 Rooms | 142 (60.9%) | 187 (32.5%) |
| 8 or more Rooms | 10 (4.3%) | 13 (2.3%) |
| Total | 233 (100.0%) | 576 (100.0%) |
Housing Structure by Heating Type in East Pittsburgh borough
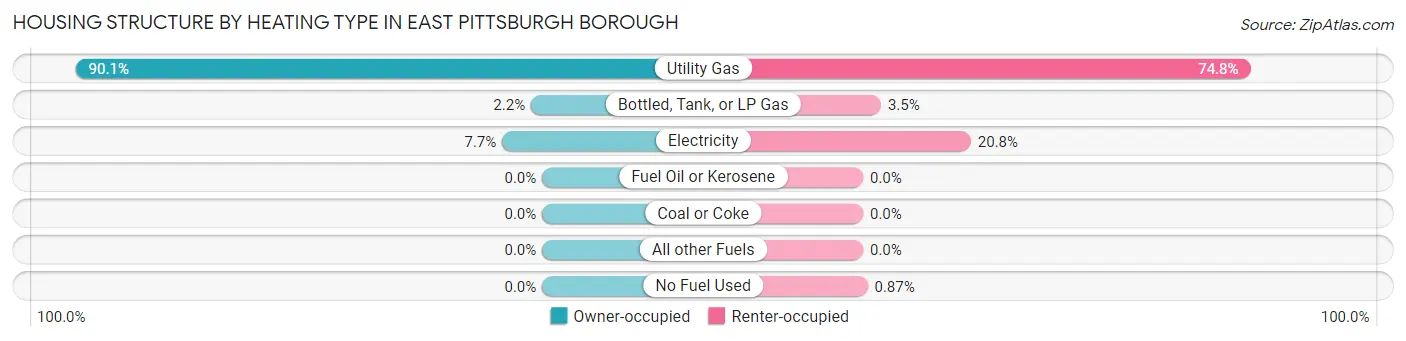
| Heating Type | Owner-occupied | Renter-occupied |
| Utility Gas | 210 (90.1%) | 431 (74.8%) |
| Bottled, Tank, or LP Gas | 5 (2.1%) | 20 (3.5%) |
| Electricity | 18 (7.7%) | 120 (20.8%) |
| Fuel Oil or Kerosene | 0 (0.0%) | 0 (0.0%) |
| Coal or Coke | 0 (0.0%) | 0 (0.0%) |
| All other Fuels | 0 (0.0%) | 0 (0.0%) |
| No Fuel Used | 0 (0.0%) | 5 (0.9%) |
| Total | 233 (100.0%) | 576 (100.0%) |
Household Vehicle Usage in East Pittsburgh borough
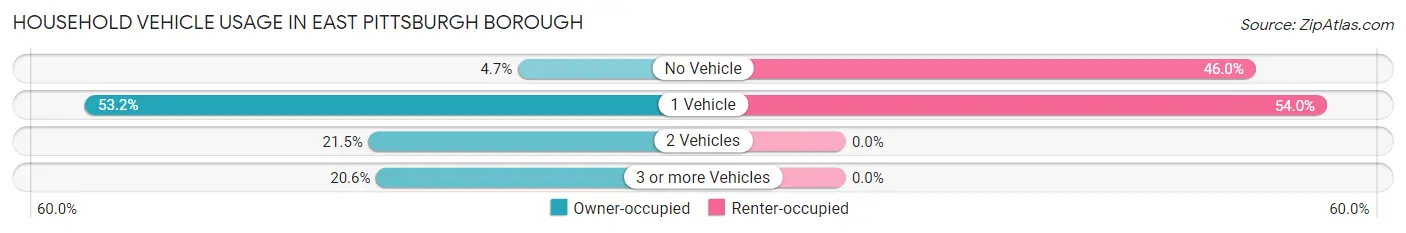
| Vehicles per Household | Owner-occupied | Renter-occupied |
| No Vehicle | 11 (4.7%) | 265 (46.0%) |
| 1 Vehicle | 124 (53.2%) | 311 (54.0%) |
| 2 Vehicles | 50 (21.5%) | 0 (0.0%) |
| 3 or more Vehicles | 48 (20.6%) | 0 (0.0%) |
| Total | 233 (100.0%) | 576 (100.0%) |
Real Estate & Mortgages in East Pittsburgh borough
Real Estate and Mortgage Overview in East Pittsburgh borough
| Characteristic | Without Mortgage | With Mortgage |
| Housing Units | 178 | 55 |
| Median Property Value | $63,200 | $75,600 |
| Median Household Income | $64,231 | $0 |
| Monthly Housing Costs | $476 | $0 |
| Real Estate Taxes | $1,615 | $0 |
Property Value by Mortgage Status in East Pittsburgh borough
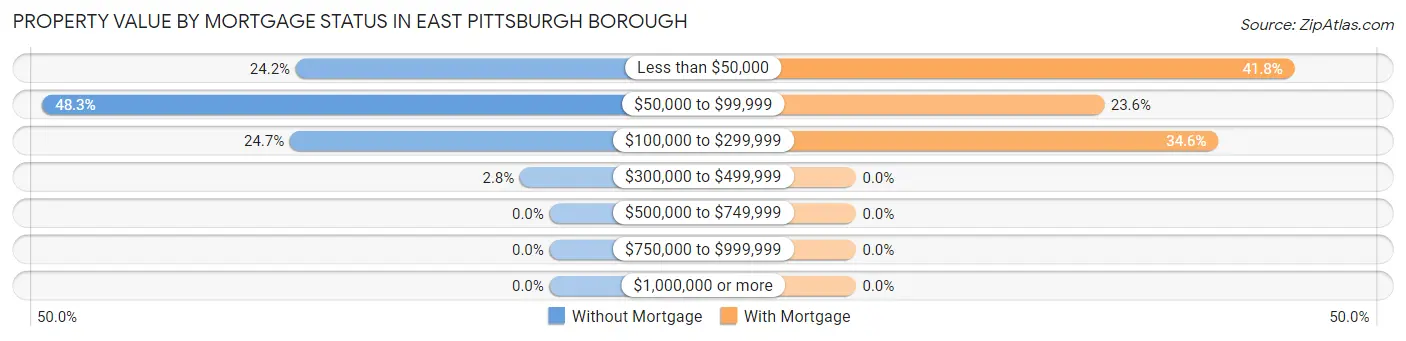
| Property Value | Without Mortgage | With Mortgage |
| Less than $50,000 | 43 (24.2%) | 23 (41.8%) |
| $50,000 to $99,999 | 86 (48.3%) | 13 (23.6%) |
| $100,000 to $299,999 | 44 (24.7%) | 19 (34.5%) |
| $300,000 to $499,999 | 5 (2.8%) | 0 (0.0%) |
| $500,000 to $749,999 | 0 (0.0%) | 0 (0.0%) |
| $750,000 to $999,999 | 0 (0.0%) | 0 (0.0%) |
| $1,000,000 or more | 0 (0.0%) | 0 (0.0%) |
| Total | 178 (100.0%) | 55 (100.0%) |
Household Income by Mortgage Status in East Pittsburgh borough
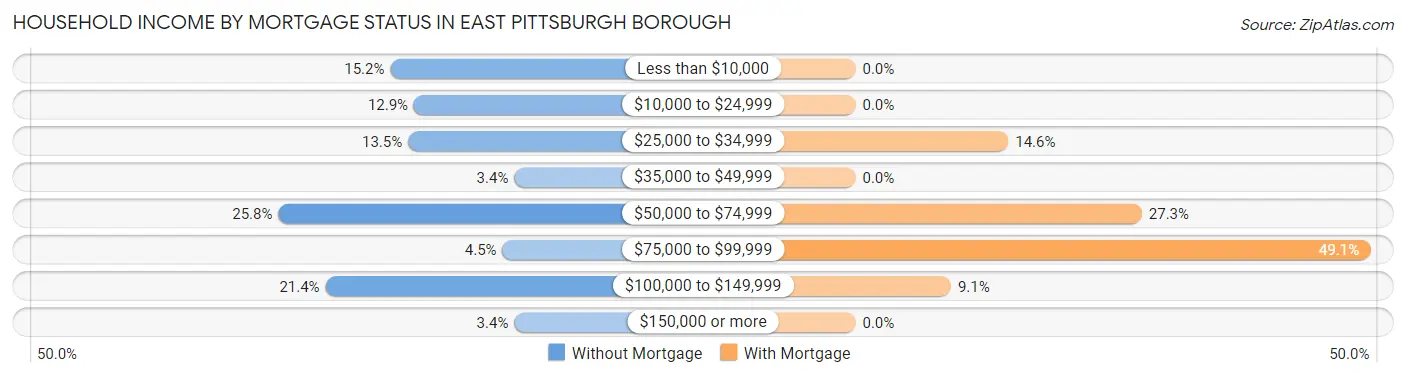
| Household Income | Without Mortgage | With Mortgage |
| Less than $10,000 | 27 (15.2%) | 0 (0.0%) |
| $10,000 to $24,999 | 23 (12.9%) | 0 (0.0%) |
| $25,000 to $34,999 | 24 (13.5%) | 8 (14.5%) |
| $35,000 to $49,999 | 6 (3.4%) | 0 (0.0%) |
| $50,000 to $74,999 | 46 (25.8%) | 15 (27.3%) |
| $75,000 to $99,999 | 8 (4.5%) | 27 (49.1%) |
| $100,000 to $149,999 | 38 (21.3%) | 5 (9.1%) |
| $150,000 or more | 6 (3.4%) | 0 (0.0%) |
| Total | 178 (100.0%) | 55 (100.0%) |
Property Value to Household Income Ratio in East Pittsburgh borough
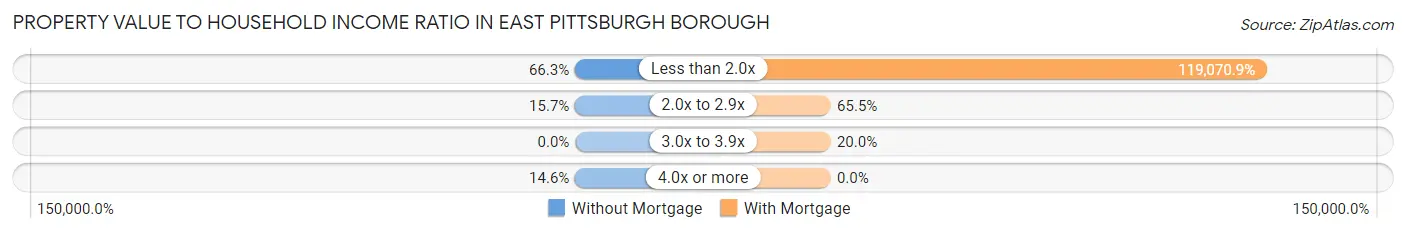
| Value-to-Income Ratio | Without Mortgage | With Mortgage |
| Less than 2.0x | 118 (66.3%) | 65,489 (119,070.9%) |
| 2.0x to 2.9x | 28 (15.7%) | 36 (65.4%) |
| 3.0x to 3.9x | 0 (0.0%) | 11 (20.0%) |
| 4.0x or more | 26 (14.6%) | 0 (0.0%) |
| Total | 178 (100.0%) | 55 (100.0%) |
Real Estate Taxes by Mortgage Status in East Pittsburgh borough
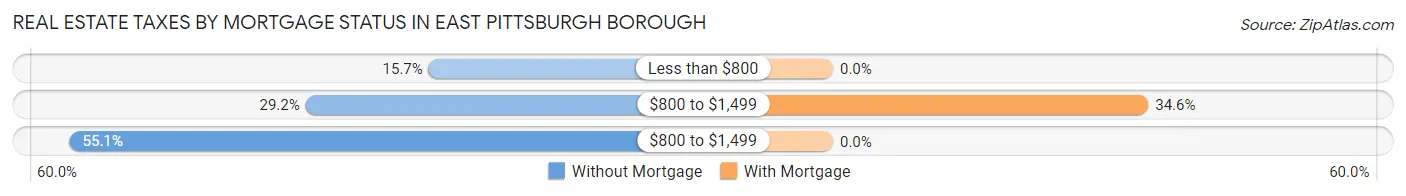
| Property Taxes | Without Mortgage | With Mortgage |
| Less than $800 | 28 (15.7%) | 0 (0.0%) |
| $800 to $1,499 | 52 (29.2%) | 19 (34.5%) |
| $800 to $1,499 | 98 (55.1%) | 0 (0.0%) |
| Total | 178 (100.0%) | 55 (100.0%) |
Health & Disability in East Pittsburgh borough
Health Insurance Coverage by Age in East Pittsburgh borough
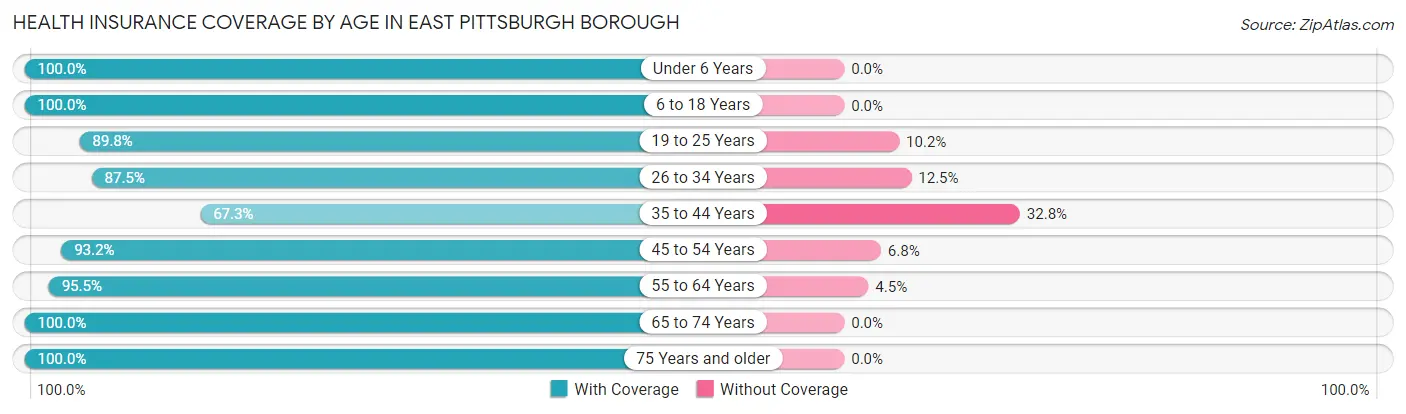
| Age Bracket | With Coverage | Without Coverage |
| Under 6 Years | 151 (100.0%) | 0 (0.0%) |
| 6 to 18 Years | 406 (100.0%) | 0 (0.0%) |
| 19 to 25 Years | 79 (89.8%) | 9 (10.2%) |
| 26 to 34 Years | 287 (87.5%) | 41 (12.5%) |
| 35 to 44 Years | 115 (67.2%) | 56 (32.8%) |
| 45 to 54 Years | 150 (93.2%) | 11 (6.8%) |
| 55 to 64 Years | 318 (95.5%) | 15 (4.5%) |
| 65 to 74 Years | 99 (100.0%) | 0 (0.0%) |
| 75 Years and older | 120 (100.0%) | 0 (0.0%) |
| Total | 1,725 (92.9%) | 132 (7.1%) |
Health Insurance Coverage by Citizenship Status in East Pittsburgh borough
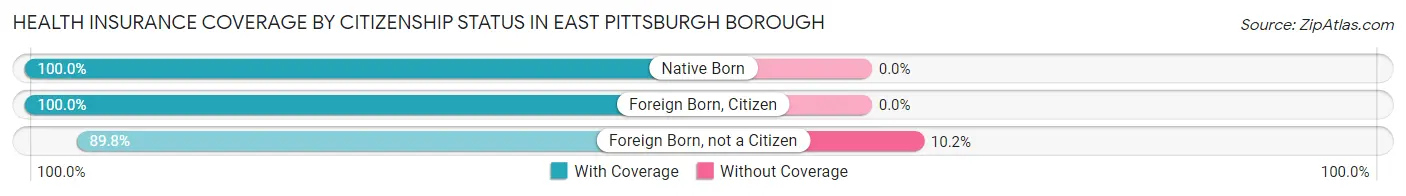
| Citizenship Status | With Coverage | Without Coverage |
| Native Born | 151 (100.0%) | 0 (0.0%) |
| Foreign Born, Citizen | 406 (100.0%) | 0 (0.0%) |
| Foreign Born, not a Citizen | 79 (89.8%) | 9 (10.2%) |
Health Insurance Coverage by Household Income in East Pittsburgh borough
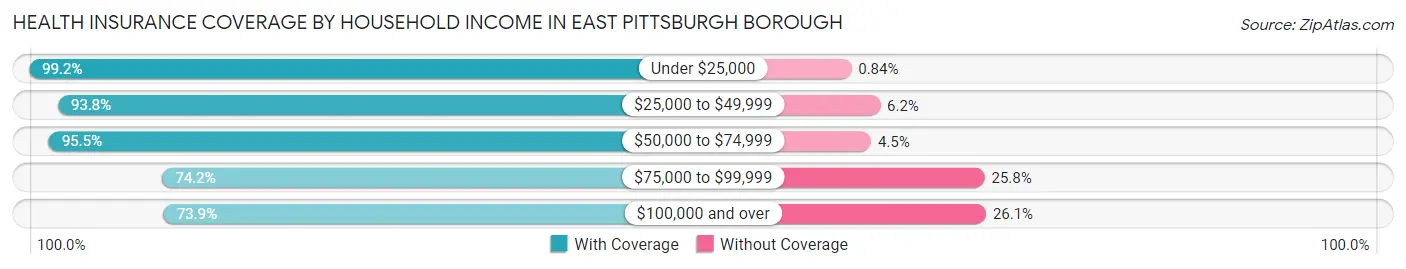
| Household Income | With Coverage | Without Coverage |
| Under $25,000 | 588 (99.2%) | 5 (0.8%) |
| $25,000 to $49,999 | 451 (93.8%) | 30 (6.2%) |
| $50,000 to $74,999 | 464 (95.5%) | 22 (4.5%) |
| $75,000 to $99,999 | 23 (74.2%) | 8 (25.8%) |
| $100,000 and over | 190 (73.9%) | 67 (26.1%) |
Public vs Private Health Insurance Coverage by Age in East Pittsburgh borough
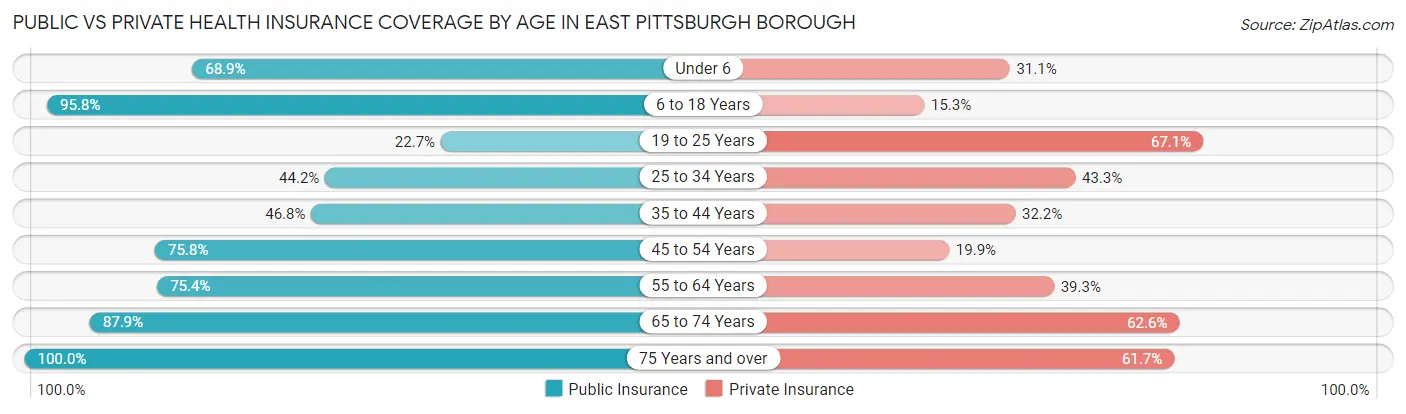
| Age Bracket | Public Insurance | Private Insurance |
| Under 6 | 104 (68.9%) | 47 (31.1%) |
| 6 to 18 Years | 389 (95.8%) | 62 (15.3%) |
| 19 to 25 Years | 20 (22.7%) | 59 (67.0%) |
| 25 to 34 Years | 145 (44.2%) | 142 (43.3%) |
| 35 to 44 Years | 80 (46.8%) | 55 (32.2%) |
| 45 to 54 Years | 122 (75.8%) | 32 (19.9%) |
| 55 to 64 Years | 251 (75.4%) | 131 (39.3%) |
| 65 to 74 Years | 87 (87.9%) | 62 (62.6%) |
| 75 Years and over | 120 (100.0%) | 74 (61.7%) |
| Total | 1,318 (71.0%) | 664 (35.8%) |
Disability Status by Sex by Age in East Pittsburgh borough
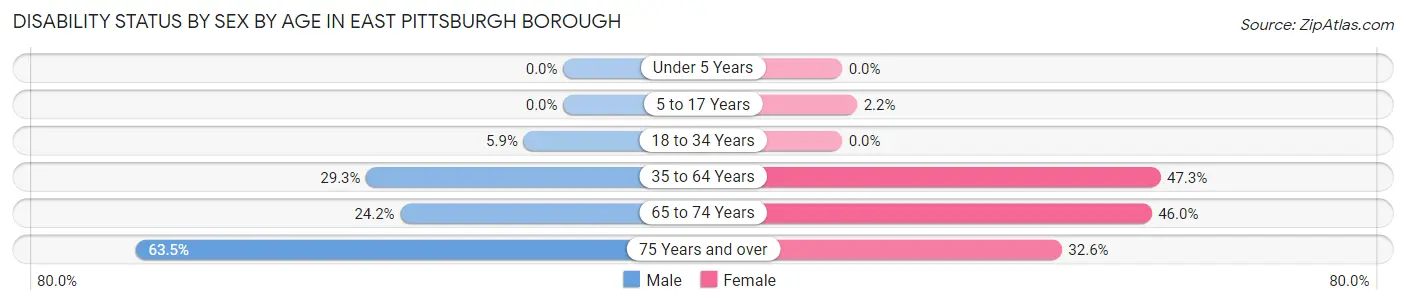
| Age Bracket | Male | Female |
| Under 5 Years | 0 (0.0%) | 0 (0.0%) |
| 5 to 17 Years | 0 (0.0%) | 6 (2.2%) |
| 18 to 34 Years | 9 (5.9%) | 0 (0.0%) |
| 35 to 64 Years | 93 (29.2%) | 164 (47.3%) |
| 65 to 74 Years | 15 (24.2%) | 17 (46.0%) |
| 75 Years and over | 47 (63.5%) | 15 (32.6%) |
Disability Class by Sex by Age in East Pittsburgh borough
Disability Class: Hearing Difficulty
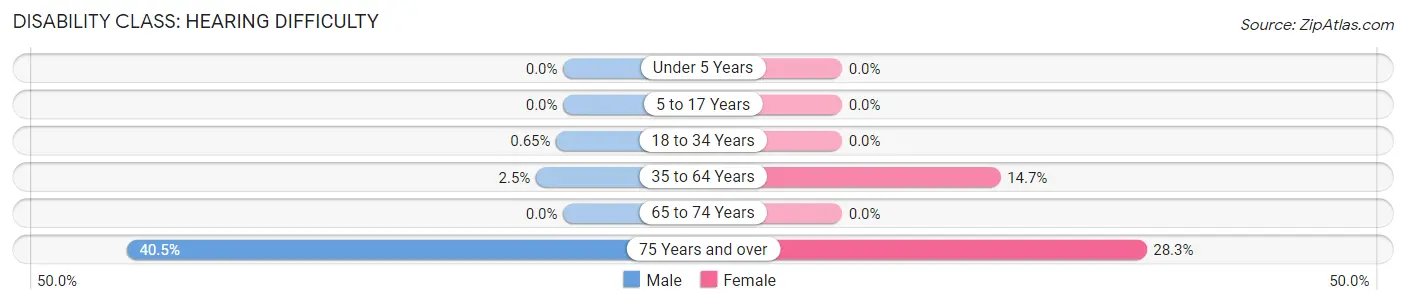
| Age Bracket | Male | Female |
| Under 5 Years | 0 (0.0%) | 0 (0.0%) |
| 5 to 17 Years | 0 (0.0%) | 0 (0.0%) |
| 18 to 34 Years | 1 (0.6%) | 0 (0.0%) |
| 35 to 64 Years | 8 (2.5%) | 51 (14.7%) |
| 65 to 74 Years | 0 (0.0%) | 0 (0.0%) |
| 75 Years and over | 30 (40.5%) | 13 (28.3%) |
Disability Class: Vision Difficulty
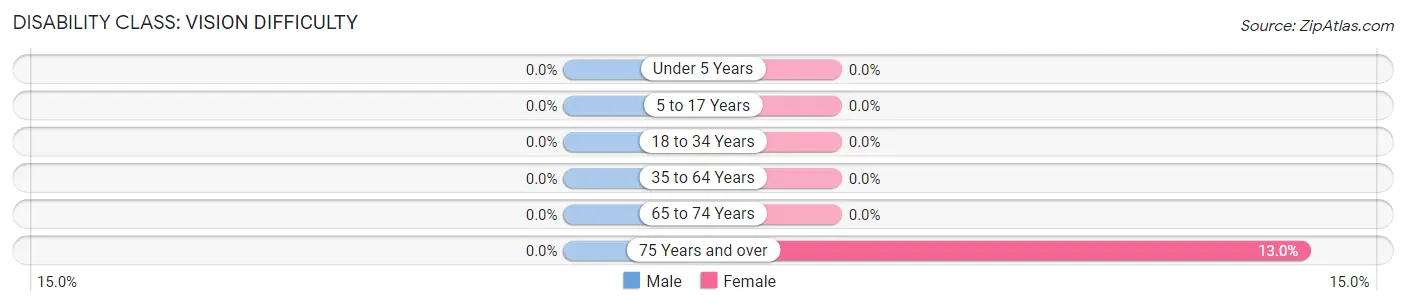
| Age Bracket | Male | Female |
| Under 5 Years | 0 (0.0%) | 0 (0.0%) |
| 5 to 17 Years | 0 (0.0%) | 0 (0.0%) |
| 18 to 34 Years | 0 (0.0%) | 0 (0.0%) |
| 35 to 64 Years | 0 (0.0%) | 0 (0.0%) |
| 65 to 74 Years | 0 (0.0%) | 0 (0.0%) |
| 75 Years and over | 0 (0.0%) | 6 (13.0%) |
Disability Class: Cognitive Difficulty
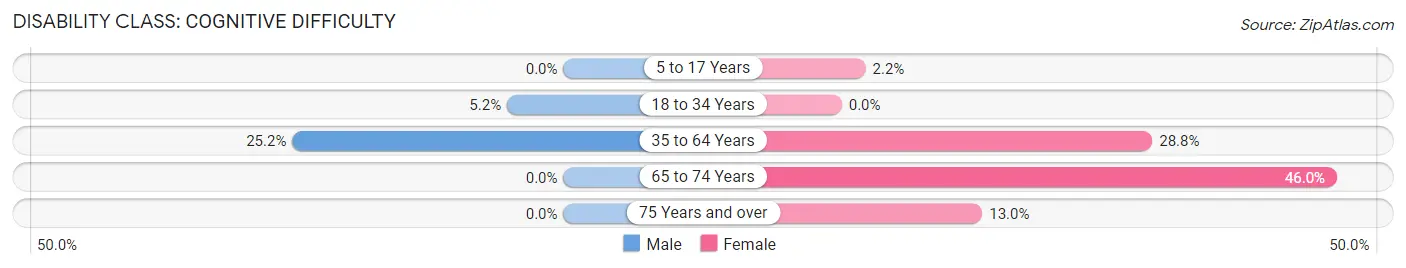
| Age Bracket | Male | Female |
| 5 to 17 Years | 0 (0.0%) | 6 (2.2%) |
| 18 to 34 Years | 8 (5.2%) | 0 (0.0%) |
| 35 to 64 Years | 80 (25.2%) | 100 (28.8%) |
| 65 to 74 Years | 0 (0.0%) | 17 (46.0%) |
| 75 Years and over | 0 (0.0%) | 6 (13.0%) |
Disability Class: Ambulatory Difficulty
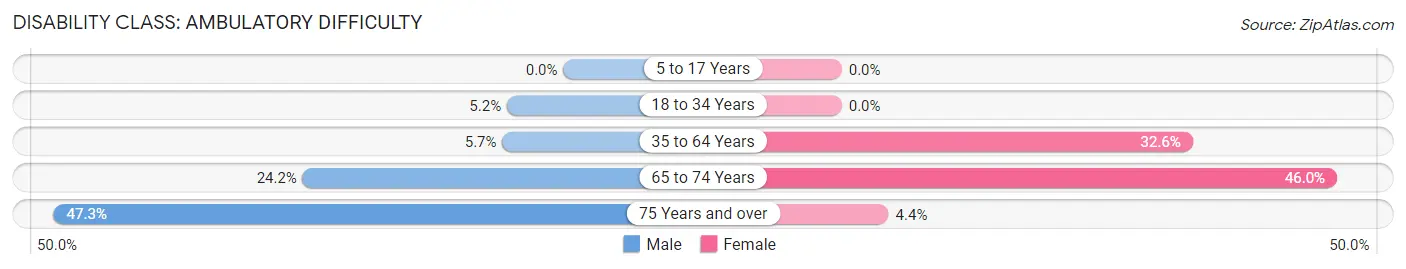
| Age Bracket | Male | Female |
| 5 to 17 Years | 0 (0.0%) | 0 (0.0%) |
| 18 to 34 Years | 8 (5.2%) | 0 (0.0%) |
| 35 to 64 Years | 18 (5.7%) | 113 (32.6%) |
| 65 to 74 Years | 15 (24.2%) | 17 (46.0%) |
| 75 Years and over | 35 (47.3%) | 2 (4.3%) |
Disability Class: Self-Care Difficulty
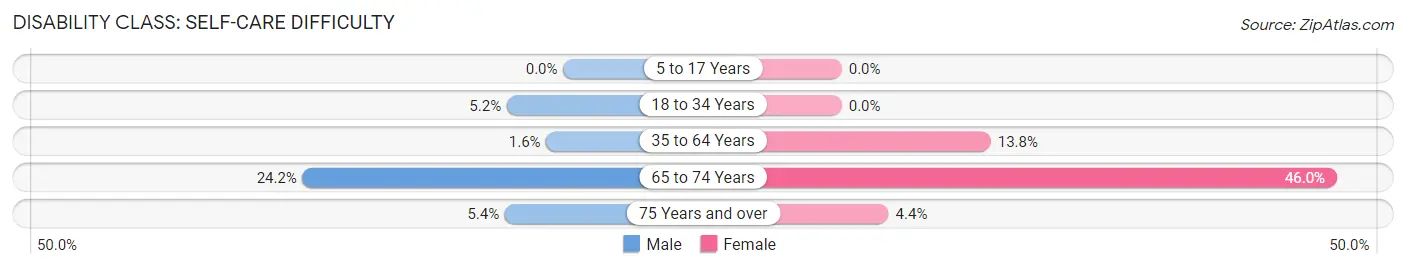
| Age Bracket | Male | Female |
| 5 to 17 Years | 0 (0.0%) | 0 (0.0%) |
| 18 to 34 Years | 8 (5.2%) | 0 (0.0%) |
| 35 to 64 Years | 5 (1.6%) | 48 (13.8%) |
| 65 to 74 Years | 15 (24.2%) | 17 (46.0%) |
| 75 Years and over | 4 (5.4%) | 2 (4.3%) |
Technology Access in East Pittsburgh borough
Computing Device Access in East Pittsburgh borough
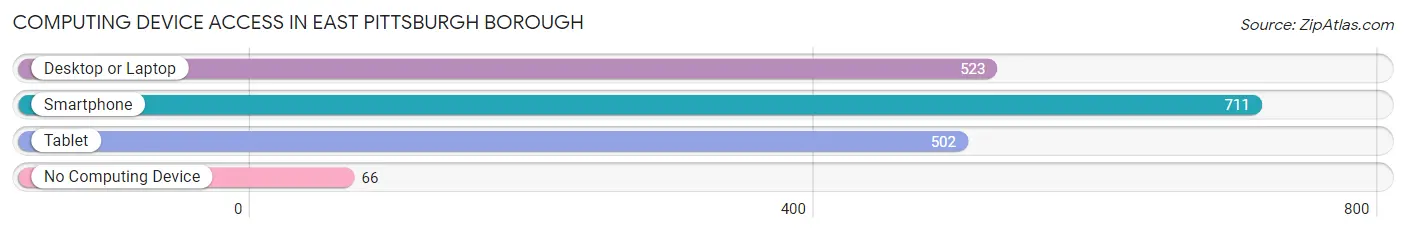
| Device Type | # Households | % Households |
| Desktop or Laptop | 523 | 64.6% |
| Smartphone | 711 | 87.9% |
| Tablet | 502 | 62.1% |
| No Computing Device | 66 | 8.2% |
| Total | 809 | 100.0% |
Internet Access in East Pittsburgh borough
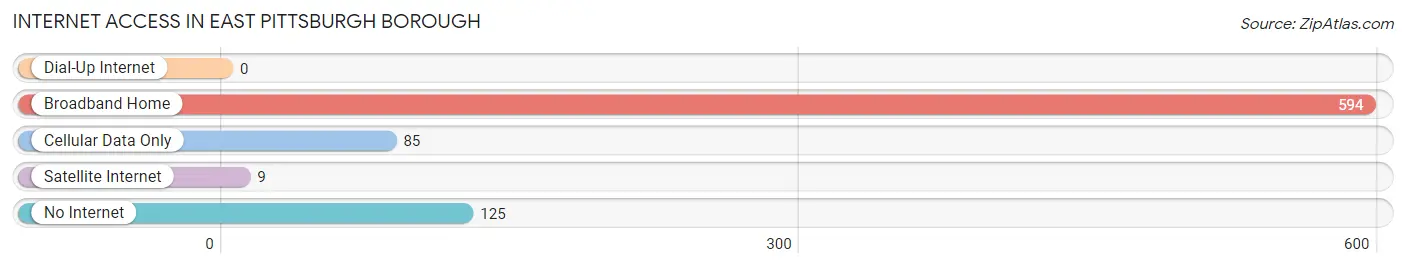
| Internet Type | # Households | % Households |
| Dial-Up Internet | 0 | 0.0% |
| Broadband Home | 594 | 73.4% |
| Cellular Data Only | 85 | 10.5% |
| Satellite Internet | 9 | 1.1% |
| No Internet | 125 | 15.4% |
| Total | 809 | 100.0% |
East Pittsburgh borough Summary
East Pittsburgh Borough is a small borough located in Allegheny County, Pennsylvania. It is situated in the eastern part of the county, just east of the city of Pittsburgh. The borough is bordered by Wilkinsburg, North Versailles, and Turtle Creek. As of the 2010 census, the population of East Pittsburgh was 1,822.
History
East Pittsburgh was founded in 1892 by industrialist George Westinghouse. He purchased the land from the estate of William Robinson, who had owned the land since the late 1700s. Westinghouse wanted to build a steel mill in the area, and he named the borough after himself. The first steel mill was built in 1895, and the town quickly grew around it.
By the early 1900s, East Pittsburgh had become a thriving industrial center. The steel mill was the largest employer in the area, and it attracted many immigrants from Europe. The town also had several other factories, including a glass factory, a brickyard, and a coal mine.
In the 1920s, East Pittsburgh began to decline. The steel mill closed in 1923, and the other factories soon followed. The population of the borough dropped from over 5,000 in 1920 to just over 1,000 in 1930.
In the 1950s, East Pittsburgh began to experience a resurgence. The steel mill reopened, and the town began to attract new businesses. The population of the borough increased to over 2,000 by the 1970s.
Geography
East Pittsburgh is located in the eastern part of Allegheny County, just east of the city of Pittsburgh. The borough is bordered by Wilkinsburg, North Versailles, and Turtle Creek. The borough is situated on the banks of the Monongahela River.
The borough has a total area of 0.9 square miles, all of which is land. The terrain is mostly flat, with some hills in the northern part of the borough.
Economy
East Pittsburgh’s economy is largely based on manufacturing. The steel mill is the largest employer in the borough, and it is the only major industry in the area. Other industries in the borough include a glass factory, a brickyard, and a coal mine.
The borough also has several small businesses, including restaurants, retail stores, and auto repair shops.
Demographics
As of the 2010 census, the population of East Pittsburgh was 1,822. The racial makeup of the borough was 79.3% White, 15.2% African American, 0.3% Native American, 0.7% Asian, 0.1% Pacific Islander, and 4.4% from other races. Hispanic or Latino of any race were 1.3% of the population.
The median household income in East Pittsburgh was $30,938, and the median family income was $37,813. About 17.3% of the population was below the poverty line.
Common Questions
What is Per Capita Income in East Pittsburgh borough?
Per Capita income in East Pittsburgh borough is $21,343.
What is the Median Family Income in East Pittsburgh borough?
Median Family Income in East Pittsburgh borough is $34,247.
What is the Median Household income in East Pittsburgh borough?
Median Household Income in East Pittsburgh borough is $35,483.
What is Income or Wage Gap in East Pittsburgh borough?
Income or Wage Gap in East Pittsburgh borough is 15.5%.
Women in East Pittsburgh borough earn 84.5 cents for every dollar earned by a man.
What is Inequality or Gini Index in East Pittsburgh borough?
Inequality or Gini Index in East Pittsburgh borough is 0.43.
What is the Total Population of East Pittsburgh borough?
Total Population of East Pittsburgh borough is 1,866.
What is the Total Male Population of East Pittsburgh borough?
Total Male Population of East Pittsburgh borough is 822.
What is the Total Female Population of East Pittsburgh borough?
Total Female Population of East Pittsburgh borough is 1,044.
What is the Ratio of Males per 100 Females in East Pittsburgh borough?
There are 78.74 Males per 100 Females in East Pittsburgh borough.
What is the Ratio of Females per 100 Males in East Pittsburgh borough?
There are 127.01 Females per 100 Males in East Pittsburgh borough.
What is the Median Population Age in East Pittsburgh borough?
Median Population Age in East Pittsburgh borough is 32.7 Years.
What is the Average Family Size in East Pittsburgh borough
Average Family Size in East Pittsburgh borough is 2.9 People.
What is the Average Household Size in East Pittsburgh borough
Average Household Size in East Pittsburgh borough is 2.3 People.
How Large is the Labor Force in East Pittsburgh borough?
There are 774 People in the Labor Forcein in East Pittsburgh borough.
What is the Percentage of People in the Labor Force in East Pittsburgh borough?
57.8% of People are in the Labor Force in East Pittsburgh borough.
What is the Unemployment Rate in East Pittsburgh borough?
Unemployment Rate in East Pittsburgh borough is 5.4%.