Colwyn borough, PA Map & Demographics
Colwyn borough Overview
$19,181
PER CAPITA INCOME
$70,795
AVG FAMILY INCOME
$51,188
AVG HOUSEHOLD INCOME
21.0%
WAGE / INCOME GAP [ % ]
79.0¢/ $1
WAGE / INCOME GAP [ $ ]
$14,433
FAMILY INCOME DEFICIT
0.44
INEQUALITY / GINI INDEX
2,849
TOTAL POPULATION
1,216
MALE POPULATION
1,633
FEMALE POPULATION
74.46
MALES / 100 FEMALES
134.29
FEMALES / 100 MALES
25.4
MEDIAN AGE
4.4
AVG FAMILY SIZE
3.4
AVG HOUSEHOLD SIZE
1,532
LABOR FORCE [ PEOPLE ]
74.9%
PERCENT IN LABOR FORCE
23.1%
UNEMPLOYMENT RATE
Income in Colwyn borough
Income Overview in Colwyn borough
Per Capita Income in Colwyn borough is $19,181, while median incomes of families and households are $70,795 and $51,188 respectively.
| Characteristic | Number | Measure |
| Per Capita Income | 2,849 | $19,181 |
| Median Family Income | 547 | $70,795 |
| Mean Family Income | 547 | $78,872 |
| Median Household Income | 837 | $51,188 |
| Mean Household Income | 837 | $62,920 |
| Income Deficit | 547 | $14,433 |
| Wage / Income Gap (%) | 2,849 | 21.04% |
| Wage / Income Gap ($) | 2,849 | 78.96¢ per $1 |
| Gini / Inequality Index | 2,849 | 0.44 |
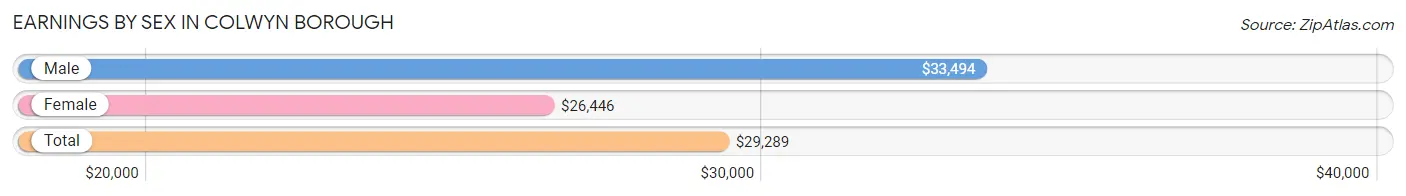
Earnings by Sex in Colwyn borough
Average Earnings in Colwyn borough are $29,289, $33,494 for men and $26,446 for women, a difference of 21.0%.
| Sex | Number | Average Earnings |
| Male | 651 (44.1%) | $33,494 |
| Female | 825 (55.9%) | $26,446 |
| Total | 1,476 (100.0%) | $29,289 |
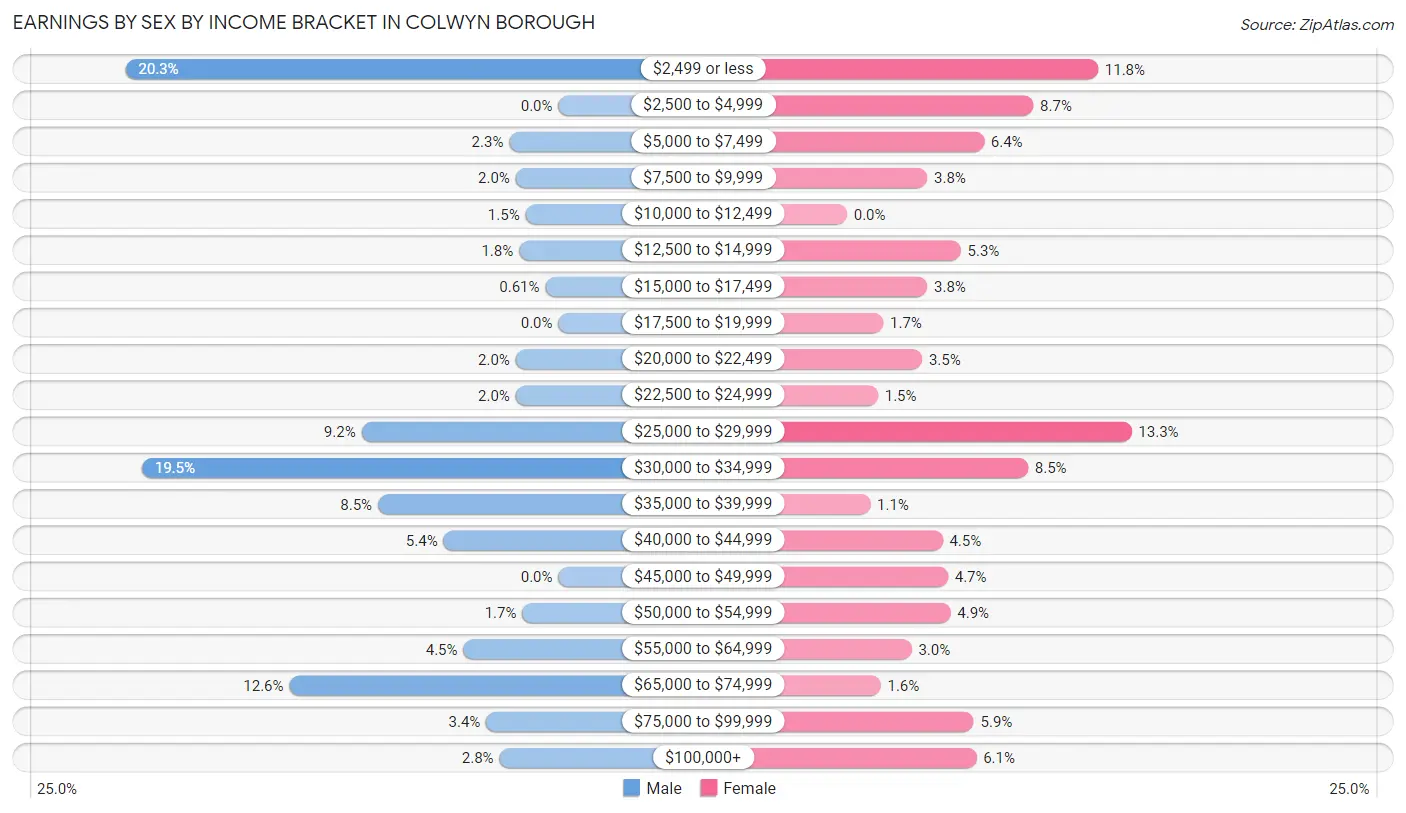
Earnings by Sex by Income Bracket in Colwyn borough
The most common earnings brackets in Colwyn borough are $2,499 or less for men (132 | 20.3%) and $25,000 to $29,999 for women (110 | 13.3%).
| Income | Male | Female |
| $2,499 or less | 132 (20.3%) | 97 (11.8%) |
| $2,500 to $4,999 | 0 (0.0%) | 72 (8.7%) |
| $5,000 to $7,499 | 15 (2.3%) | 53 (6.4%) |
| $7,500 to $9,999 | 13 (2.0%) | 31 (3.8%) |
| $10,000 to $12,499 | 10 (1.5%) | 0 (0.0%) |
| $12,500 to $14,999 | 12 (1.8%) | 44 (5.3%) |
| $15,000 to $17,499 | 4 (0.6%) | 31 (3.8%) |
| $17,500 to $19,999 | 0 (0.0%) | 14 (1.7%) |
| $20,000 to $22,499 | 13 (2.0%) | 29 (3.5%) |
| $22,500 to $24,999 | 13 (2.0%) | 12 (1.5%) |
| $25,000 to $29,999 | 60 (9.2%) | 110 (13.3%) |
| $30,000 to $34,999 | 127 (19.5%) | 70 (8.5%) |
| $35,000 to $39,999 | 55 (8.5%) | 9 (1.1%) |
| $40,000 to $44,999 | 35 (5.4%) | 37 (4.5%) |
| $45,000 to $49,999 | 0 (0.0%) | 39 (4.7%) |
| $50,000 to $54,999 | 11 (1.7%) | 40 (4.9%) |
| $55,000 to $64,999 | 29 (4.4%) | 25 (3.0%) |
| $65,000 to $74,999 | 82 (12.6%) | 13 (1.6%) |
| $75,000 to $99,999 | 22 (3.4%) | 49 (5.9%) |
| $100,000+ | 18 (2.8%) | 50 (6.1%) |
| Total | 651 (100.0%) | 825 (100.0%) |
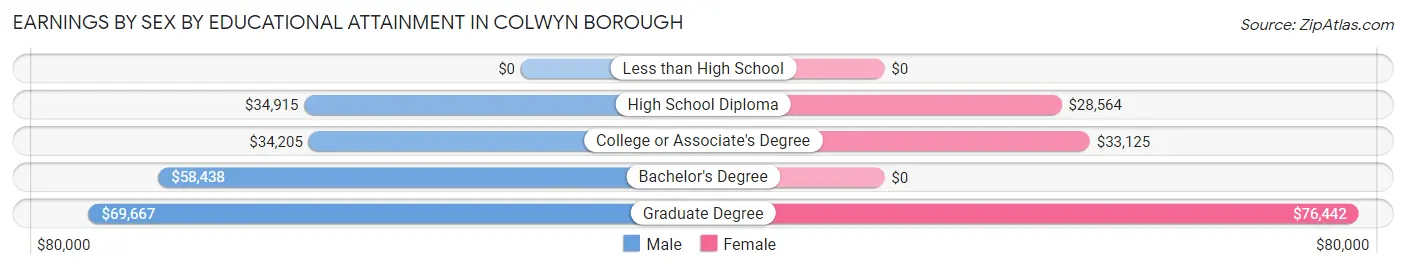
Earnings by Sex by Educational Attainment in Colwyn borough
Average earnings in Colwyn borough are $34,967 for men and $30,917 for women, a difference of 11.6%. Men with an educational attainment of graduate degree enjoy the highest average annual earnings of $69,667, while those with college or associate's degree education earn the least with $34,205. Women with an educational attainment of graduate degree earn the most with the average annual earnings of $76,442, while those with high school diploma education have the smallest earnings of $28,564.
| Educational Attainment | Male Income | Female Income |
| Less than High School | - | - |
| High School Diploma | $34,915 | $28,564 |
| College or Associate's Degree | $34,205 | $33,125 |
| Bachelor's Degree | $58,438 | $0 |
| Graduate Degree | $69,667 | $76,442 |
| Total | $34,967 | $30,917 |
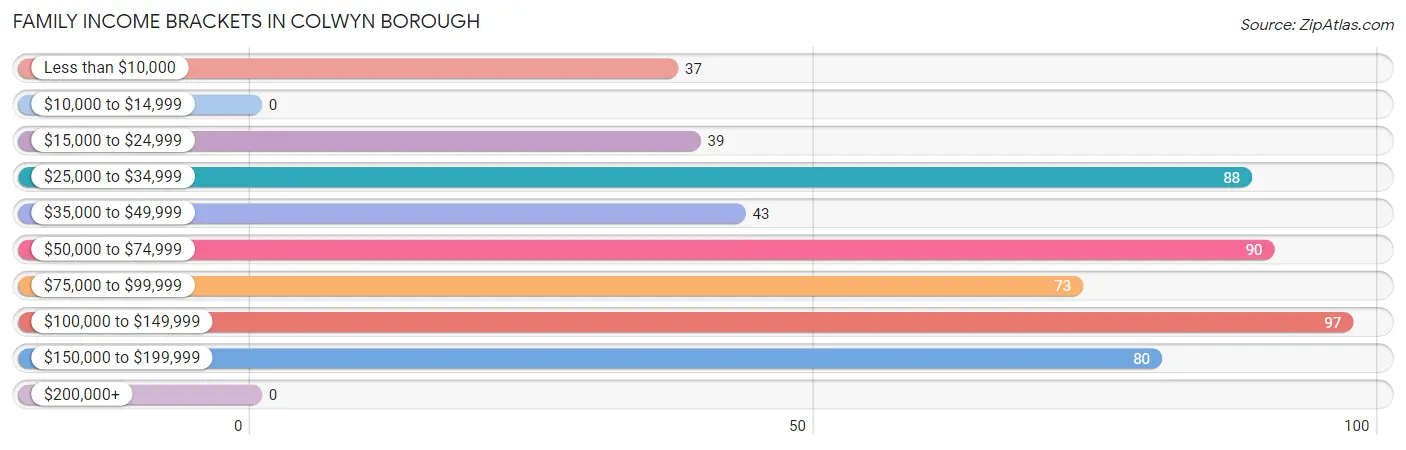
Family Income in Colwyn borough
Family Income Brackets in Colwyn borough
According to the Colwyn borough family income data, there are 97 families falling into the $100,000 to $149,999 income range, which is the most common income bracket and makes up 17.7% of all families.
| Income Bracket | # Families | % Families |
| Less than $10,000 | 37 | 6.8% |
| $10,000 to $14,999 | 0 | 0.0% |
| $15,000 to $24,999 | 39 | 7.1% |
| $25,000 to $34,999 | 88 | 16.1% |
| $35,000 to $49,999 | 43 | 7.9% |
| $50,000 to $74,999 | 90 | 16.5% |
| $75,000 to $99,999 | 73 | 13.3% |
| $100,000 to $149,999 | 97 | 17.7% |
| $150,000 to $199,999 | 80 | 14.6% |
| $200,000+ | 0 | 0.0% |
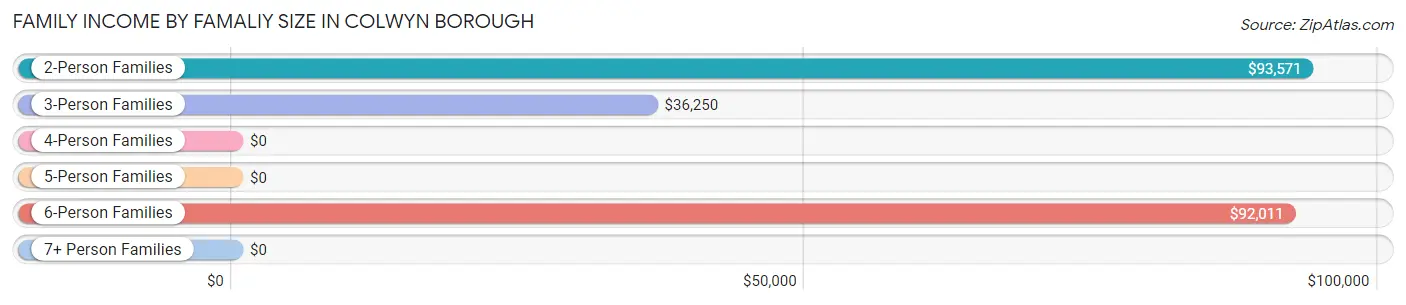
Family Income by Famaliy Size in Colwyn borough
2-person families (172 | 31.4%) account for the highest median family income in Colwyn borough with $93,571 per family, while 2-person families (172 | 31.4%) have the highest median income of $46,786 per family member.
| Income Bracket | # Families | Median Income |
| 2-Person Families | 172 (31.4%) | $93,571 |
| 3-Person Families | 67 (12.2%) | $36,250 |
| 4-Person Families | 77 (14.1%) | $0 |
| 5-Person Families | 108 (19.7%) | $0 |
| 6-Person Families | 59 (10.8%) | $92,011 |
| 7+ Person Families | 64 (11.7%) | $0 |
| Total | 547 (100.0%) | $70,795 |
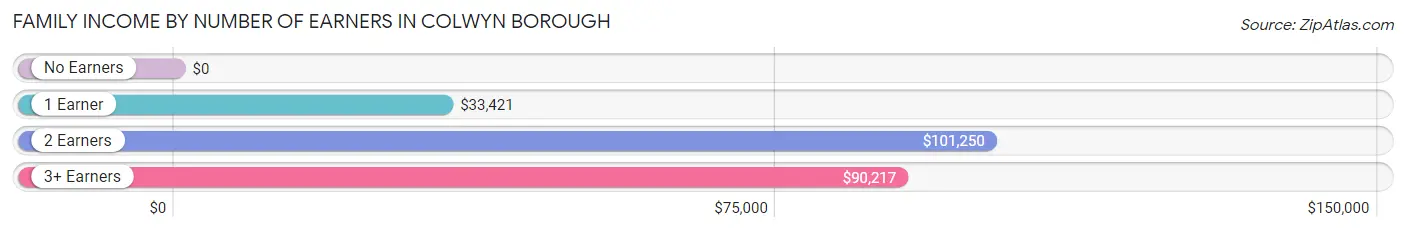
Family Income by Number of Earners in Colwyn borough
| Number of Earners | # Families | Median Income |
| No Earners | 25 (4.6%) | $0 |
| 1 Earner | 176 (32.2%) | $33,421 |
| 2 Earners | 188 (34.4%) | $101,250 |
| 3+ Earners | 158 (28.9%) | $90,217 |
| Total | 547 (100.0%) | $70,795 |
Household Income in Colwyn borough
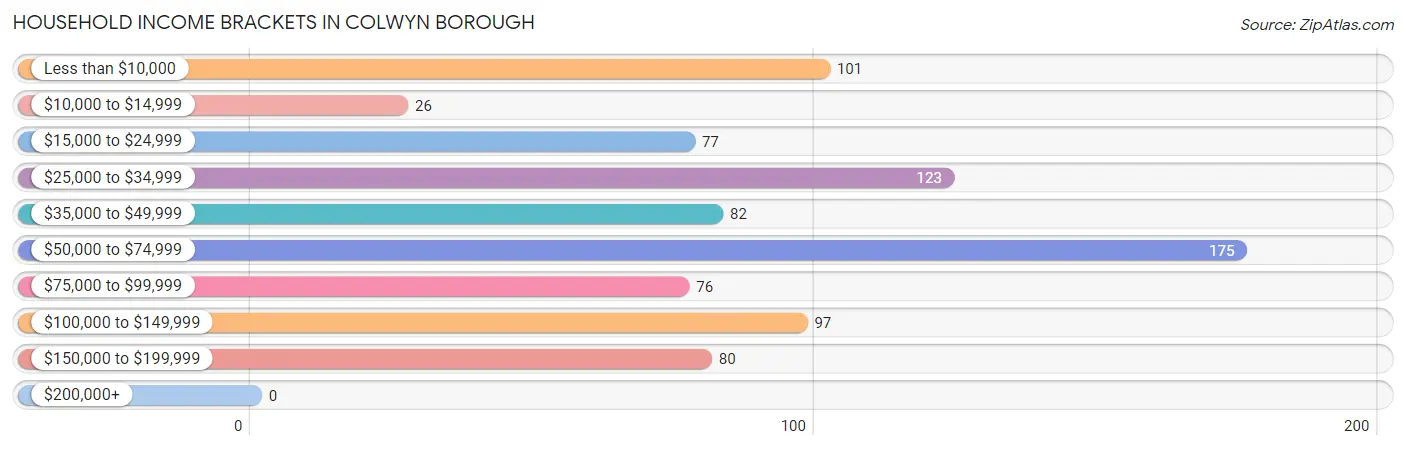
Household Income Brackets in Colwyn borough
With 175 households falling in the category, the $50,000 to $74,999 income range is the most frequent in Colwyn borough, accounting for 20.9% of all households.
| Income Bracket | # Households | % Households |
| Less than $10,000 | 101 | 12.1% |
| $10,000 to $14,999 | 26 | 3.1% |
| $15,000 to $24,999 | 77 | 9.2% |
| $25,000 to $34,999 | 123 | 14.7% |
| $35,000 to $49,999 | 82 | 9.8% |
| $50,000 to $74,999 | 175 | 20.9% |
| $75,000 to $99,999 | 76 | 9.1% |
| $100,000 to $149,999 | 97 | 11.6% |
| $150,000 to $199,999 | 80 | 9.6% |
| $200,000+ | 0 | 0.0% |
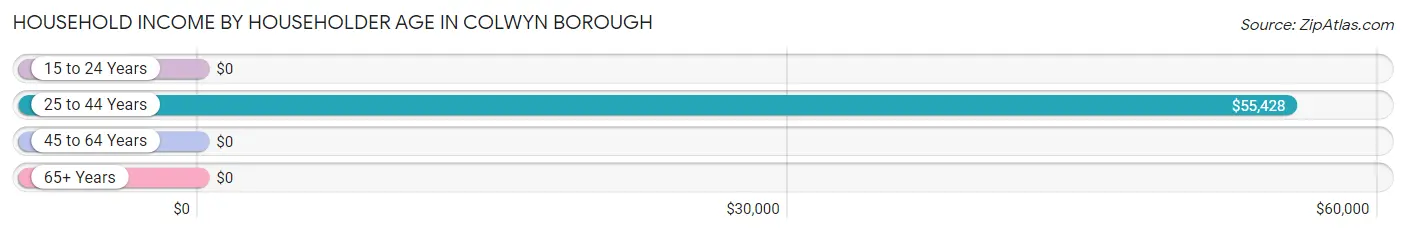
Household Income by Householder Age in Colwyn borough
The median household income in Colwyn borough is $51,188, with the highest median household income of $55,428 found in the 25 to 44 years age bracket for the primary householder. A total of 351 households (41.9%) fall into this category. Meanwhile, the 15 to 24 years age bracket for the primary householder has the lowest median household income of $0, with 8 households (1.0%) in this group.
| Income Bracket | # Households | Median Income |
| 15 to 24 Years | 8 (1.0%) | $0 |
| 25 to 44 Years | 351 (41.9%) | $55,428 |
| 45 to 64 Years | 391 (46.7%) | $0 |
| 65+ Years | 87 (10.4%) | $0 |
| Total | 837 (100.0%) | $51,188 |
Poverty in Colwyn borough
Income Below Poverty by Sex and Age in Colwyn borough
With 28.9% poverty level for males and 35.8% for females among the residents of Colwyn borough, under 5 year old males and 5 year old females are the most vulnerable to poverty, with 55 males (82.1%) and 51 females (100.0%) in their respective age groups living below the poverty level.
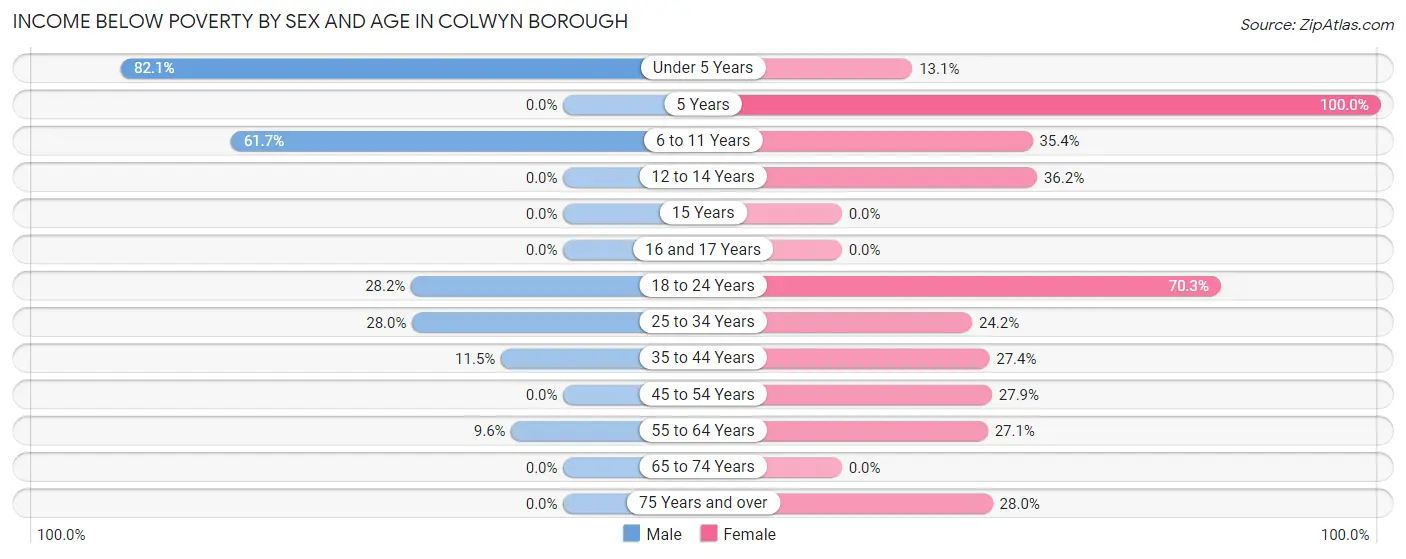
| Age Bracket | Male | Female |
| Under 5 Years | 55 (82.1%) | 14 (13.1%) |
| 5 Years | 0 (0.0%) | 51 (100.0%) |
| 6 to 11 Years | 150 (61.7%) | 63 (35.4%) |
| 12 to 14 Years | 0 (0.0%) | 25 (36.2%) |
| 15 Years | 0 (0.0%) | 0 (0.0%) |
| 16 and 17 Years | 0 (0.0%) | 0 (0.0%) |
| 18 to 24 Years | 48 (28.2%) | 230 (70.3%) |
| 25 to 34 Years | 76 (28.0%) | 44 (24.2%) |
| 35 to 44 Years | 15 (11.5%) | 46 (27.4%) |
| 45 to 54 Years | 0 (0.0%) | 66 (27.9%) |
| 55 to 64 Years | 8 (9.6%) | 39 (27.1%) |
| 65 to 74 Years | 0 (0.0%) | 0 (0.0%) |
| 75 Years and over | 0 (0.0%) | 7 (28.0%) |
| Total | 352 (28.9%) | 585 (35.8%) |
Income Above Poverty by Sex and Age in Colwyn borough
According to the poverty statistics in Colwyn borough, males aged 12 to 14 years and females aged 15 years are the age groups that are most secure financially, with 100.0% of males and 100.0% of females in these age groups living above the poverty line.
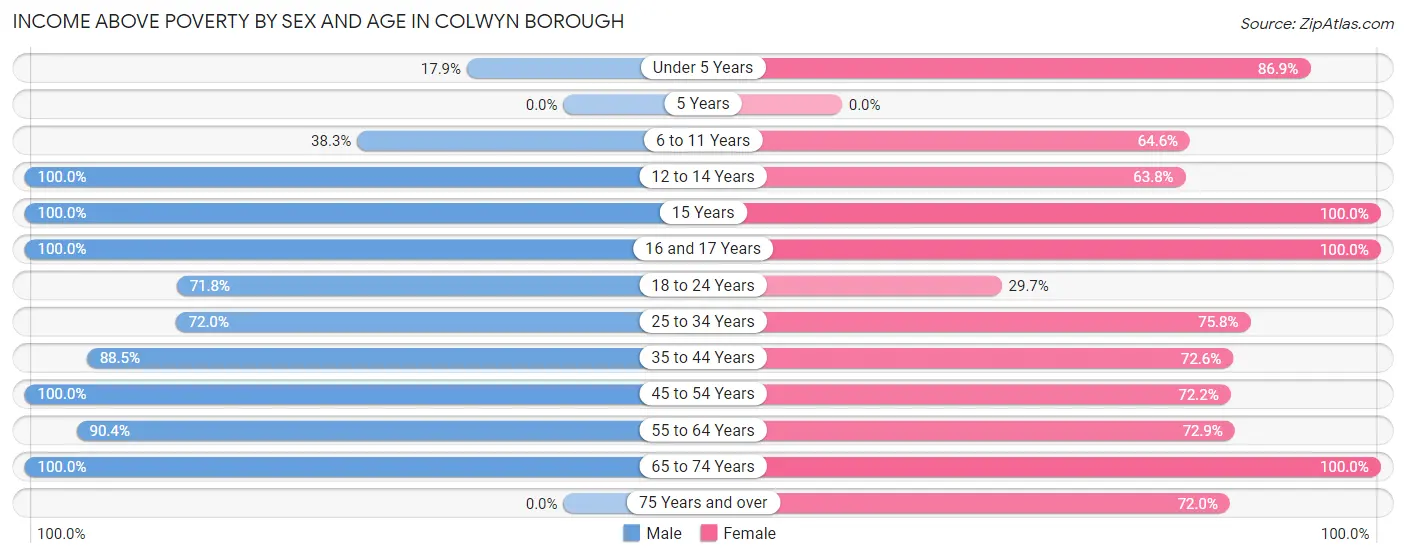
| Age Bracket | Male | Female |
| Under 5 Years | 12 (17.9%) | 93 (86.9%) |
| 5 Years | 0 (0.0%) | 0 (0.0%) |
| 6 to 11 Years | 93 (38.3%) | 115 (64.6%) |
| 12 to 14 Years | 27 (100.0%) | 44 (63.8%) |
| 15 Years | 51 (100.0%) | 11 (100.0%) |
| 16 and 17 Years | 26 (100.0%) | 54 (100.0%) |
| 18 to 24 Years | 122 (71.8%) | 97 (29.7%) |
| 25 to 34 Years | 195 (72.0%) | 138 (75.8%) |
| 35 to 44 Years | 115 (88.5%) | 122 (72.6%) |
| 45 to 54 Years | 106 (100.0%) | 171 (72.2%) |
| 55 to 64 Years | 75 (90.4%) | 105 (72.9%) |
| 65 to 74 Years | 42 (100.0%) | 80 (100.0%) |
| 75 Years and over | 0 (0.0%) | 18 (72.0%) |
| Total | 864 (71.1%) | 1,048 (64.2%) |
Income Below Poverty Among Married-Couple Families in Colwyn borough
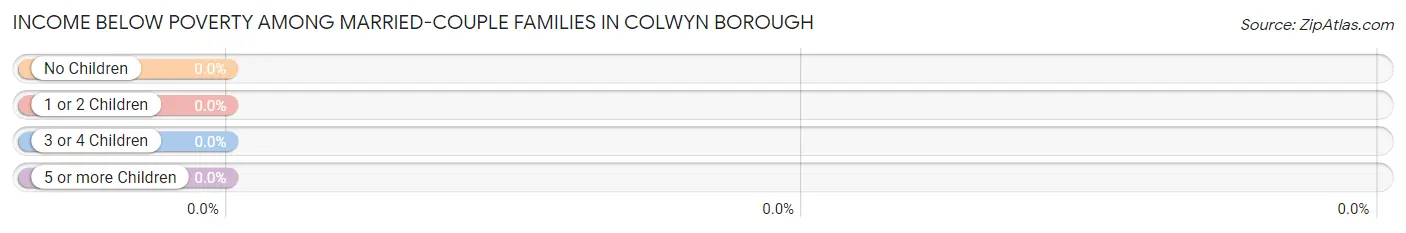
| Children | Above Poverty | Below Poverty |
| No Children | 122 (100.0%) | 0 (0.0%) |
| 1 or 2 Children | 60 (100.0%) | 0 (0.0%) |
| 3 or 4 Children | 78 (100.0%) | 0 (0.0%) |
| 5 or more Children | 0 (0.0%) | 0 (0.0%) |
| Total | 260 (100.0%) | 0 (0.0%) |
Income Below Poverty Among Single-Parent Households in Colwyn borough
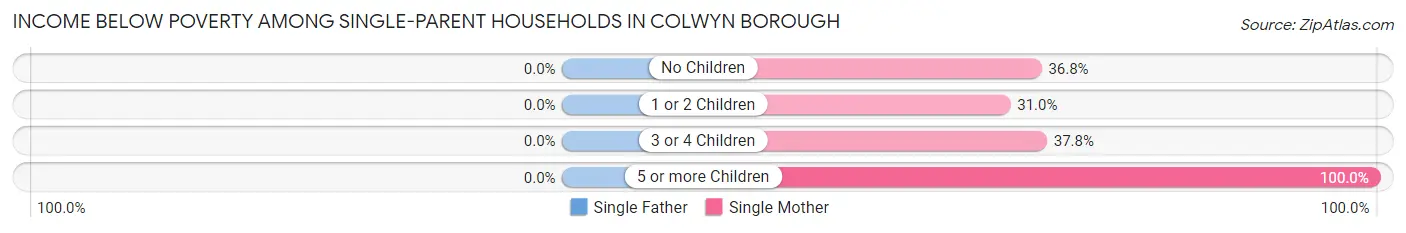
| Children | Single Father | Single Mother |
| No Children | 0 (0.0%) | 49 (36.8%) |
| 1 or 2 Children | 0 (0.0%) | 27 (31.0%) |
| 3 or 4 Children | 0 (0.0%) | 14 (37.8%) |
| 5 or more Children | 0 (0.0%) | 30 (100.0%) |
| Total | 0 (0.0%) | 120 (41.8%) |
Income Below Poverty Among Married-Couple vs Single-Parent Households in Colwyn borough
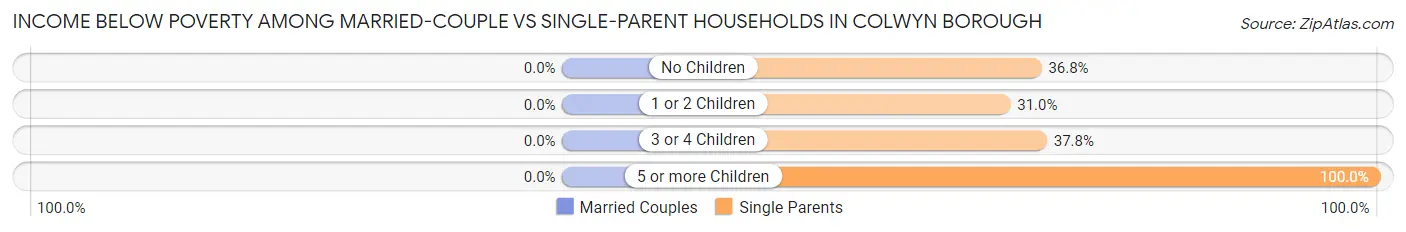
| Children | Married-Couple Families | Single-Parent Households |
| No Children | 0 (0.0%) | 49 (36.8%) |
| 1 or 2 Children | 0 (0.0%) | 27 (31.0%) |
| 3 or 4 Children | 0 (0.0%) | 14 (37.8%) |
| 5 or more Children | 0 (0.0%) | 30 (100.0%) |
| Total | 0 (0.0%) | 120 (41.8%) |
Race in Colwyn borough
The most populous races in Colwyn borough are Black / African American (2,649 | 93.0%), White / Caucasian (176 | 6.2%), and Hispanic or Latino (109 | 3.8%).
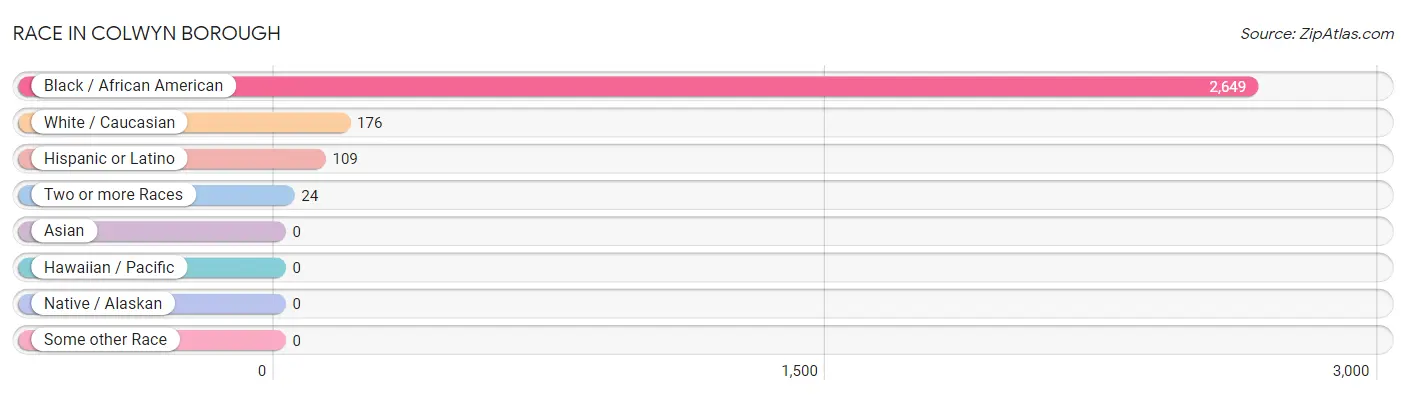
| Race | # Population | % Population |
| Asian | 0 | 0.0% |
| Black / African American | 2,649 | 93.0% |
| Hawaiian / Pacific | 0 | 0.0% |
| Hispanic or Latino | 109 | 3.8% |
| Native / Alaskan | 0 | 0.0% |
| White / Caucasian | 176 | 6.2% |
| Two or more Races | 24 | 0.8% |
| Some other Race | 0 | 0.0% |
| Total | 2,849 | 100.0% |
Ancestry in Colwyn borough
The most populous ancestries reported in Colwyn borough are Subsaharan African (808 | 28.4%), African (593 | 20.8%), Liberian (199 | 7.0%), Irish (120 | 4.2%), and Dominican (99 | 3.5%), together accounting for 63.8% of all Colwyn borough residents.
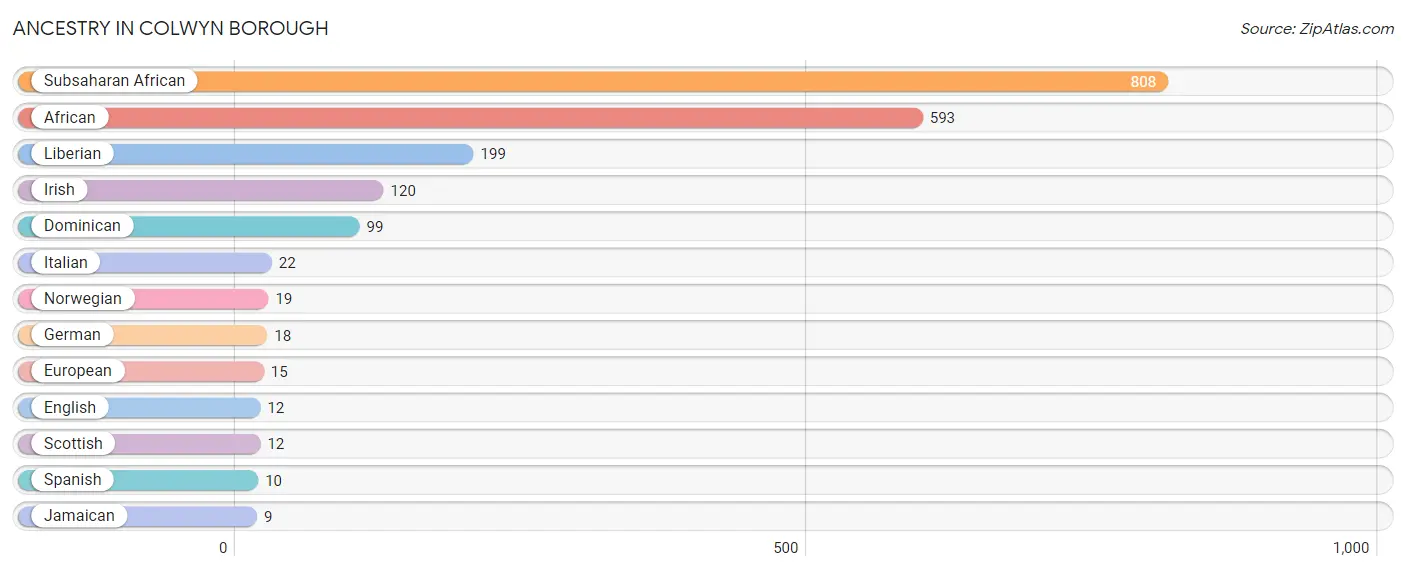
| Ancestry | # Population | % Population |
| African | 593 | 20.8% |
| Dominican | 99 | 3.5% |
| English | 12 | 0.4% |
| European | 15 | 0.5% |
| German | 18 | 0.6% |
| Irish | 120 | 4.2% |
| Italian | 22 | 0.8% |
| Jamaican | 9 | 0.3% |
| Liberian | 199 | 7.0% |
| Norwegian | 19 | 0.7% |
| Scottish | 12 | 0.4% |
| Spanish | 10 | 0.4% |
| Subsaharan African | 808 | 28.4% | View All 13 Rows |
Immigrants in Colwyn borough
The most numerous immigrant groups reported in Colwyn borough came from Africa (690 | 24.2%), Western Africa (632 | 22.2%), Liberia (437 | 15.3%), Nigeria (138 | 4.8%), and Sierra Leone (17 | 0.6%), together accounting for 67.2% of all Colwyn borough residents.
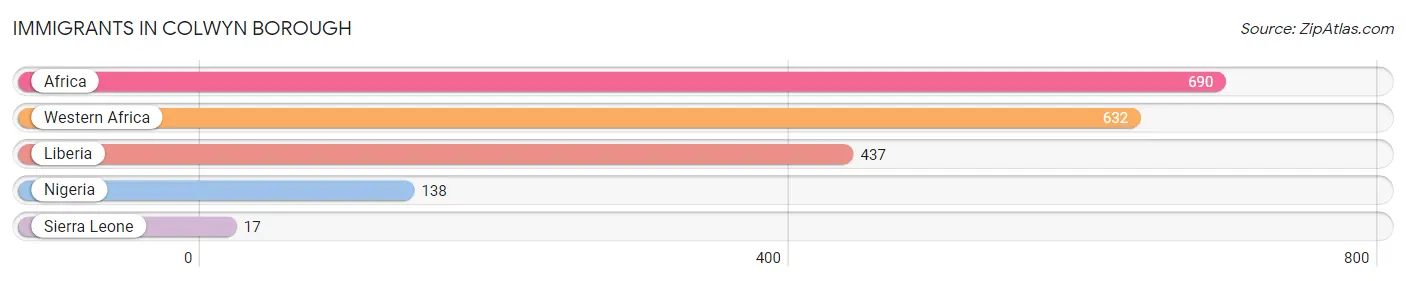
| Immigration Origin | # Population | % Population |
| Africa | 690 | 24.2% |
| Liberia | 437 | 15.3% |
| Nigeria | 138 | 4.8% |
| Sierra Leone | 17 | 0.6% |
| Western Africa | 632 | 22.2% | View All 5 Rows |
Sex and Age in Colwyn borough
Sex and Age in Colwyn borough
The most populous age groups in Colwyn borough are 25 to 29 Years (249 | 20.5%) for men and 20 to 24 Years (283 | 17.3%) for women.
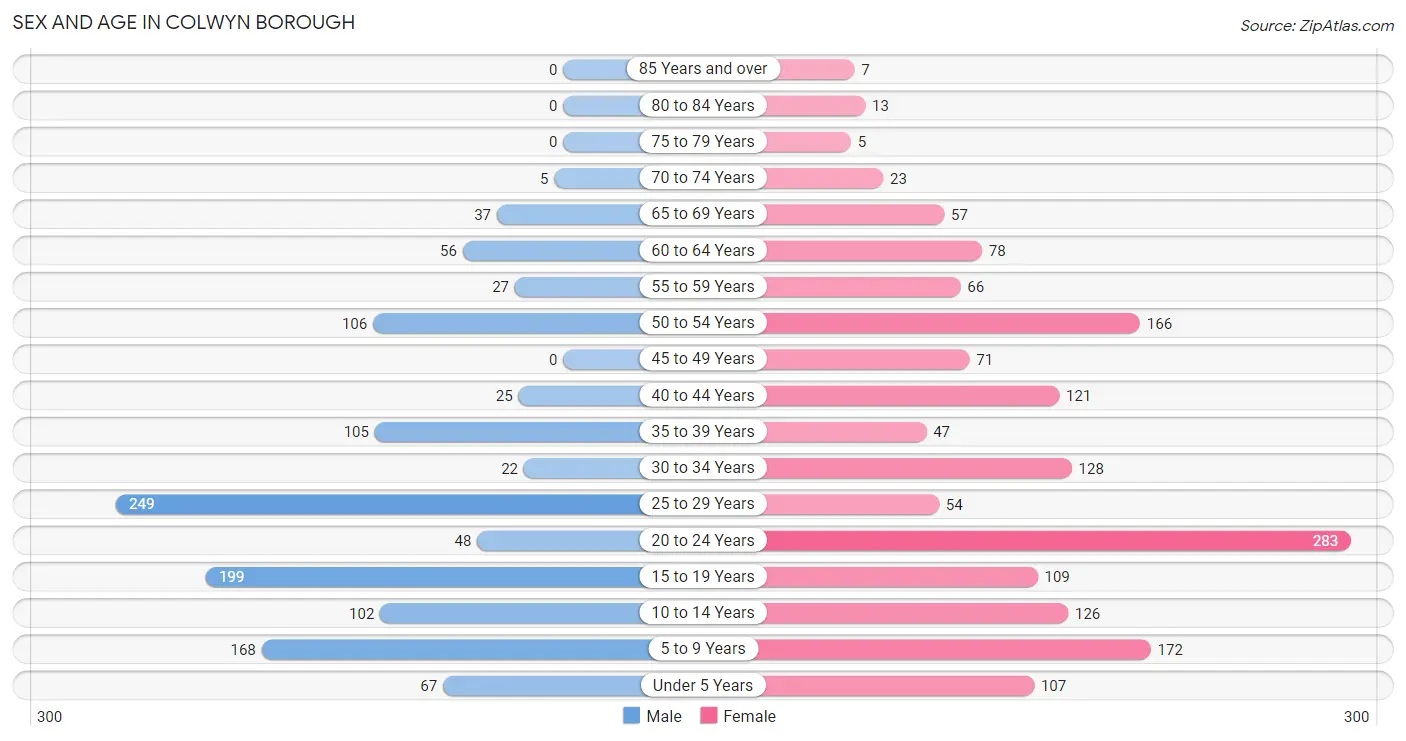
| Age Bracket | Male | Female |
| Under 5 Years | 67 (5.5%) | 107 (6.6%) |
| 5 to 9 Years | 168 (13.8%) | 172 (10.5%) |
| 10 to 14 Years | 102 (8.4%) | 126 (7.7%) |
| 15 to 19 Years | 199 (16.4%) | 109 (6.7%) |
| 20 to 24 Years | 48 (4.0%) | 283 (17.3%) |
| 25 to 29 Years | 249 (20.5%) | 54 (3.3%) |
| 30 to 34 Years | 22 (1.8%) | 128 (7.8%) |
| 35 to 39 Years | 105 (8.6%) | 47 (2.9%) |
| 40 to 44 Years | 25 (2.1%) | 121 (7.4%) |
| 45 to 49 Years | 0 (0.0%) | 71 (4.3%) |
| 50 to 54 Years | 106 (8.7%) | 166 (10.2%) |
| 55 to 59 Years | 27 (2.2%) | 66 (4.0%) |
| 60 to 64 Years | 56 (4.6%) | 78 (4.8%) |
| 65 to 69 Years | 37 (3.0%) | 57 (3.5%) |
| 70 to 74 Years | 5 (0.4%) | 23 (1.4%) |
| 75 to 79 Years | 0 (0.0%) | 5 (0.3%) |
| 80 to 84 Years | 0 (0.0%) | 13 (0.8%) |
| 85 Years and over | 0 (0.0%) | 7 (0.4%) |
| Total | 1,216 (100.0%) | 1,633 (100.0%) |
Families and Households in Colwyn borough
Median Family Size in Colwyn borough
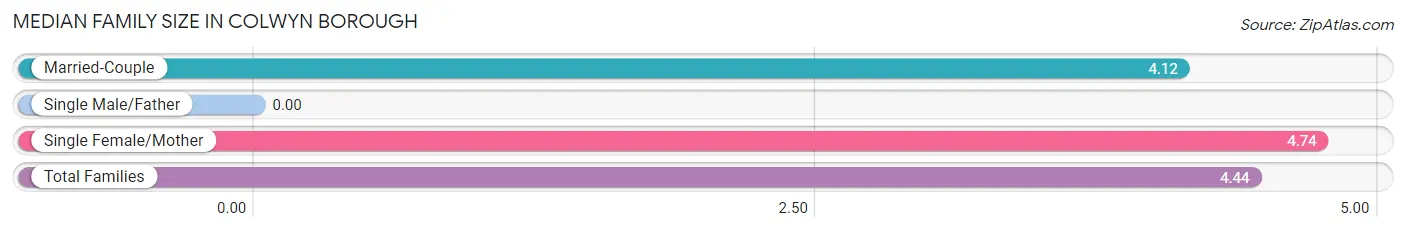
| Family Type | # Families | Family Size |
| Married-Couple | 260 (47.5%) | 4.12 |
| Single Male/Father | 0 (0.0%) | - |
| Single Female/Mother | 287 (52.5%) | 4.74 |
| Total Families | 547 (100.0%) | 4.44 |
Median Household Size in Colwyn borough
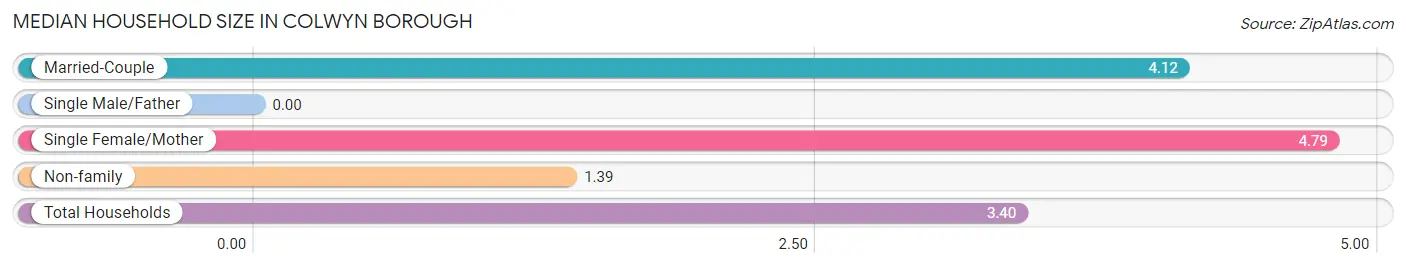
| Household Type | # Households | Household Size |
| Married-Couple | 260 (31.1%) | 4.12 |
| Single Male/Father | 0 (0.0%) | - |
| Single Female/Mother | 287 (34.3%) | 4.79 |
| Non-family | 290 (34.6%) | 1.39 |
| Total Households | 837 (100.0%) | 3.40 |
Household Size by Marriage Status in Colwyn borough
Out of a total of 837 households in Colwyn borough, 547 (65.3%) are family households, while 290 (34.6%) are nonfamily households. The most numerous type of family households are 2-person households, comprising 172, and the most common type of nonfamily households are 1-person households, comprising 216.
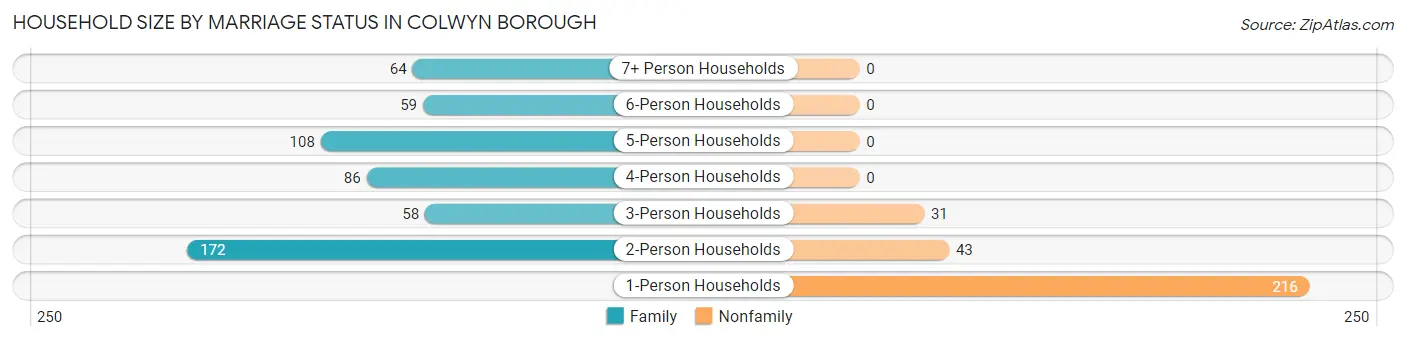
| Household Size | Family Households | Nonfamily Households |
| 1-Person Households | - | 216 (25.8%) |
| 2-Person Households | 172 (20.5%) | 43 (5.1%) |
| 3-Person Households | 58 (6.9%) | 31 (3.7%) |
| 4-Person Households | 86 (10.3%) | 0 (0.0%) |
| 5-Person Households | 108 (12.9%) | 0 (0.0%) |
| 6-Person Households | 59 (7.0%) | 0 (0.0%) |
| 7+ Person Households | 64 (7.6%) | 0 (0.0%) |
| Total | 547 (65.3%) | 290 (34.6%) |
Female Fertility in Colwyn borough
Fertility by Age in Colwyn borough
Average fertility rate in Colwyn borough is 43.0 births per 1,000 women. Women in the age bracket of 20 to 34 years have the highest fertility rate with 77.0 births per 1,000 women. Women in the age bracket of 20 to 34 years acount for 100.0% of all women with births.
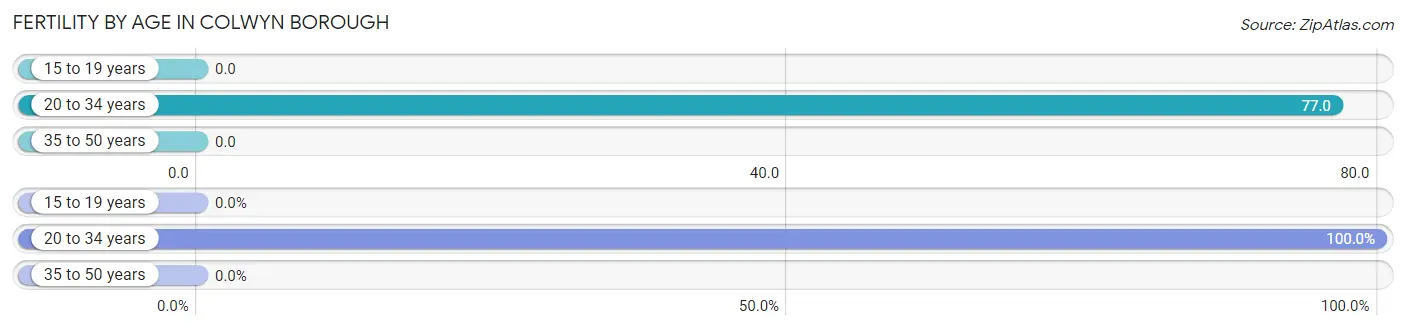
| Age Bracket | Women with Births | Births / 1,000 Women |
| 15 to 19 years | 0 (0.0%) | 0.0 |
| 20 to 34 years | 36 (100.0%) | 77.0 |
| 35 to 50 years | 0 (0.0%) | 0.0 |
| Total | 36 (100.0%) | 43.0 |
Fertility by Age by Marriage Status in Colwyn borough
19.4% of women with births (36) in Colwyn borough are married. The highest percentage of unmarried women with births falls into 20 to 34 years age bracket with 80.6% of them unmarried at the time of birth, while the lowest percentage of unmarried women with births belong to 20 to 34 years age bracket with 80.6% of them unmarried.
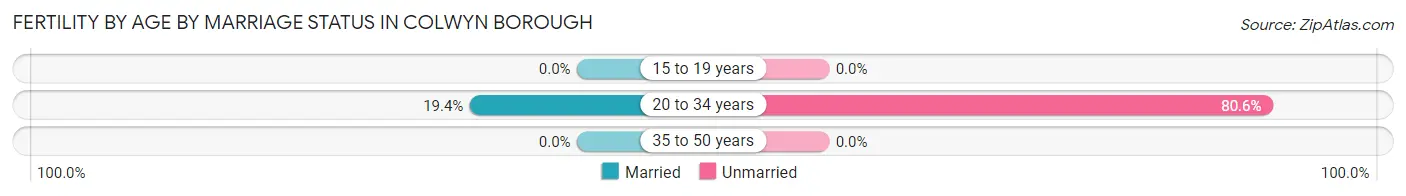
| Age Bracket | Married | Unmarried |
| 15 to 19 years | 0 (0.0%) | 0 (0.0%) |
| 20 to 34 years | 7 (19.4%) | 29 (80.6%) |
| 35 to 50 years | 0 (0.0%) | 0 (0.0%) |
| Total | 7 (19.4%) | 29 (80.6%) |
Fertility by Education in Colwyn borough
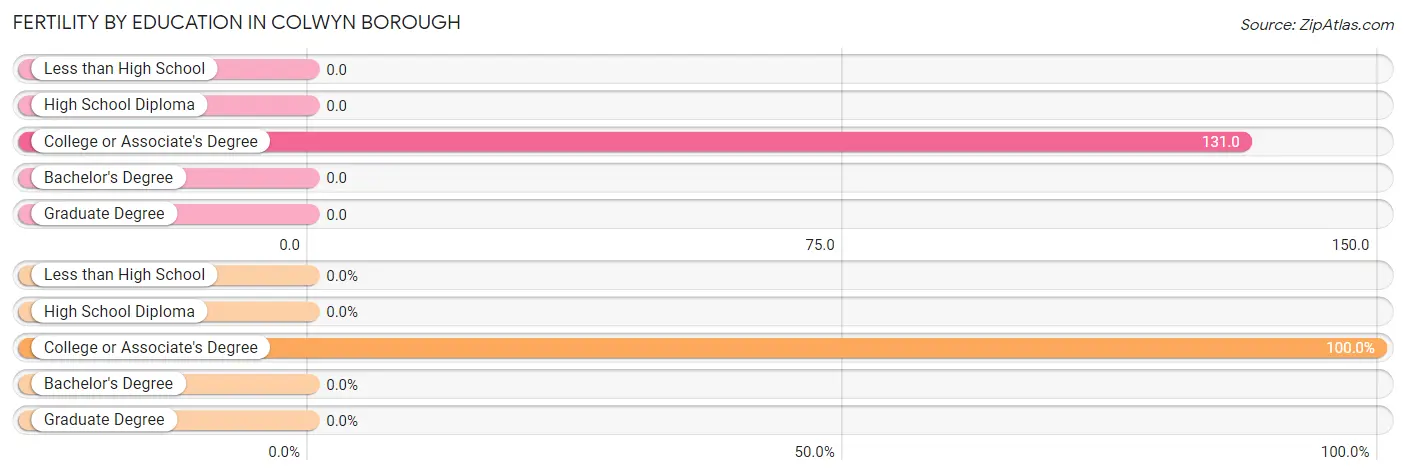
| Educational Attainment | Women with Births | Births / 1,000 Women |
| Less than High School | 0 (0.0%) | 0.0 |
| High School Diploma | 0 (0.0%) | 0.0 |
| College or Associate's Degree | 36 (100.0%) | 131.0 |
| Bachelor's Degree | 0 (0.0%) | 0.0 |
| Graduate Degree | 0 (0.0%) | 0.0 |
| Total | 36 (100.0%) | 43.0 |
Fertility by Education by Marriage Status in Colwyn borough
80.6% of women with births in Colwyn borough are unmarried. Women with the educational attainment of college or associate's degree are most likely to be married with 19.4% of them married at childbirth, while women with the educational attainment of college or associate's degree are least likely to be married with 80.6% of them unmarried at childbirth.
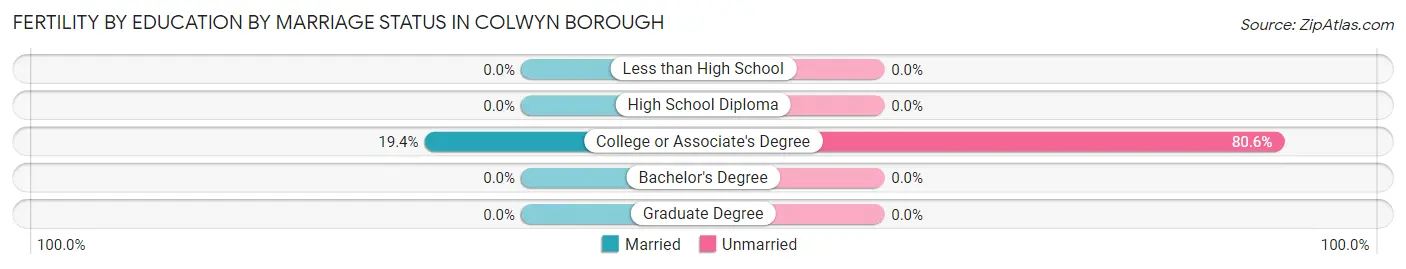
| Educational Attainment | Married | Unmarried |
| Less than High School | 0 (0.0%) | 0 (0.0%) |
| High School Diploma | 0 (0.0%) | 0 (0.0%) |
| College or Associate's Degree | 7 (19.4%) | 29 (80.6%) |
| Bachelor's Degree | 0 (0.0%) | 0 (0.0%) |
| Graduate Degree | 0 (0.0%) | 0 (0.0%) |
| Total | 7 (19.4%) | 29 (80.6%) |
Employment Characteristics in Colwyn borough
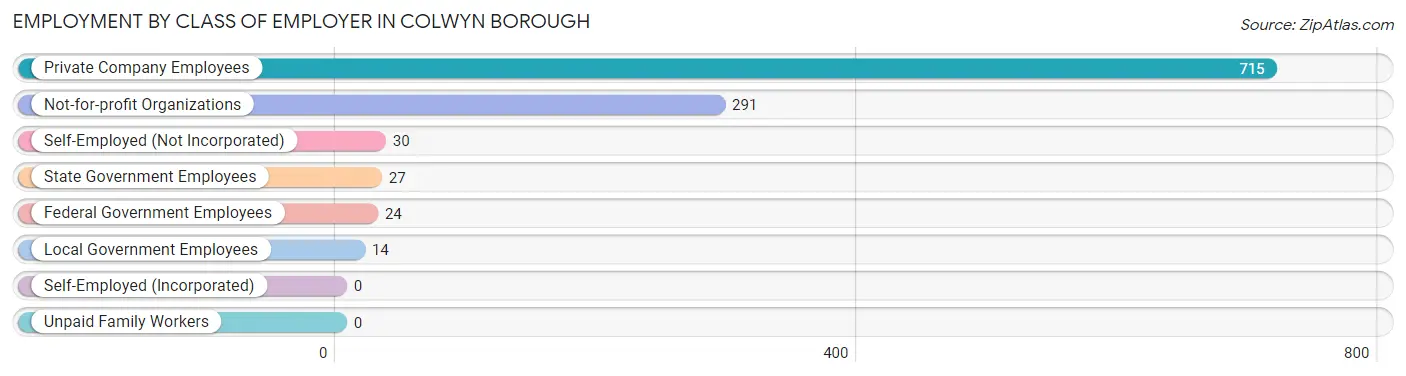
Employment by Class of Employer in Colwyn borough
Among the 1,101 employed individuals in Colwyn borough, private company employees (715 | 64.9%), not-for-profit organizations (291 | 26.4%), and self-employed (not incorporated) (30 | 2.7%) make up the most common classes of employment.
| Employer Class | # Employees | % Employees |
| Private Company Employees | 715 | 64.9% |
| Self-Employed (Incorporated) | 0 | 0.0% |
| Self-Employed (Not Incorporated) | 30 | 2.7% |
| Not-for-profit Organizations | 291 | 26.4% |
| Local Government Employees | 14 | 1.3% |
| State Government Employees | 27 | 2.5% |
| Federal Government Employees | 24 | 2.2% |
| Unpaid Family Workers | 0 | 0.0% |
| Total | 1,101 | 100.0% |
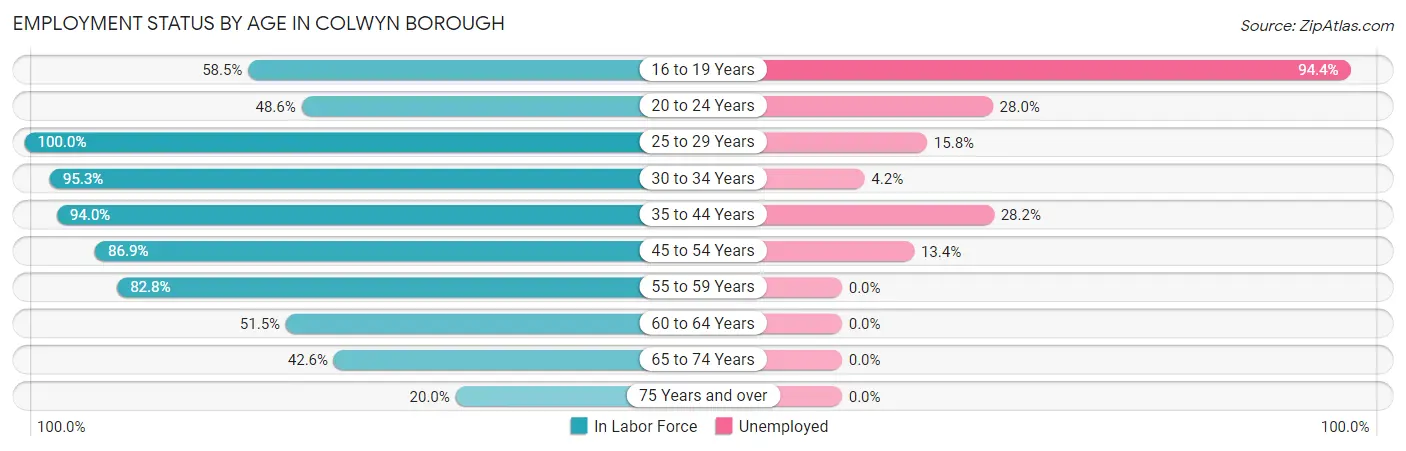
Employment Status by Age in Colwyn borough
According to the labor force statistics for Colwyn borough, out of the total population over 16 years of age (2,045), 74.9% or 1,532 individuals are in the labor force, with 23.1% or 354 of them unemployed. The age group with the highest labor force participation rate is 25 to 29 years, with 100.0% or 303 individuals in the labor force. Within the labor force, the 16 to 19 years age range has the highest percentage of unemployed individuals, with 94.4% or 136 of them being unemployed.
| Age Bracket | In Labor Force | Unemployed |
| 16 to 19 Years | 144 (58.5%) | 136 (94.4%) |
| 20 to 24 Years | 161 (48.6%) | 45 (28.0%) |
| 25 to 29 Years | 303 (100.0%) | 48 (15.8%) |
| 30 to 34 Years | 143 (95.3%) | 6 (4.2%) |
| 35 to 44 Years | 280 (94.0%) | 79 (28.2%) |
| 45 to 54 Years | 298 (86.9%) | 40 (13.4%) |
| 55 to 59 Years | 77 (82.8%) | 0 (0.0%) |
| 60 to 64 Years | 69 (51.5%) | 0 (0.0%) |
| 65 to 74 Years | 52 (42.6%) | 0 (0.0%) |
| 75 Years and over | 5 (20.0%) | 0 (0.0%) |
| Total | 1,532 (74.9%) | 354 (23.1%) |
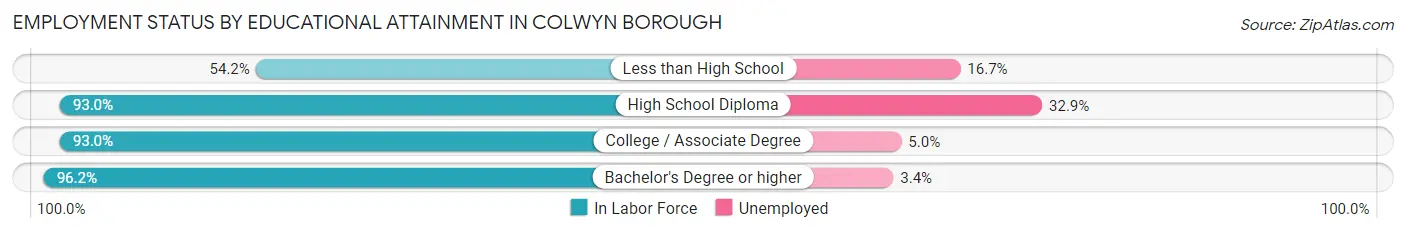
Employment Status by Educational Attainment in Colwyn borough
According to labor force statistics for Colwyn borough, 88.6% of individuals (1,170) out of the total population between 25 and 64 years of age (1,321) are in the labor force, with 14.8% or 173 of them being unemployed. The group with the highest labor force participation rate are those with the educational attainment of bachelor's degree or higher, with 96.2% or 177 individuals in the labor force. Within the labor force, individuals with high school diploma education have the highest percentage of unemployment, with 32.9% or 126 of them being unemployed.
| Educational Attainment | In Labor Force | Unemployed |
| Less than High School | 90 (54.2%) | 28 (16.7%) |
| High School Diploma | 383 (93.0%) | 136 (32.9%) |
| College / Associate Degree | 520 (93.0%) | 28 (5.0%) |
| Bachelor's Degree or higher | 177 (96.2%) | 6 (3.4%) |
| Total | 1,170 (88.6%) | 196 (14.8%) |
Employment Occupations by Sex in Colwyn borough
Management, Business, Science and Arts Occupations
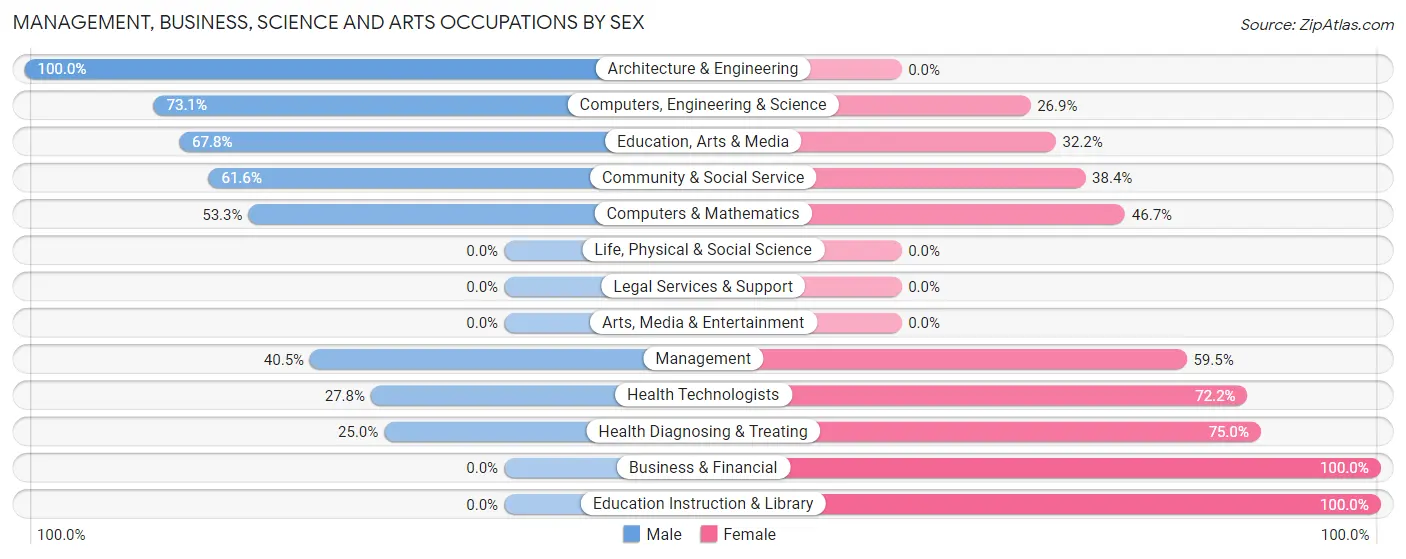
The most common Management, Business, Science and Arts occupations in Colwyn borough are Community & Social Service (99 | 8.4%), Education, Arts & Media (90 | 7.6%), Management (42 | 3.6%), Computers, Engineering & Science (26 | 2.2%), and Business & Financial (23 | 1.9%).
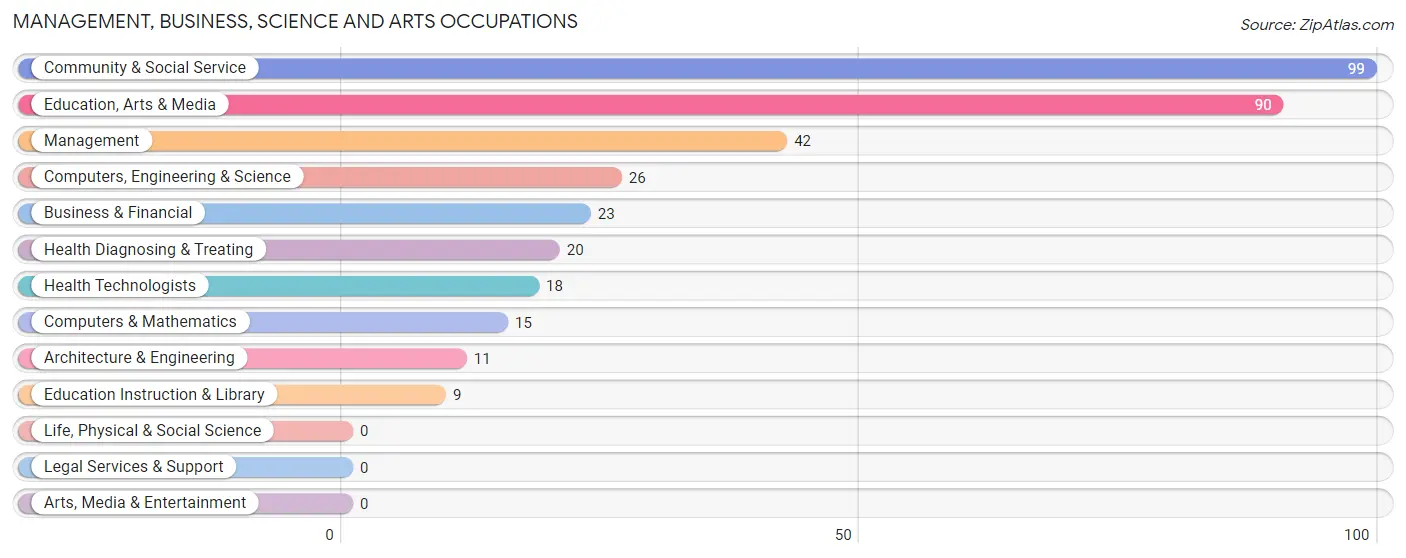
Management, Business, Science and Arts Occupations by Sex
Within the Management, Business, Science and Arts occupations in Colwyn borough, the most male-oriented occupations are Architecture & Engineering (100.0%), Computers, Engineering & Science (73.1%), and Education, Arts & Media (67.8%), while the most female-oriented occupations are Business & Financial (100.0%), Education Instruction & Library (100.0%), and Health Diagnosing & Treating (75.0%).
| Occupation | Male | Female |
| Management | 17 (40.5%) | 25 (59.5%) |
| Business & Financial | 0 (0.0%) | 23 (100.0%) |
| Computers, Engineering & Science | 19 (73.1%) | 7 (26.9%) |
| Computers & Mathematics | 8 (53.3%) | 7 (46.7%) |
| Architecture & Engineering | 11 (100.0%) | 0 (0.0%) |
| Life, Physical & Social Science | 0 (0.0%) | 0 (0.0%) |
| Community & Social Service | 61 (61.6%) | 38 (38.4%) |
| Education, Arts & Media | 61 (67.8%) | 29 (32.2%) |
| Legal Services & Support | 0 (0.0%) | 0 (0.0%) |
| Education Instruction & Library | 0 (0.0%) | 9 (100.0%) |
| Arts, Media & Entertainment | 0 (0.0%) | 0 (0.0%) |
| Health Diagnosing & Treating | 5 (25.0%) | 15 (75.0%) |
| Health Technologists | 5 (27.8%) | 13 (72.2%) |
| Total (Category) | 102 (48.6%) | 108 (51.4%) |
| Total (Overall) | 519 (44.1%) | 659 (55.9%) |
Services Occupations
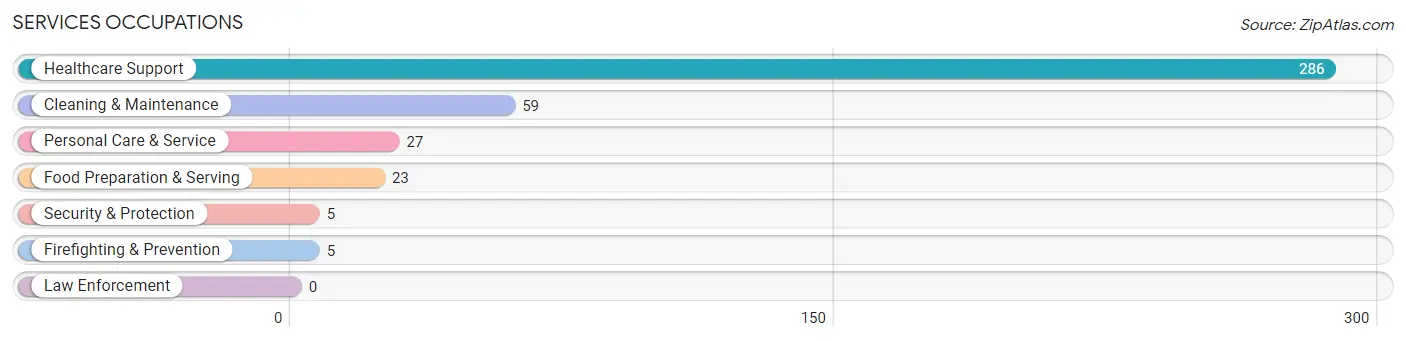
The most common Services occupations in Colwyn borough are Healthcare Support (286 | 24.3%), Cleaning & Maintenance (59 | 5.0%), Personal Care & Service (27 | 2.3%), Food Preparation & Serving (23 | 1.9%), and Security & Protection (5 | 0.4%).
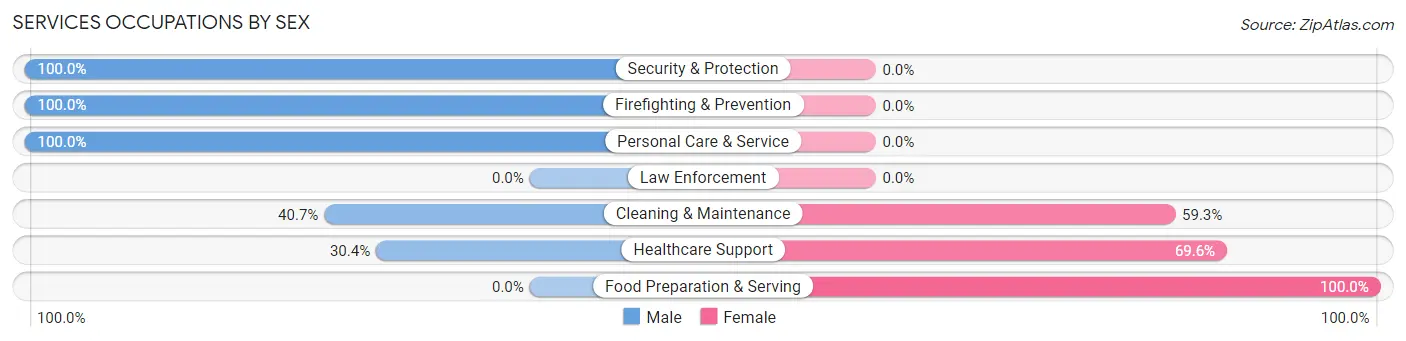
Services Occupations by Sex
Within the Services occupations in Colwyn borough, the most male-oriented occupations are Security & Protection (100.0%), Firefighting & Prevention (100.0%), and Personal Care & Service (100.0%), while the most female-oriented occupations are Food Preparation & Serving (100.0%), Healthcare Support (69.6%), and Cleaning & Maintenance (59.3%).
| Occupation | Male | Female |
| Healthcare Support | 87 (30.4%) | 199 (69.6%) |
| Security & Protection | 5 (100.0%) | 0 (0.0%) |
| Firefighting & Prevention | 5 (100.0%) | 0 (0.0%) |
| Law Enforcement | 0 (0.0%) | 0 (0.0%) |
| Food Preparation & Serving | 0 (0.0%) | 23 (100.0%) |
| Cleaning & Maintenance | 24 (40.7%) | 35 (59.3%) |
| Personal Care & Service | 27 (100.0%) | 0 (0.0%) |
| Total (Category) | 143 (35.7%) | 257 (64.2%) |
| Total (Overall) | 519 (44.1%) | 659 (55.9%) |
Sales and Office Occupations
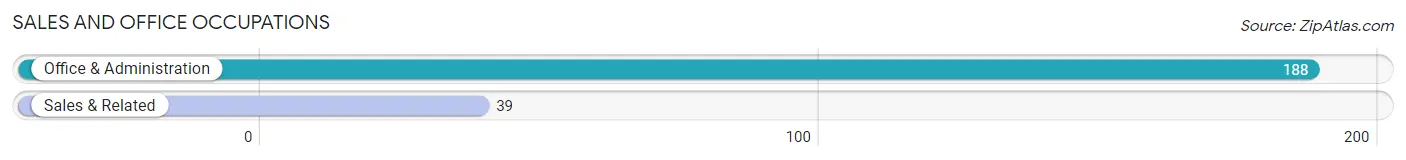
The most common Sales and Office occupations in Colwyn borough are Office & Administration (188 | 16.0%), and Sales & Related (39 | 3.3%).
Sales and Office Occupations by Sex
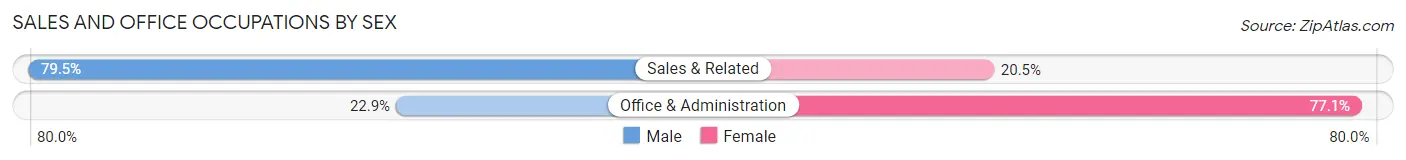
| Occupation | Male | Female |
| Sales & Related | 31 (79.5%) | 8 (20.5%) |
| Office & Administration | 43 (22.9%) | 145 (77.1%) |
| Total (Category) | 74 (32.6%) | 153 (67.4%) |
| Total (Overall) | 519 (44.1%) | 659 (55.9%) |
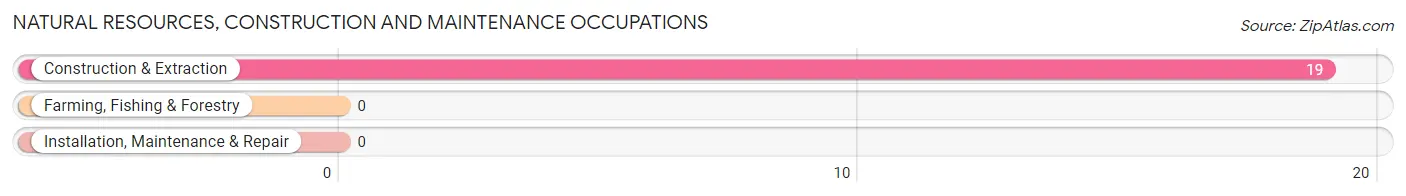
Natural Resources, Construction and Maintenance Occupations
The most common Natural Resources, Construction and Maintenance occupations in Colwyn borough are , and Construction & Extraction (19 | 1.6%).
Natural Resources, Construction and Maintenance Occupations by Sex
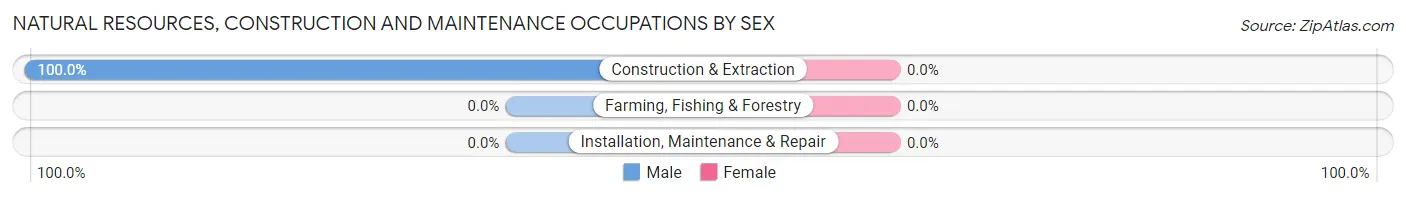
| Occupation | Male | Female |
| Farming, Fishing & Forestry | 0 (0.0%) | 0 (0.0%) |
| Construction & Extraction | 19 (100.0%) | 0 (0.0%) |
| Installation, Maintenance & Repair | 0 (0.0%) | 0 (0.0%) |
| Total (Category) | 19 (100.0%) | 0 (0.0%) |
| Total (Overall) | 519 (44.1%) | 659 (55.9%) |
Production, Transportation and Moving Occupations
The most common Production, Transportation and Moving occupations in Colwyn borough are Transportation (181 | 15.4%), Material Moving (117 | 9.9%), and Production (24 | 2.0%).
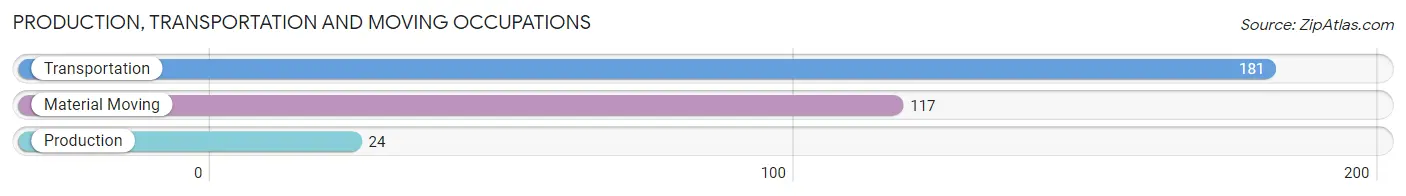
Production, Transportation and Moving Occupations by Sex
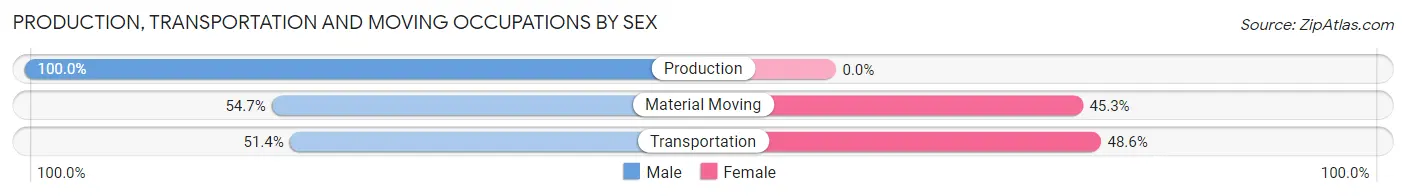
| Occupation | Male | Female |
| Production | 24 (100.0%) | 0 (0.0%) |
| Transportation | 93 (51.4%) | 88 (48.6%) |
| Material Moving | 64 (54.7%) | 53 (45.3%) |
| Total (Category) | 181 (56.2%) | 141 (43.8%) |
| Total (Overall) | 519 (44.1%) | 659 (55.9%) |
Employment Industries by Sex in Colwyn borough
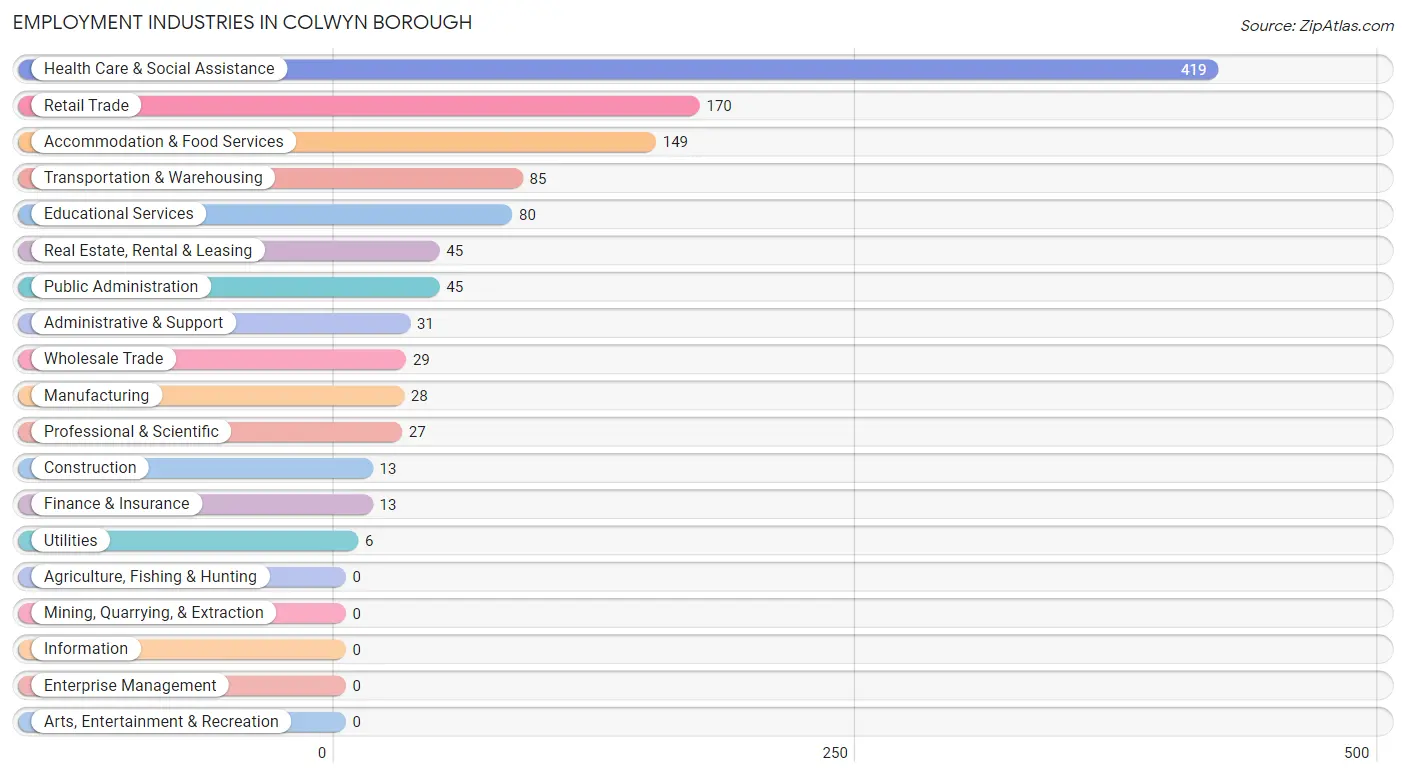
Employment Industries in Colwyn borough
The major employment industries in Colwyn borough include Health Care & Social Assistance (419 | 35.6%), Retail Trade (170 | 14.4%), Accommodation & Food Services (149 | 12.7%), Transportation & Warehousing (85 | 7.2%), and Educational Services (80 | 6.8%).
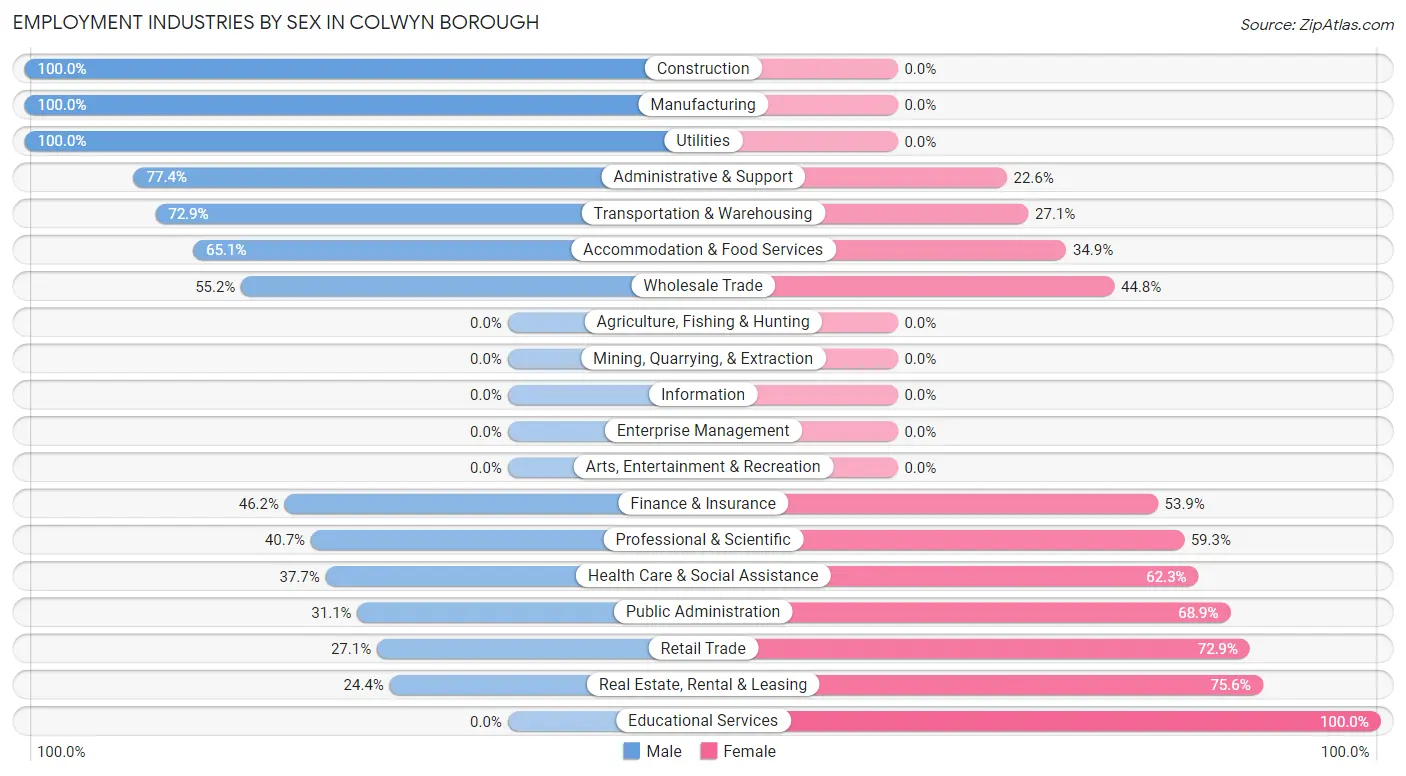
Employment Industries by Sex in Colwyn borough
The Colwyn borough industries that see more men than women are Construction (100.0%), Manufacturing (100.0%), and Utilities (100.0%), whereas the industries that tend to have a higher number of women are Educational Services (100.0%), Real Estate, Rental & Leasing (75.6%), and Retail Trade (72.9%).
| Industry | Male | Female |
| Agriculture, Fishing & Hunting | 0 (0.0%) | 0 (0.0%) |
| Mining, Quarrying, & Extraction | 0 (0.0%) | 0 (0.0%) |
| Construction | 13 (100.0%) | 0 (0.0%) |
| Manufacturing | 28 (100.0%) | 0 (0.0%) |
| Wholesale Trade | 16 (55.2%) | 13 (44.8%) |
| Retail Trade | 46 (27.1%) | 124 (72.9%) |
| Transportation & Warehousing | 62 (72.9%) | 23 (27.1%) |
| Utilities | 6 (100.0%) | 0 (0.0%) |
| Information | 0 (0.0%) | 0 (0.0%) |
| Finance & Insurance | 6 (46.2%) | 7 (53.8%) |
| Real Estate, Rental & Leasing | 11 (24.4%) | 34 (75.6%) |
| Professional & Scientific | 11 (40.7%) | 16 (59.3%) |
| Enterprise Management | 0 (0.0%) | 0 (0.0%) |
| Administrative & Support | 24 (77.4%) | 7 (22.6%) |
| Educational Services | 0 (0.0%) | 80 (100.0%) |
| Health Care & Social Assistance | 158 (37.7%) | 261 (62.3%) |
| Arts, Entertainment & Recreation | 0 (0.0%) | 0 (0.0%) |
| Accommodation & Food Services | 97 (65.1%) | 52 (34.9%) |
| Public Administration | 14 (31.1%) | 31 (68.9%) |
| Total | 519 (44.1%) | 659 (55.9%) |
Education in Colwyn borough
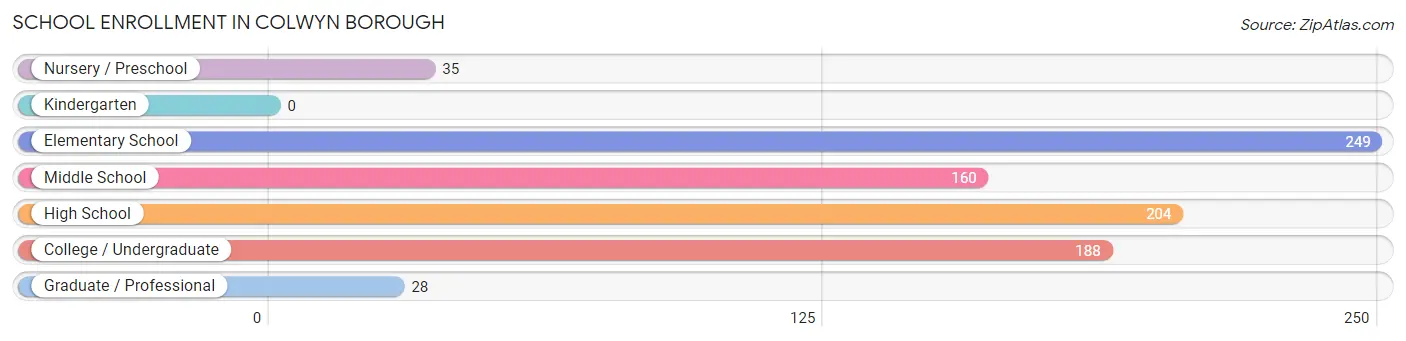
School Enrollment in Colwyn borough
The most common levels of schooling among the 864 students in Colwyn borough are elementary school (249 | 28.8%), high school (204 | 23.6%), and college / undergraduate (188 | 21.8%).
| School Level | # Students | % Students |
| Nursery / Preschool | 35 | 4.1% |
| Kindergarten | 0 | 0.0% |
| Elementary School | 249 | 28.8% |
| Middle School | 160 | 18.5% |
| High School | 204 | 23.6% |
| College / Undergraduate | 188 | 21.8% |
| Graduate / Professional | 28 | 3.2% |
| Total | 864 | 100.0% |
School Enrollment by Age by Funding Source in Colwyn borough
Out of a total of 864 students who are enrolled in schools in Colwyn borough, 165 (19.1%) attend a private institution, while the remaining 699 (80.9%) are enrolled in public schools. The age group of 20 to 24 year olds has the highest likelihood of being enrolled in private schools, with 27 (36.0% in the age bracket) enrolled. Conversely, the age group of 3 to 4 year olds has the lowest likelihood of being enrolled in a private school, with 35 (100.0% in the age bracket) attending a public institution.
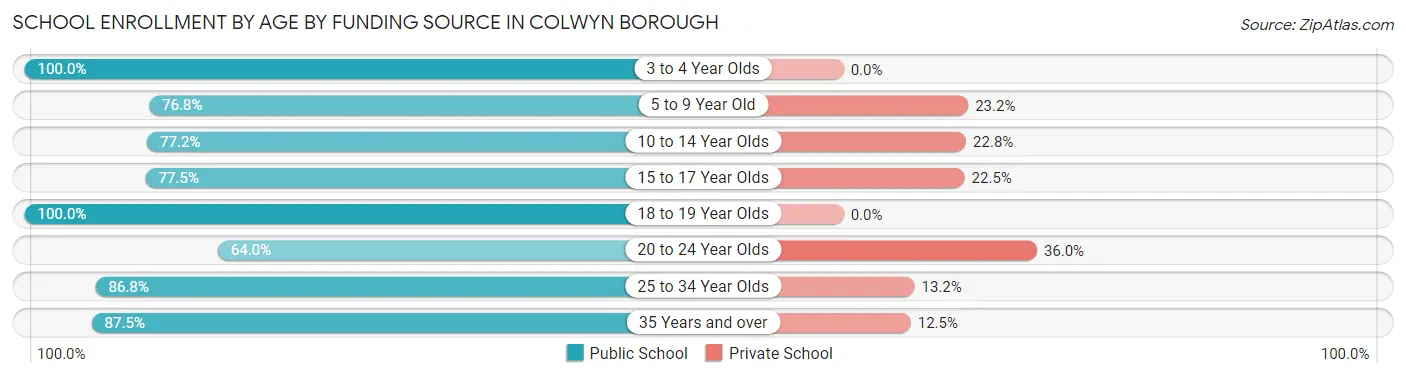
| Age Bracket | Public School | Private School |
| 3 to 4 Year Olds | 35 (100.0%) | 0 (0.0%) |
| 5 to 9 Year Old | 139 (76.8%) | 42 (23.2%) |
| 10 to 14 Year Olds | 176 (77.2%) | 52 (22.8%) |
| 15 to 17 Year Olds | 110 (77.5%) | 32 (22.5%) |
| 18 to 19 Year Olds | 110 (100.0%) | 0 (0.0%) |
| 20 to 24 Year Olds | 48 (64.0%) | 27 (36.0%) |
| 25 to 34 Year Olds | 46 (86.8%) | 7 (13.2%) |
| 35 Years and over | 35 (87.5%) | 5 (12.5%) |
| Total | 699 (80.9%) | 165 (19.1%) |
Educational Attainment by Field of Study in Colwyn borough
Business (71 | 33.2%), arts & humanities (47 | 22.0%), social sciences (32 | 14.9%), literature & languages (15 | 7.0%), and psychology (12 | 5.6%) are the most common fields of study among 214 individuals in Colwyn borough who have obtained a bachelor's degree or higher.
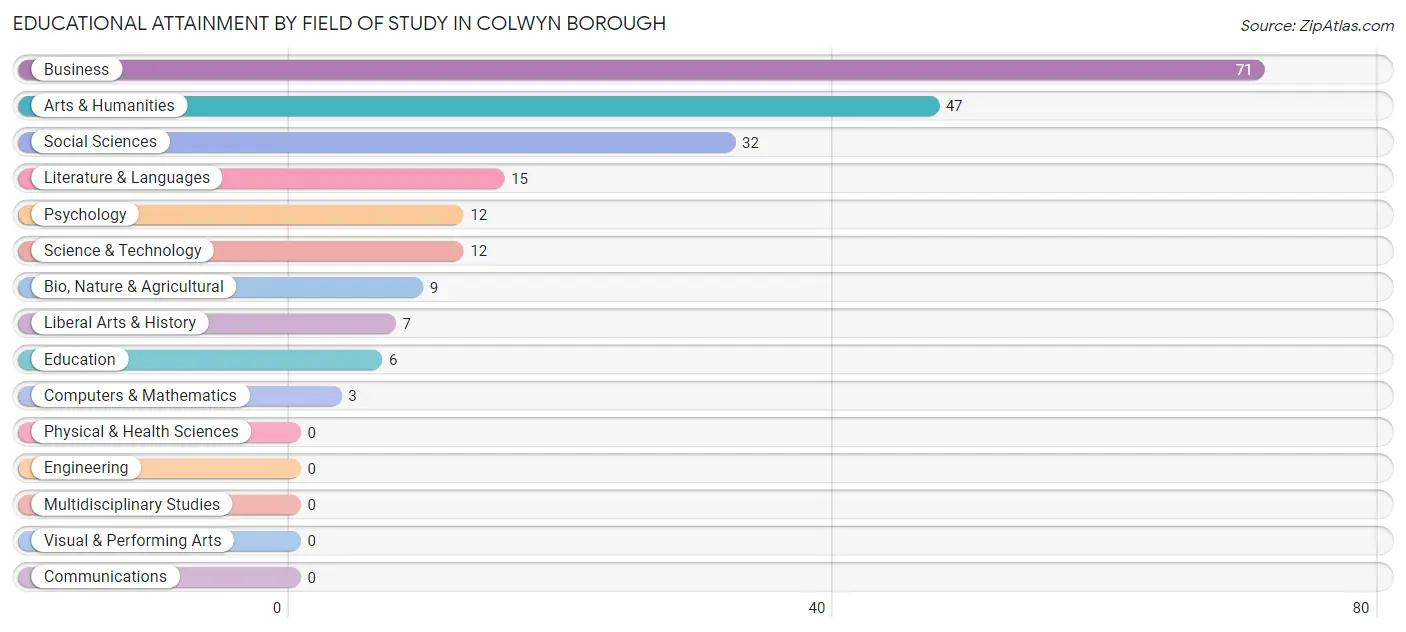
| Field of Study | # Graduates | % Graduates |
| Computers & Mathematics | 3 | 1.4% |
| Bio, Nature & Agricultural | 9 | 4.2% |
| Physical & Health Sciences | 0 | 0.0% |
| Psychology | 12 | 5.6% |
| Social Sciences | 32 | 14.9% |
| Engineering | 0 | 0.0% |
| Multidisciplinary Studies | 0 | 0.0% |
| Science & Technology | 12 | 5.6% |
| Business | 71 | 33.2% |
| Education | 6 | 2.8% |
| Literature & Languages | 15 | 7.0% |
| Liberal Arts & History | 7 | 3.3% |
| Visual & Performing Arts | 0 | 0.0% |
| Communications | 0 | 0.0% |
| Arts & Humanities | 47 | 22.0% |
| Total | 214 | 100.0% |
Transportation & Commute in Colwyn borough
Vehicle Availability by Sex in Colwyn borough
The most prevalent vehicle ownership categories in Colwyn borough are males with 2 vehicles (273, accounting for 56.8%) and females with 2 vehicles (275, making up 44.0%).
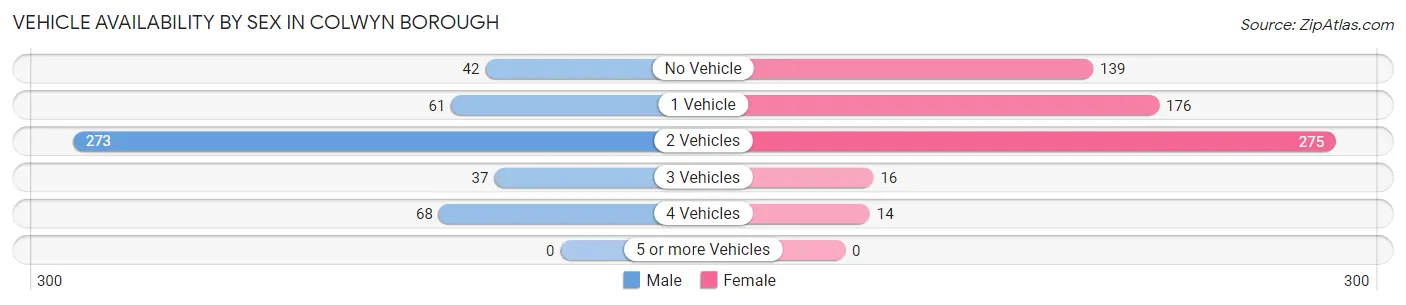
| Vehicles Available | Male | Female |
| No Vehicle | 42 (8.7%) | 139 (22.4%) |
| 1 Vehicle | 61 (12.7%) | 176 (28.4%) |
| 2 Vehicles | 273 (56.8%) | 275 (44.4%) |
| 3 Vehicles | 37 (7.7%) | 16 (2.6%) |
| 4 Vehicles | 68 (14.1%) | 14 (2.3%) |
| 5 or more Vehicles | 0 (0.0%) | 0 (0.0%) |
| Total | 481 (100.0%) | 620 (100.0%) |
Commute Time in Colwyn borough
The most frequently occuring commute durations in Colwyn borough are 30 to 34 minutes (218 commuters, 20.3%), 60 to 89 minutes (201 commuters, 18.7%), and 40 to 44 minutes (154 commuters, 14.3%).
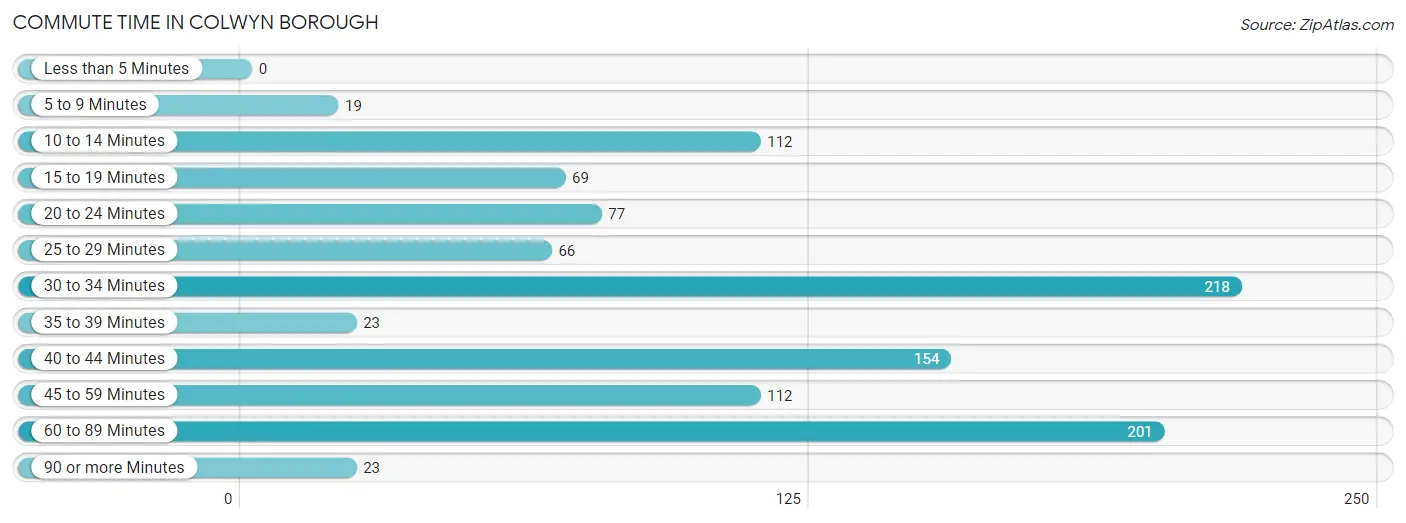
| Commute Time | # Commuters | % Commuters |
| Less than 5 Minutes | 0 | 0.0% |
| 5 to 9 Minutes | 19 | 1.8% |
| 10 to 14 Minutes | 112 | 10.4% |
| 15 to 19 Minutes | 69 | 6.4% |
| 20 to 24 Minutes | 77 | 7.2% |
| 25 to 29 Minutes | 66 | 6.1% |
| 30 to 34 Minutes | 218 | 20.3% |
| 35 to 39 Minutes | 23 | 2.1% |
| 40 to 44 Minutes | 154 | 14.3% |
| 45 to 59 Minutes | 112 | 10.4% |
| 60 to 89 Minutes | 201 | 18.7% |
| 90 or more Minutes | 23 | 2.1% |
Commute Time by Sex in Colwyn borough
The most common commute times in Colwyn borough are 30 to 34 minutes (105 commuters, 22.0%) for males and 30 to 34 minutes (113 commuters, 19.0%) for females.
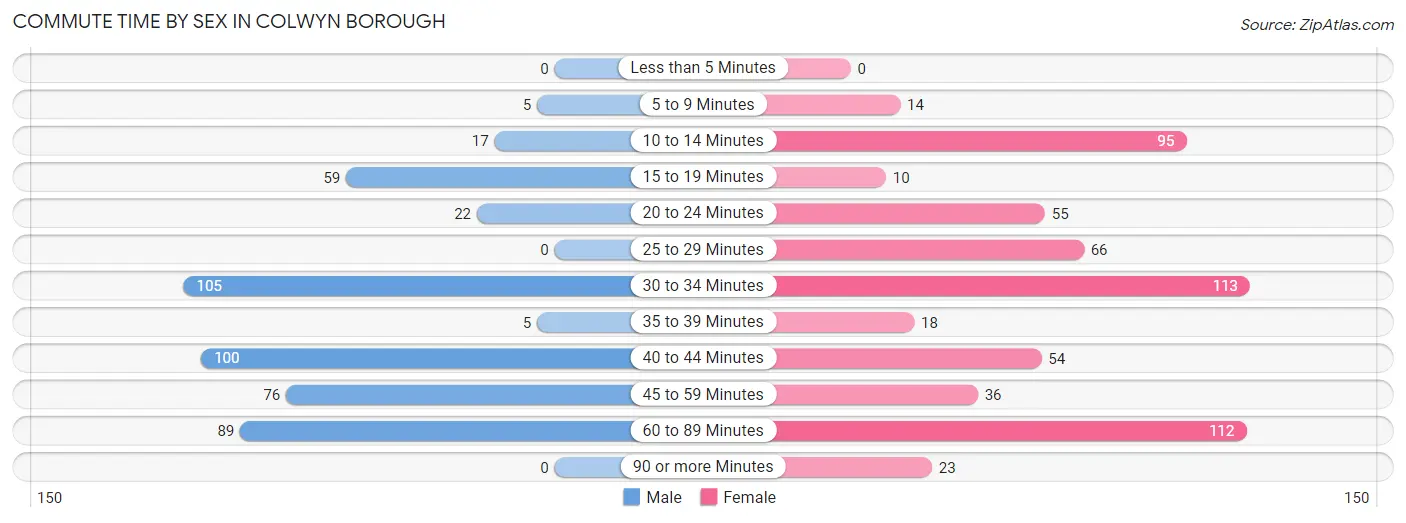
| Commute Time | Male | Female |
| Less than 5 Minutes | 0 (0.0%) | 0 (0.0%) |
| 5 to 9 Minutes | 5 (1.1%) | 14 (2.4%) |
| 10 to 14 Minutes | 17 (3.6%) | 95 (15.9%) |
| 15 to 19 Minutes | 59 (12.3%) | 10 (1.7%) |
| 20 to 24 Minutes | 22 (4.6%) | 55 (9.2%) |
| 25 to 29 Minutes | 0 (0.0%) | 66 (11.1%) |
| 30 to 34 Minutes | 105 (22.0%) | 113 (19.0%) |
| 35 to 39 Minutes | 5 (1.1%) | 18 (3.0%) |
| 40 to 44 Minutes | 100 (20.9%) | 54 (9.1%) |
| 45 to 59 Minutes | 76 (15.9%) | 36 (6.0%) |
| 60 to 89 Minutes | 89 (18.6%) | 112 (18.8%) |
| 90 or more Minutes | 0 (0.0%) | 23 (3.9%) |
Time of Departure to Work by Sex in Colwyn borough
The most frequent times of departure to work in Colwyn borough are 4:00 PM to 11:59 PM (110, 23.0%) for males and 12:00 PM to 3:59 PM (157, 26.3%) for females.
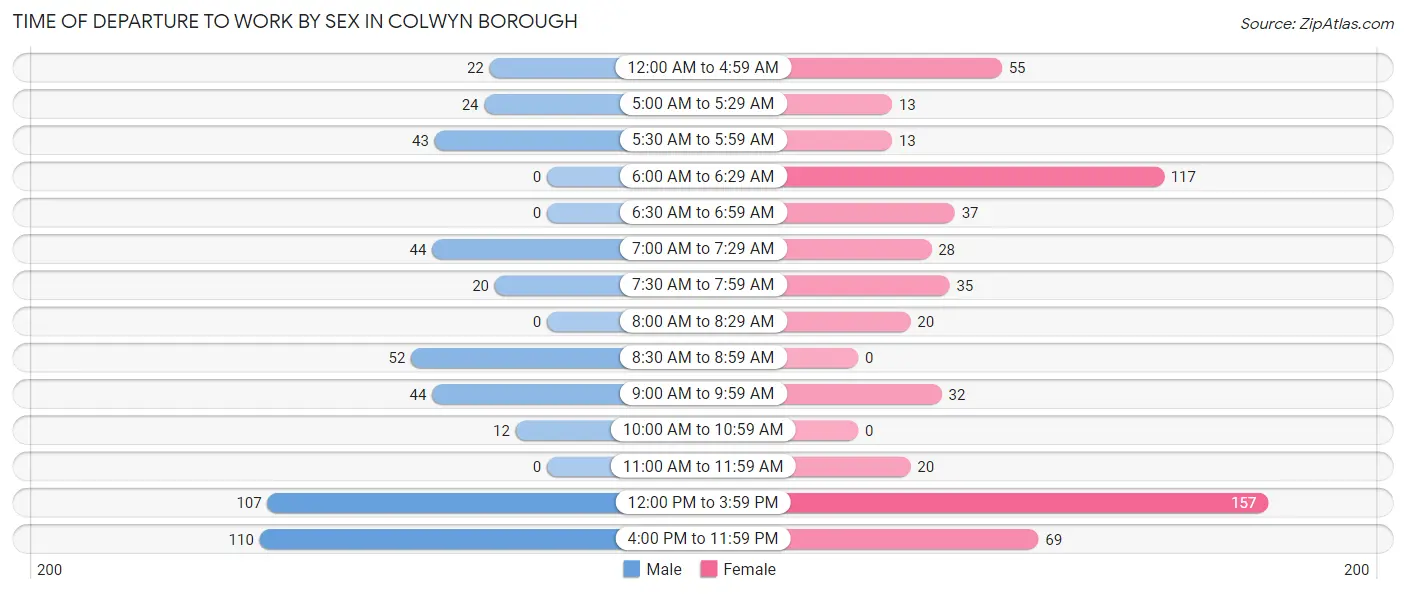
| Time of Departure | Male | Female |
| 12:00 AM to 4:59 AM | 22 (4.6%) | 55 (9.2%) |
| 5:00 AM to 5:29 AM | 24 (5.0%) | 13 (2.2%) |
| 5:30 AM to 5:59 AM | 43 (9.0%) | 13 (2.2%) |
| 6:00 AM to 6:29 AM | 0 (0.0%) | 117 (19.6%) |
| 6:30 AM to 6:59 AM | 0 (0.0%) | 37 (6.2%) |
| 7:00 AM to 7:29 AM | 44 (9.2%) | 28 (4.7%) |
| 7:30 AM to 7:59 AM | 20 (4.2%) | 35 (5.9%) |
| 8:00 AM to 8:29 AM | 0 (0.0%) | 20 (3.4%) |
| 8:30 AM to 8:59 AM | 52 (10.9%) | 0 (0.0%) |
| 9:00 AM to 9:59 AM | 44 (9.2%) | 32 (5.4%) |
| 10:00 AM to 10:59 AM | 12 (2.5%) | 0 (0.0%) |
| 11:00 AM to 11:59 AM | 0 (0.0%) | 20 (3.4%) |
| 12:00 PM to 3:59 PM | 107 (22.4%) | 157 (26.3%) |
| 4:00 PM to 11:59 PM | 110 (23.0%) | 69 (11.6%) |
| Total | 478 (100.0%) | 596 (100.0%) |
Housing Occupancy in Colwyn borough
Occupancy by Ownership in Colwyn borough
Of the total 837 dwellings in Colwyn borough, owner-occupied units account for 433 (51.7%), while renter-occupied units make up 404 (48.3%).
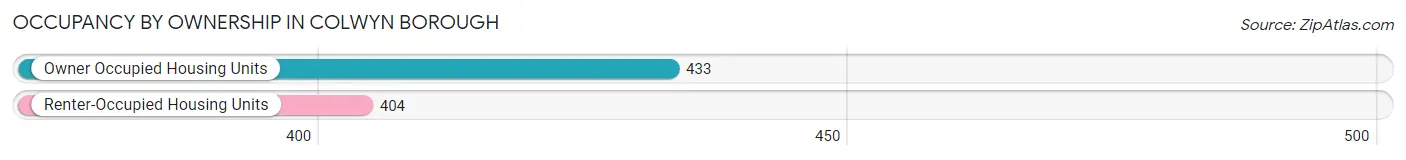
| Occupancy | # Housing Units | % Housing Units |
| Owner Occupied Housing Units | 433 | 51.7% |
| Renter-Occupied Housing Units | 404 | 48.3% |
| Total Occupied Housing Units | 837 | 100.0% |
Occupancy by Household Size in Colwyn borough
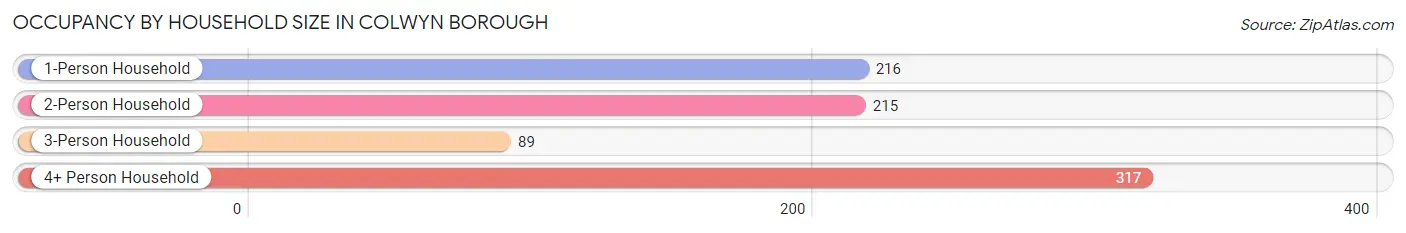
| Household Size | # Housing Units | % Housing Units |
| 1-Person Household | 216 | 25.8% |
| 2-Person Household | 215 | 25.7% |
| 3-Person Household | 89 | 10.6% |
| 4+ Person Household | 317 | 37.9% |
| Total Housing Units | 837 | 100.0% |
Occupancy by Ownership by Household Size in Colwyn borough
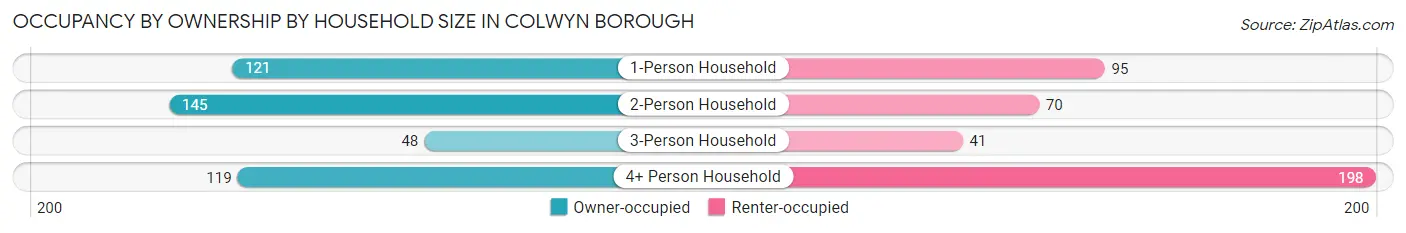
| Household Size | Owner-occupied | Renter-occupied |
| 1-Person Household | 121 (56.0%) | 95 (44.0%) |
| 2-Person Household | 145 (67.4%) | 70 (32.6%) |
| 3-Person Household | 48 (53.9%) | 41 (46.1%) |
| 4+ Person Household | 119 (37.5%) | 198 (62.5%) |
| Total Housing Units | 433 (51.7%) | 404 (48.3%) |
Occupancy by Educational Attainment in Colwyn borough
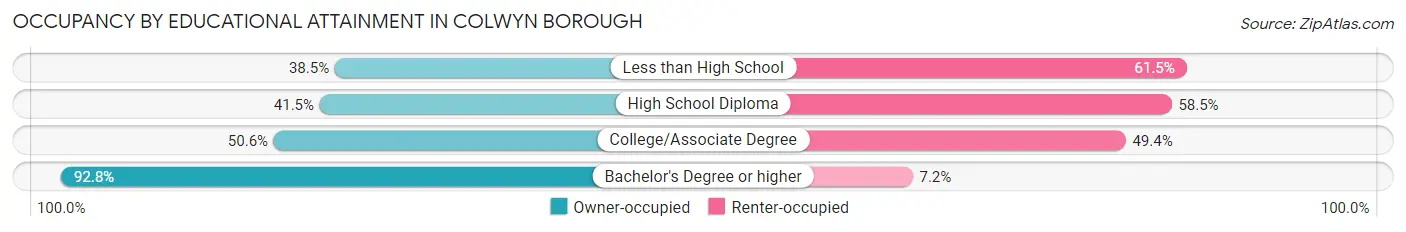
| Household Size | Owner-occupied | Renter-occupied |
| Less than High School | 35 (38.5%) | 56 (61.5%) |
| High School Diploma | 119 (41.5%) | 168 (58.5%) |
| College/Associate Degree | 176 (50.6%) | 172 (49.4%) |
| Bachelor's Degree or higher | 103 (92.8%) | 8 (7.2%) |
Occupancy by Age of Householder in Colwyn borough
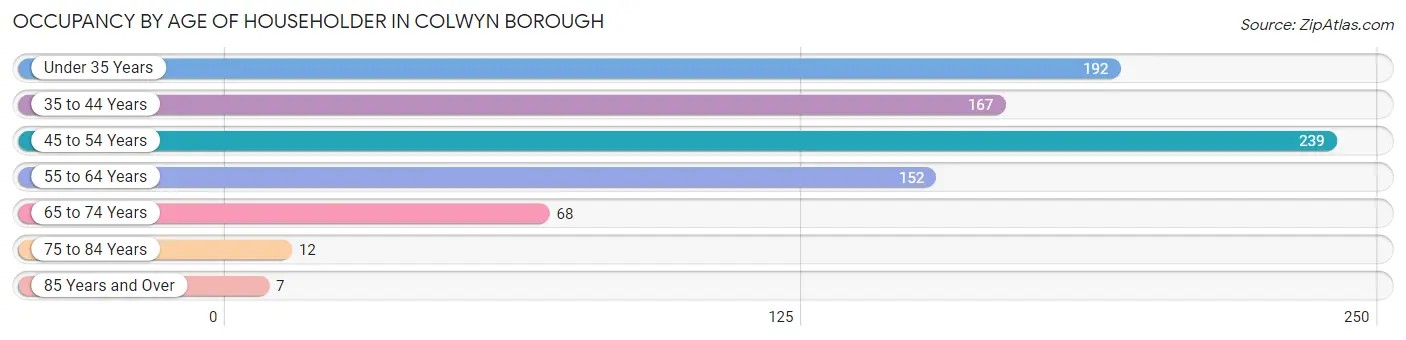
| Age Bracket | # Households | % Households |
| Under 35 Years | 192 | 22.9% |
| 35 to 44 Years | 167 | 20.0% |
| 45 to 54 Years | 239 | 28.5% |
| 55 to 64 Years | 152 | 18.2% |
| 65 to 74 Years | 68 | 8.1% |
| 75 to 84 Years | 12 | 1.4% |
| 85 Years and Over | 7 | 0.8% |
| Total | 837 | 100.0% |
Housing Finances in Colwyn borough
Median Income by Occupancy in Colwyn borough
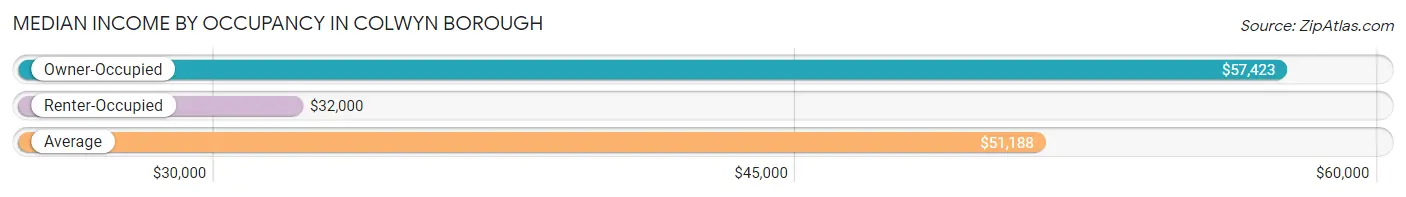
| Occupancy Type | # Households | Median Income |
| Owner-Occupied | 433 (51.7%) | $57,423 |
| Renter-Occupied | 404 (48.3%) | $32,000 |
| Average | 837 (100.0%) | $51,188 |
Occupancy by Householder Income Bracket in Colwyn borough
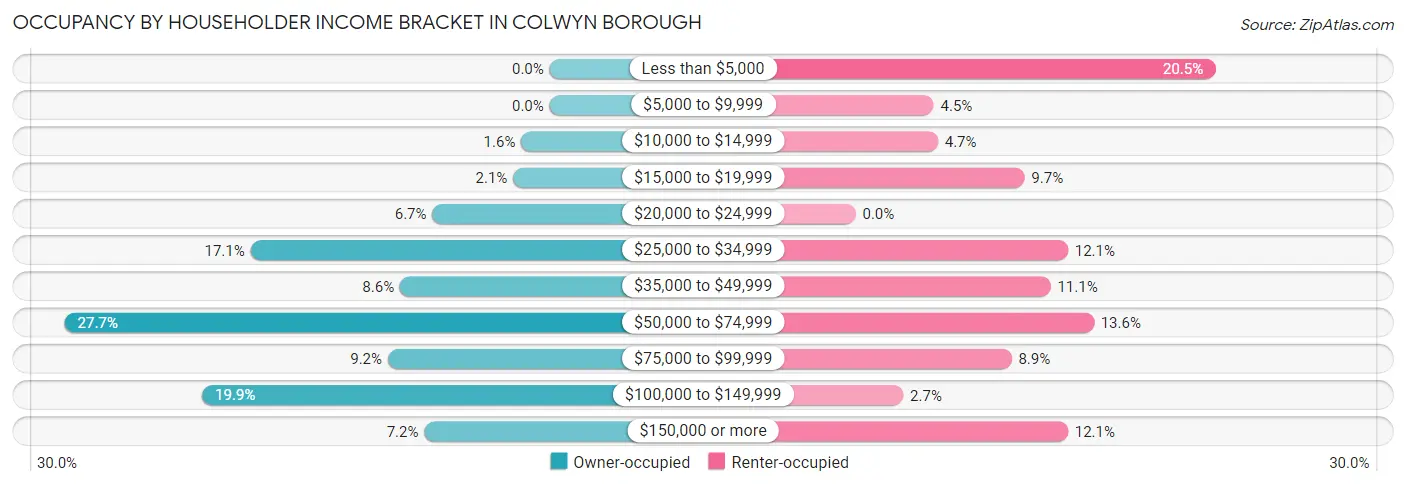
| Income Bracket | Owner-occupied | Renter-occupied |
| Less than $5,000 | 0 (0.0%) | 83 (20.5%) |
| $5,000 to $9,999 | 0 (0.0%) | 18 (4.5%) |
| $10,000 to $14,999 | 7 (1.6%) | 19 (4.7%) |
| $15,000 to $19,999 | 9 (2.1%) | 39 (9.7%) |
| $20,000 to $24,999 | 29 (6.7%) | 0 (0.0%) |
| $25,000 to $34,999 | 74 (17.1%) | 49 (12.1%) |
| $35,000 to $49,999 | 37 (8.6%) | 45 (11.1%) |
| $50,000 to $74,999 | 120 (27.7%) | 55 (13.6%) |
| $75,000 to $99,999 | 40 (9.2%) | 36 (8.9%) |
| $100,000 to $149,999 | 86 (19.9%) | 11 (2.7%) |
| $150,000 or more | 31 (7.2%) | 49 (12.1%) |
| Total | 433 (100.0%) | 404 (100.0%) |
Monthly Housing Cost Tiers in Colwyn borough
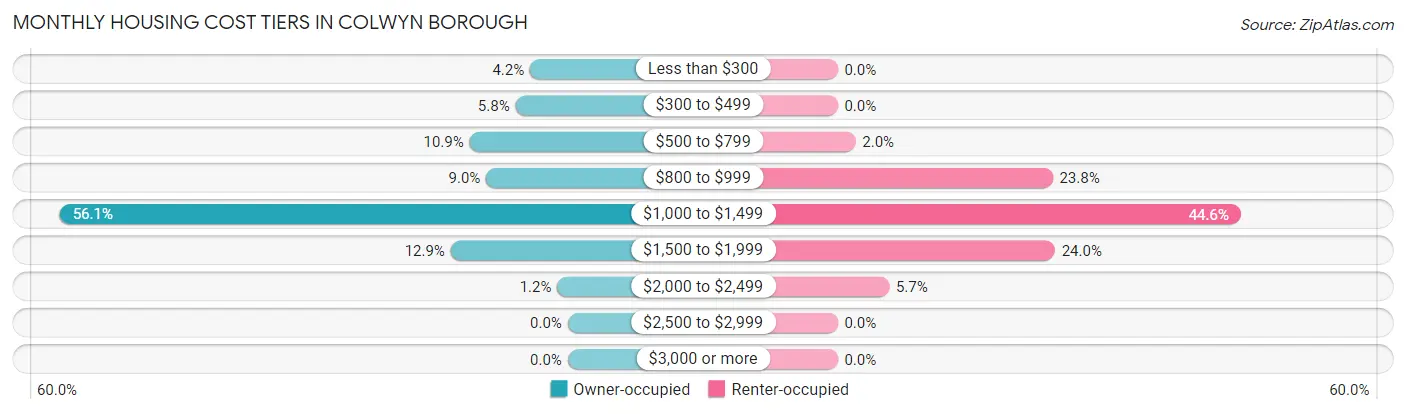
| Monthly Cost | Owner-occupied | Renter-occupied |
| Less than $300 | 18 (4.2%) | 0 (0.0%) |
| $300 to $499 | 25 (5.8%) | 0 (0.0%) |
| $500 to $799 | 47 (10.8%) | 8 (2.0%) |
| $800 to $999 | 39 (9.0%) | 96 (23.8%) |
| $1,000 to $1,499 | 243 (56.1%) | 180 (44.6%) |
| $1,500 to $1,999 | 56 (12.9%) | 97 (24.0%) |
| $2,000 to $2,499 | 5 (1.1%) | 23 (5.7%) |
| $2,500 to $2,999 | 0 (0.0%) | 0 (0.0%) |
| $3,000 or more | 0 (0.0%) | 0 (0.0%) |
| Total | 433 (100.0%) | 404 (100.0%) |
Physical Housing Characteristics in Colwyn borough
Housing Structures in Colwyn borough
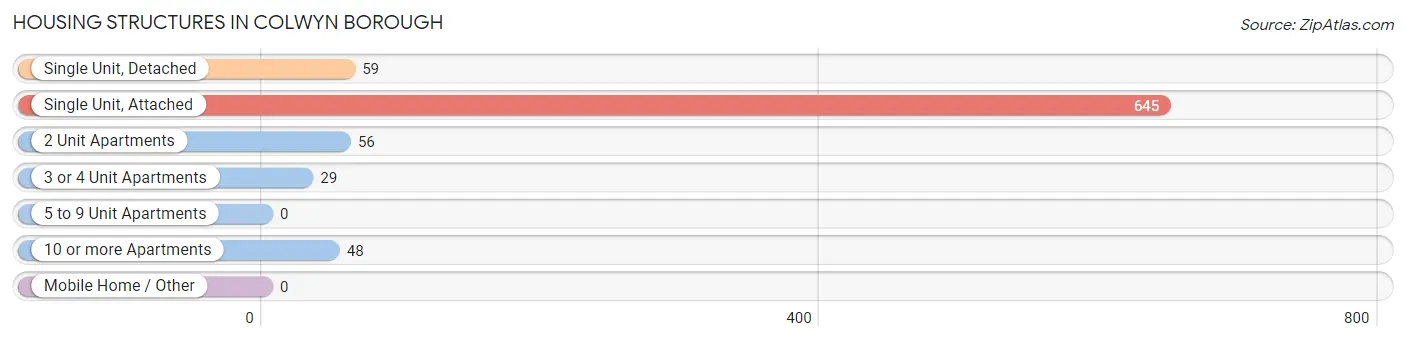
| Structure Type | # Housing Units | % Housing Units |
| Single Unit, Detached | 59 | 7.0% |
| Single Unit, Attached | 645 | 77.1% |
| 2 Unit Apartments | 56 | 6.7% |
| 3 or 4 Unit Apartments | 29 | 3.5% |
| 5 to 9 Unit Apartments | 0 | 0.0% |
| 10 or more Apartments | 48 | 5.7% |
| Mobile Home / Other | 0 | 0.0% |
| Total | 837 | 100.0% |
Housing Structures by Occupancy in Colwyn borough
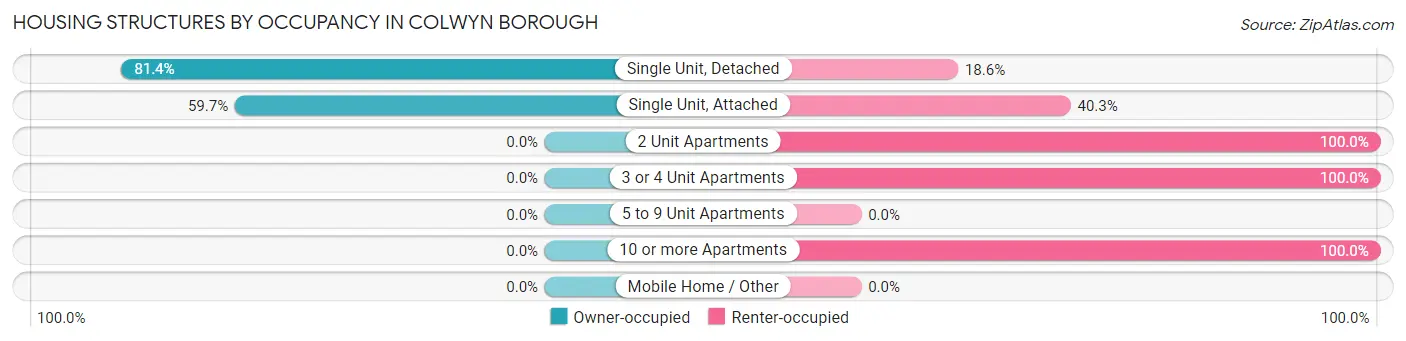
| Structure Type | Owner-occupied | Renter-occupied |
| Single Unit, Detached | 48 (81.4%) | 11 (18.6%) |
| Single Unit, Attached | 385 (59.7%) | 260 (40.3%) |
| 2 Unit Apartments | 0 (0.0%) | 56 (100.0%) |
| 3 or 4 Unit Apartments | 0 (0.0%) | 29 (100.0%) |
| 5 to 9 Unit Apartments | 0 (0.0%) | 0 (0.0%) |
| 10 or more Apartments | 0 (0.0%) | 48 (100.0%) |
| Mobile Home / Other | 0 (0.0%) | 0 (0.0%) |
| Total | 433 (51.7%) | 404 (48.3%) |
Housing Structures by Number of Rooms in Colwyn borough
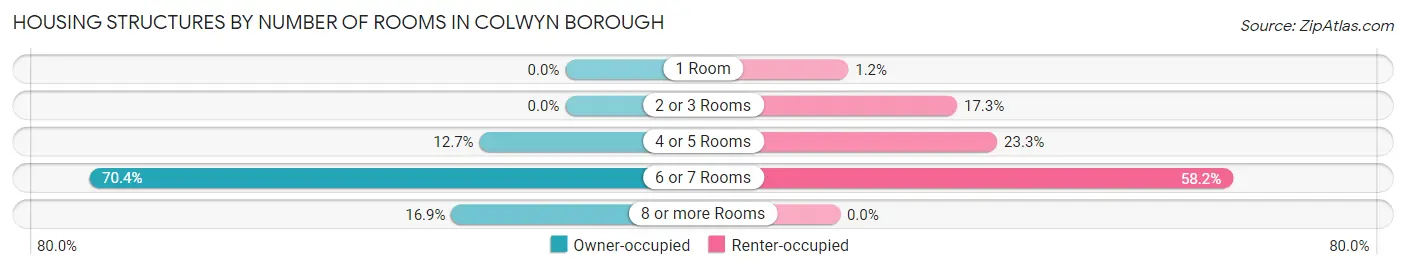
| Number of Rooms | Owner-occupied | Renter-occupied |
| 1 Room | 0 (0.0%) | 5 (1.2%) |
| 2 or 3 Rooms | 0 (0.0%) | 70 (17.3%) |
| 4 or 5 Rooms | 55 (12.7%) | 94 (23.3%) |
| 6 or 7 Rooms | 305 (70.4%) | 235 (58.2%) |
| 8 or more Rooms | 73 (16.9%) | 0 (0.0%) |
| Total | 433 (100.0%) | 404 (100.0%) |
Housing Structure by Heating Type in Colwyn borough
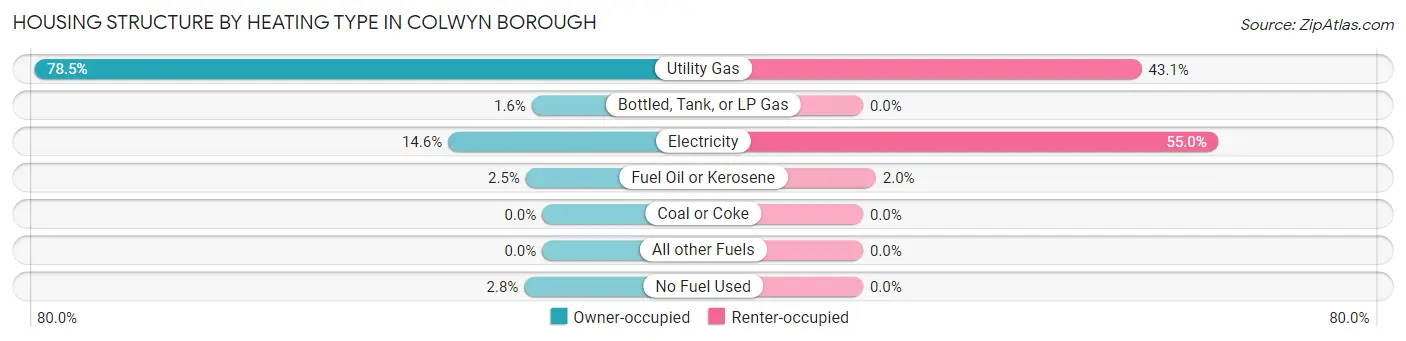
| Heating Type | Owner-occupied | Renter-occupied |
| Utility Gas | 340 (78.5%) | 174 (43.1%) |
| Bottled, Tank, or LP Gas | 7 (1.6%) | 0 (0.0%) |
| Electricity | 63 (14.5%) | 222 (54.9%) |
| Fuel Oil or Kerosene | 11 (2.5%) | 8 (2.0%) |
| Coal or Coke | 0 (0.0%) | 0 (0.0%) |
| All other Fuels | 0 (0.0%) | 0 (0.0%) |
| No Fuel Used | 12 (2.8%) | 0 (0.0%) |
| Total | 433 (100.0%) | 404 (100.0%) |
Household Vehicle Usage in Colwyn borough
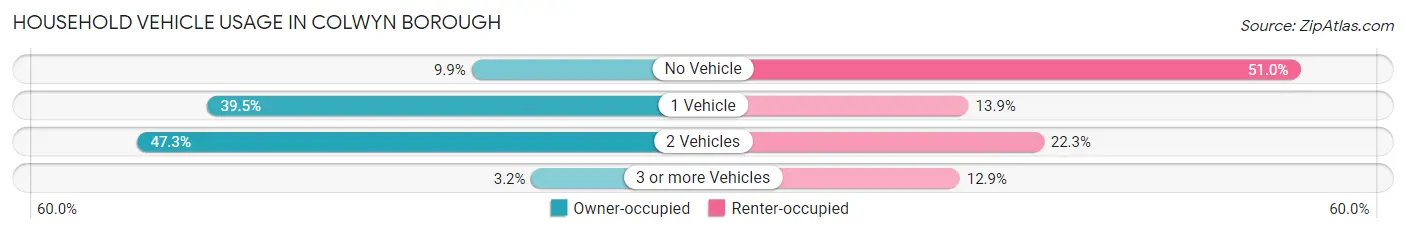
| Vehicles per Household | Owner-occupied | Renter-occupied |
| No Vehicle | 43 (9.9%) | 206 (51.0%) |
| 1 Vehicle | 171 (39.5%) | 56 (13.9%) |
| 2 Vehicles | 205 (47.3%) | 90 (22.3%) |
| 3 or more Vehicles | 14 (3.2%) | 52 (12.9%) |
| Total | 433 (100.0%) | 404 (100.0%) |
Real Estate & Mortgages in Colwyn borough
Real Estate and Mortgage Overview in Colwyn borough
| Characteristic | Without Mortgage | With Mortgage |
| Housing Units | 88 | 345 |
| Median Property Value | $67,300 | $93,400 |
| Median Household Income | - | - |
| Monthly Housing Costs | $533 | $0 |
| Real Estate Taxes | $1,431 | $31 |
Property Value by Mortgage Status in Colwyn borough
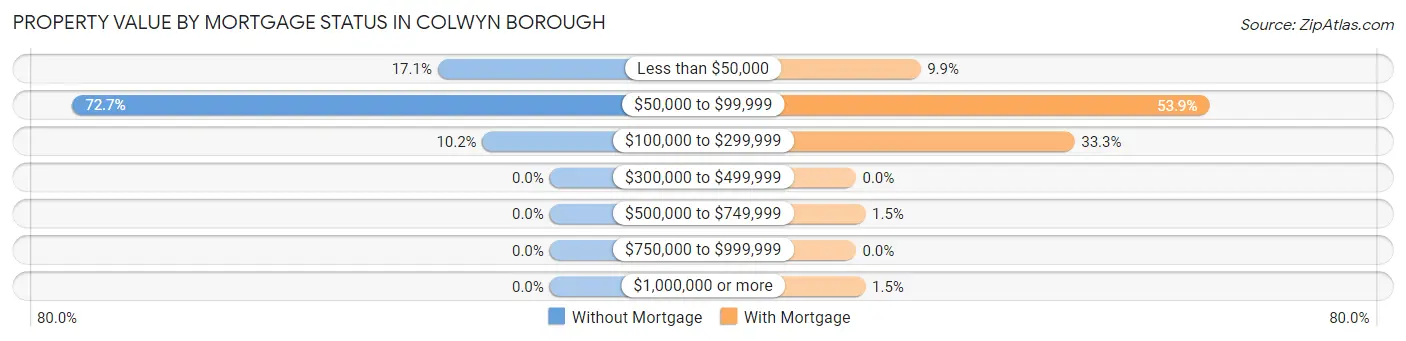
| Property Value | Without Mortgage | With Mortgage |
| Less than $50,000 | 15 (17.1%) | 34 (9.9%) |
| $50,000 to $99,999 | 64 (72.7%) | 186 (53.9%) |
| $100,000 to $299,999 | 9 (10.2%) | 115 (33.3%) |
| $300,000 to $499,999 | 0 (0.0%) | 0 (0.0%) |
| $500,000 to $749,999 | 0 (0.0%) | 5 (1.5%) |
| $750,000 to $999,999 | 0 (0.0%) | 0 (0.0%) |
| $1,000,000 or more | 0 (0.0%) | 5 (1.5%) |
| Total | 88 (100.0%) | 345 (100.0%) |
Household Income by Mortgage Status in Colwyn borough
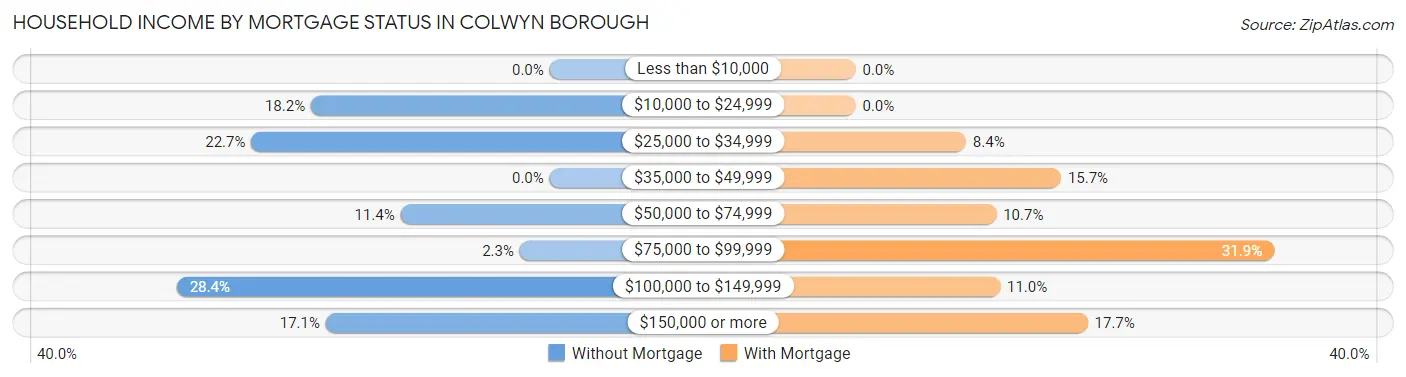
| Household Income | Without Mortgage | With Mortgage |
| Less than $10,000 | 0 (0.0%) | 0 (0.0%) |
| $10,000 to $24,999 | 16 (18.2%) | 0 (0.0%) |
| $25,000 to $34,999 | 20 (22.7%) | 29 (8.4%) |
| $35,000 to $49,999 | 0 (0.0%) | 54 (15.7%) |
| $50,000 to $74,999 | 10 (11.4%) | 37 (10.7%) |
| $75,000 to $99,999 | 2 (2.3%) | 110 (31.9%) |
| $100,000 to $149,999 | 25 (28.4%) | 38 (11.0%) |
| $150,000 or more | 15 (17.1%) | 61 (17.7%) |
| Total | 88 (100.0%) | 345 (100.0%) |
Property Value to Household Income Ratio in Colwyn borough
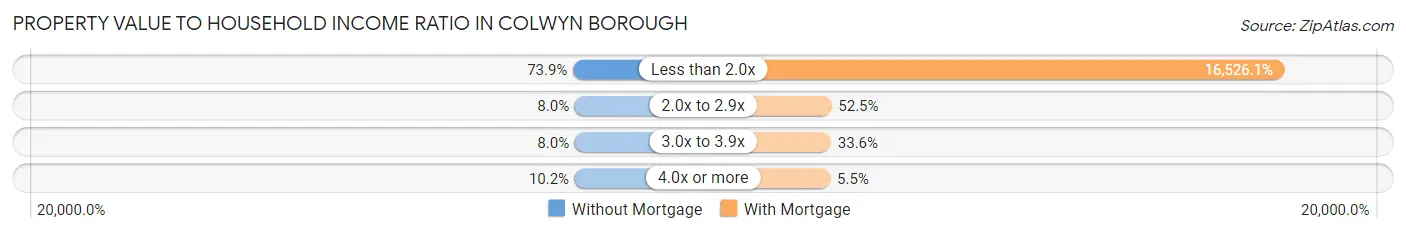
| Value-to-Income Ratio | Without Mortgage | With Mortgage |
| Less than 2.0x | 65 (73.9%) | 57,015 (16,526.1%) |
| 2.0x to 2.9x | 7 (8.0%) | 181 (52.5%) |
| 3.0x to 3.9x | 7 (8.0%) | 116 (33.6%) |
| 4.0x or more | 9 (10.2%) | 19 (5.5%) |
| Total | 88 (100.0%) | 345 (100.0%) |
Real Estate Taxes by Mortgage Status in Colwyn borough
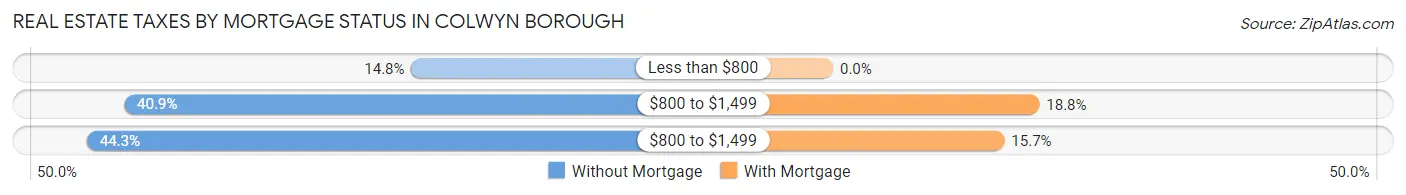
| Property Taxes | Without Mortgage | With Mortgage |
| Less than $800 | 13 (14.8%) | 0 (0.0%) |
| $800 to $1,499 | 36 (40.9%) | 65 (18.8%) |
| $800 to $1,499 | 39 (44.3%) | 54 (15.7%) |
| Total | 88 (100.0%) | 345 (100.0%) |
Health & Disability in Colwyn borough
Health Insurance Coverage by Age in Colwyn borough
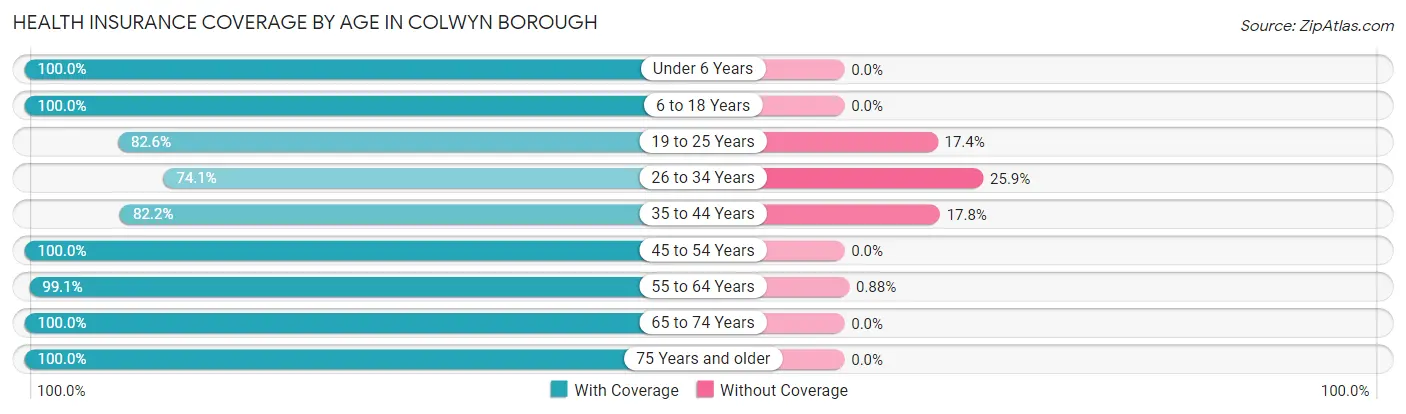
| Age Bracket | With Coverage | Without Coverage |
| Under 6 Years | 225 (100.0%) | 0 (0.0%) |
| 6 to 18 Years | 721 (100.0%) | 0 (0.0%) |
| 19 to 25 Years | 456 (82.6%) | 96 (17.4%) |
| 26 to 34 Years | 249 (74.1%) | 87 (25.9%) |
| 35 to 44 Years | 245 (82.2%) | 53 (17.8%) |
| 45 to 54 Years | 343 (100.0%) | 0 (0.0%) |
| 55 to 64 Years | 225 (99.1%) | 2 (0.9%) |
| 65 to 74 Years | 122 (100.0%) | 0 (0.0%) |
| 75 Years and older | 25 (100.0%) | 0 (0.0%) |
| Total | 2,611 (91.6%) | 238 (8.4%) |
Health Insurance Coverage by Citizenship Status in Colwyn borough
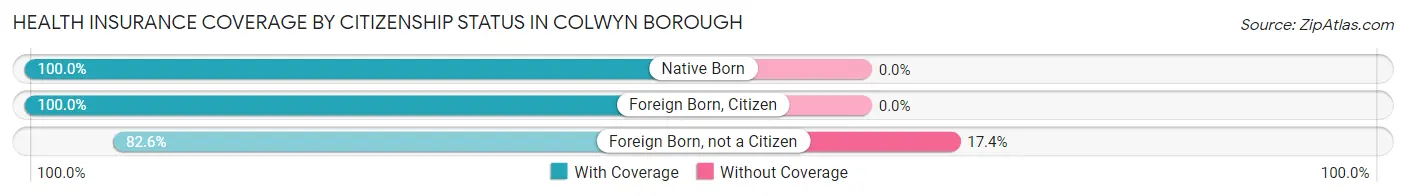
| Citizenship Status | With Coverage | Without Coverage |
| Native Born | 225 (100.0%) | 0 (0.0%) |
| Foreign Born, Citizen | 721 (100.0%) | 0 (0.0%) |
| Foreign Born, not a Citizen | 456 (82.6%) | 96 (17.4%) |
Health Insurance Coverage by Household Income in Colwyn borough
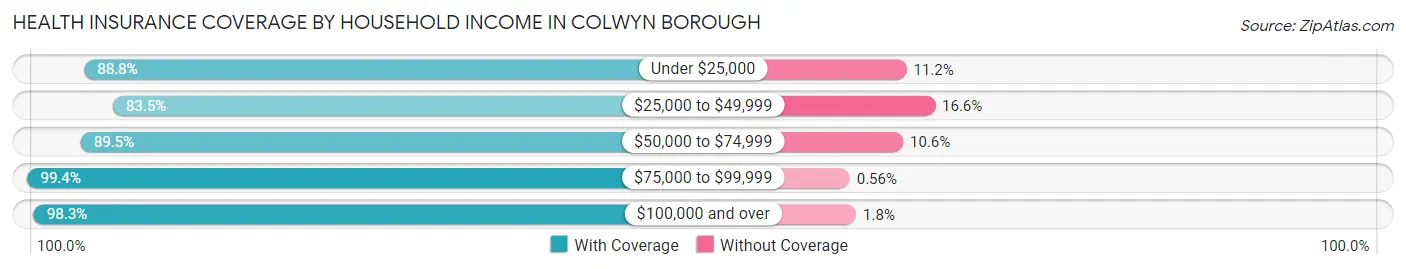
| Household Income | With Coverage | Without Coverage |
| Under $25,000 | 579 (88.8%) | 73 (11.2%) |
| $25,000 to $49,999 | 474 (83.5%) | 94 (16.6%) |
| $50,000 to $74,999 | 475 (89.4%) | 56 (10.5%) |
| $75,000 to $99,999 | 355 (99.4%) | 2 (0.6%) |
| $100,000 and over | 728 (98.3%) | 13 (1.8%) |
Public vs Private Health Insurance Coverage by Age in Colwyn borough
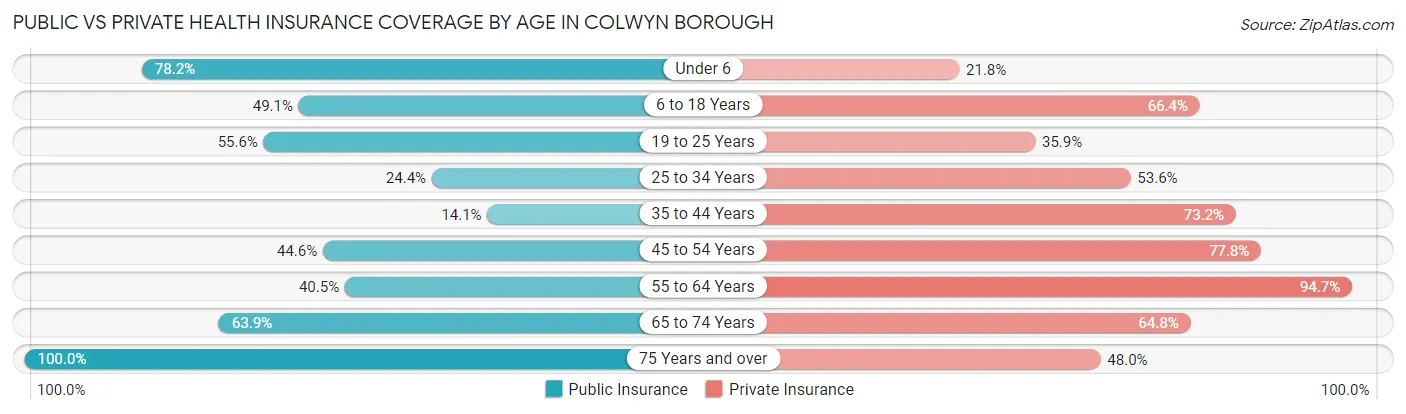
| Age Bracket | Public Insurance | Private Insurance |
| Under 6 | 176 (78.2%) | 49 (21.8%) |
| 6 to 18 Years | 354 (49.1%) | 479 (66.4%) |
| 19 to 25 Years | 307 (55.6%) | 198 (35.9%) |
| 25 to 34 Years | 82 (24.4%) | 180 (53.6%) |
| 35 to 44 Years | 42 (14.1%) | 218 (73.2%) |
| 45 to 54 Years | 153 (44.6%) | 267 (77.8%) |
| 55 to 64 Years | 92 (40.5%) | 215 (94.7%) |
| 65 to 74 Years | 78 (63.9%) | 79 (64.7%) |
| 75 Years and over | 25 (100.0%) | 12 (48.0%) |
| Total | 1,309 (46.0%) | 1,697 (59.6%) |
Disability Status by Sex by Age in Colwyn borough
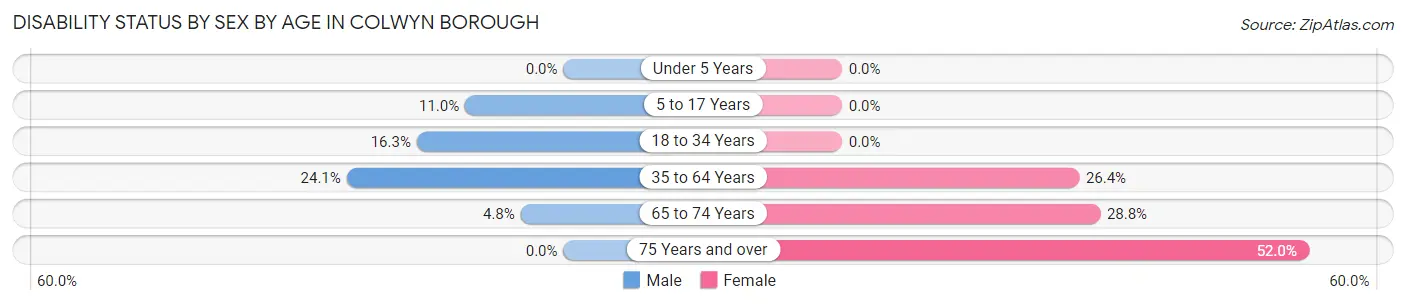
| Age Bracket | Male | Female |
| Under 5 Years | 0 (0.0%) | 0 (0.0%) |
| 5 to 17 Years | 38 (11.0%) | 0 (0.0%) |
| 18 to 34 Years | 72 (16.3%) | 0 (0.0%) |
| 35 to 64 Years | 77 (24.1%) | 145 (26.4%) |
| 65 to 74 Years | 2 (4.8%) | 23 (28.7%) |
| 75 Years and over | 0 (0.0%) | 13 (52.0%) |
Disability Class by Sex by Age in Colwyn borough
Disability Class: Hearing Difficulty
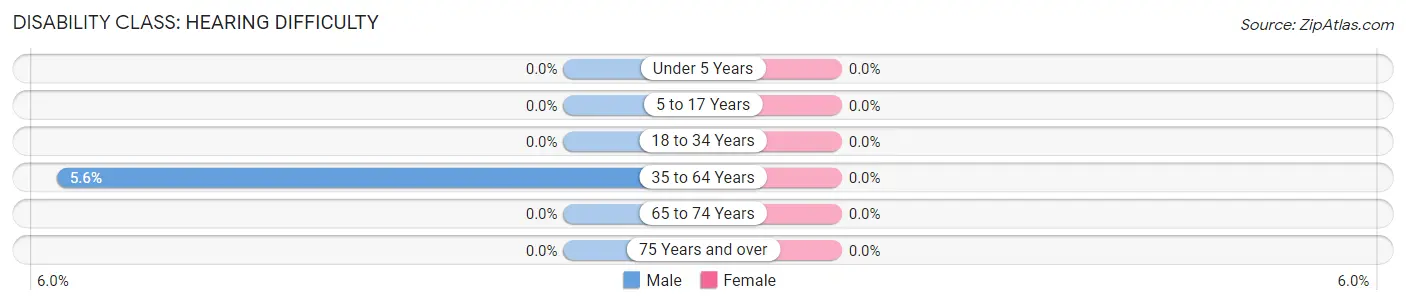
| Age Bracket | Male | Female |
| Under 5 Years | 0 (0.0%) | 0 (0.0%) |
| 5 to 17 Years | 0 (0.0%) | 0 (0.0%) |
| 18 to 34 Years | 0 (0.0%) | 0 (0.0%) |
| 35 to 64 Years | 18 (5.6%) | 0 (0.0%) |
| 65 to 74 Years | 0 (0.0%) | 0 (0.0%) |
| 75 Years and over | 0 (0.0%) | 0 (0.0%) |
Disability Class: Vision Difficulty
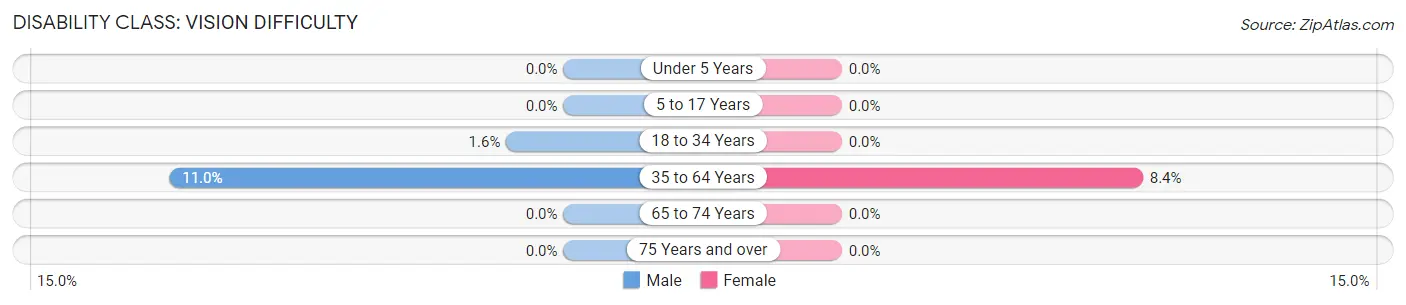
| Age Bracket | Male | Female |
| Under 5 Years | 0 (0.0%) | 0 (0.0%) |
| 5 to 17 Years | 0 (0.0%) | 0 (0.0%) |
| 18 to 34 Years | 7 (1.6%) | 0 (0.0%) |
| 35 to 64 Years | 35 (11.0%) | 46 (8.4%) |
| 65 to 74 Years | 0 (0.0%) | 0 (0.0%) |
| 75 Years and over | 0 (0.0%) | 0 (0.0%) |
Disability Class: Cognitive Difficulty
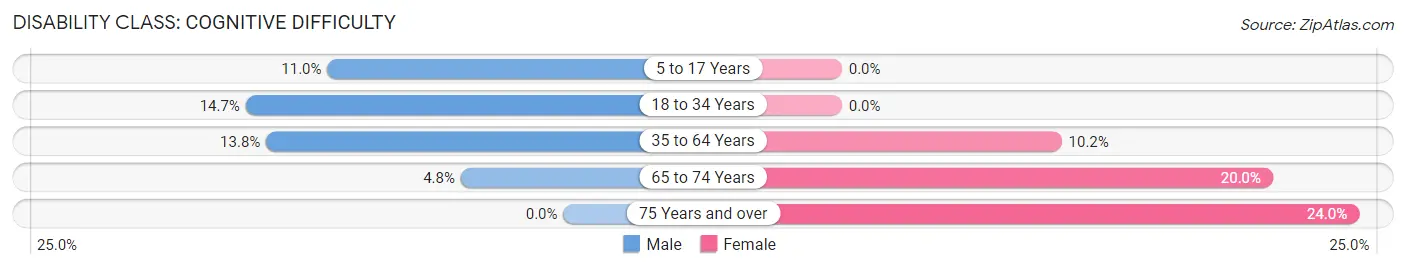
| Age Bracket | Male | Female |
| 5 to 17 Years | 38 (11.0%) | 0 (0.0%) |
| 18 to 34 Years | 65 (14.7%) | 0 (0.0%) |
| 35 to 64 Years | 44 (13.8%) | 56 (10.2%) |
| 65 to 74 Years | 2 (4.8%) | 16 (20.0%) |
| 75 Years and over | 0 (0.0%) | 6 (24.0%) |
Disability Class: Ambulatory Difficulty
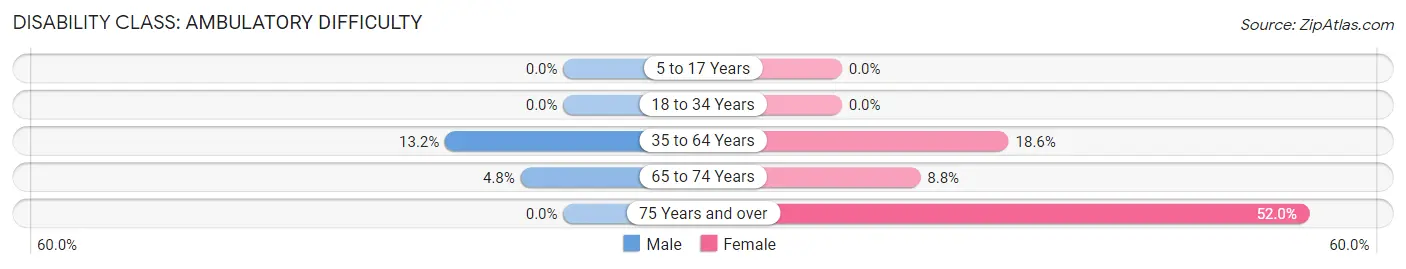
| Age Bracket | Male | Female |
| 5 to 17 Years | 0 (0.0%) | 0 (0.0%) |
| 18 to 34 Years | 0 (0.0%) | 0 (0.0%) |
| 35 to 64 Years | 42 (13.2%) | 102 (18.6%) |
| 65 to 74 Years | 2 (4.8%) | 7 (8.7%) |
| 75 Years and over | 0 (0.0%) | 13 (52.0%) |
Disability Class: Self-Care Difficulty
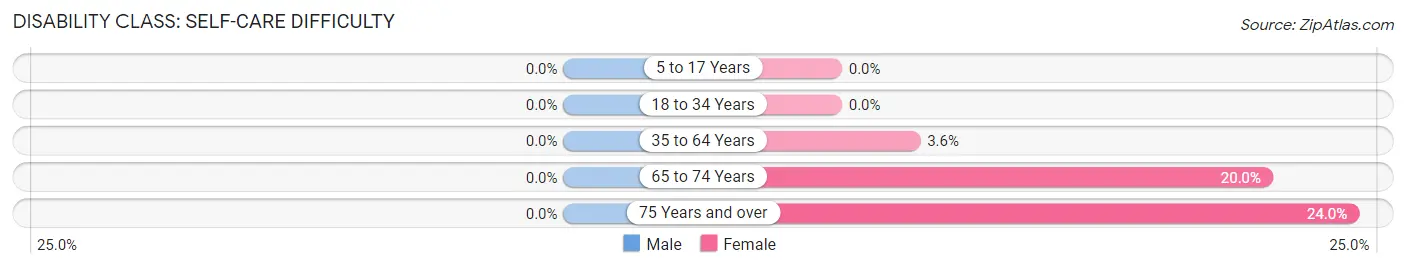
| Age Bracket | Male | Female |
| 5 to 17 Years | 0 (0.0%) | 0 (0.0%) |
| 18 to 34 Years | 0 (0.0%) | 0 (0.0%) |
| 35 to 64 Years | 0 (0.0%) | 20 (3.6%) |
| 65 to 74 Years | 0 (0.0%) | 16 (20.0%) |
| 75 Years and over | 0 (0.0%) | 6 (24.0%) |
Technology Access in Colwyn borough
Computing Device Access in Colwyn borough
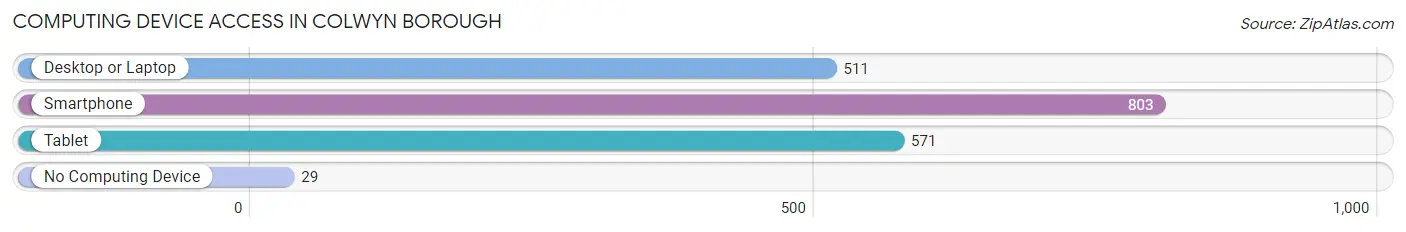
| Device Type | # Households | % Households |
| Desktop or Laptop | 511 | 61.1% |
| Smartphone | 803 | 95.9% |
| Tablet | 571 | 68.2% |
| No Computing Device | 29 | 3.5% |
| Total | 837 | 100.0% |
Internet Access in Colwyn borough
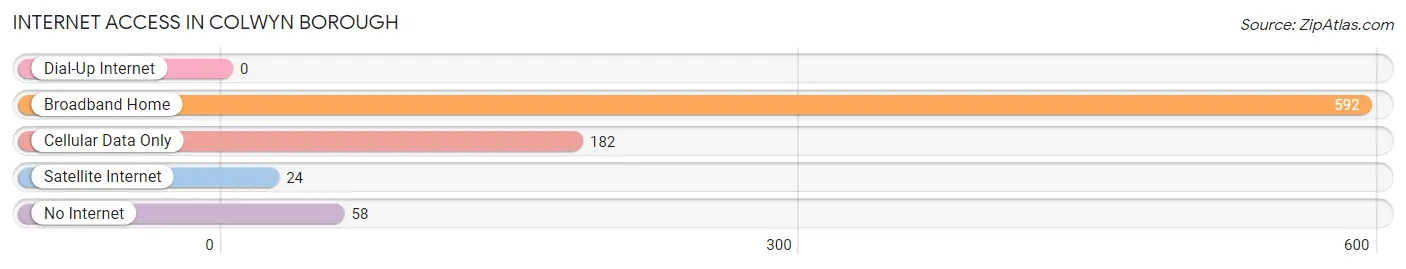
| Internet Type | # Households | % Households |
| Dial-Up Internet | 0 | 0.0% |
| Broadband Home | 592 | 70.7% |
| Cellular Data Only | 182 | 21.7% |
| Satellite Internet | 24 | 2.9% |
| No Internet | 58 | 6.9% |
| Total | 837 | 100.0% |
Colwyn borough Summary
Colwyn Borough is a small borough located in Delaware County, Pennsylvania. It is situated on the western bank of the Delaware River, just north of Philadelphia. The borough is home to a population of approximately 4,000 people, and is part of the larger Philadelphia metropolitan area.
History
Colwyn Borough was first settled in the late 1700s by Welsh immigrants. The borough was originally known as “Colwyn”, after the Welsh town of the same name. The borough was officially incorporated in 1867, and was named after the Welsh town of Colwyn.
The borough was originally a farming community, and the main industry was agriculture. In the late 1800s, the borough began to experience a period of industrialization, as factories and mills began to open in the area. This period of industrialization continued into the early 1900s, and the borough experienced a period of growth and prosperity.
In the mid-1900s, the borough began to experience a period of decline, as the factories and mills began to close. This period of decline continued into the late 1900s, and the borough experienced a period of economic stagnation.
Geography
Colwyn Borough is located in Delaware County, Pennsylvania. It is situated on the western bank of the Delaware River, just north of Philadelphia. The borough is bordered by the boroughs of Darby, Sharon Hill, and Folcroft.
The borough has a total area of 0.7 square miles, all of which is land. The borough is located in a humid subtropical climate zone, and experiences hot, humid summers and cold, wet winters.
Economy
The economy of Colwyn Borough is largely based on service industries. The borough is home to a variety of small businesses, including restaurants, retail stores, and professional services. The borough also has a number of manufacturing and industrial businesses, including a paper mill and a printing company.
The borough is also home to a number of educational institutions, including a community college and a vocational school. The borough is also home to a number of healthcare facilities, including a hospital and a number of medical offices.
Demographics
As of the 2010 census, the population of Colwyn Borough was 4,039. The racial makeup of the borough was 79.3% White, 15.2% African American, 0.4% Native American, 0.7% Asian, 0.1% Pacific Islander, and 4.3% from other races. Hispanic or Latino of any race were 2.7% of the population.
The median household income in the borough was $37,917, and the median family income was $45,938. The per capita income in the borough was $19,945. About 15.2% of the population was below the poverty line.
Conclusion
Colwyn Borough is a small borough located in Delaware County, Pennsylvania. It is situated on the western bank of the Delaware River, just north of Philadelphia. The borough is home to a population of approximately 4,000 people, and is part of the larger Philadelphia metropolitan area. The economy of Colwyn Borough is largely based on service industries, and the borough is home to a variety of small businesses, manufacturing and industrial businesses, educational institutions, and healthcare facilities. The racial makeup of the borough is 79.3% White, 15.2% African American, 0.4% Native American, 0.7% Asian, 0.1% Pacific Islander, and 4.3% from other races. The median household income in the borough was $37,917, and the median family income was $45,938. About 15.2% of the population was below the poverty line.
Common Questions
What is Per Capita Income in Colwyn borough?
Per Capita income in Colwyn borough is $19,181.
What is the Median Family Income in Colwyn borough?
Median Family Income in Colwyn borough is $70,795.
What is the Median Household income in Colwyn borough?
Median Household Income in Colwyn borough is $51,188.
What is Income or Wage Gap in Colwyn borough?
Income or Wage Gap in Colwyn borough is 21.0%.
Women in Colwyn borough earn 79.0 cents for every dollar earned by a man.
What is Family Income Deficit in Colwyn borough?
Family Income Deficit in Colwyn borough is $14,433.
Families that are below poverty line in Colwyn borough earn $14,433 less on average than the poverty threshold level.
What is Inequality or Gini Index in Colwyn borough?
Inequality or Gini Index in Colwyn borough is 0.44.
What is the Total Population of Colwyn borough?
Total Population of Colwyn borough is 2,849.
What is the Total Male Population of Colwyn borough?
Total Male Population of Colwyn borough is 1,216.
What is the Total Female Population of Colwyn borough?
Total Female Population of Colwyn borough is 1,633.
What is the Ratio of Males per 100 Females in Colwyn borough?
There are 74.46 Males per 100 Females in Colwyn borough.
What is the Ratio of Females per 100 Males in Colwyn borough?
There are 134.29 Females per 100 Males in Colwyn borough.
What is the Median Population Age in Colwyn borough?
Median Population Age in Colwyn borough is 25.4 Years.
What is the Average Family Size in Colwyn borough
Average Family Size in Colwyn borough is 4.4 People.
What is the Average Household Size in Colwyn borough
Average Household Size in Colwyn borough is 3.4 People.
How Large is the Labor Force in Colwyn borough?
There are 1,532 People in the Labor Forcein in Colwyn borough.
What is the Percentage of People in the Labor Force in Colwyn borough?
74.9% of People are in the Labor Force in Colwyn borough.
What is the Unemployment Rate in Colwyn borough?
Unemployment Rate in Colwyn borough is 23.1%.