Blue Ball, PA Map & Demographics
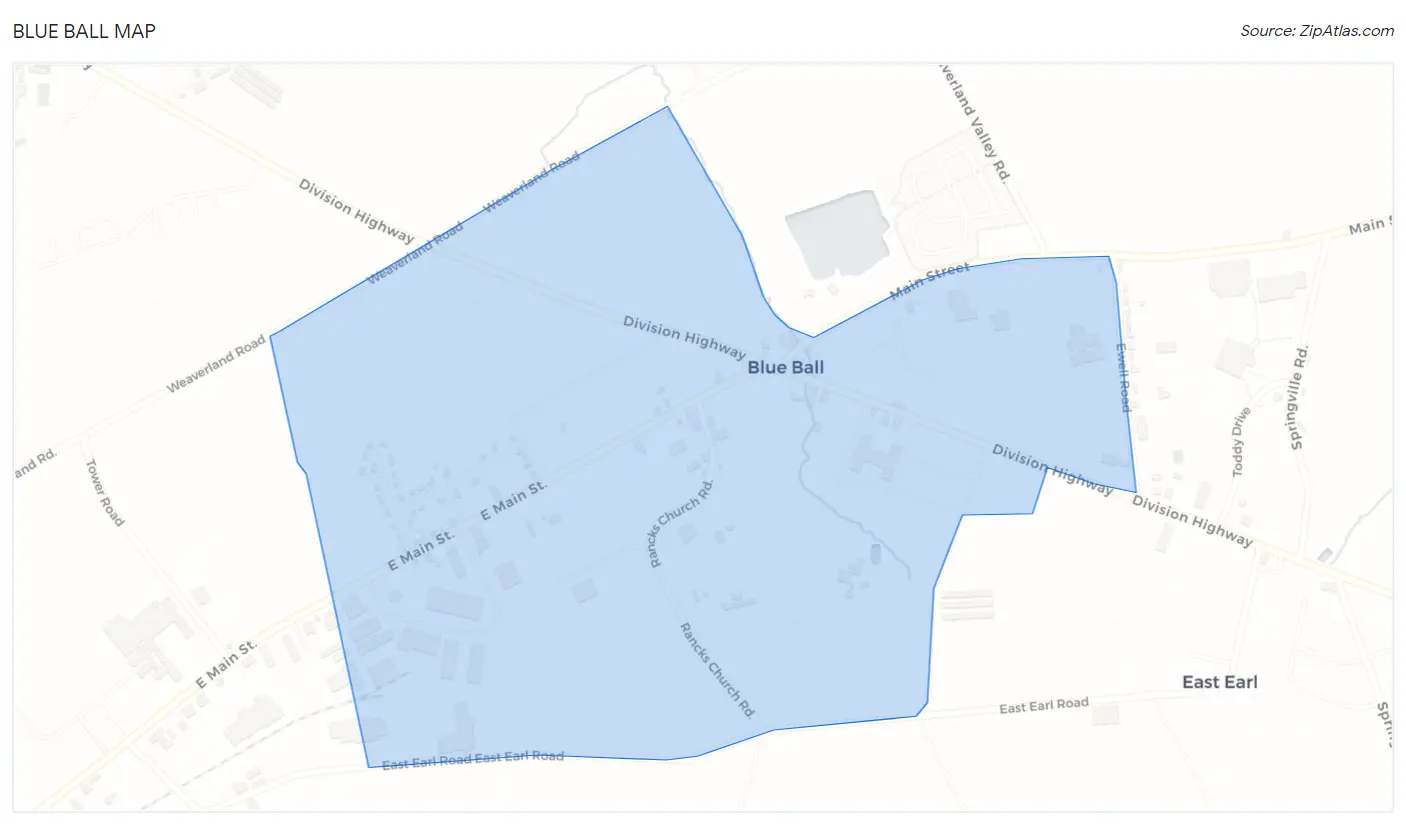
Blue Ball Map
Blue Ball Overview
$53,838
PER CAPITA INCOME
$128,350
AVG FAMILY INCOME
$102,656
AVG HOUSEHOLD INCOME
53.8%
WAGE / INCOME GAP [ % ]
46.2¢/ $1
WAGE / INCOME GAP [ $ ]
0.40
INEQUALITY / GINI INDEX
952
TOTAL POPULATION
441
MALE POPULATION
511
FEMALE POPULATION
86.30
MALES / 100 FEMALES
115.87
FEMALES / 100 MALES
30.9
MEDIAN AGE
3.2
AVG FAMILY SIZE
2.5
AVG HOUSEHOLD SIZE
625
LABOR FORCE [ PEOPLE ]
79.6%
PERCENT IN LABOR FORCE
Blue Ball Zip Codes
Blue Ball Area Codes
Income in Blue Ball
Income Overview in Blue Ball
Per Capita Income in Blue Ball is $53,838, while median incomes of families and households are $128,350 and $102,656 respectively.
| Characteristic | Number | Measure |
| Per Capita Income | 952 | $53,838 |
| Median Family Income | 245 | $128,350 |
| Mean Family Income | 245 | $154,979 |
| Median Household Income | 377 | $102,656 |
| Mean Household Income | 377 | $133,001 |
| Income Deficit | 245 | $0 |
| Wage / Income Gap (%) | 952 | 53.81% |
| Wage / Income Gap ($) | 952 | 46.19¢ per $1 |
| Gini / Inequality Index | 952 | 0.40 |
Earnings by Sex in Blue Ball
Average Earnings in Blue Ball are $50,300, $87,553 for men and $40,441 for women, a difference of 53.8%.
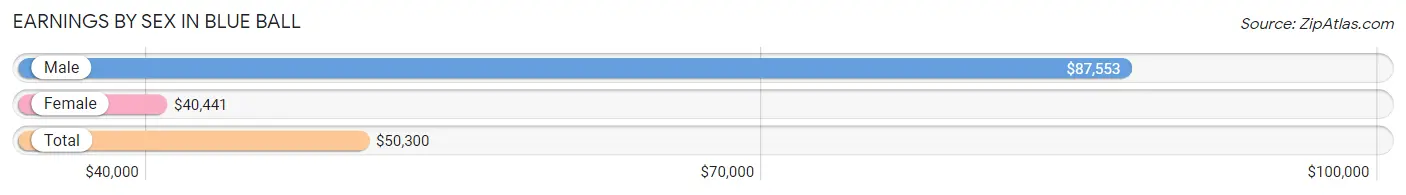
| Sex | Number | Average Earnings |
| Male | 306 (46.0%) | $87,553 |
| Female | 360 (54.0%) | $40,441 |
| Total | 666 (100.0%) | $50,300 |
Earnings by Sex by Income Bracket in Blue Ball
The most common earnings brackets in Blue Ball are $100,000+ for men (107 | 35.0%) and $50,000 to $54,999 for women (70 | 19.4%).
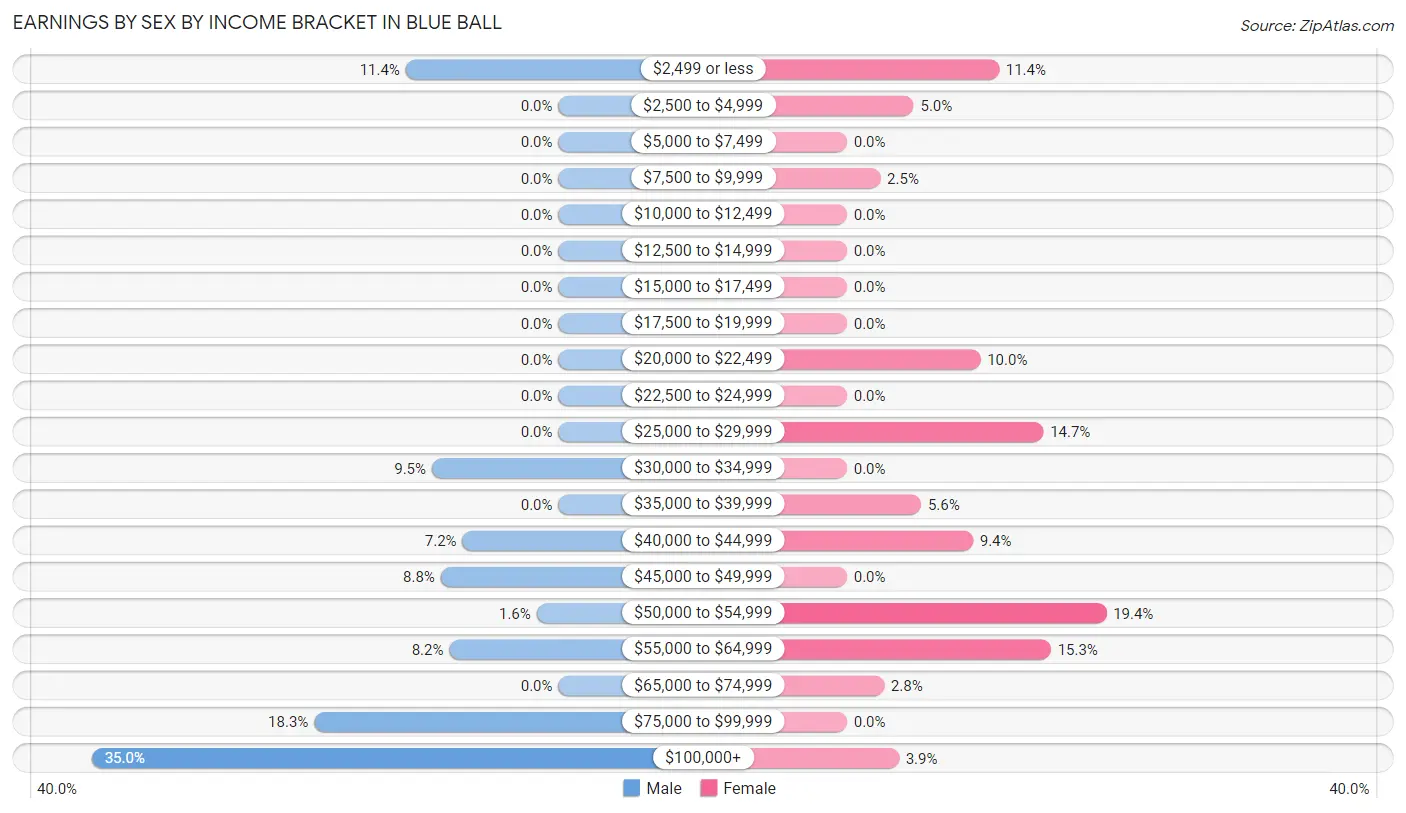
| Income | Male | Female |
| $2,499 or less | 35 (11.4%) | 41 (11.4%) |
| $2,500 to $4,999 | 0 (0.0%) | 18 (5.0%) |
| $5,000 to $7,499 | 0 (0.0%) | 0 (0.0%) |
| $7,500 to $9,999 | 0 (0.0%) | 9 (2.5%) |
| $10,000 to $12,499 | 0 (0.0%) | 0 (0.0%) |
| $12,500 to $14,999 | 0 (0.0%) | 0 (0.0%) |
| $15,000 to $17,499 | 0 (0.0%) | 0 (0.0%) |
| $17,500 to $19,999 | 0 (0.0%) | 0 (0.0%) |
| $20,000 to $22,499 | 0 (0.0%) | 36 (10.0%) |
| $22,500 to $24,999 | 0 (0.0%) | 0 (0.0%) |
| $25,000 to $29,999 | 0 (0.0%) | 53 (14.7%) |
| $30,000 to $34,999 | 29 (9.5%) | 0 (0.0%) |
| $35,000 to $39,999 | 0 (0.0%) | 20 (5.6%) |
| $40,000 to $44,999 | 22 (7.2%) | 34 (9.4%) |
| $45,000 to $49,999 | 27 (8.8%) | 0 (0.0%) |
| $50,000 to $54,999 | 5 (1.6%) | 70 (19.4%) |
| $55,000 to $64,999 | 25 (8.2%) | 55 (15.3%) |
| $65,000 to $74,999 | 0 (0.0%) | 10 (2.8%) |
| $75,000 to $99,999 | 56 (18.3%) | 0 (0.0%) |
| $100,000+ | 107 (35.0%) | 14 (3.9%) |
| Total | 306 (100.0%) | 360 (100.0%) |
Earnings by Sex by Educational Attainment in Blue Ball
Average earnings in Blue Ball are $88,245 for men and $50,429 for women, a difference of 42.8%. Men with an educational attainment of less than high school enjoy the highest average annual earnings of $163,650, while those with high school diploma education earn the least with $56,000. Women with an educational attainment of high school diploma earn the most with the average annual earnings of $50,368, while those with college or associate's degree education have the smallest earnings of $43,603.
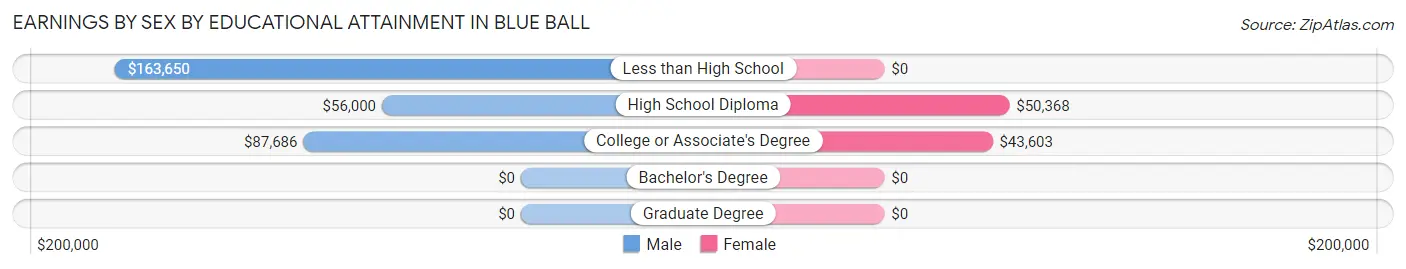
| Educational Attainment | Male Income | Female Income |
| Less than High School | $163,650 | $0 |
| High School Diploma | $56,000 | $50,368 |
| College or Associate's Degree | $87,686 | $43,603 |
| Bachelor's Degree | - | - |
| Graduate Degree | - | - |
| Total | $88,245 | $50,429 |
Family Income in Blue Ball
Family Income Brackets in Blue Ball
According to the Blue Ball family income data, there are 80 families falling into the $100,000 to $149,999 income range, which is the most common income bracket and makes up 32.7% of all families.
| Income Bracket | # Families | % Families |
| Less than $10,000 | 0 | 0.0% |
| $10,000 to $14,999 | 0 | 0.0% |
| $15,000 to $24,999 | 0 | 0.0% |
| $25,000 to $34,999 | 0 | 0.0% |
| $35,000 to $49,999 | 0 | 0.0% |
| $50,000 to $74,999 | 69 | 28.2% |
| $75,000 to $99,999 | 37 | 15.1% |
| $100,000 to $149,999 | 80 | 32.7% |
| $150,000 to $199,999 | 13 | 5.3% |
| $200,000+ | 46 | 18.8% |
Family Income by Famaliy Size in Blue Ball
2-person families (37 | 15.1%) account for the highest median family income in Blue Ball with $250,001 per family, while 2-person families (37 | 15.1%) have the highest median income of $125,000 per family member.
| Income Bracket | # Families | Median Income |
| 2-Person Families | 37 (15.1%) | $250,001 |
| 3-Person Families | 167 (68.2%) | $128,650 |
| 4-Person Families | 28 (11.4%) | $0 |
| 5-Person Families | 13 (5.3%) | $0 |
| 6-Person Families | 0 (0.0%) | $0 |
| 7+ Person Families | 0 (0.0%) | $0 |
| Total | 245 (100.0%) | $128,350 |
Family Income by Number of Earners in Blue Ball
| Number of Earners | # Families | Median Income |
| No Earners | 0 (0.0%) | $0 |
| 1 Earner | 19 (7.8%) | $0 |
| 2 Earners | 201 (82.0%) | $103,906 |
| 3+ Earners | 25 (10.2%) | $0 |
| Total | 245 (100.0%) | $128,350 |
Household Income in Blue Ball
Household Income Brackets in Blue Ball
With 97 households falling in the category, the $50,000 to $74,999 income range is the most frequent in Blue Ball, accounting for 25.7% of all households.
| Income Bracket | # Households | % Households |
| Less than $10,000 | 17 | 4.5% |
| $10,000 to $14,999 | 0 | 0.0% |
| $15,000 to $24,999 | 0 | 0.0% |
| $25,000 to $34,999 | 11 | 2.9% |
| $35,000 to $49,999 | 17 | 4.5% |
| $50,000 to $74,999 | 97 | 25.7% |
| $75,000 to $99,999 | 46 | 12.2% |
| $100,000 to $149,999 | 80 | 21.2% |
| $150,000 to $199,999 | 63 | 16.7% |
| $200,000+ | 46 | 12.2% |
Household Income by Householder Age in Blue Ball
The median household income in Blue Ball is $102,656, with the highest median household income of $163,025 found in the 45 to 64 years age bracket for the primary householder. A total of 107 households (28.4%) fall into this category. Meanwhile, the 15 to 24 years age bracket for the primary householder has the lowest median household income of $0, with 9 households (2.4%) in this group.
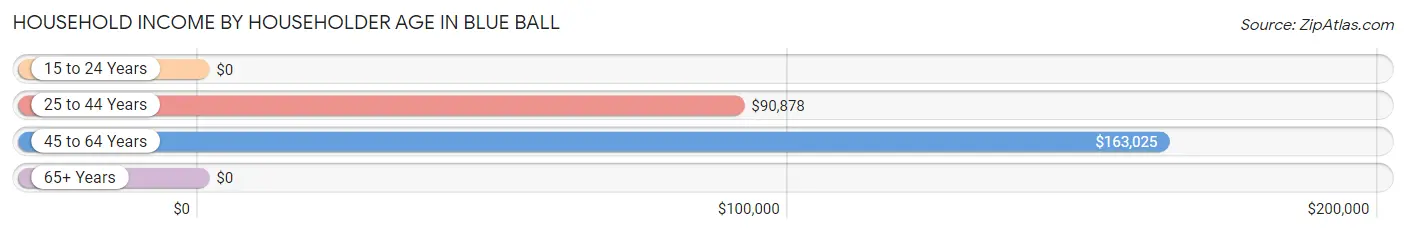
| Income Bracket | # Households | Median Income |
| 15 to 24 Years | 9 (2.4%) | $0 |
| 25 to 44 Years | 214 (56.8%) | $90,878 |
| 45 to 64 Years | 107 (28.4%) | $163,025 |
| 65+ Years | 47 (12.5%) | $0 |
| Total | 377 (100.0%) | $102,656 |
Poverty in Blue Ball
Income Below Poverty by Sex and Age in Blue Ball
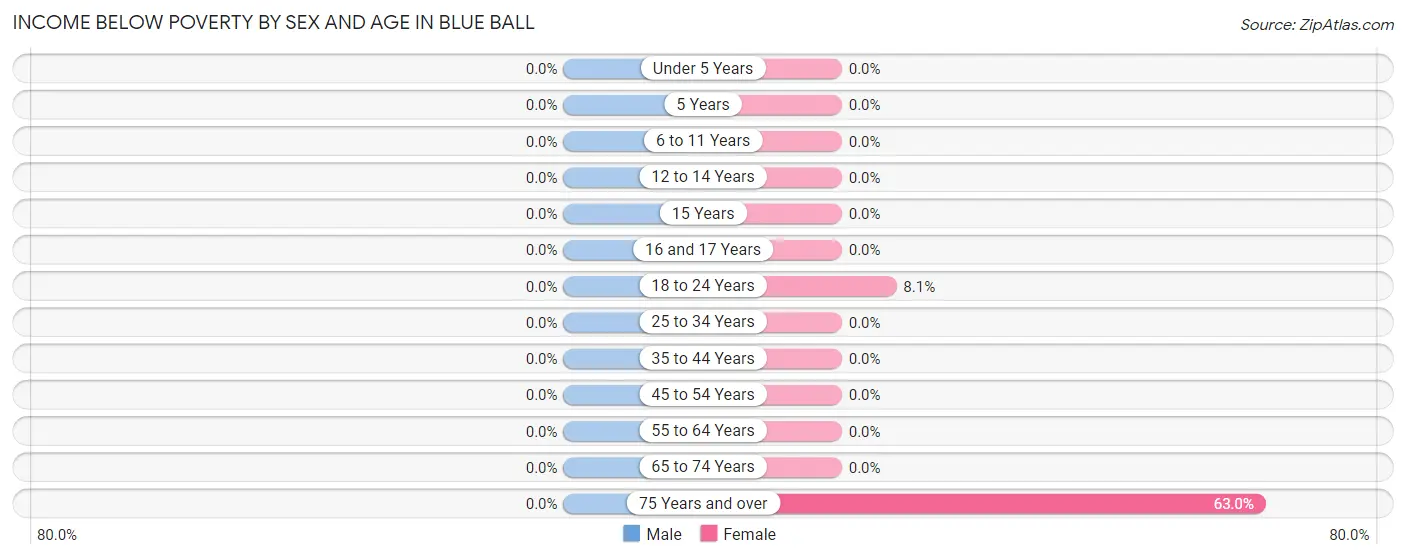
| Age Bracket | Male | Female |
| Under 5 Years | 0 (0.0%) | 0 (0.0%) |
| 5 Years | 0 (0.0%) | 0 (0.0%) |
| 6 to 11 Years | 0 (0.0%) | 0 (0.0%) |
| 12 to 14 Years | 0 (0.0%) | 0 (0.0%) |
| 15 Years | 0 (0.0%) | 0 (0.0%) |
| 16 and 17 Years | 0 (0.0%) | 0 (0.0%) |
| 18 to 24 Years | 0 (0.0%) | 9 (8.1%) |
| 25 to 34 Years | 0 (0.0%) | 0 (0.0%) |
| 35 to 44 Years | 0 (0.0%) | 0 (0.0%) |
| 45 to 54 Years | 0 (0.0%) | 0 (0.0%) |
| 55 to 64 Years | 0 (0.0%) | 0 (0.0%) |
| 65 to 74 Years | 0 (0.0%) | 0 (0.0%) |
| 75 Years and over | 0 (0.0%) | 17 (63.0%) |
| Total | 0 (0.0%) | 26 (5.1%) |
Income Above Poverty by Sex and Age in Blue Ball
According to the poverty statistics in Blue Ball, males aged under 5 years and females aged under 5 years are the age groups that are most secure financially, with 100.0% of males and 100.0% of females in these age groups living above the poverty line.
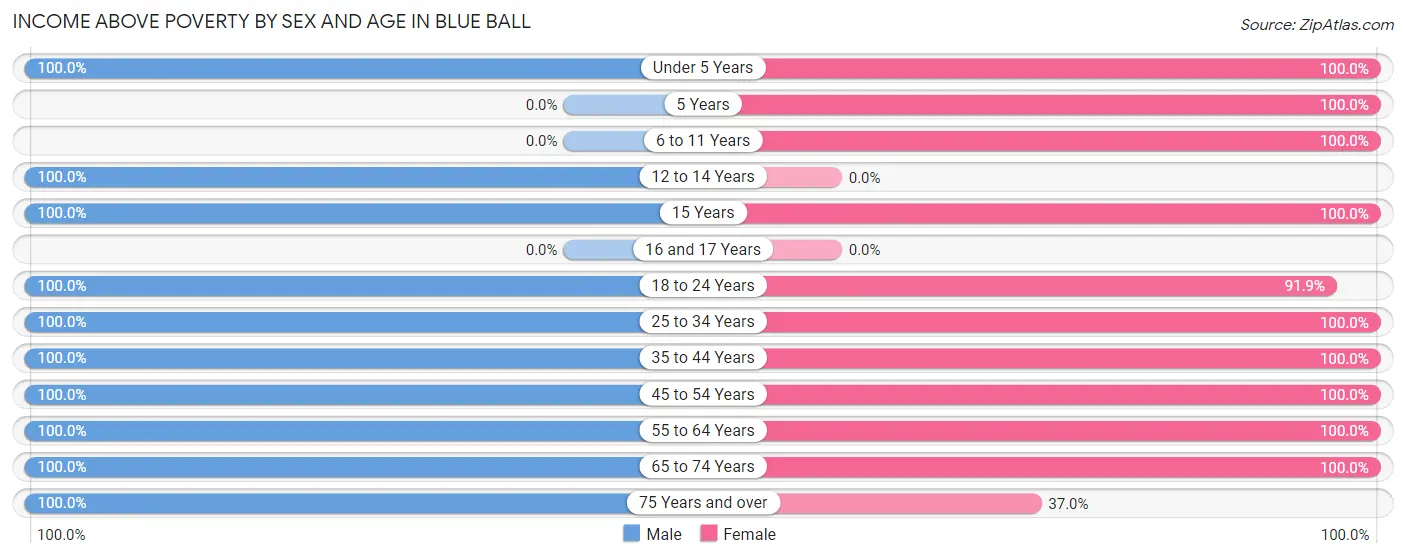
| Age Bracket | Male | Female |
| Under 5 Years | 56 (100.0%) | 39 (100.0%) |
| 5 Years | 0 (0.0%) | 19 (100.0%) |
| 6 to 11 Years | 0 (0.0%) | 32 (100.0%) |
| 12 to 14 Years | 8 (100.0%) | 0 (0.0%) |
| 15 Years | 8 (100.0%) | 5 (100.0%) |
| 16 and 17 Years | 0 (0.0%) | 0 (0.0%) |
| 18 to 24 Years | 26 (100.0%) | 102 (91.9%) |
| 25 to 34 Years | 159 (100.0%) | 152 (100.0%) |
| 35 to 44 Years | 58 (100.0%) | 50 (100.0%) |
| 45 to 54 Years | 63 (100.0%) | 61 (100.0%) |
| 55 to 64 Years | 38 (100.0%) | 5 (100.0%) |
| 65 to 74 Years | 16 (100.0%) | 10 (100.0%) |
| 75 Years and over | 9 (100.0%) | 10 (37.0%) |
| Total | 441 (100.0%) | 485 (94.9%) |
Income Below Poverty Among Married-Couple Families in Blue Ball
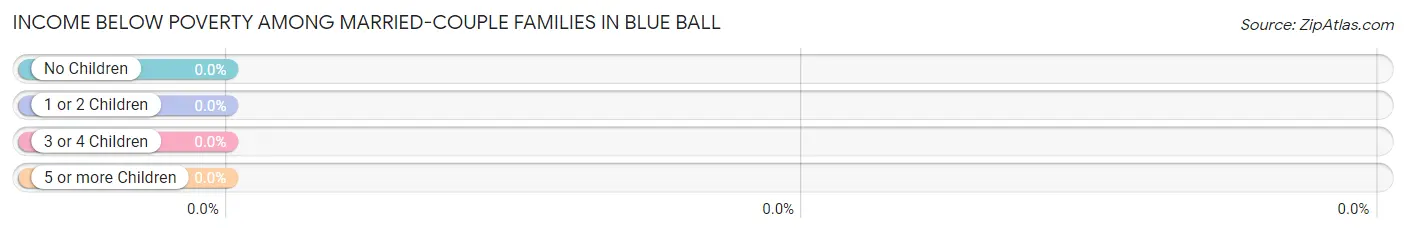
| Children | Above Poverty | Below Poverty |
| No Children | 57 (100.0%) | 0 (0.0%) |
| 1 or 2 Children | 97 (100.0%) | 0 (0.0%) |
| 3 or 4 Children | 13 (100.0%) | 0 (0.0%) |
| 5 or more Children | 0 (0.0%) | 0 (0.0%) |
| Total | 167 (100.0%) | 0 (0.0%) |
Income Below Poverty Among Single-Parent Households in Blue Ball
| Children | Single Father | Single Mother |
| No Children | 0 (0.0%) | 0 (0.0%) |
| 1 or 2 Children | 0 (0.0%) | 0 (0.0%) |
| 3 or 4 Children | 0 (0.0%) | 0 (0.0%) |
| 5 or more Children | 0 (0.0%) | 0 (0.0%) |
| Total | 0 (0.0%) | 0 (0.0%) |
Income Below Poverty Among Married-Couple vs Single-Parent Households in Blue Ball
| Children | Married-Couple Families | Single-Parent Households |
| No Children | 0 (0.0%) | 0 (0.0%) |
| 1 or 2 Children | 0 (0.0%) | 0 (0.0%) |
| 3 or 4 Children | 0 (0.0%) | 0 (0.0%) |
| 5 or more Children | 0 (0.0%) | 0 (0.0%) |
| Total | 0 (0.0%) | 0 (0.0%) |
Race in Blue Ball
The most populous races in Blue Ball are White / Caucasian (709 | 74.5%), Black / African American (149 | 15.7%), and Two or more Races (94 | 9.9%).
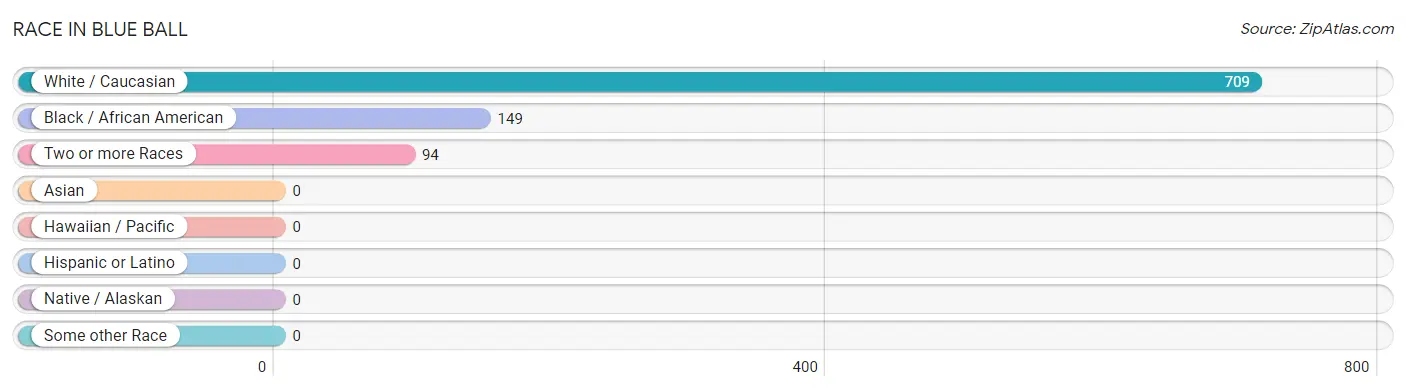
| Race | # Population | % Population |
| Asian | 0 | 0.0% |
| Black / African American | 149 | 15.7% |
| Hawaiian / Pacific | 0 | 0.0% |
| Hispanic or Latino | 0 | 0.0% |
| Native / Alaskan | 0 | 0.0% |
| White / Caucasian | 709 | 74.5% |
| Two or more Races | 94 | 9.9% |
| Some other Race | 0 | 0.0% |
| Total | 952 | 100.0% |
Ancestry in Blue Ball
The most populous ancestries reported in Blue Ball are German (276 | 29.0%), Irish (147 | 15.4%), Italian (137 | 14.4%), African (99 | 10.4%), and Subsaharan African (99 | 10.4%), together accounting for 79.6% of all Blue Ball residents.
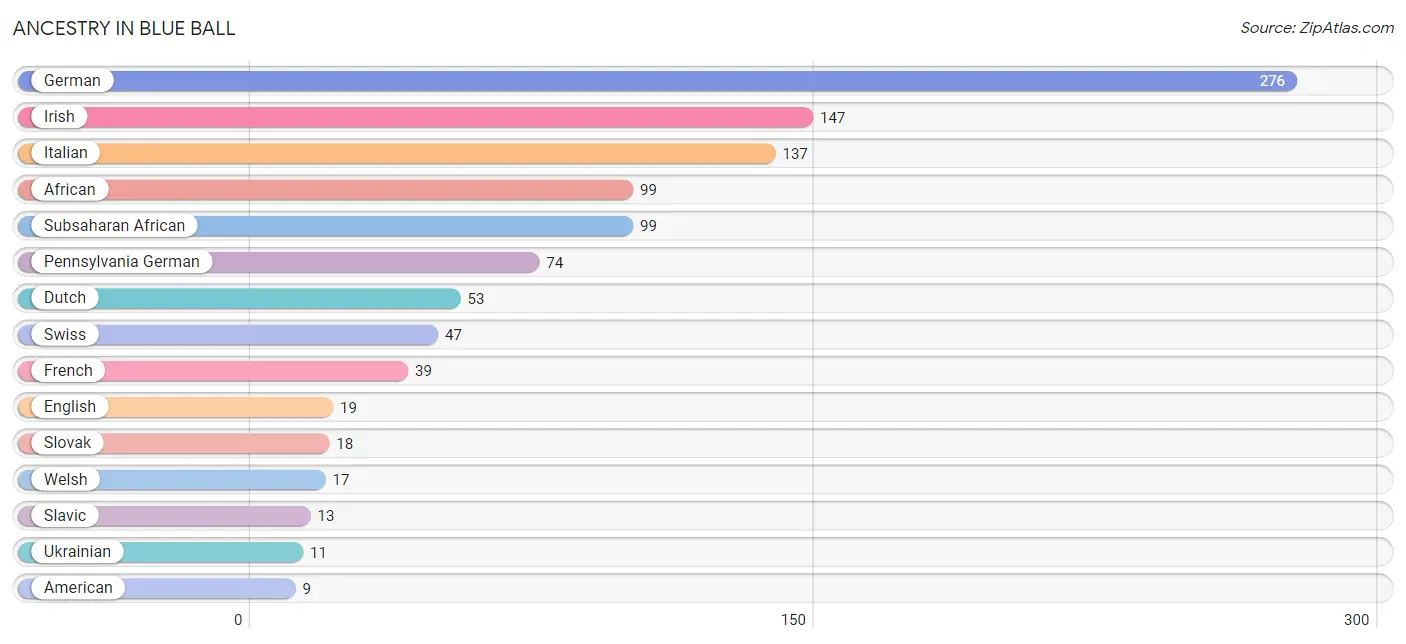
| Ancestry | # Population | % Population |
| African | 99 | 10.4% |
| American | 9 | 0.9% |
| Dutch | 53 | 5.6% |
| English | 19 | 2.0% |
| French | 39 | 4.1% |
| German | 276 | 29.0% |
| Irish | 147 | 15.4% |
| Italian | 137 | 14.4% |
| Pennsylvania German | 74 | 7.8% |
| Slavic | 13 | 1.4% |
| Slovak | 18 | 1.9% |
| Subsaharan African | 99 | 10.4% |
| Swedish | 8 | 0.8% |
| Swiss | 47 | 4.9% |
| Ukrainian | 11 | 1.2% |
| Welsh | 17 | 1.8% | View All 16 Rows |
Immigrants in Blue Ball
The most numerous immigrant groups reported in Blue Ball came from Asia (29 | 3.0%), and South Central Asia (29 | 3.0%), together accounting for 6.1% of all Blue Ball residents.
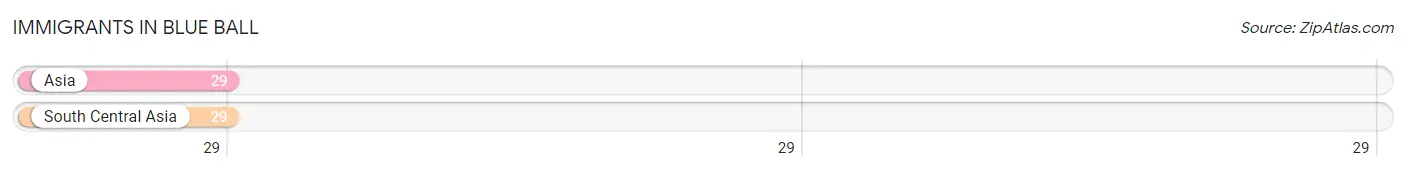
| Immigration Origin | # Population | % Population |
| Asia | 29 | 3.0% |
| South Central Asia | 29 | 3.0% | View All 2 Rows |
Sex and Age in Blue Ball
Sex and Age in Blue Ball
The most populous age groups in Blue Ball are 30 to 34 Years (100 | 22.7%) for men and 30 to 34 Years (109 | 21.3%) for women.
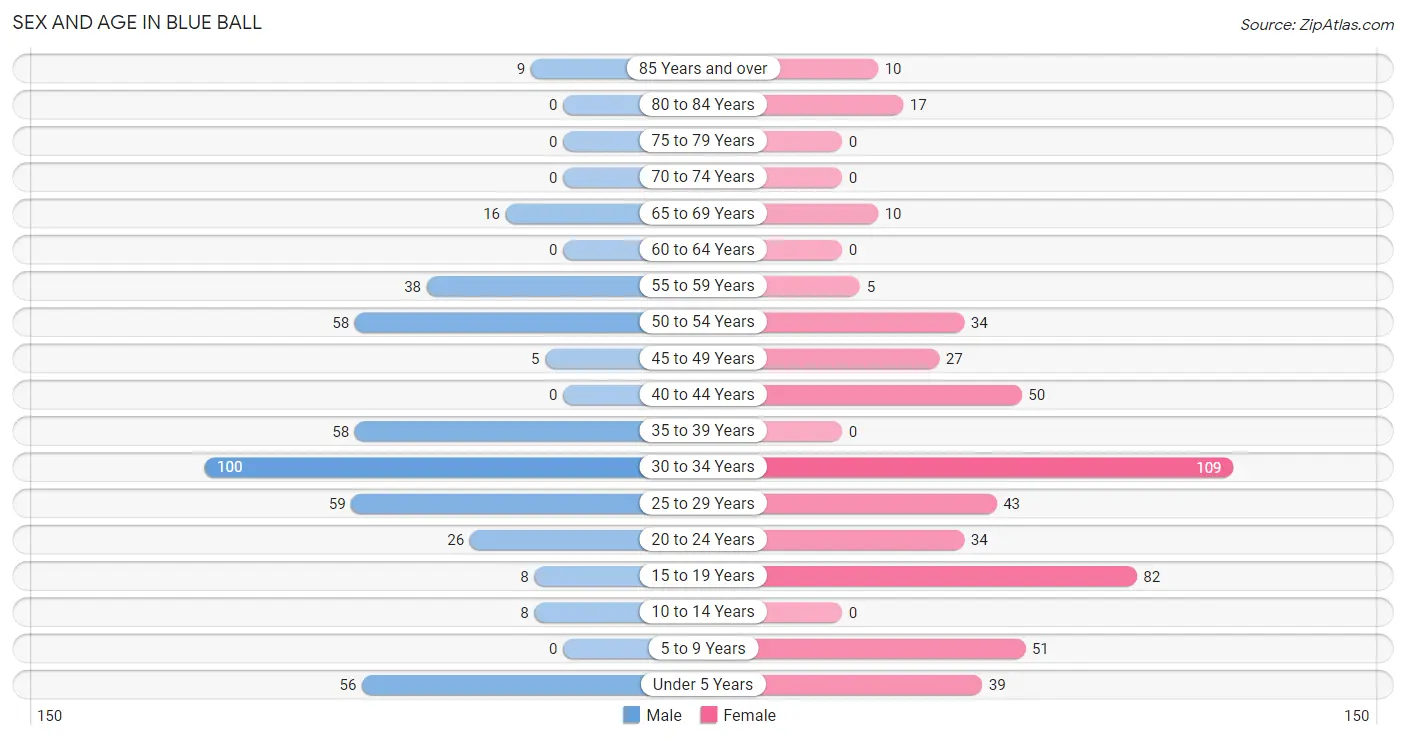
| Age Bracket | Male | Female |
| Under 5 Years | 56 (12.7%) | 39 (7.6%) |
| 5 to 9 Years | 0 (0.0%) | 51 (10.0%) |
| 10 to 14 Years | 8 (1.8%) | 0 (0.0%) |
| 15 to 19 Years | 8 (1.8%) | 82 (16.1%) |
| 20 to 24 Years | 26 (5.9%) | 34 (6.7%) |
| 25 to 29 Years | 59 (13.4%) | 43 (8.4%) |
| 30 to 34 Years | 100 (22.7%) | 109 (21.3%) |
| 35 to 39 Years | 58 (13.2%) | 0 (0.0%) |
| 40 to 44 Years | 0 (0.0%) | 50 (9.8%) |
| 45 to 49 Years | 5 (1.1%) | 27 (5.3%) |
| 50 to 54 Years | 58 (13.2%) | 34 (6.7%) |
| 55 to 59 Years | 38 (8.6%) | 5 (1.0%) |
| 60 to 64 Years | 0 (0.0%) | 0 (0.0%) |
| 65 to 69 Years | 16 (3.6%) | 10 (2.0%) |
| 70 to 74 Years | 0 (0.0%) | 0 (0.0%) |
| 75 to 79 Years | 0 (0.0%) | 0 (0.0%) |
| 80 to 84 Years | 0 (0.0%) | 17 (3.3%) |
| 85 Years and over | 9 (2.0%) | 10 (2.0%) |
| Total | 441 (100.0%) | 511 (100.0%) |
Families and Households in Blue Ball
Median Family Size in Blue Ball
The median family size in Blue Ball is 3.23 persons per family, with married-couple families (167 | 68.2%) accounting for the largest median family size of 3.34 persons per family. On the other hand, single female/mother families (55 | 22.5%) represent the smallest median family size with 2.89 persons per family.
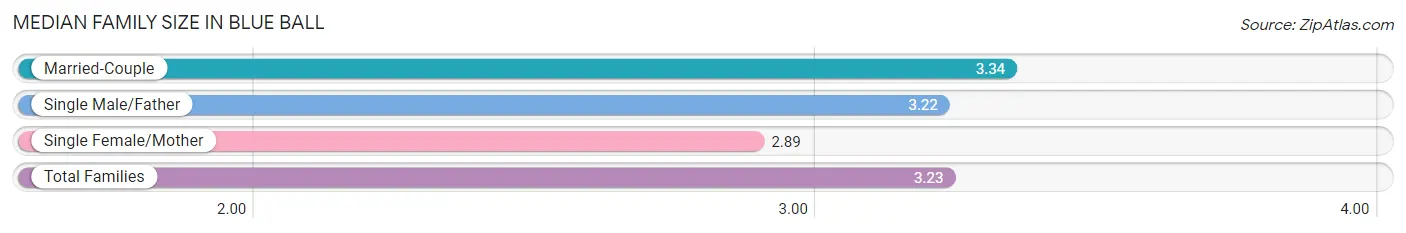
| Family Type | # Families | Family Size |
| Married-Couple | 167 (68.2%) | 3.34 |
| Single Male/Father | 23 (9.4%) | 3.22 |
| Single Female/Mother | 55 (22.5%) | 2.89 |
| Total Families | 245 (100.0%) | 3.23 |
Median Household Size in Blue Ball
The median household size in Blue Ball is 2.53 persons per household, with married-couple households (167 | 44.3%) accounting for the largest median household size of 3.34 persons per household. non-family households (132 | 35.0%) represent the smallest median household size with 1.22 persons per household.
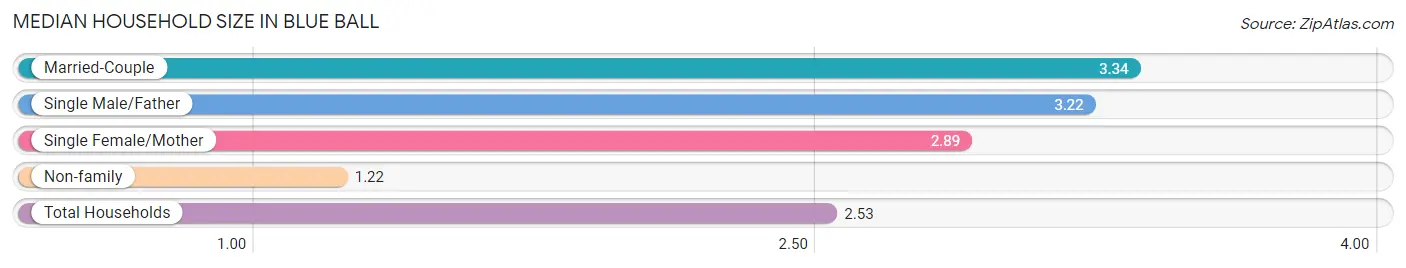
| Household Type | # Households | Household Size |
| Married-Couple | 167 (44.3%) | 3.34 |
| Single Male/Father | 23 (6.1%) | 3.22 |
| Single Female/Mother | 55 (14.6%) | 2.89 |
| Non-family | 132 (35.0%) | 1.22 |
| Total Households | 377 (100.0%) | 2.53 |
Household Size by Marriage Status in Blue Ball
Out of a total of 377 households in Blue Ball, 245 (65.0%) are family households, while 132 (35.0%) are nonfamily households. The most numerous type of family households are 3-person households, comprising 167, and the most common type of nonfamily households are 1-person households, comprising 105.
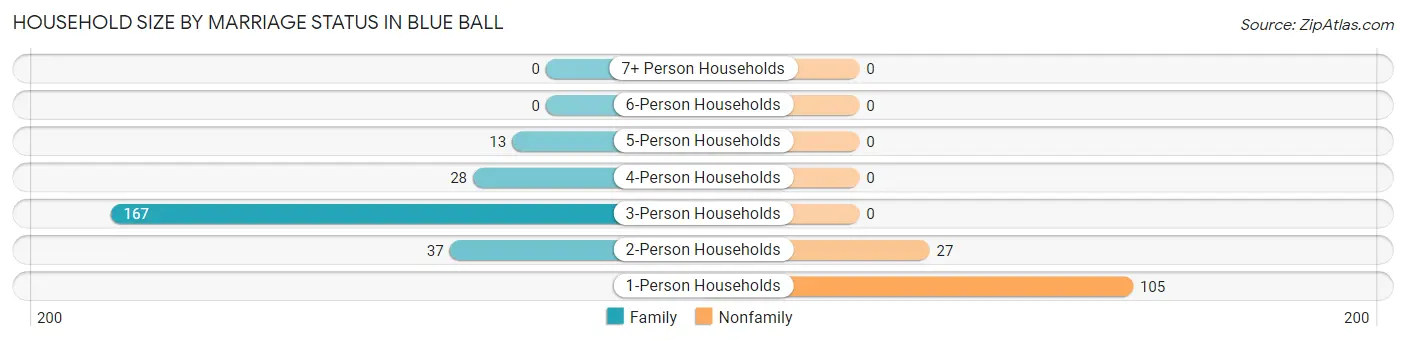
| Household Size | Family Households | Nonfamily Households |
| 1-Person Households | - | 105 (27.9%) |
| 2-Person Households | 37 (9.8%) | 27 (7.2%) |
| 3-Person Households | 167 (44.3%) | 0 (0.0%) |
| 4-Person Households | 28 (7.4%) | 0 (0.0%) |
| 5-Person Households | 13 (3.5%) | 0 (0.0%) |
| 6-Person Households | 0 (0.0%) | 0 (0.0%) |
| 7+ Person Households | 0 (0.0%) | 0 (0.0%) |
| Total | 245 (65.0%) | 132 (35.0%) |
Female Fertility in Blue Ball
Fertility by Age in Blue Ball
| Age Bracket | Women with Births | Births / 1,000 Women |
| 15 to 19 years | 0 (0.0%) | 0.0 |
| 20 to 34 years | 0 (0.0%) | 0.0 |
| 35 to 50 years | 0 (0.0%) | 0.0 |
| Total | 0 (0.0%) | 0.0 |
Fertility by Age by Marriage Status in Blue Ball
| Age Bracket | Married | Unmarried |
| 15 to 19 years | 0 (0.0%) | 0 (0.0%) |
| 20 to 34 years | 0 (0.0%) | 0 (0.0%) |
| 35 to 50 years | 0 (0.0%) | 0 (0.0%) |
| Total | 0 (0.0%) | 0 (0.0%) |
Fertility by Education in Blue Ball
| Educational Attainment | Women with Births | Births / 1,000 Women |
| Less than High School | 0 (0.0%) | 0.0 |
| High School Diploma | 0 (0.0%) | 0.0 |
| College or Associate's Degree | 0 (0.0%) | 0.0 |
| Bachelor's Degree | 0 (0.0%) | 0.0 |
| Graduate Degree | 0 (0.0%) | 0.0 |
| Total | 0 (0.0%) | 0.0 |
Fertility by Education by Marriage Status in Blue Ball
| Educational Attainment | Married | Unmarried |
| Less than High School | 0 (0.0%) | 0 (0.0%) |
| High School Diploma | 0 (0.0%) | 0 (0.0%) |
| College or Associate's Degree | 0 (0.0%) | 0 (0.0%) |
| Bachelor's Degree | 0 (0.0%) | 0 (0.0%) |
| Graduate Degree | 0 (0.0%) | 0 (0.0%) |
| Total | 0 (0.0%) | 0 (0.0%) |
Employment Characteristics in Blue Ball
Employment by Class of Employer in Blue Ball
Among the 625 employed individuals in Blue Ball, private company employees (346 | 55.4%), not-for-profit organizations (116 | 18.6%), and self-employed (not incorporated) (60 | 9.6%) make up the most common classes of employment.
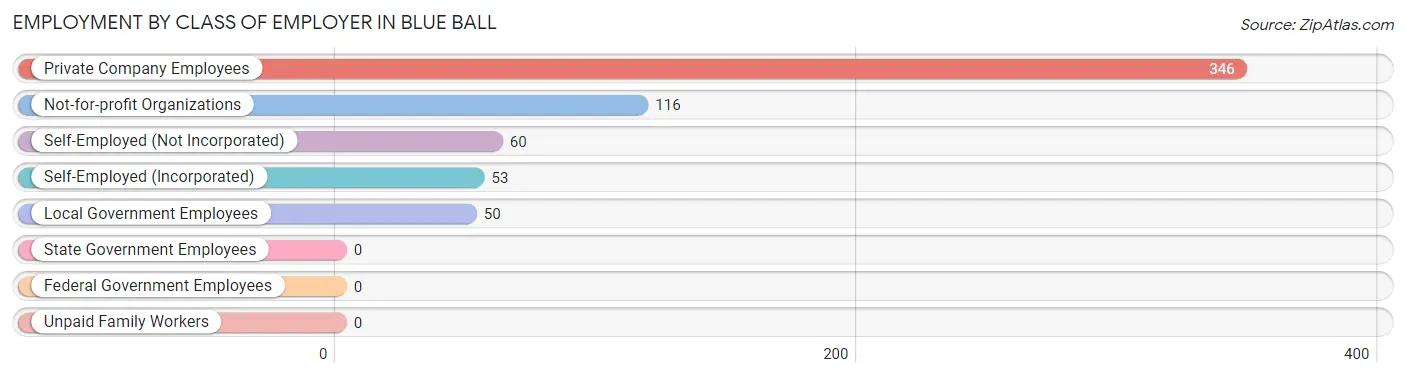
| Employer Class | # Employees | % Employees |
| Private Company Employees | 346 | 55.4% |
| Self-Employed (Incorporated) | 53 | 8.5% |
| Self-Employed (Not Incorporated) | 60 | 9.6% |
| Not-for-profit Organizations | 116 | 18.6% |
| Local Government Employees | 50 | 8.0% |
| State Government Employees | 0 | 0.0% |
| Federal Government Employees | 0 | 0.0% |
| Unpaid Family Workers | 0 | 0.0% |
| Total | 625 | 100.0% |
Employment Status by Age in Blue Ball
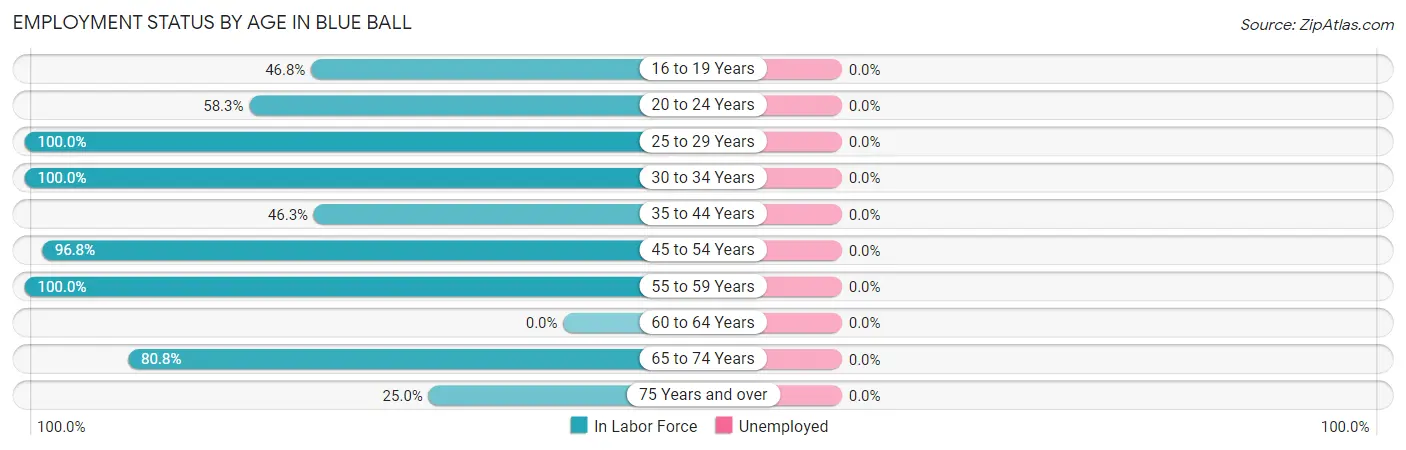
| Age Bracket | In Labor Force | Unemployed |
| 16 to 19 Years | 36 (46.8%) | 0 (0.0%) |
| 20 to 24 Years | 35 (58.3%) | 0 (0.0%) |
| 25 to 29 Years | 102 (100.0%) | 0 (0.0%) |
| 30 to 34 Years | 209 (100.0%) | 0 (0.0%) |
| 35 to 44 Years | 50 (46.3%) | 0 (0.0%) |
| 45 to 54 Years | 120 (96.8%) | 0 (0.0%) |
| 55 to 59 Years | 43 (100.0%) | 0 (0.0%) |
| 60 to 64 Years | 0 (0.0%) | 0 (0.0%) |
| 65 to 74 Years | 21 (80.8%) | 0 (0.0%) |
| 75 Years and over | 9 (25.0%) | 0 (0.0%) |
| Total | 625 (79.6%) | 0 (0.0%) |
Employment Status by Educational Attainment in Blue Ball
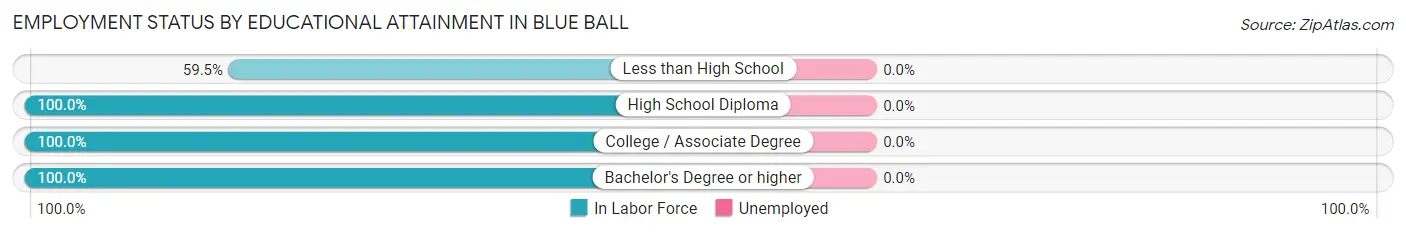
| Educational Attainment | In Labor Force | Unemployed |
| Less than High School | 91 (59.5%) | 0 (0.0%) |
| High School Diploma | 116 (100.0%) | 0 (0.0%) |
| College / Associate Degree | 216 (100.0%) | 0 (0.0%) |
| Bachelor's Degree or higher | 101 (100.0%) | 0 (0.0%) |
| Total | 524 (89.4%) | 0 (0.0%) |
Employment Occupations by Sex in Blue Ball
Management, Business, Science and Arts Occupations
The most common Management, Business, Science and Arts occupations in Blue Ball are Management (64 | 10.2%), Health Diagnosing & Treating (33 | 5.3%), Computers, Engineering & Science (30 | 4.8%), Life, Physical & Social Science (17 | 2.7%), and Computers & Mathematics (13 | 2.1%).
Management, Business, Science and Arts Occupations by Sex
Within the Management, Business, Science and Arts occupations in Blue Ball, the most male-oriented occupations are Computers & Mathematics (100.0%), Community & Social Service (100.0%), and Education, Arts & Media (100.0%), while the most female-oriented occupations are Business & Financial (100.0%), Life, Physical & Social Science (100.0%), and Health Diagnosing & Treating (100.0%).
| Occupation | Male | Female |
| Management | 32 (50.0%) | 32 (50.0%) |
| Business & Financial | 0 (0.0%) | 10 (100.0%) |
| Computers, Engineering & Science | 13 (43.3%) | 17 (56.7%) |
| Computers & Mathematics | 13 (100.0%) | 0 (0.0%) |
| Architecture & Engineering | 0 (0.0%) | 0 (0.0%) |
| Life, Physical & Social Science | 0 (0.0%) | 17 (100.0%) |
| Community & Social Service | 8 (100.0%) | 0 (0.0%) |
| Education, Arts & Media | 8 (100.0%) | 0 (0.0%) |
| Legal Services & Support | 0 (0.0%) | 0 (0.0%) |
| Education Instruction & Library | 0 (0.0%) | 0 (0.0%) |
| Arts, Media & Entertainment | 0 (0.0%) | 0 (0.0%) |
| Health Diagnosing & Treating | 0 (0.0%) | 33 (100.0%) |
| Health Technologists | 0 (0.0%) | 0 (0.0%) |
| Total (Category) | 53 (36.5%) | 92 (63.4%) |
| Total (Overall) | 306 (49.0%) | 319 (51.0%) |
Services Occupations
The most common Services occupations in Blue Ball are Healthcare Support (103 | 16.5%), Cleaning & Maintenance (36 | 5.8%), Security & Protection (22 | 3.5%), and Firefighting & Prevention (22 | 3.5%).
Services Occupations by Sex
| Occupation | Male | Female |
| Healthcare Support | 0 (0.0%) | 103 (100.0%) |
| Security & Protection | 22 (100.0%) | 0 (0.0%) |
| Firefighting & Prevention | 22 (100.0%) | 0 (0.0%) |
| Law Enforcement | 0 (0.0%) | 0 (0.0%) |
| Food Preparation & Serving | 0 (0.0%) | 0 (0.0%) |
| Cleaning & Maintenance | 36 (100.0%) | 0 (0.0%) |
| Personal Care & Service | 0 (0.0%) | 0 (0.0%) |
| Total (Category) | 58 (36.0%) | 103 (64.0%) |
| Total (Overall) | 306 (49.0%) | 319 (51.0%) |
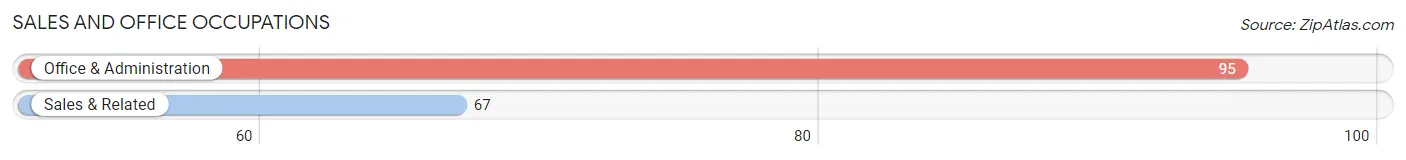
Sales and Office Occupations
The most common Sales and Office occupations in Blue Ball are Office & Administration (95 | 15.2%), and Sales & Related (67 | 10.7%).
Sales and Office Occupations by Sex
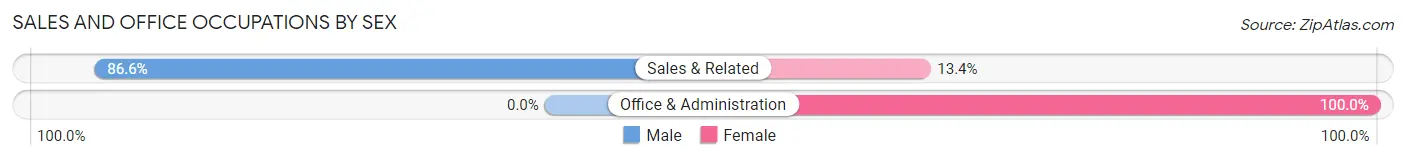
| Occupation | Male | Female |
| Sales & Related | 58 (86.6%) | 9 (13.4%) |
| Office & Administration | 0 (0.0%) | 95 (100.0%) |
| Total (Category) | 58 (35.8%) | 104 (64.2%) |
| Total (Overall) | 306 (49.0%) | 319 (51.0%) |
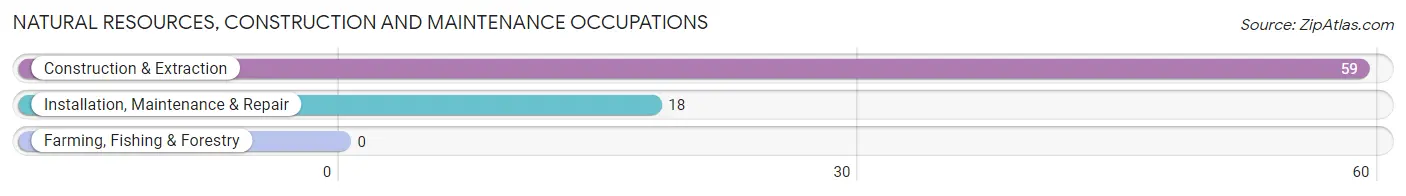
Natural Resources, Construction and Maintenance Occupations
The most common Natural Resources, Construction and Maintenance occupations in Blue Ball are Construction & Extraction (59 | 9.4%), and Installation, Maintenance & Repair (18 | 2.9%).
Natural Resources, Construction and Maintenance Occupations by Sex
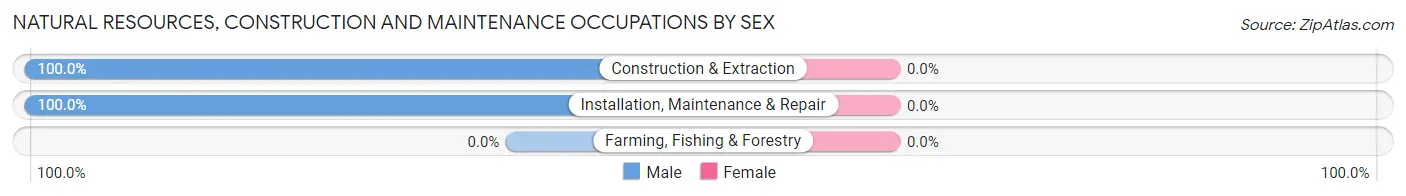
| Occupation | Male | Female |
| Farming, Fishing & Forestry | 0 (0.0%) | 0 (0.0%) |
| Construction & Extraction | 59 (100.0%) | 0 (0.0%) |
| Installation, Maintenance & Repair | 18 (100.0%) | 0 (0.0%) |
| Total (Category) | 77 (100.0%) | 0 (0.0%) |
| Total (Overall) | 306 (49.0%) | 319 (51.0%) |
Production, Transportation and Moving Occupations
The most common Production, Transportation and Moving occupations in Blue Ball are Material Moving (67 | 10.7%), and Production (13 | 2.1%).
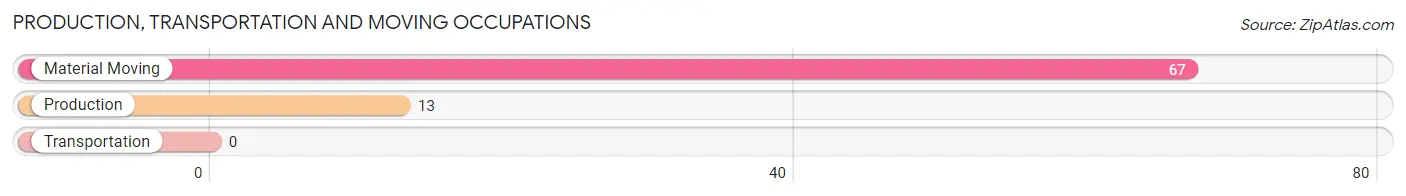
Production, Transportation and Moving Occupations by Sex
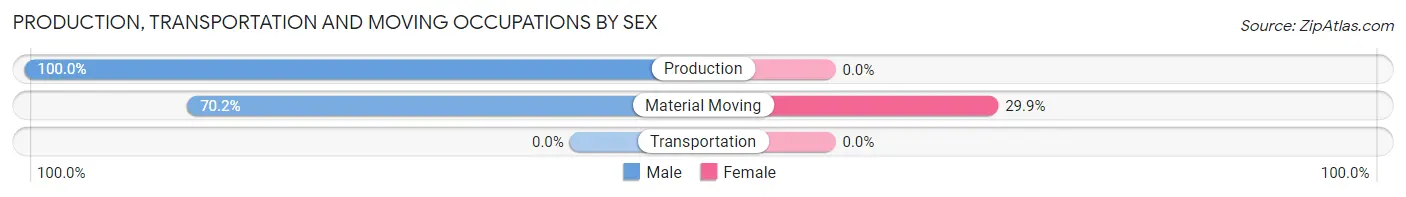
| Occupation | Male | Female |
| Production | 13 (100.0%) | 0 (0.0%) |
| Transportation | 0 (0.0%) | 0 (0.0%) |
| Material Moving | 47 (70.2%) | 20 (29.8%) |
| Total (Category) | 60 (75.0%) | 20 (25.0%) |
| Total (Overall) | 306 (49.0%) | 319 (51.0%) |
Employment Industries by Sex in Blue Ball
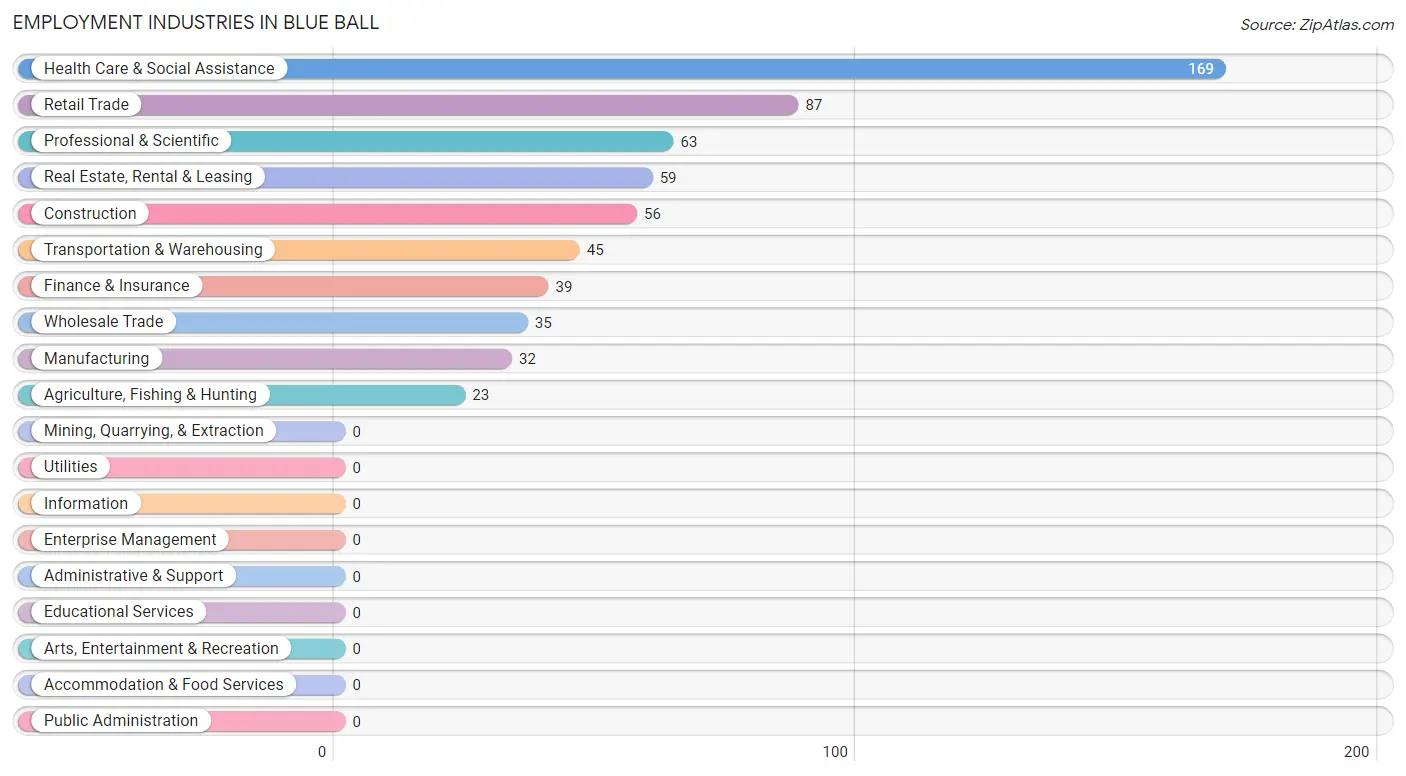
Employment Industries in Blue Ball
The major employment industries in Blue Ball include Health Care & Social Assistance (169 | 27.0%), Retail Trade (87 | 13.9%), Professional & Scientific (63 | 10.1%), Real Estate, Rental & Leasing (59 | 9.4%), and Construction (56 | 9.0%).
Employment Industries by Sex in Blue Ball
The Blue Ball industries that see more men than women are Agriculture, Fishing & Hunting (100.0%), Construction (100.0%), and Professional & Scientific (100.0%), whereas the industries that tend to have a higher number of women are Finance & Insurance (100.0%), Health Care & Social Assistance (80.5%), and Transportation & Warehousing (80.0%).
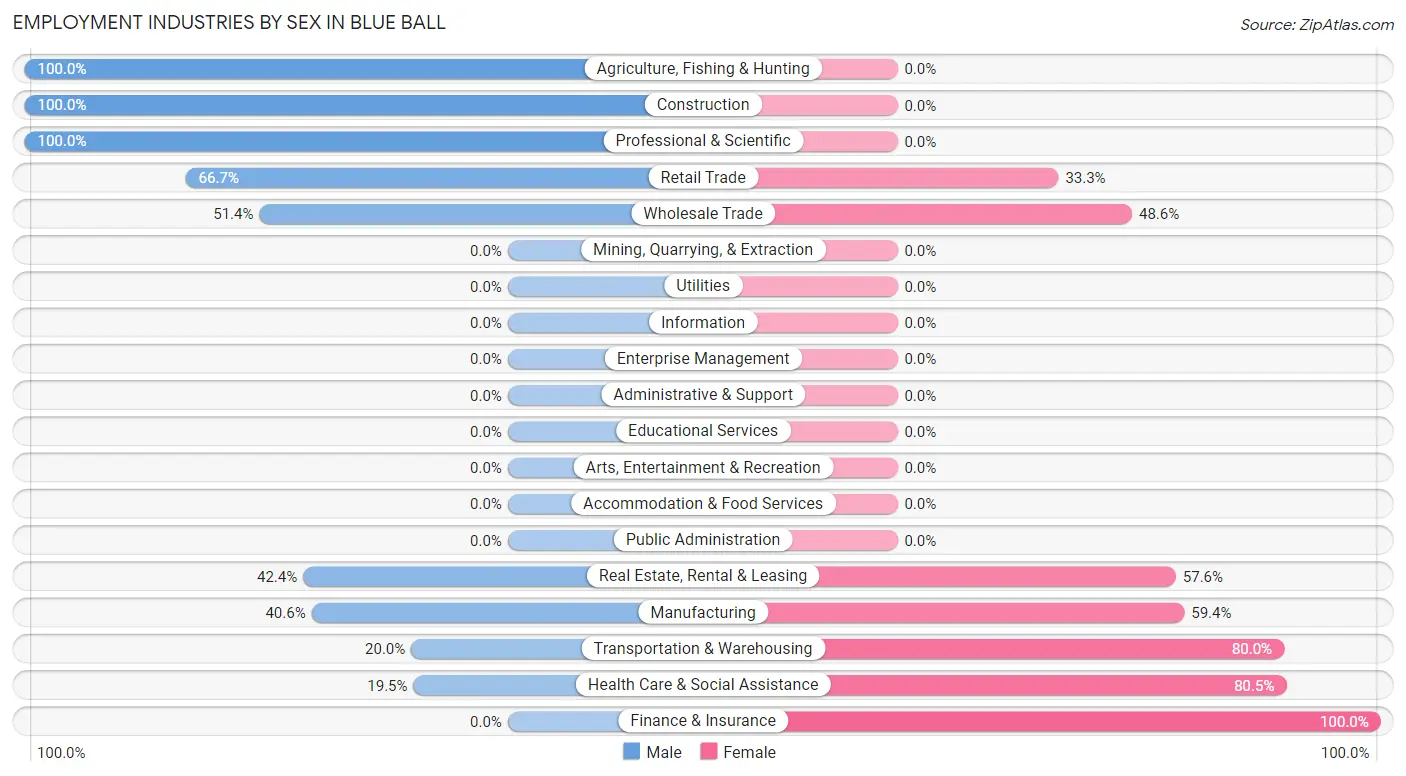
| Industry | Male | Female |
| Agriculture, Fishing & Hunting | 23 (100.0%) | 0 (0.0%) |
| Mining, Quarrying, & Extraction | 0 (0.0%) | 0 (0.0%) |
| Construction | 56 (100.0%) | 0 (0.0%) |
| Manufacturing | 13 (40.6%) | 19 (59.4%) |
| Wholesale Trade | 18 (51.4%) | 17 (48.6%) |
| Retail Trade | 58 (66.7%) | 29 (33.3%) |
| Transportation & Warehousing | 9 (20.0%) | 36 (80.0%) |
| Utilities | 0 (0.0%) | 0 (0.0%) |
| Information | 0 (0.0%) | 0 (0.0%) |
| Finance & Insurance | 0 (0.0%) | 39 (100.0%) |
| Real Estate, Rental & Leasing | 25 (42.4%) | 34 (57.6%) |
| Professional & Scientific | 63 (100.0%) | 0 (0.0%) |
| Enterprise Management | 0 (0.0%) | 0 (0.0%) |
| Administrative & Support | 0 (0.0%) | 0 (0.0%) |
| Educational Services | 0 (0.0%) | 0 (0.0%) |
| Health Care & Social Assistance | 33 (19.5%) | 136 (80.5%) |
| Arts, Entertainment & Recreation | 0 (0.0%) | 0 (0.0%) |
| Accommodation & Food Services | 0 (0.0%) | 0 (0.0%) |
| Public Administration | 0 (0.0%) | 0 (0.0%) |
| Total | 306 (49.0%) | 319 (51.0%) |
Education in Blue Ball
School Enrollment in Blue Ball
The most common levels of schooling among the 62 students in Blue Ball are elementary school (32 | 51.6%), high school (13 | 21.0%), and college / undergraduate (9 | 14.5%).
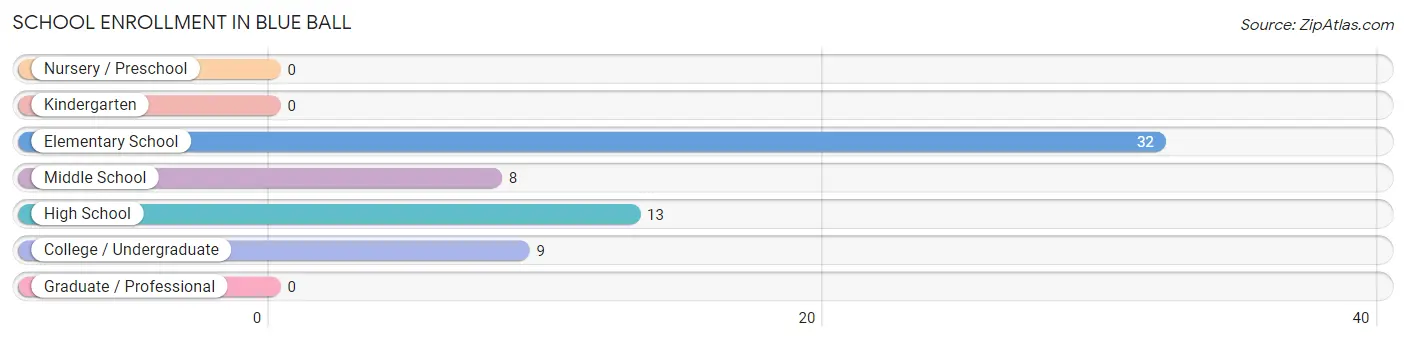
| School Level | # Students | % Students |
| Nursery / Preschool | 0 | 0.0% |
| Kindergarten | 0 | 0.0% |
| Elementary School | 32 | 51.6% |
| Middle School | 8 | 12.9% |
| High School | 13 | 21.0% |
| College / Undergraduate | 9 | 14.5% |
| Graduate / Professional | 0 | 0.0% |
| Total | 62 | 100.0% |
School Enrollment by Age by Funding Source in Blue Ball
Out of a total of 62 students who are enrolled in schools in Blue Ball, 43 (69.4%) attend a private institution, while the remaining 19 (30.6%) are enrolled in public schools. The age group of 10 to 14 year olds has the highest likelihood of being enrolled in private schools, with 8 (100.0% in the age bracket) enrolled. Conversely, the age group of 5 to 9 year old has the lowest likelihood of being enrolled in a private school, with 19 (59.4% in the age bracket) attending a public institution.
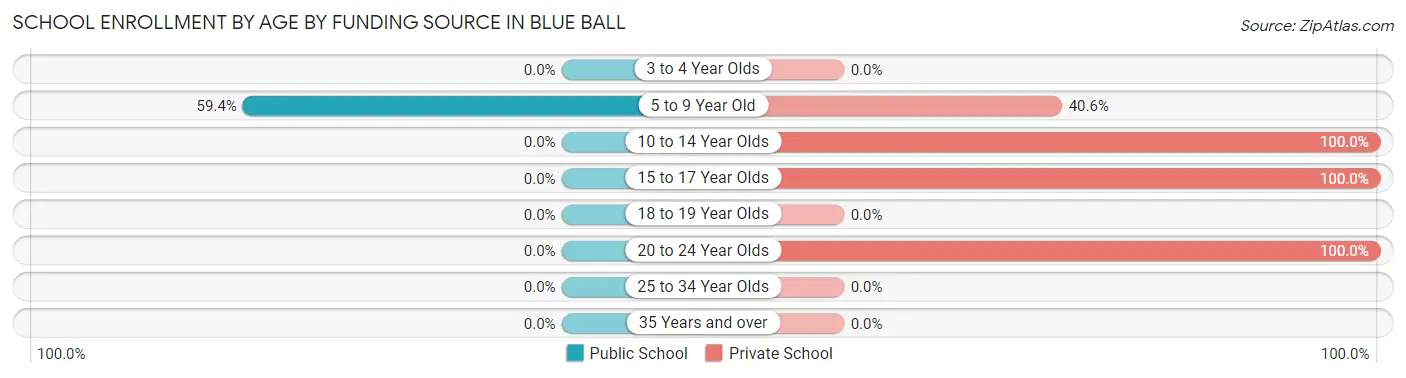
| Age Bracket | Public School | Private School |
| 3 to 4 Year Olds | 0 (0.0%) | 0 (0.0%) |
| 5 to 9 Year Old | 19 (59.4%) | 13 (40.6%) |
| 10 to 14 Year Olds | 0 (0.0%) | 8 (100.0%) |
| 15 to 17 Year Olds | 0 (0.0%) | 13 (100.0%) |
| 18 to 19 Year Olds | 0 (0.0%) | 0 (0.0%) |
| 20 to 24 Year Olds | 0 (0.0%) | 9 (100.0%) |
| 25 to 34 Year Olds | 0 (0.0%) | 0 (0.0%) |
| 35 Years and over | 0 (0.0%) | 0 (0.0%) |
| Total | 19 (30.6%) | 43 (69.4%) |
Educational Attainment by Field of Study in Blue Ball
Business (47 | 39.2%), liberal arts & history (32 | 26.7%), bio, nature & agricultural (17 | 14.2%), science & technology (16 | 13.3%), and psychology (8 | 6.7%) are the most common fields of study among 120 individuals in Blue Ball who have obtained a bachelor's degree or higher.
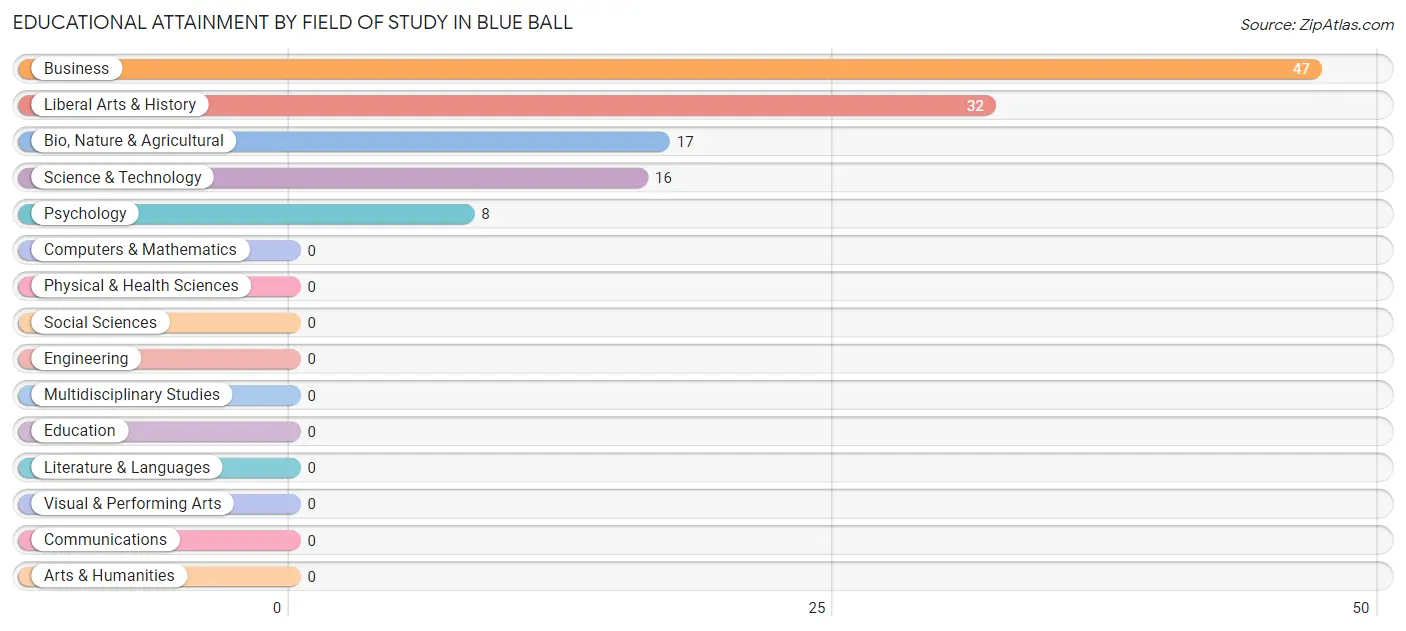
| Field of Study | # Graduates | % Graduates |
| Computers & Mathematics | 0 | 0.0% |
| Bio, Nature & Agricultural | 17 | 14.2% |
| Physical & Health Sciences | 0 | 0.0% |
| Psychology | 8 | 6.7% |
| Social Sciences | 0 | 0.0% |
| Engineering | 0 | 0.0% |
| Multidisciplinary Studies | 0 | 0.0% |
| Science & Technology | 16 | 13.3% |
| Business | 47 | 39.2% |
| Education | 0 | 0.0% |
| Literature & Languages | 0 | 0.0% |
| Liberal Arts & History | 32 | 26.7% |
| Visual & Performing Arts | 0 | 0.0% |
| Communications | 0 | 0.0% |
| Arts & Humanities | 0 | 0.0% |
| Total | 120 | 100.0% |
Transportation & Commute in Blue Ball
Vehicle Availability by Sex in Blue Ball
The most prevalent vehicle ownership categories in Blue Ball are males with 2 vehicles (185, accounting for 60.5%) and females with 2 vehicles (144, making up 58.0%).
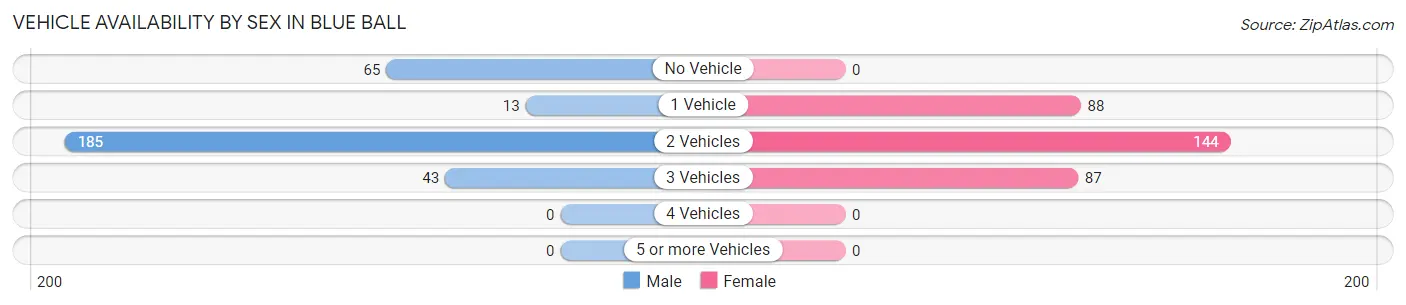
| Vehicles Available | Male | Female |
| No Vehicle | 65 (21.2%) | 0 (0.0%) |
| 1 Vehicle | 13 (4.3%) | 88 (27.6%) |
| 2 Vehicles | 185 (60.5%) | 144 (45.1%) |
| 3 Vehicles | 43 (14.1%) | 87 (27.3%) |
| 4 Vehicles | 0 (0.0%) | 0 (0.0%) |
| 5 or more Vehicles | 0 (0.0%) | 0 (0.0%) |
| Total | 306 (100.0%) | 319 (100.0%) |
Commute Time in Blue Ball
The most frequently occuring commute durations in Blue Ball are 20 to 24 minutes (129 commuters, 23.3%), less than 5 minutes (71 commuters, 12.8%), and 10 to 14 minutes (68 commuters, 12.3%).
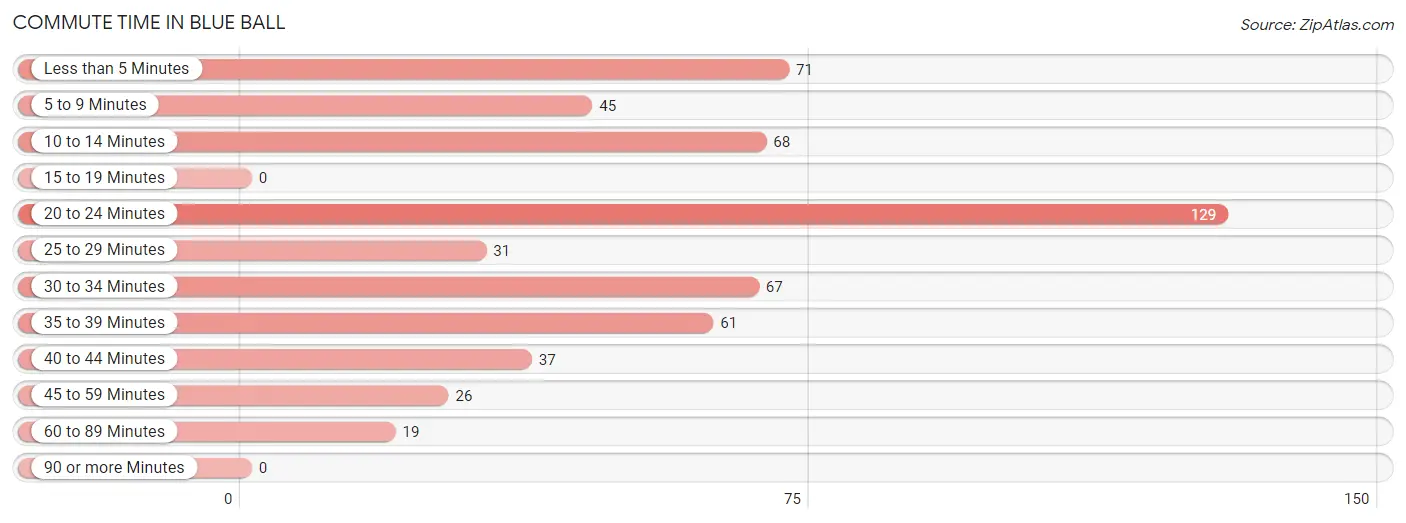
| Commute Time | # Commuters | % Commuters |
| Less than 5 Minutes | 71 | 12.8% |
| 5 to 9 Minutes | 45 | 8.1% |
| 10 to 14 Minutes | 68 | 12.3% |
| 15 to 19 Minutes | 0 | 0.0% |
| 20 to 24 Minutes | 129 | 23.3% |
| 25 to 29 Minutes | 31 | 5.6% |
| 30 to 34 Minutes | 67 | 12.1% |
| 35 to 39 Minutes | 61 | 11.0% |
| 40 to 44 Minutes | 37 | 6.7% |
| 45 to 59 Minutes | 26 | 4.7% |
| 60 to 89 Minutes | 19 | 3.4% |
| 90 or more Minutes | 0 | 0.0% |
Commute Time by Sex in Blue Ball
The most common commute times in Blue Ball are 20 to 24 minutes (110 commuters, 45.1%) for males and less than 5 minutes (53 commuters, 17.1%) for females.
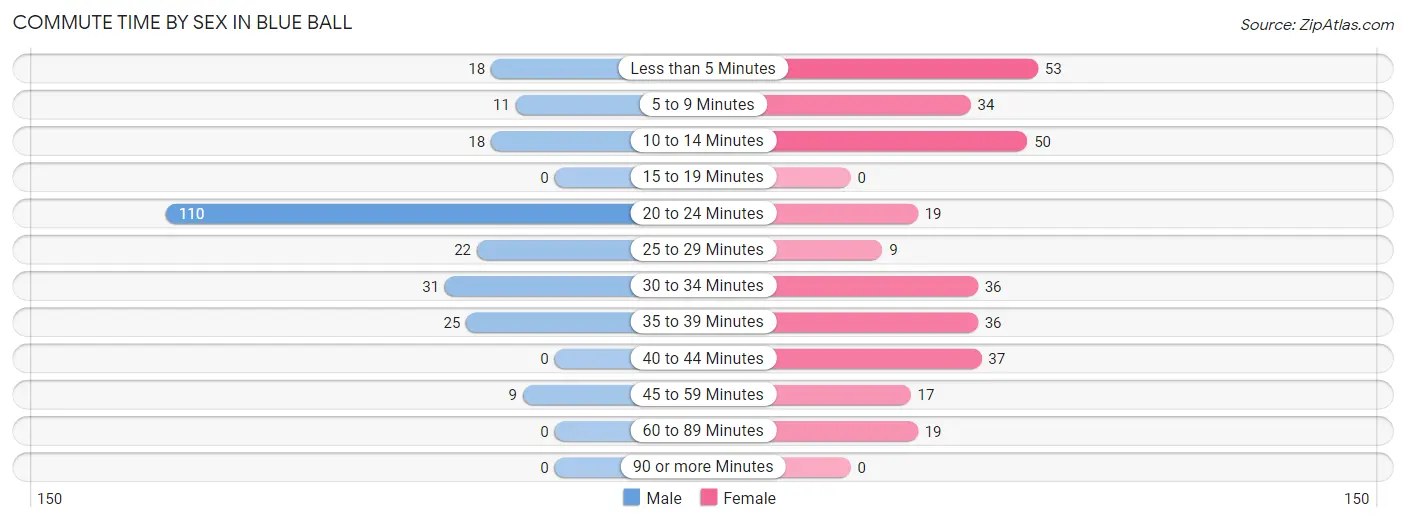
| Commute Time | Male | Female |
| Less than 5 Minutes | 18 (7.4%) | 53 (17.1%) |
| 5 to 9 Minutes | 11 (4.5%) | 34 (11.0%) |
| 10 to 14 Minutes | 18 (7.4%) | 50 (16.1%) |
| 15 to 19 Minutes | 0 (0.0%) | 0 (0.0%) |
| 20 to 24 Minutes | 110 (45.1%) | 19 (6.1%) |
| 25 to 29 Minutes | 22 (9.0%) | 9 (2.9%) |
| 30 to 34 Minutes | 31 (12.7%) | 36 (11.6%) |
| 35 to 39 Minutes | 25 (10.2%) | 36 (11.6%) |
| 40 to 44 Minutes | 0 (0.0%) | 37 (11.9%) |
| 45 to 59 Minutes | 9 (3.7%) | 17 (5.5%) |
| 60 to 89 Minutes | 0 (0.0%) | 19 (6.1%) |
| 90 or more Minutes | 0 (0.0%) | 0 (0.0%) |
Time of Departure to Work by Sex in Blue Ball
The most frequent times of departure to work in Blue Ball are 5:30 AM to 5:59 AM (115, 47.1%) for males and 6:30 AM to 6:59 AM (67, 21.6%) for females.
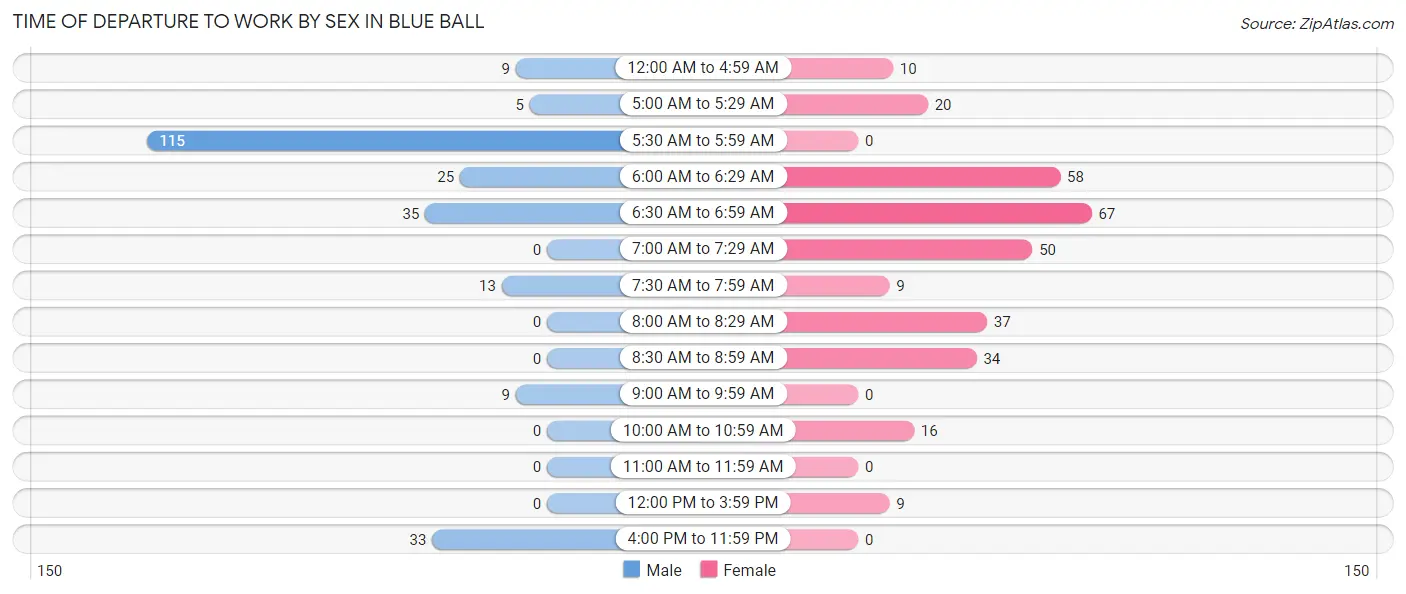
| Time of Departure | Male | Female |
| 12:00 AM to 4:59 AM | 9 (3.7%) | 10 (3.2%) |
| 5:00 AM to 5:29 AM | 5 (2.1%) | 20 (6.5%) |
| 5:30 AM to 5:59 AM | 115 (47.1%) | 0 (0.0%) |
| 6:00 AM to 6:29 AM | 25 (10.2%) | 58 (18.7%) |
| 6:30 AM to 6:59 AM | 35 (14.3%) | 67 (21.6%) |
| 7:00 AM to 7:29 AM | 0 (0.0%) | 50 (16.1%) |
| 7:30 AM to 7:59 AM | 13 (5.3%) | 9 (2.9%) |
| 8:00 AM to 8:29 AM | 0 (0.0%) | 37 (11.9%) |
| 8:30 AM to 8:59 AM | 0 (0.0%) | 34 (11.0%) |
| 9:00 AM to 9:59 AM | 9 (3.7%) | 0 (0.0%) |
| 10:00 AM to 10:59 AM | 0 (0.0%) | 16 (5.2%) |
| 11:00 AM to 11:59 AM | 0 (0.0%) | 0 (0.0%) |
| 12:00 PM to 3:59 PM | 0 (0.0%) | 9 (2.9%) |
| 4:00 PM to 11:59 PM | 33 (13.5%) | 0 (0.0%) |
| Total | 244 (100.0%) | 310 (100.0%) |
Housing Occupancy in Blue Ball
Occupancy by Ownership in Blue Ball
Of the total 377 dwellings in Blue Ball, owner-occupied units account for 181 (48.0%), while renter-occupied units make up 196 (52.0%).
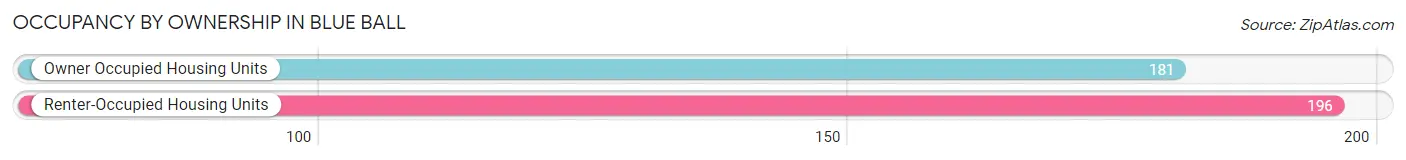
| Occupancy | # Housing Units | % Housing Units |
| Owner Occupied Housing Units | 181 | 48.0% |
| Renter-Occupied Housing Units | 196 | 52.0% |
| Total Occupied Housing Units | 377 | 100.0% |
Occupancy by Household Size in Blue Ball
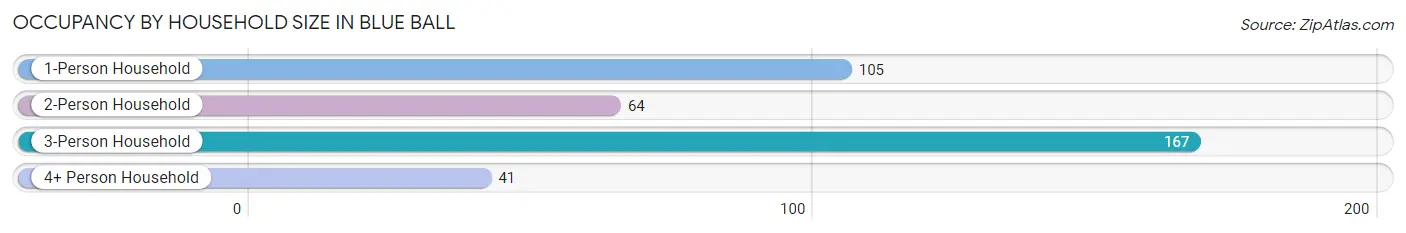
| Household Size | # Housing Units | % Housing Units |
| 1-Person Household | 105 | 27.9% |
| 2-Person Household | 64 | 17.0% |
| 3-Person Household | 167 | 44.3% |
| 4+ Person Household | 41 | 10.9% |
| Total Housing Units | 377 | 100.0% |
Occupancy by Ownership by Household Size in Blue Ball
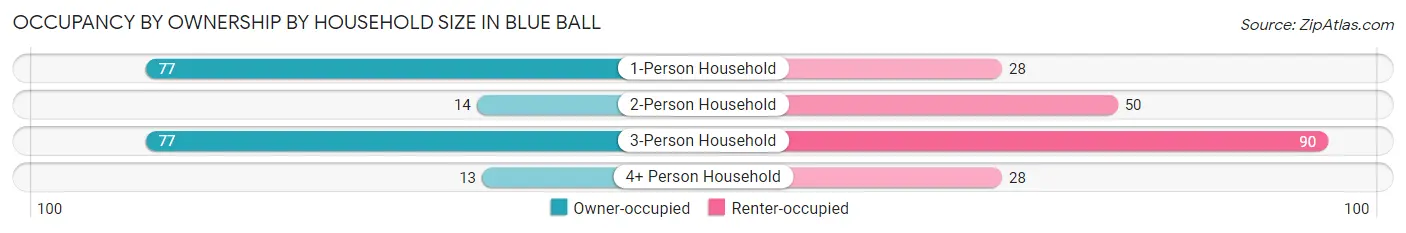
| Household Size | Owner-occupied | Renter-occupied |
| 1-Person Household | 77 (73.3%) | 28 (26.7%) |
| 2-Person Household | 14 (21.9%) | 50 (78.1%) |
| 3-Person Household | 77 (46.1%) | 90 (53.9%) |
| 4+ Person Household | 13 (31.7%) | 28 (68.3%) |
| Total Housing Units | 181 (48.0%) | 196 (52.0%) |
Occupancy by Educational Attainment in Blue Ball
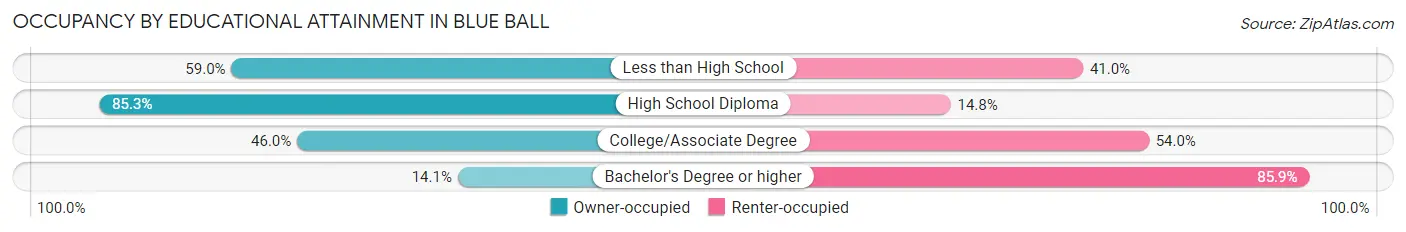
| Household Size | Owner-occupied | Renter-occupied |
| Less than High School | 59 (59.0%) | 41 (41.0%) |
| High School Diploma | 52 (85.3%) | 9 (14.7%) |
| College/Associate Degree | 57 (46.0%) | 67 (54.0%) |
| Bachelor's Degree or higher | 13 (14.1%) | 79 (85.9%) |
Occupancy by Age of Householder in Blue Ball
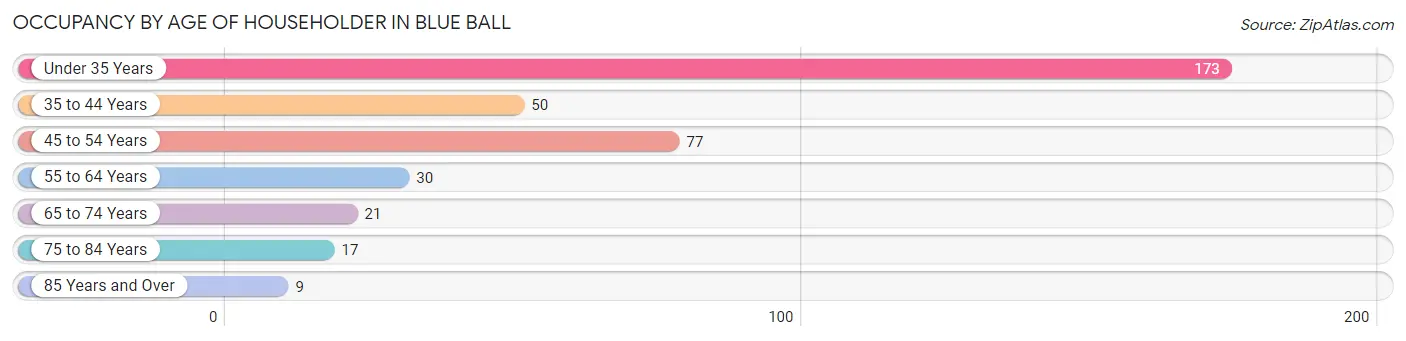
| Age Bracket | # Households | % Households |
| Under 35 Years | 173 | 45.9% |
| 35 to 44 Years | 50 | 13.3% |
| 45 to 54 Years | 77 | 20.4% |
| 55 to 64 Years | 30 | 8.0% |
| 65 to 74 Years | 21 | 5.6% |
| 75 to 84 Years | 17 | 4.5% |
| 85 Years and Over | 9 | 2.4% |
| Total | 377 | 100.0% |
Housing Finances in Blue Ball
Median Income by Occupancy in Blue Ball
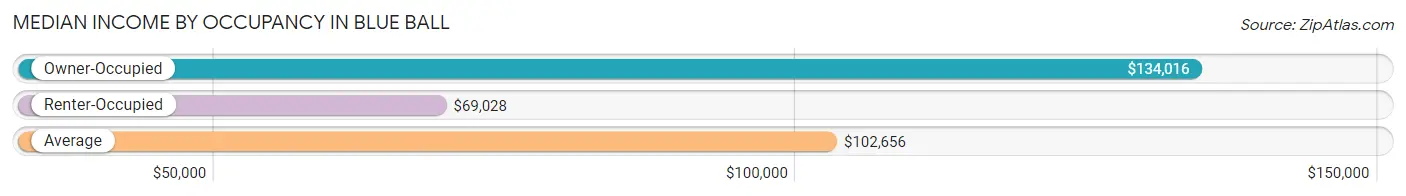
| Occupancy Type | # Households | Median Income |
| Owner-Occupied | 181 (48.0%) | $134,016 |
| Renter-Occupied | 196 (52.0%) | $69,028 |
| Average | 377 (100.0%) | $102,656 |
Occupancy by Householder Income Bracket in Blue Ball
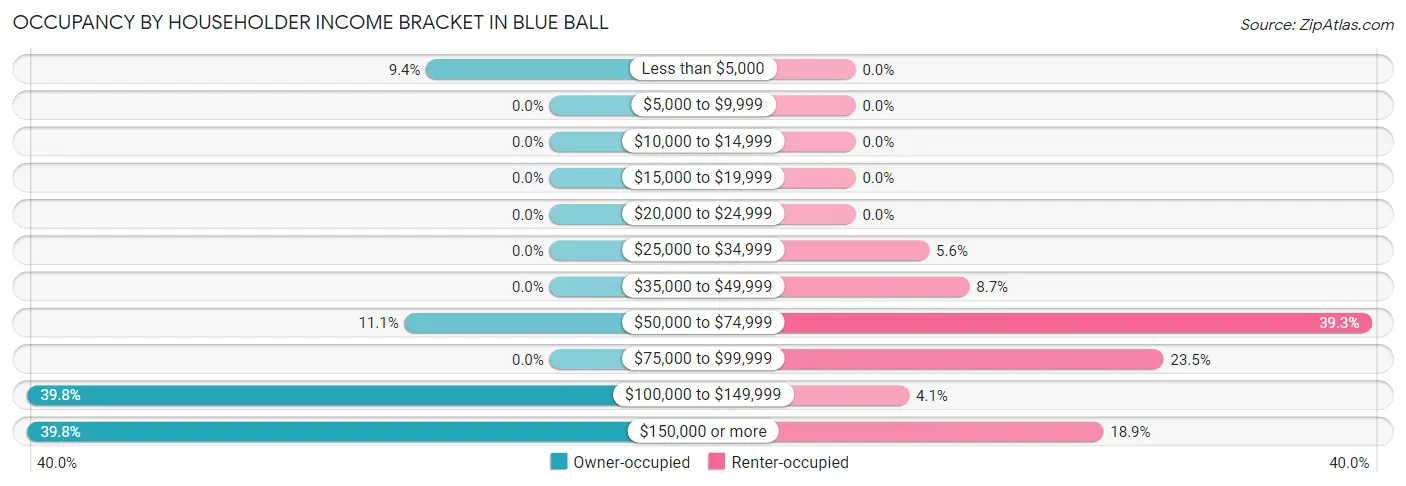
| Income Bracket | Owner-occupied | Renter-occupied |
| Less than $5,000 | 17 (9.4%) | 0 (0.0%) |
| $5,000 to $9,999 | 0 (0.0%) | 0 (0.0%) |
| $10,000 to $14,999 | 0 (0.0%) | 0 (0.0%) |
| $15,000 to $19,999 | 0 (0.0%) | 0 (0.0%) |
| $20,000 to $24,999 | 0 (0.0%) | 0 (0.0%) |
| $25,000 to $34,999 | 0 (0.0%) | 11 (5.6%) |
| $35,000 to $49,999 | 0 (0.0%) | 17 (8.7%) |
| $50,000 to $74,999 | 20 (11.1%) | 77 (39.3%) |
| $75,000 to $99,999 | 0 (0.0%) | 46 (23.5%) |
| $100,000 to $149,999 | 72 (39.8%) | 8 (4.1%) |
| $150,000 or more | 72 (39.8%) | 37 (18.9%) |
| Total | 181 (100.0%) | 196 (100.0%) |
Monthly Housing Cost Tiers in Blue Ball
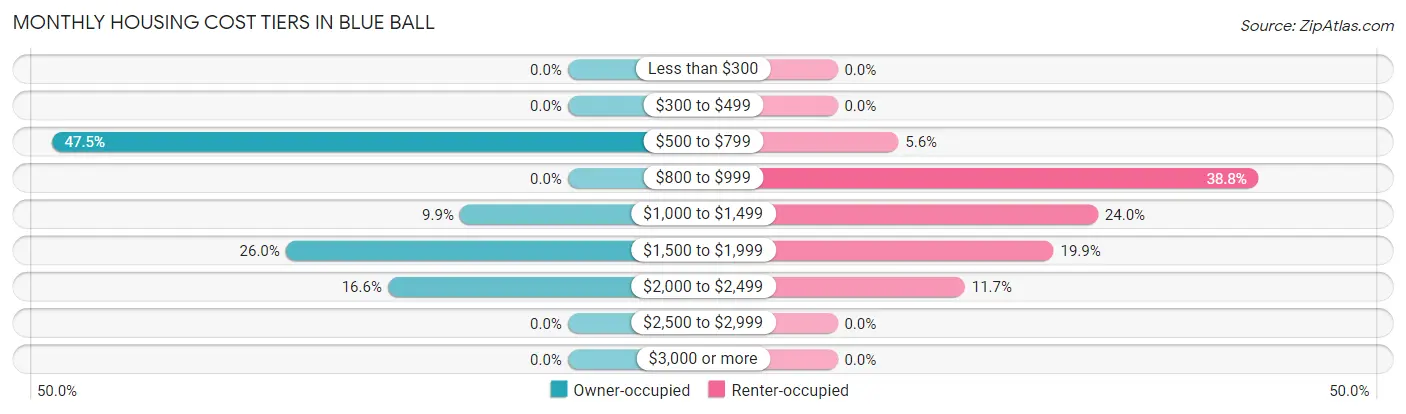
| Monthly Cost | Owner-occupied | Renter-occupied |
| Less than $300 | 0 (0.0%) | 0 (0.0%) |
| $300 to $499 | 0 (0.0%) | 0 (0.0%) |
| $500 to $799 | 86 (47.5%) | 11 (5.6%) |
| $800 to $999 | 0 (0.0%) | 76 (38.8%) |
| $1,000 to $1,499 | 18 (9.9%) | 47 (24.0%) |
| $1,500 to $1,999 | 47 (26.0%) | 39 (19.9%) |
| $2,000 to $2,499 | 30 (16.6%) | 23 (11.7%) |
| $2,500 to $2,999 | 0 (0.0%) | 0 (0.0%) |
| $3,000 or more | 0 (0.0%) | 0 (0.0%) |
| Total | 181 (100.0%) | 196 (100.0%) |
Physical Housing Characteristics in Blue Ball
Housing Structures in Blue Ball
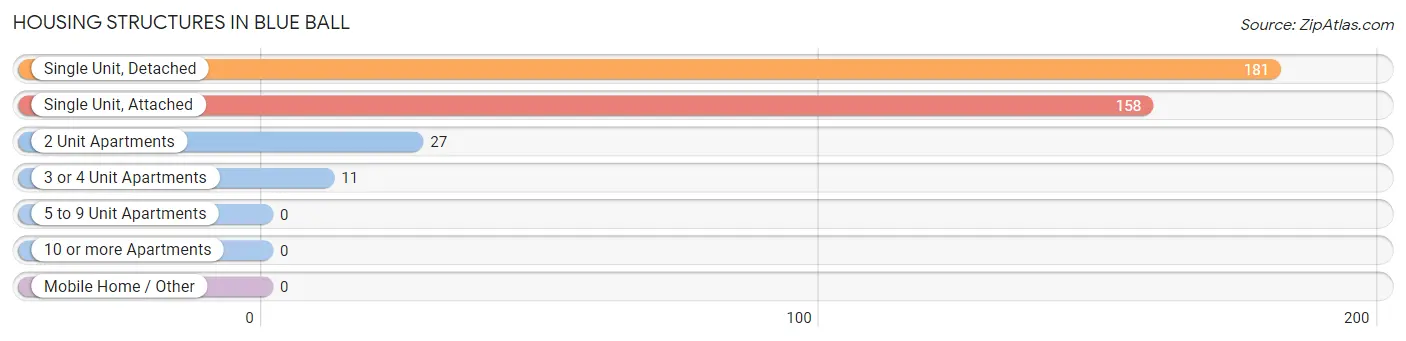
| Structure Type | # Housing Units | % Housing Units |
| Single Unit, Detached | 181 | 48.0% |
| Single Unit, Attached | 158 | 41.9% |
| 2 Unit Apartments | 27 | 7.2% |
| 3 or 4 Unit Apartments | 11 | 2.9% |
| 5 to 9 Unit Apartments | 0 | 0.0% |
| 10 or more Apartments | 0 | 0.0% |
| Mobile Home / Other | 0 | 0.0% |
| Total | 377 | 100.0% |
Housing Structures by Occupancy in Blue Ball
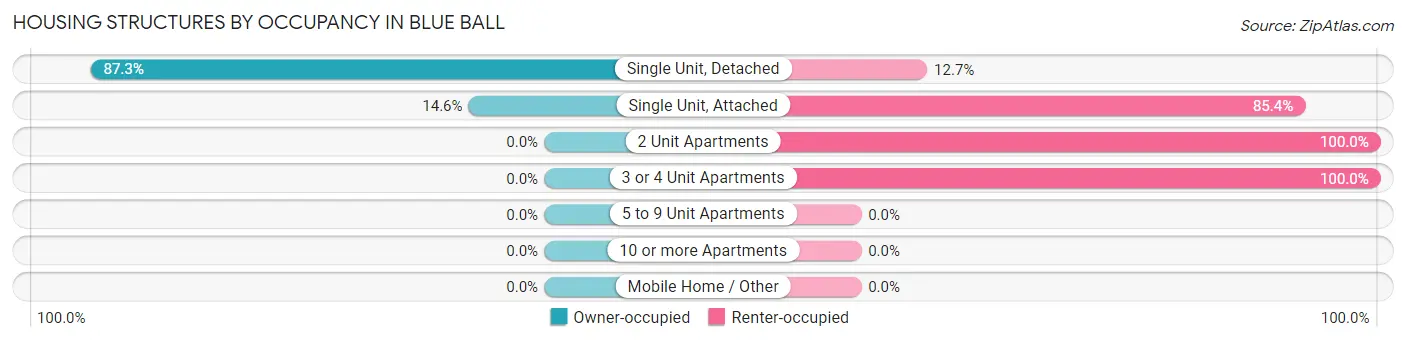
| Structure Type | Owner-occupied | Renter-occupied |
| Single Unit, Detached | 158 (87.3%) | 23 (12.7%) |
| Single Unit, Attached | 23 (14.6%) | 135 (85.4%) |
| 2 Unit Apartments | 0 (0.0%) | 27 (100.0%) |
| 3 or 4 Unit Apartments | 0 (0.0%) | 11 (100.0%) |
| 5 to 9 Unit Apartments | 0 (0.0%) | 0 (0.0%) |
| 10 or more Apartments | 0 (0.0%) | 0 (0.0%) |
| Mobile Home / Other | 0 (0.0%) | 0 (0.0%) |
| Total | 181 (48.0%) | 196 (52.0%) |
Housing Structures by Number of Rooms in Blue Ball
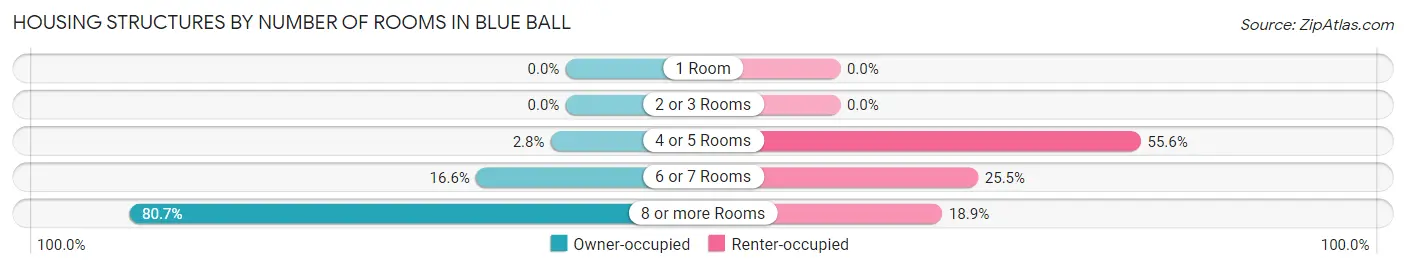
| Number of Rooms | Owner-occupied | Renter-occupied |
| 1 Room | 0 (0.0%) | 0 (0.0%) |
| 2 or 3 Rooms | 0 (0.0%) | 0 (0.0%) |
| 4 or 5 Rooms | 5 (2.8%) | 109 (55.6%) |
| 6 or 7 Rooms | 30 (16.6%) | 50 (25.5%) |
| 8 or more Rooms | 146 (80.7%) | 37 (18.9%) |
| Total | 181 (100.0%) | 196 (100.0%) |
Housing Structure by Heating Type in Blue Ball
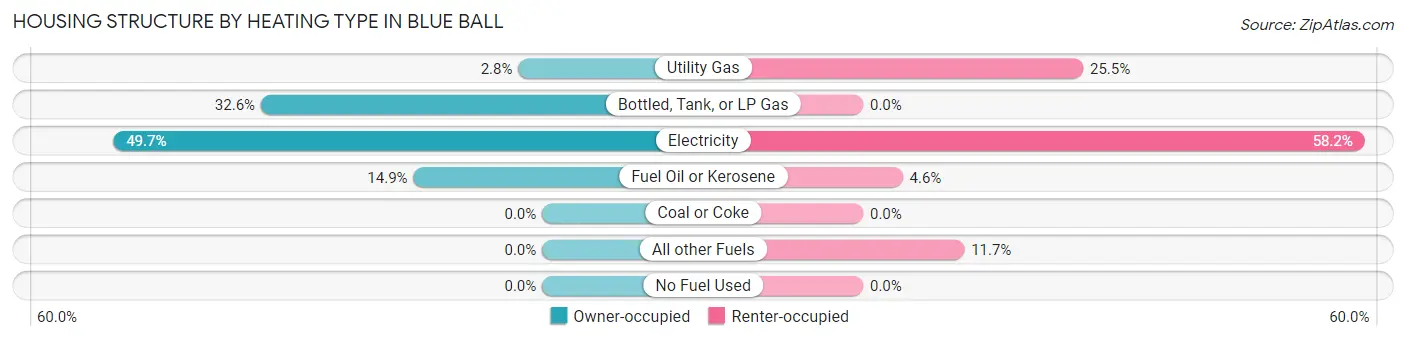
| Heating Type | Owner-occupied | Renter-occupied |
| Utility Gas | 5 (2.8%) | 50 (25.5%) |
| Bottled, Tank, or LP Gas | 59 (32.6%) | 0 (0.0%) |
| Electricity | 90 (49.7%) | 114 (58.2%) |
| Fuel Oil or Kerosene | 27 (14.9%) | 9 (4.6%) |
| Coal or Coke | 0 (0.0%) | 0 (0.0%) |
| All other Fuels | 0 (0.0%) | 23 (11.7%) |
| No Fuel Used | 0 (0.0%) | 0 (0.0%) |
| Total | 181 (100.0%) | 196 (100.0%) |
Household Vehicle Usage in Blue Ball
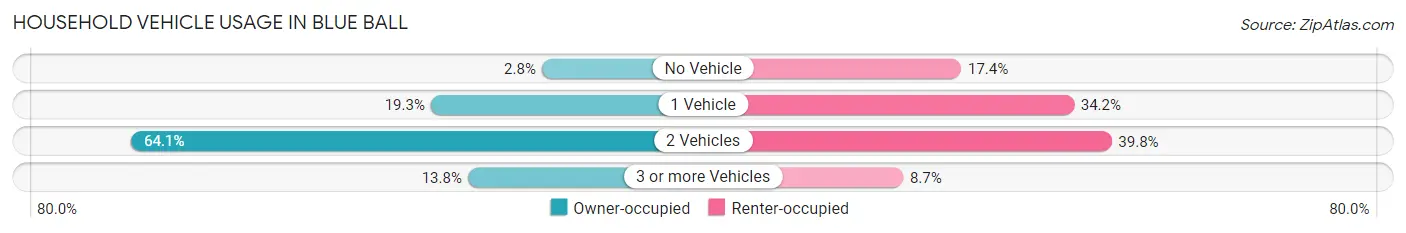
| Vehicles per Household | Owner-occupied | Renter-occupied |
| No Vehicle | 5 (2.8%) | 34 (17.3%) |
| 1 Vehicle | 35 (19.3%) | 67 (34.2%) |
| 2 Vehicles | 116 (64.1%) | 78 (39.8%) |
| 3 or more Vehicles | 25 (13.8%) | 17 (8.7%) |
| Total | 181 (100.0%) | 196 (100.0%) |
Real Estate & Mortgages in Blue Ball
Real Estate and Mortgage Overview in Blue Ball
| Characteristic | Without Mortgage | With Mortgage |
| Housing Units | 91 | 90 |
| Median Property Value | $189,300 | $278,700 |
| Median Household Income | $163,175 | $13 |
| Monthly Housing Costs | $568 | $0 |
| Real Estate Taxes | $1,840 | $0 |
Property Value by Mortgage Status in Blue Ball
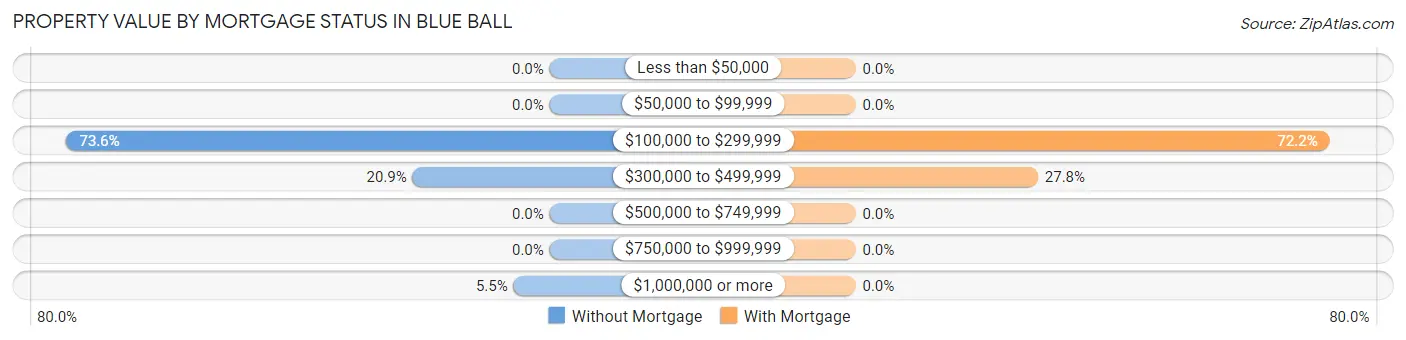
| Property Value | Without Mortgage | With Mortgage |
| Less than $50,000 | 0 (0.0%) | 0 (0.0%) |
| $50,000 to $99,999 | 0 (0.0%) | 0 (0.0%) |
| $100,000 to $299,999 | 67 (73.6%) | 65 (72.2%) |
| $300,000 to $499,999 | 19 (20.9%) | 25 (27.8%) |
| $500,000 to $749,999 | 0 (0.0%) | 0 (0.0%) |
| $750,000 to $999,999 | 0 (0.0%) | 0 (0.0%) |
| $1,000,000 or more | 5 (5.5%) | 0 (0.0%) |
| Total | 91 (100.0%) | 90 (100.0%) |
Household Income by Mortgage Status in Blue Ball
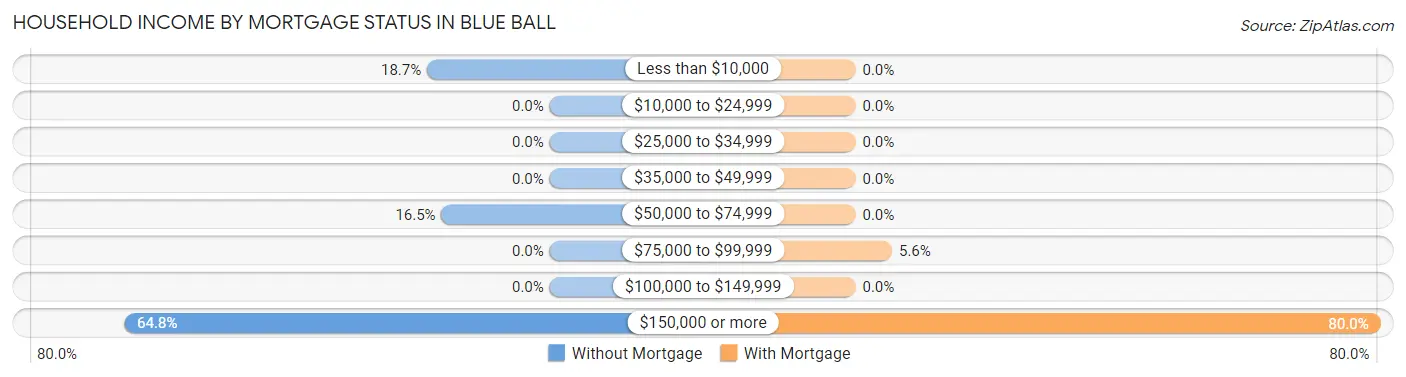
| Household Income | Without Mortgage | With Mortgage |
| Less than $10,000 | 17 (18.7%) | 0 (0.0%) |
| $10,000 to $24,999 | 0 (0.0%) | 0 (0.0%) |
| $25,000 to $34,999 | 0 (0.0%) | 0 (0.0%) |
| $35,000 to $49,999 | 0 (0.0%) | 0 (0.0%) |
| $50,000 to $74,999 | 15 (16.5%) | 0 (0.0%) |
| $75,000 to $99,999 | 0 (0.0%) | 5 (5.6%) |
| $100,000 to $149,999 | 0 (0.0%) | 0 (0.0%) |
| $150,000 or more | 59 (64.8%) | 72 (80.0%) |
| Total | 91 (100.0%) | 90 (100.0%) |
Property Value to Household Income Ratio in Blue Ball
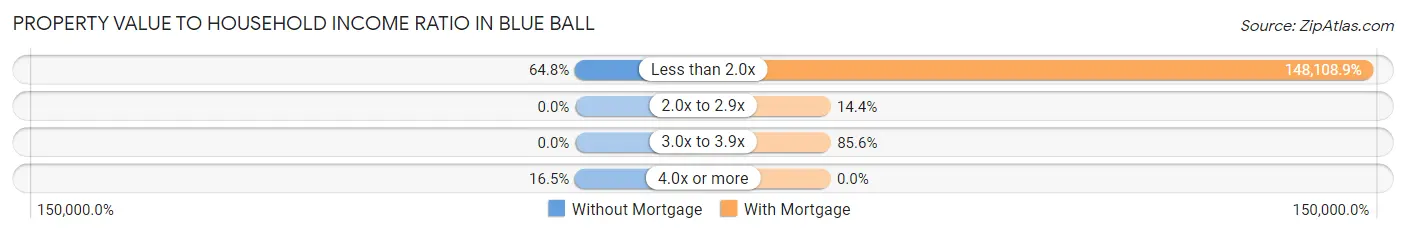
| Value-to-Income Ratio | Without Mortgage | With Mortgage |
| Less than 2.0x | 59 (64.8%) | 133,298 (148,108.9%) |
| 2.0x to 2.9x | 0 (0.0%) | 13 (14.4%) |
| 3.0x to 3.9x | 0 (0.0%) | 77 (85.6%) |
| 4.0x or more | 15 (16.5%) | 0 (0.0%) |
| Total | 91 (100.0%) | 90 (100.0%) |
Real Estate Taxes by Mortgage Status in Blue Ball
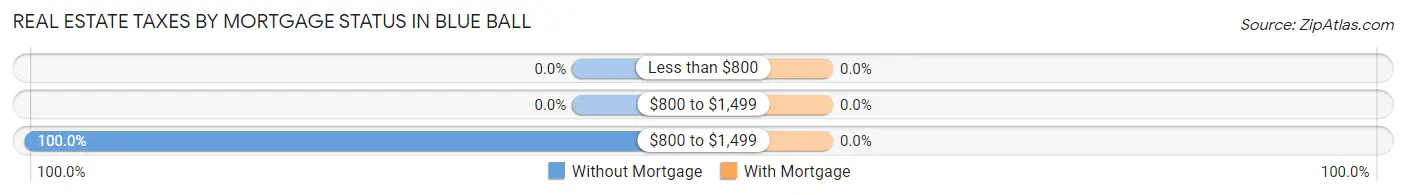
| Property Taxes | Without Mortgage | With Mortgage |
| Less than $800 | 0 (0.0%) | 0 (0.0%) |
| $800 to $1,499 | 0 (0.0%) | 0 (0.0%) |
| $800 to $1,499 | 91 (100.0%) | 0 (0.0%) |
| Total | 91 (100.0%) | 90 (100.0%) |
Health & Disability in Blue Ball
Health Insurance Coverage by Age in Blue Ball
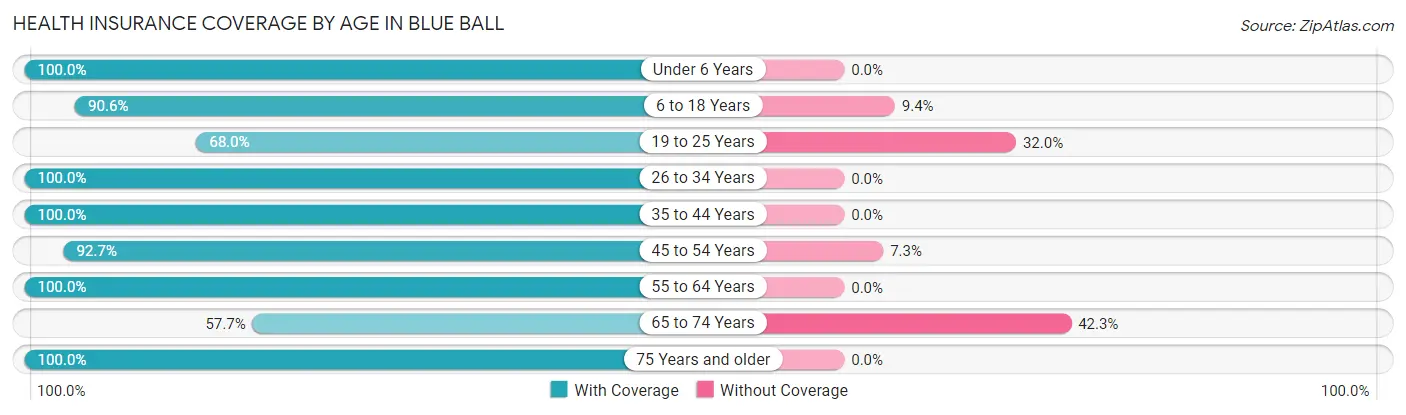
| Age Bracket | With Coverage | Without Coverage |
| Under 6 Years | 114 (100.0%) | 0 (0.0%) |
| 6 to 18 Years | 48 (90.6%) | 5 (9.4%) |
| 19 to 25 Years | 121 (68.0%) | 57 (32.0%) |
| 26 to 34 Years | 270 (100.0%) | 0 (0.0%) |
| 35 to 44 Years | 108 (100.0%) | 0 (0.0%) |
| 45 to 54 Years | 115 (92.7%) | 9 (7.3%) |
| 55 to 64 Years | 43 (100.0%) | 0 (0.0%) |
| 65 to 74 Years | 15 (57.7%) | 11 (42.3%) |
| 75 Years and older | 36 (100.0%) | 0 (0.0%) |
| Total | 870 (91.4%) | 82 (8.6%) |
Health Insurance Coverage by Citizenship Status in Blue Ball
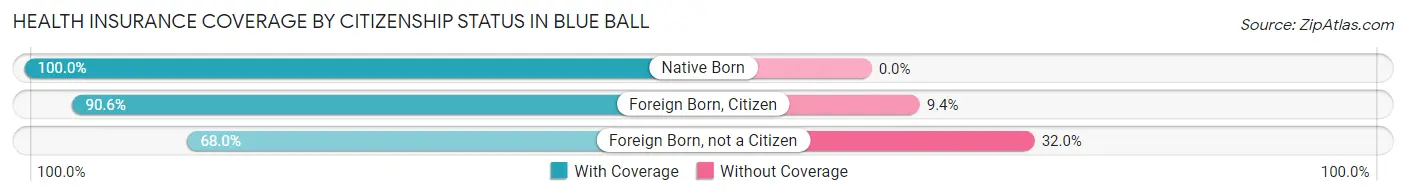
| Citizenship Status | With Coverage | Without Coverage |
| Native Born | 114 (100.0%) | 0 (0.0%) |
| Foreign Born, Citizen | 48 (90.6%) | 5 (9.4%) |
| Foreign Born, not a Citizen | 121 (68.0%) | 57 (32.0%) |
Health Insurance Coverage by Household Income in Blue Ball
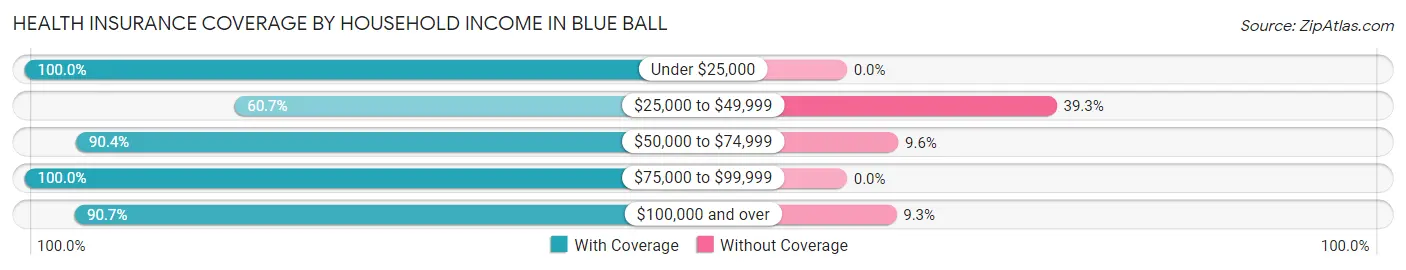
| Household Income | With Coverage | Without Coverage |
| Under $25,000 | 17 (100.0%) | 0 (0.0%) |
| $25,000 to $49,999 | 17 (60.7%) | 11 (39.3%) |
| $50,000 to $74,999 | 216 (90.4%) | 23 (9.6%) |
| $75,000 to $99,999 | 150 (100.0%) | 0 (0.0%) |
| $100,000 and over | 470 (90.7%) | 48 (9.3%) |
Public vs Private Health Insurance Coverage by Age in Blue Ball
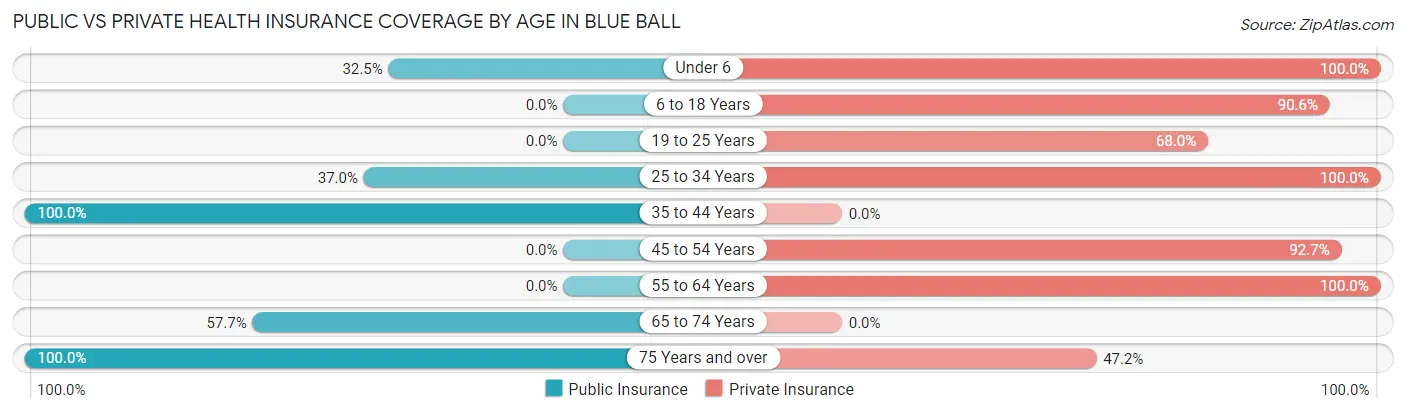
| Age Bracket | Public Insurance | Private Insurance |
| Under 6 | 37 (32.5%) | 114 (100.0%) |
| 6 to 18 Years | 0 (0.0%) | 48 (90.6%) |
| 19 to 25 Years | 0 (0.0%) | 121 (68.0%) |
| 25 to 34 Years | 100 (37.0%) | 270 (100.0%) |
| 35 to 44 Years | 108 (100.0%) | 0 (0.0%) |
| 45 to 54 Years | 0 (0.0%) | 115 (92.7%) |
| 55 to 64 Years | 0 (0.0%) | 43 (100.0%) |
| 65 to 74 Years | 15 (57.7%) | 0 (0.0%) |
| 75 Years and over | 36 (100.0%) | 17 (47.2%) |
| Total | 296 (31.1%) | 728 (76.5%) |
Disability Status by Sex by Age in Blue Ball
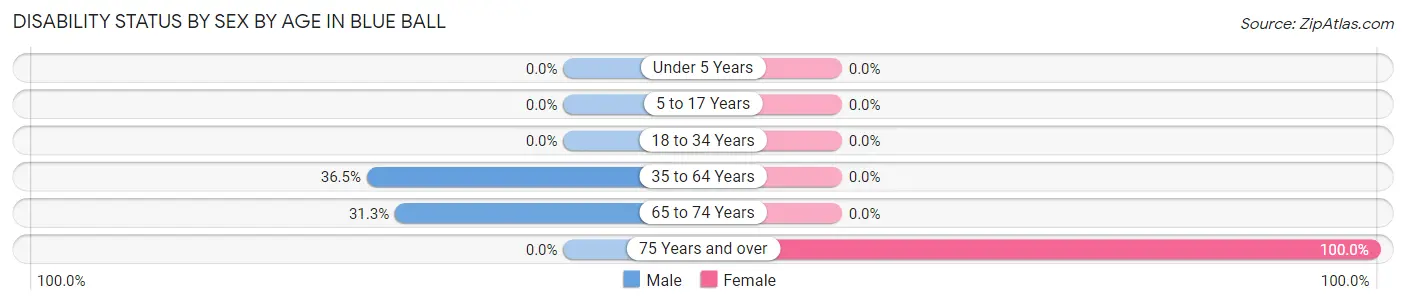
| Age Bracket | Male | Female |
| Under 5 Years | 0 (0.0%) | 0 (0.0%) |
| 5 to 17 Years | 0 (0.0%) | 0 (0.0%) |
| 18 to 34 Years | 0 (0.0%) | 0 (0.0%) |
| 35 to 64 Years | 58 (36.5%) | 0 (0.0%) |
| 65 to 74 Years | 5 (31.2%) | 0 (0.0%) |
| 75 Years and over | 0 (0.0%) | 27 (100.0%) |
Disability Class by Sex by Age in Blue Ball
Disability Class: Hearing Difficulty
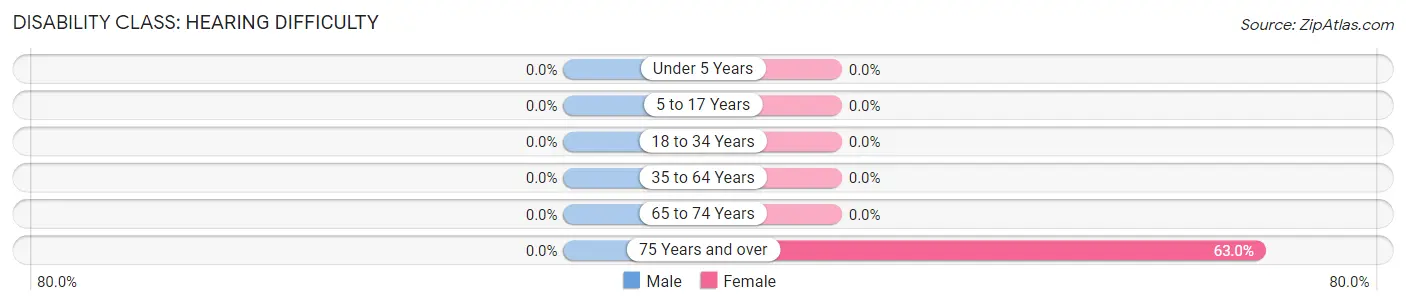
| Age Bracket | Male | Female |
| Under 5 Years | 0 (0.0%) | 0 (0.0%) |
| 5 to 17 Years | 0 (0.0%) | 0 (0.0%) |
| 18 to 34 Years | 0 (0.0%) | 0 (0.0%) |
| 35 to 64 Years | 0 (0.0%) | 0 (0.0%) |
| 65 to 74 Years | 0 (0.0%) | 0 (0.0%) |
| 75 Years and over | 0 (0.0%) | 17 (63.0%) |
Disability Class: Vision Difficulty
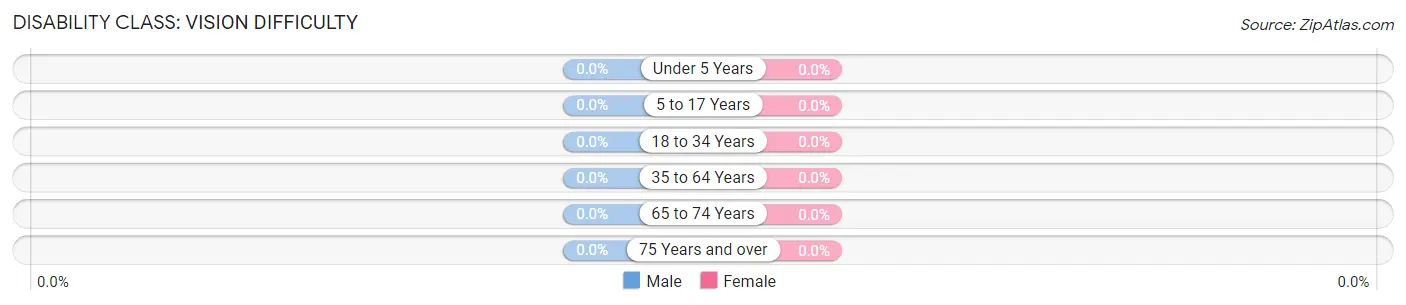
| Age Bracket | Male | Female |
| Under 5 Years | 0 (0.0%) | 0 (0.0%) |
| 5 to 17 Years | 0 (0.0%) | 0 (0.0%) |
| 18 to 34 Years | 0 (0.0%) | 0 (0.0%) |
| 35 to 64 Years | 0 (0.0%) | 0 (0.0%) |
| 65 to 74 Years | 0 (0.0%) | 0 (0.0%) |
| 75 Years and over | 0 (0.0%) | 0 (0.0%) |
Disability Class: Cognitive Difficulty
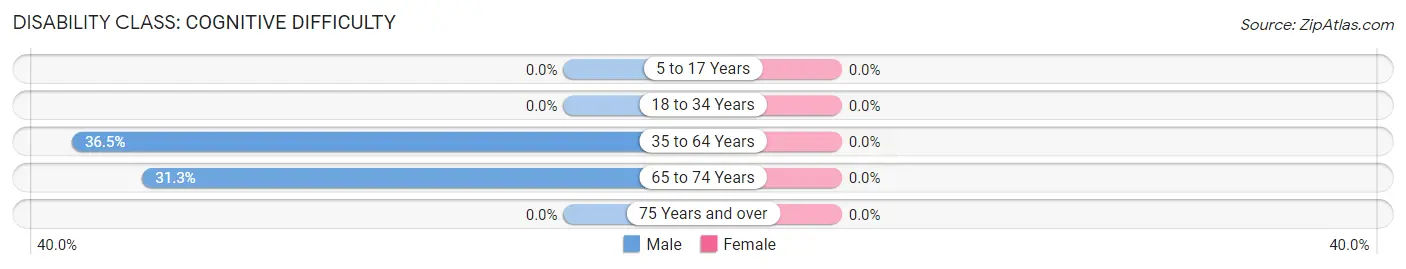
| Age Bracket | Male | Female |
| 5 to 17 Years | 0 (0.0%) | 0 (0.0%) |
| 18 to 34 Years | 0 (0.0%) | 0 (0.0%) |
| 35 to 64 Years | 58 (36.5%) | 0 (0.0%) |
| 65 to 74 Years | 5 (31.2%) | 0 (0.0%) |
| 75 Years and over | 0 (0.0%) | 0 (0.0%) |
Disability Class: Ambulatory Difficulty
| Age Bracket | Male | Female |
| 5 to 17 Years | 0 (0.0%) | 0 (0.0%) |
| 18 to 34 Years | 0 (0.0%) | 0 (0.0%) |
| 35 to 64 Years | 0 (0.0%) | 0 (0.0%) |
| 65 to 74 Years | 0 (0.0%) | 0 (0.0%) |
| 75 Years and over | 0 (0.0%) | 0 (0.0%) |
Disability Class: Self-Care Difficulty
| Age Bracket | Male | Female |
| 5 to 17 Years | 0 (0.0%) | 0 (0.0%) |
| 18 to 34 Years | 0 (0.0%) | 0 (0.0%) |
| 35 to 64 Years | 0 (0.0%) | 0 (0.0%) |
| 65 to 74 Years | 0 (0.0%) | 0 (0.0%) |
| 75 Years and over | 0 (0.0%) | 0 (0.0%) |
Technology Access in Blue Ball
Computing Device Access in Blue Ball
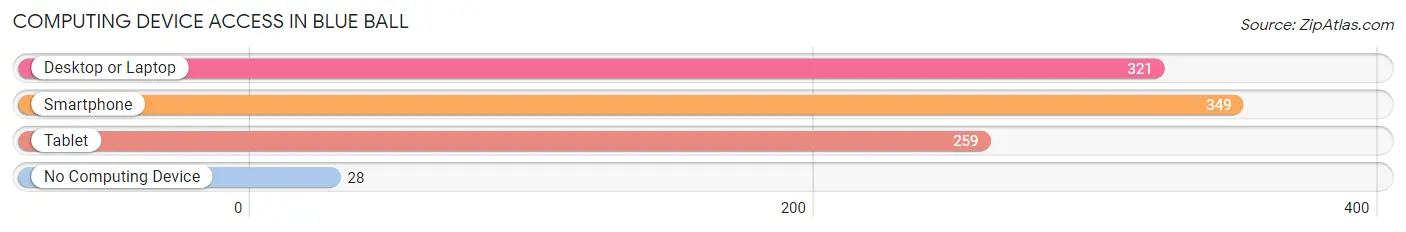
| Device Type | # Households | % Households |
| Desktop or Laptop | 321 | 85.2% |
| Smartphone | 349 | 92.6% |
| Tablet | 259 | 68.7% |
| No Computing Device | 28 | 7.4% |
| Total | 377 | 100.0% |
Internet Access in Blue Ball
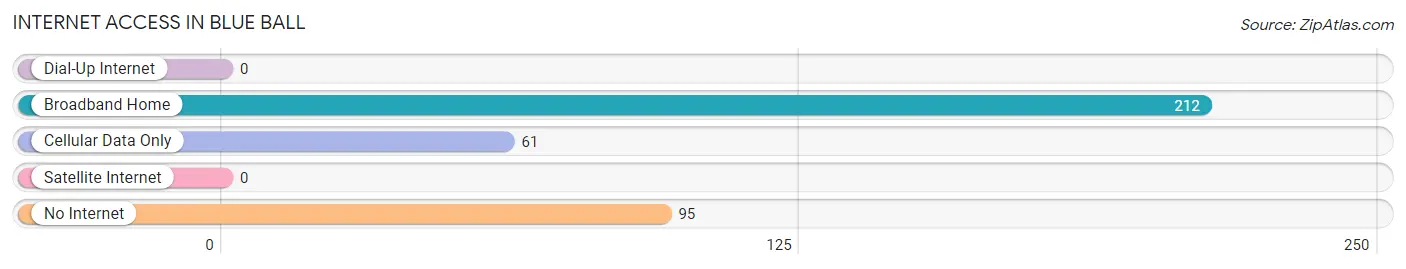
| Internet Type | # Households | % Households |
| Dial-Up Internet | 0 | 0.0% |
| Broadband Home | 212 | 56.2% |
| Cellular Data Only | 61 | 16.2% |
| Satellite Internet | 0 | 0.0% |
| No Internet | 95 | 25.2% |
| Total | 377 | 100.0% |
Blue Ball Summary
Ball, Pennsylvania is a small borough located in the southeastern corner of Lancaster County. It is situated in the heart of the Pennsylvania Dutch Country, and is surrounded by rolling hills and farmland. The borough was founded in 1845 and is named after the Blue Ball Tavern, which was located in the area. The population of Blue Ball was 1,093 as of the 2010 census.
Geography
Blue Ball is located at 40°7'17" North, 76°7'17" West (40.1214, -76.1214). It is situated in the southeastern corner of Lancaster County, and is bordered by East Earl Township to the north, West Earl Township to the east, and Brecknock Township to the south and west. The borough is located approximately 10 miles east of the city of Lancaster, and is part of the Lancaster Metropolitan Statistical Area.
The terrain of Blue Ball is mostly flat, with some rolling hills in the surrounding area. The borough is located in the Conestoga Valley, and is part of the Pennsylvania Dutch Country. The Conestoga River runs through the borough, and is a popular spot for fishing and canoeing.
History
Blue Ball was founded in 1845 and was named after the Blue Ball Tavern, which was located in the area. The tavern was a popular stop for travelers on the Philadelphia-Lancaster Turnpike. The borough was incorporated in 1851, and the first post office was established in 1853.
The borough was home to several industries in the late 19th and early 20th centuries, including a flour mill, a sawmill, a grist mill, and a brickyard. The borough also had a thriving agricultural industry, with many farms in the surrounding area.
Economy
The economy of Blue Ball is largely based on agriculture and tourism. The borough is home to several farms, which produce a variety of crops, including corn, soybeans, wheat, and hay. The borough is also home to several tourist attractions, including the Blue Ball Tavern, the Conestoga River, and the Blue Ball Museum.
The borough is also home to several small businesses, including restaurants, shops, and a variety of service-based businesses. The borough is served by the Blue Ball Post Office, and is located near several major highways, including the Pennsylvania Turnpike and Interstate 76.
Demographics
As of the 2010 census, the population of Blue Ball was 1,093. The racial makeup of the borough was 97.2% White, 0.7% African American, 0.2% Native American, 0.2% Asian, 0.2% from other races, and 1.7% from two or more races. Hispanic or Latino of any race were 1.2% of the population.
The median household income in Blue Ball was $50,938, and the median family income was $58,750. The per capita income was $22,945. About 4.2% of families and 5.3% of the population were below the poverty line, including 6.2% of those under age 18 and 4.2% of those age 65 or over.
Common Questions
What is Per Capita Income in Blue Ball?
Per Capita income in Blue Ball is $53,838.
What is the Median Family Income in Blue Ball?
Median Family Income in Blue Ball is $128,350.
What is the Median Household income in Blue Ball?
Median Household Income in Blue Ball is $102,656.
What is Income or Wage Gap in Blue Ball?
Income or Wage Gap in Blue Ball is 53.8%.
Women in Blue Ball earn 46.2 cents for every dollar earned by a man.
What is Inequality or Gini Index in Blue Ball?
Inequality or Gini Index in Blue Ball is 0.40.
What is the Total Population of Blue Ball?
Total Population of Blue Ball is 952.
What is the Total Male Population of Blue Ball?
Total Male Population of Blue Ball is 441.
What is the Total Female Population of Blue Ball?
Total Female Population of Blue Ball is 511.
What is the Ratio of Males per 100 Females in Blue Ball?
There are 86.30 Males per 100 Females in Blue Ball.
What is the Ratio of Females per 100 Males in Blue Ball?
There are 115.87 Females per 100 Males in Blue Ball.
What is the Median Population Age in Blue Ball?
Median Population Age in Blue Ball is 30.9 Years.
What is the Average Family Size in Blue Ball
Average Family Size in Blue Ball is 3.2 People.
What is the Average Household Size in Blue Ball
Average Household Size in Blue Ball is 2.5 People.
How Large is the Labor Force in Blue Ball?
There are 625 People in the Labor Forcein in Blue Ball.
What is the Percentage of People in the Labor Force in Blue Ball?
79.6% of People are in the Labor Force in Blue Ball.