Cities with the Highest Percentage of Population Employed in Administrative & Support Services in Maryland
RELATED REPORTS & OPTIONS
Administrative & Support Services
Maryland
Compare Cities
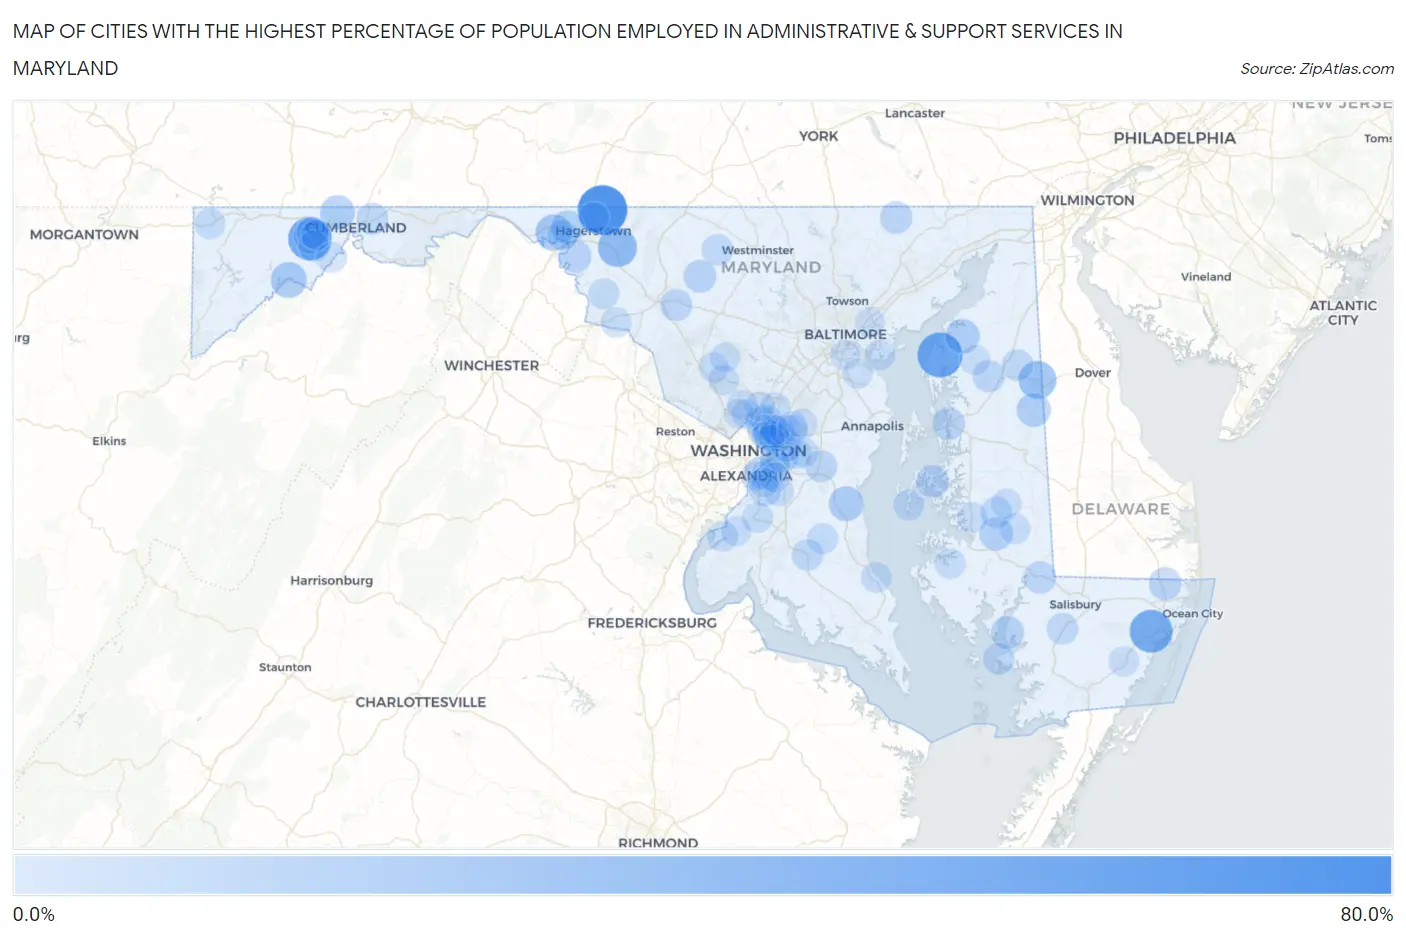
Map of Cities with the Highest Percentage of Population Employed in Administrative & Support Services in Maryland
0.0%
80.0%
Cities with the Highest Percentage of Population Employed in Administrative & Support Services in Maryland
| City | % Employed | vs State | vs National | |
| 1. | Reid | 69.4% | 4.2%(+65.2)#1 | 4.1%(+65.3)#25 |
| 2. | Georgetown | 53.6% | 4.2%(+49.3)#2 | 4.1%(+49.4)#45 |
| 3. | Klondike | 49.3% | 4.2%(+45.0)#3 | 4.1%(+45.1)#63 |
| 4. | Newark | 47.2% | 4.2%(+42.9)#4 | 4.1%(+43.0)#71 |
| 5. | Bagtown | 34.5% | 4.2%(+30.2)#5 | 4.1%(+30.3)#131 |
| 6. | Templeville | 30.6% | 4.2%(+26.3)#6 | 4.1%(+26.4)#177 |
| 7. | Charlton | 25.8% | 4.2%(+21.6)#7 | 4.1%(+21.7)#265 |
| 8. | Luke | 23.8% | 4.2%(+19.6)#8 | 4.1%(+19.7)#312 |
| 9. | Carlos | 21.6% | 4.2%(+17.4)#9 | 4.1%(+17.5)#389 |
| 10. | Owings | 21.1% | 4.2%(+16.9)#10 | 4.1%(+16.9)#404 |
| 11. | Barrelville | 20.0% | 4.2%(+15.8)#11 | 4.1%(+15.9)#440 |
| 12. | Butlertown | 19.5% | 4.2%(+15.3)#12 | 4.1%(+15.4)#459 |
| 13. | Goldsboro | 18.3% | 4.2%(+14.1)#13 | 4.1%(+14.1)#518 |
| 14. | Still Pond | 18.2% | 4.2%(+13.9)#14 | 4.1%(+14.0)#535 |
| 15. | Wilson Conococheague | 17.6% | 4.2%(+13.4)#15 | 4.1%(+13.5)#567 |
| 16. | Secretary | 17.0% | 4.2%(+12.8)#16 | 4.1%(+12.8)#610 |
| 17. | Chesapeake Landing | 16.2% | 4.2%(+12.0)#17 | 4.1%(+12.1)#670 |
| 18. | Nanticoke | 15.5% | 4.2%(+11.2)#18 | 4.1%(+11.3)#743 |
| 19. | Downsville | 15.0% | 4.2%(+10.8)#19 | 4.1%(+10.9)#788 |
| 20. | Libertytown | 14.7% | 4.2%(+10.5)#20 | 4.1%(+10.6)#832 |
| 21. | Bishopville | 14.4% | 4.2%(+10.2)#21 | 4.1%(+10.2)#887 |
| 22. | St Michaels | 14.2% | 4.2%(+9.99)#22 | 4.1%(+10.1)#914 |
| 23. | Queenstown | 14.2% | 4.2%(+9.94)#23 | 4.1%(+10.0)#917 |
| 24. | Pylesville | 13.8% | 4.2%(+9.52)#24 | 4.1%(+9.60)#983 |
| 25. | Mardela Springs | 13.2% | 4.2%(+8.99)#25 | 4.1%(+9.07)#1,077 |
| 26. | Church Hill | 12.9% | 4.2%(+8.71)#26 | 4.1%(+8.79)#1,130 |
| 27. | Langley Park | 12.7% | 4.2%(+8.46)#27 | 4.1%(+8.54)#1,179 |
| 28. | Walker Mill | 12.7% | 4.2%(+8.46)#28 | 4.1%(+8.54)#1,180 |
| 29. | North Brentwood | 12.5% | 4.2%(+8.27)#29 | 4.1%(+8.35)#1,203 |
| 30. | Bartonsville | 12.3% | 4.2%(+8.10)#30 | 4.1%(+8.18)#1,240 |
| 31. | Marlboro Meadows | 12.0% | 4.2%(+7.72)#31 | 4.1%(+7.81)#1,320 |
| 32. | Friendly | 11.9% | 4.2%(+7.66)#32 | 4.1%(+7.74)#1,335 |
| 33. | Pleasant Grove | 11.8% | 4.2%(+7.53)#33 | 4.1%(+7.61)#1,361 |
| 34. | Choptank | 11.6% | 4.2%(+7.36)#34 | 4.1%(+7.44)#1,403 |
| 35. | Chance | 11.6% | 4.2%(+7.34)#35 | 4.1%(+7.42)#1,411 |
| 36. | East Riverdale | 11.5% | 4.2%(+7.31)#36 | 4.1%(+7.40)#1,417 |
| 37. | Sudlersville | 11.3% | 4.2%(+7.08)#37 | 4.1%(+7.16)#1,464 |
| 38. | Temple Hills | 11.0% | 4.2%(+6.77)#38 | 4.1%(+6.85)#1,554 |
| 39. | Eden | 10.9% | 4.2%(+6.68)#39 | 4.1%(+6.76)#1,580 |
| 40. | Hughesville | 10.9% | 4.2%(+6.64)#40 | 4.1%(+6.72)#1,594 |
| 41. | Union Bridge | 10.8% | 4.2%(+6.60)#41 | 4.1%(+6.69)#1,608 |
| 42. | Adelphi | 10.4% | 4.2%(+6.13)#42 | 4.1%(+6.21)#1,758 |
| 43. | Coral Hills | 10.3% | 4.2%(+6.10)#43 | 4.1%(+6.18)#1,772 |
| 44. | Midlothian | 10.0% | 4.2%(+5.77)#44 | 4.1%(+5.85)#1,901 |
| 45. | Glassmanor | 9.9% | 4.2%(+5.67)#45 | 4.1%(+5.75)#1,949 |
| 46. | Brentwood | 9.7% | 4.2%(+5.51)#46 | 4.1%(+5.59)#2,021 |
| 47. | Burnt Mills | 9.5% | 4.2%(+5.24)#47 | 4.1%(+5.32)#2,134 |
| 48. | Trego Rohrersville Station | 9.5% | 4.2%(+5.23)#48 | 4.1%(+5.32)#2,137 |
| 49. | Tilghman Island | 9.4% | 4.2%(+5.16)#49 | 4.1%(+5.24)#2,173 |
| 50. | Largo | 9.3% | 4.2%(+5.10)#50 | 4.1%(+5.18)#2,198 |
| 51. | Fountainhead Orchard Hills | 9.1% | 4.2%(+4.88)#51 | 4.1%(+4.96)#2,305 |
| 52. | Pinesburg | 8.9% | 4.2%(+4.71)#52 | 4.1%(+4.79)#2,409 |
| 53. | Indian Head | 8.8% | 4.2%(+4.61)#53 | 4.1%(+4.69)#2,475 |
| 54. | Accokeek | 8.8% | 4.2%(+4.61)#54 | 4.1%(+4.69)#2,476 |
| 55. | Aquasco | 8.8% | 4.2%(+4.60)#55 | 4.1%(+4.68)#2,480 |
| 56. | Summerfield | 8.7% | 4.2%(+4.49)#56 | 4.1%(+4.57)#2,539 |
| 57. | Friendsville | 8.7% | 4.2%(+4.49)#57 | 4.1%(+4.57)#2,541 |
| 58. | Hurlock | 8.6% | 4.2%(+4.40)#58 | 4.1%(+4.48)#2,595 |
| 59. | Midland | 8.6% | 4.2%(+4.39)#59 | 4.1%(+4.47)#2,606 |
| 60. | Church Creek | 8.5% | 4.2%(+4.28)#60 | 4.1%(+4.36)#2,676 |
| 61. | Landover Hills | 8.4% | 4.2%(+4.22)#61 | 4.1%(+4.30)#2,701 |
| 62. | Long Beach | 8.3% | 4.2%(+4.07)#62 | 4.1%(+4.15)#2,809 |
| 63. | Bier | 8.2% | 4.2%(+4.01)#63 | 4.1%(+4.09)#2,838 |
| 64. | Hyattsville | 8.2% | 4.2%(+3.93)#64 | 4.1%(+4.02)#2,891 |
| 65. | Bladensburg | 8.1% | 4.2%(+3.91)#65 | 4.1%(+4.00)#2,899 |
| 66. | Woodlawn Cdp Prince George S County | 8.1% | 4.2%(+3.90)#66 | 4.1%(+3.98)#2,908 |
| 67. | Beltsville | 8.1% | 4.2%(+3.86)#67 | 4.1%(+3.94)#2,933 |
| 68. | Rosemont | 8.1% | 4.2%(+3.83)#68 | 4.1%(+3.91)#2,950 |
| 69. | Kingstown | 8.0% | 4.2%(+3.74)#69 | 4.1%(+3.82)#3,007 |
| 70. | Wheaton | 7.9% | 4.2%(+3.66)#70 | 4.1%(+3.74)#3,078 |
| 71. | Trappe | 7.9% | 4.2%(+3.63)#71 | 4.1%(+3.71)#3,103 |
| 72. | Forest Heights | 7.8% | 4.2%(+3.58)#72 | 4.1%(+3.67)#3,133 |
| 73. | Brown Station | 7.7% | 4.2%(+3.49)#73 | 4.1%(+3.57)#3,206 |
| 74. | Suitland | 7.7% | 4.2%(+3.45)#74 | 4.1%(+3.53)#3,238 |
| 75. | Redland | 7.7% | 4.2%(+3.43)#75 | 4.1%(+3.51)#3,255 |
| 76. | New Carrollton | 7.6% | 4.2%(+3.39)#76 | 4.1%(+3.47)#3,291 |
| 77. | Chillum | 7.6% | 4.2%(+3.33)#77 | 4.1%(+3.42)#3,328 |
| 78. | Seabrook | 7.5% | 4.2%(+3.23)#78 | 4.1%(+3.31)#3,433 |
| 79. | Lanham | 7.5% | 4.2%(+3.23)#79 | 4.1%(+3.31)#3,437 |
| 80. | Snow Hill | 7.5% | 4.2%(+3.23)#80 | 4.1%(+3.31)#3,438 |
| 81. | Bryans Road | 7.4% | 4.2%(+3.17)#81 | 4.1%(+3.25)#3,500 |
| 82. | Montgomery Village | 7.2% | 4.2%(+2.94)#82 | 4.1%(+3.02)#3,705 |
| 83. | Shaft | 7.1% | 4.2%(+2.91)#83 | 4.1%(+2.99)#3,747 |
| 84. | Edgemere | 7.1% | 4.2%(+2.89)#84 | 4.1%(+2.97)#3,774 |
| 85. | Preston | 7.0% | 4.2%(+2.77)#85 | 4.1%(+2.86)#3,906 |
| 86. | Riverdale Park | 7.0% | 4.2%(+2.74)#86 | 4.1%(+2.82)#3,933 |
| 87. | Clinton | 6.9% | 4.2%(+2.65)#87 | 4.1%(+2.74)#4,007 |
| 88. | Camp Springs | 6.9% | 4.2%(+2.63)#88 | 4.1%(+2.71)#4,036 |
| 89. | Crumpton | 6.8% | 4.2%(+2.52)#89 | 4.1%(+2.61)#4,143 |
| 90. | Kettering | 6.7% | 4.2%(+2.43)#90 | 4.1%(+2.52)#4,214 |
| 91. | Laytonsville | 6.6% | 4.2%(+2.38)#91 | 4.1%(+2.46)#4,303 |
| 92. | Brooklyn Park | 6.6% | 4.2%(+2.35)#92 | 4.1%(+2.44)#4,340 |
| 93. | White Oak | 6.6% | 4.2%(+2.34)#93 | 4.1%(+2.43)#4,356 |
| 94. | Glenn Dale | 6.5% | 4.2%(+2.29)#94 | 4.1%(+2.37)#4,424 |
| 95. | Chevy Chase View | 6.5% | 4.2%(+2.24)#95 | 4.1%(+2.33)#4,469 |
| 96. | Rosedale | 6.3% | 4.2%(+2.11)#96 | 4.1%(+2.19)#4,645 |
| 97. | Forest Glen | 6.1% | 4.2%(+1.92)#97 | 4.1%(+2.00)#4,907 |
| 98. | Pasadena | 6.1% | 4.2%(+1.90)#98 | 4.1%(+1.98)#4,934 |
| 99. | Oxon Hill | 6.1% | 4.2%(+1.87)#99 | 4.1%(+1.95)#4,972 |
| 100. | Colmar Manor | 6.1% | 4.2%(+1.82)#100 | 4.1%(+1.90)#5,050 |
Common Questions
What are the Top 10 Cities with the Highest Percentage of Population Employed in Administrative & Support Services in Maryland?
Top 10 Cities with the Highest Percentage of Population Employed in Administrative & Support Services in Maryland are:
#1
69.4%
#2
53.6%
#3
49.3%
#4
47.2%
#5
34.5%
#6
30.6%
#7
25.8%
#8
23.8%
#9
21.6%
#10
21.1%
What city has the Highest Percentage of Population Employed in Administrative & Support Services in Maryland?
Reid has the Highest Percentage of Population Employed in Administrative & Support Services in Maryland with 69.4%.
What is the Percentage of Population Employed in Administrative & Support Services in the State of Maryland?
Percentage of Population Employed in Administrative & Support Services in Maryland is 4.2%.
What is the Percentage of Population Employed in Administrative & Support Services in the United States?
Percentage of Population Employed in Administrative & Support Services in the United States is 4.1%.