Cities with the Highest Percentage of Population Employed in Administrative & Support Services in Arizona
RELATED REPORTS & OPTIONS
Administrative & Support Services
Arizona
Compare Cities
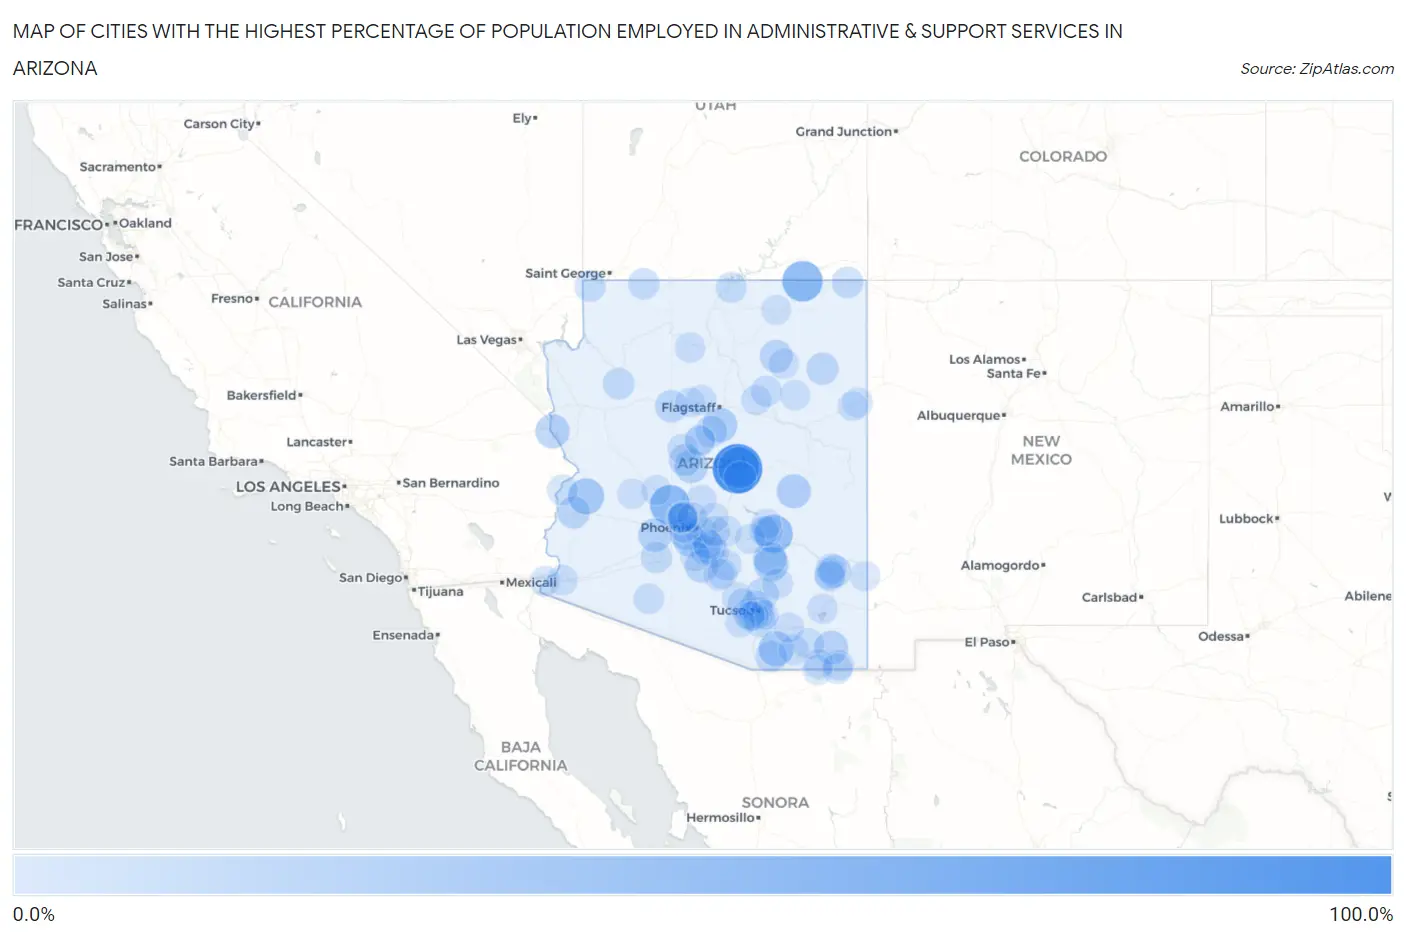
Map of Cities with the Highest Percentage of Population Employed in Administrative & Support Services in Arizona
0.0%
100.0%
Cities with the Highest Percentage of Population Employed in Administrative & Support Services in Arizona
| City | % Employed | vs State | vs National | |
| 1. | Flowing Springs | 100.0% | 5.4%(+94.6)#1 | 4.1%(+95.9)#6 |
| 2. | Freedom Acres | 59.3% | 5.4%(+53.9)#2 | 4.1%(+55.1)#33 |
| 3. | Oljato Monument Valley | 54.5% | 5.4%(+49.2)#3 | 4.1%(+50.4)#41 |
| 4. | Wittmann | 52.0% | 5.4%(+46.6)#4 | 4.1%(+47.8)#51 |
| 5. | East Globe | 43.0% | 5.4%(+37.7)#5 | 4.1%(+38.9)#85 |
| 6. | Bouse | 32.2% | 5.4%(+26.8)#6 | 4.1%(+28.0)#153 |
| 7. | Sonoita | 29.2% | 5.4%(+23.9)#7 | 4.1%(+25.1)#201 |
| 8. | Munds Park | 26.4% | 5.4%(+21.1)#8 | 4.1%(+22.3)#250 |
| 9. | Dudleyville | 26.4% | 5.4%(+21.0)#9 | 4.1%(+22.2)#252 |
| 10. | Carrizo | 24.3% | 5.4%(+19.0)#10 | 4.1%(+20.2)#304 |
| 11. | Arizona Village | 23.7% | 5.4%(+18.4)#11 | 4.1%(+19.6)#316 |
| 12. | J-Six Ranchettes | 23.7% | 5.4%(+18.4)#12 | 4.1%(+19.6)#317 |
| 13. | Spring Valley | 22.0% | 5.4%(+16.6)#13 | 4.1%(+17.8)#376 |
| 14. | Elfrida | 21.9% | 5.4%(+16.5)#14 | 4.1%(+17.7)#381 |
| 15. | Winkelman | 21.7% | 5.4%(+16.4)#15 | 4.1%(+17.6)#384 |
| 16. | Arlington | 21.2% | 5.4%(+15.8)#16 | 4.1%(+17.0)#402 |
| 17. | Gila Crossing | 20.5% | 5.4%(+15.1)#17 | 4.1%(+16.3)#424 |
| 18. | Maricopa Colony | 19.7% | 5.4%(+14.4)#18 | 4.1%(+15.6)#454 |
| 19. | Hotevilla Bacavi | 18.4% | 5.4%(+13.0)#19 | 4.1%(+14.2)#514 |
| 20. | Stanfield | 18.1% | 5.4%(+12.7)#20 | 4.1%(+13.9)#539 |
| 21. | Solomon | 16.5% | 5.4%(+11.2)#21 | 4.1%(+12.4)#647 |
| 22. | Quartzsite | 16.3% | 5.4%(+10.9)#22 | 4.1%(+12.1)#665 |
| 23. | Ash Fork | 16.0% | 5.4%(+10.6)#23 | 4.1%(+11.9)#684 |
| 24. | Steamboat | 15.5% | 5.4%(+10.1)#24 | 4.1%(+11.3)#741 |
| 25. | Mayer | 15.2% | 5.4%(+9.80)#25 | 4.1%(+11.0)#775 |
| 26. | Round Valley | 14.4% | 5.4%(+9.05)#26 | 4.1%(+10.3)#882 |
| 27. | Stotonic Village | 14.3% | 5.4%(+8.93)#27 | 4.1%(+10.1)#899 |
| 28. | Catalina | 13.9% | 5.4%(+8.54)#28 | 4.1%(+9.74)#959 |
| 29. | Flowing Wells | 13.6% | 5.4%(+8.27)#29 | 4.1%(+9.47)#1,013 |
| 30. | Patagonia | 13.3% | 5.4%(+7.94)#30 | 4.1%(+9.14)#1,066 |
| 31. | Sedona | 12.8% | 5.4%(+7.48)#31 | 4.1%(+8.69)#1,147 |
| 32. | Peach Springs | 12.6% | 5.4%(+7.27)#32 | 4.1%(+8.47)#1,189 |
| 33. | Red Mesa | 12.6% | 5.4%(+7.21)#33 | 4.1%(+8.42)#1,196 |
| 34. | Gila Bend | 12.2% | 5.4%(+6.85)#34 | 4.1%(+8.06)#1,267 |
| 35. | Guadalupe | 12.1% | 5.4%(+6.77)#35 | 4.1%(+7.97)#1,281 |
| 36. | Summit | 12.1% | 5.4%(+6.72)#36 | 4.1%(+7.92)#1,296 |
| 37. | South Tucson | 11.1% | 5.4%(+5.79)#37 | 4.1%(+7.00)#1,504 |
| 38. | Centennial Park | 11.1% | 5.4%(+5.74)#38 | 4.1%(+6.94)#1,529 |
| 39. | Tolleson | 11.0% | 5.4%(+5.67)#39 | 4.1%(+6.87)#1,547 |
| 40. | Cactus Flats | 10.8% | 5.4%(+5.49)#40 | 4.1%(+6.70)#1,603 |
| 41. | Tolani Lake | 10.7% | 5.4%(+5.30)#41 | 4.1%(+6.50)#1,649 |
| 42. | Beaver Dam | 10.1% | 5.4%(+4.77)#42 | 4.1%(+5.97)#1,850 |
| 43. | Lechee | 9.4% | 5.4%(+4.06)#43 | 4.1%(+5.27)#2,155 |
| 44. | Arizona City | 9.3% | 5.4%(+3.92)#44 | 4.1%(+5.12)#2,230 |
| 45. | Poston | 9.2% | 5.4%(+3.88)#45 | 4.1%(+5.08)#2,248 |
| 46. | Coolidge | 8.9% | 5.4%(+3.59)#46 | 4.1%(+4.80)#2,405 |
| 47. | Avra Valley | 8.6% | 5.4%(+3.29)#47 | 4.1%(+4.50)#2,589 |
| 48. | Tombstone | 8.6% | 5.4%(+3.29)#48 | 4.1%(+4.49)#2,590 |
| 49. | Tucson Estates | 8.6% | 5.4%(+3.28)#49 | 4.1%(+4.48)#2,594 |
| 50. | Sacaton | 8.5% | 5.4%(+3.13)#50 | 4.1%(+4.34)#2,689 |
| 51. | San Manuel | 8.2% | 5.4%(+2.86)#51 | 4.1%(+4.07)#2,863 |
| 52. | El Mirage | 8.0% | 5.4%(+2.68)#52 | 4.1%(+3.88)#2,971 |
| 53. | Ajo | 7.9% | 5.4%(+2.54)#53 | 4.1%(+3.74)#3,068 |
| 54. | Apache Junction | 7.9% | 5.4%(+2.51)#54 | 4.1%(+3.71)#3,106 |
| 55. | Douglas | 7.8% | 5.4%(+2.45)#55 | 4.1%(+3.66)#3,139 |
| 56. | Central Heights Midland City | 7.7% | 5.4%(+2.32)#56 | 4.1%(+3.52)#3,247 |
| 57. | Fortuna Foothills | 7.6% | 5.4%(+2.28)#57 | 4.1%(+3.48)#3,287 |
| 58. | Shongopovi | 7.6% | 5.4%(+2.27)#58 | 4.1%(+3.48)#3,289 |
| 59. | Safford | 7.6% | 5.4%(+2.23)#59 | 4.1%(+3.43)#3,317 |
| 60. | Grand Canyon Village | 7.6% | 5.4%(+2.21)#60 | 4.1%(+3.41)#3,331 |
| 61. | Youngtown | 7.5% | 5.4%(+2.15)#61 | 4.1%(+3.36)#3,385 |
| 62. | Aguila | 7.5% | 5.4%(+2.13)#62 | 4.1%(+3.33)#3,414 |
| 63. | Swift Trail Junction | 7.4% | 5.4%(+2.07)#63 | 4.1%(+3.27)#3,478 |
| 64. | Leupp | 7.4% | 5.4%(+2.03)#64 | 4.1%(+3.23)#3,516 |
| 65. | Picture Rocks | 7.4% | 5.4%(+2.01)#65 | 4.1%(+3.22)#3,529 |
| 66. | Cave Creek | 7.3% | 5.4%(+1.93)#66 | 4.1%(+3.13)#3,609 |
| 67. | Casa Blanca | 7.3% | 5.4%(+1.90)#67 | 4.1%(+3.11)#3,621 |
| 68. | Huachuca City | 7.1% | 5.4%(+1.70)#68 | 4.1%(+2.90)#3,851 |
| 69. | Houck | 7.0% | 5.4%(+1.67)#69 | 4.1%(+2.87)#3,888 |
| 70. | Cottonwood | 7.0% | 5.4%(+1.66)#70 | 4.1%(+2.87)#3,896 |
| 71. | Willcox | 6.9% | 5.4%(+1.55)#71 | 4.1%(+2.76)#3,982 |
| 72. | Pirtleville | 6.9% | 5.4%(+1.55)#72 | 4.1%(+2.75)#3,984 |
| 73. | Dilkon | 6.9% | 5.4%(+1.51)#73 | 4.1%(+2.71)#4,029 |
| 74. | Mescal | 6.8% | 5.4%(+1.44)#74 | 4.1%(+2.65)#4,098 |
| 75. | Phoenix | 6.6% | 5.4%(+1.26)#75 | 4.1%(+2.47)#4,293 |
| 76. | Sun City | 6.6% | 5.4%(+1.26)#76 | 4.1%(+2.46)#4,304 |
| 77. | Prescott Valley | 6.6% | 5.4%(+1.25)#77 | 4.1%(+2.45)#4,316 |
| 78. | Wall Lane | 6.5% | 5.4%(+1.13)#78 | 4.1%(+2.33)#4,464 |
| 79. | Parks | 6.5% | 5.4%(+1.11)#79 | 4.1%(+2.31)#4,480 |
| 80. | Glendale | 6.4% | 5.4%(+1.09)#80 | 4.1%(+2.29)#4,513 |
| 81. | Tucson | 6.3% | 5.4%(+0.962)#81 | 4.1%(+2.17)#4,673 |
| 82. | Mesa | 6.2% | 5.4%(+0.842)#82 | 4.1%(+2.05)#4,843 |
| 83. | Drexel Heights | 6.2% | 5.4%(+0.836)#83 | 4.1%(+2.04)#4,850 |
| 84. | Ak Chin Village | 6.2% | 5.4%(+0.800)#84 | 4.1%(+2.00)#4,899 |
| 85. | Fountain Hills | 6.1% | 5.4%(+0.732)#85 | 4.1%(+1.94)#4,997 |
| 86. | Wheatfields | 6.1% | 5.4%(+0.729)#86 | 4.1%(+1.93)#5,002 |
| 87. | Bisbee | 6.1% | 5.4%(+0.726)#87 | 4.1%(+1.93)#5,006 |
| 88. | Superior | 6.0% | 5.4%(+0.679)#88 | 4.1%(+1.88)#5,088 |
| 89. | Wickenburg | 6.0% | 5.4%(+0.672)#89 | 4.1%(+1.88)#5,099 |
| 90. | Sun Lakes | 6.0% | 5.4%(+0.606)#90 | 4.1%(+1.81)#5,210 |
| 91. | Duncan | 5.7% | 5.4%(+0.360)#91 | 4.1%(+1.56)#5,594 |
| 92. | Valencia West | 5.6% | 5.4%(+0.255)#92 | 4.1%(+1.46)#5,781 |
| 93. | Three Points | 5.6% | 5.4%(+0.221)#93 | 4.1%(+1.43)#5,844 |
| 94. | Naco | 5.6% | 5.4%(+0.215)#94 | 4.1%(+1.42)#5,856 |
| 95. | Eloy | 5.5% | 5.4%(+0.188)#95 | 4.1%(+1.39)#5,911 |
| 96. | Sanders | 5.5% | 5.4%(+0.154)#96 | 4.1%(+1.36)#5,976 |
| 97. | Williams | 5.5% | 5.4%(+0.143)#97 | 4.1%(+1.35)#6,008 |
| 98. | Shonto | 5.5% | 5.4%(+0.125)#98 | 4.1%(+1.33)#6,047 |
| 99. | Miami | 5.5% | 5.4%(+0.108)#99 | 4.1%(+1.31)#6,072 |
| 100. | Verde Village | 5.4% | 5.4%(+0.081)#100 | 4.1%(+1.29)#6,122 |
Common Questions
What are the Top 10 Cities with the Highest Percentage of Population Employed in Administrative & Support Services in Arizona?
Top 10 Cities with the Highest Percentage of Population Employed in Administrative & Support Services in Arizona are:
#1
100.0%
#2
59.3%
#3
54.5%
#4
52.0%
#5
43.0%
#6
32.2%
#7
29.2%
#8
26.4%
#9
26.4%
#10
24.3%
What city has the Highest Percentage of Population Employed in Administrative & Support Services in Arizona?
Flowing Springs has the Highest Percentage of Population Employed in Administrative & Support Services in Arizona with 100.0%.
What is the Percentage of Population Employed in Administrative & Support Services in the State of Arizona?
Percentage of Population Employed in Administrative & Support Services in Arizona is 5.4%.
What is the Percentage of Population Employed in Administrative & Support Services in the United States?
Percentage of Population Employed in Administrative & Support Services in the United States is 4.1%.