Briar Creek borough, PA Map & Demographics
Briar Creek borough Overview
$17,561
PER CAPITA INCOME
$41,000
AVG FAMILY INCOME
$34,886
AVG HOUSEHOLD INCOME
5.2%
WAGE / INCOME GAP [ % ]
94.8¢/ $1
WAGE / INCOME GAP [ $ ]
0.46
INEQUALITY / GINI INDEX
938
TOTAL POPULATION
398
MALE POPULATION
540
FEMALE POPULATION
73.70
MALES / 100 FEMALES
135.68
FEMALES / 100 MALES
35.7
MEDIAN AGE
3.4
AVG FAMILY SIZE
3.2
AVG HOUSEHOLD SIZE
372
LABOR FORCE [ PEOPLE ]
56.7%
PERCENT IN LABOR FORCE
33.9%
UNEMPLOYMENT RATE
Income in Briar Creek borough
Income Overview in Briar Creek borough
Per Capita Income in Briar Creek borough is $17,561, while median incomes of families and households are $41,000 and $34,886 respectively.
| Characteristic | Number | Measure |
| Per Capita Income | 938 | $17,561 |
| Median Family Income | 162 | $41,000 |
| Mean Family Income | 162 | $62,283 |
| Median Household Income | 286 | $34,886 |
| Mean Household Income | 286 | $53,221 |
| Income Deficit | 162 | $0 |
| Wage / Income Gap (%) | 938 | 5.19% |
| Wage / Income Gap ($) | 938 | 94.81¢ per $1 |
| Gini / Inequality Index | 938 | 0.46 |
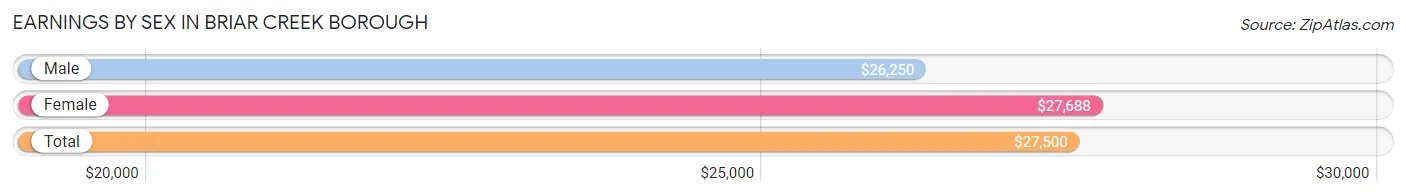
Earnings by Sex in Briar Creek borough
Average Earnings in Briar Creek borough are $27,500, $26,250 for men and $27,688 for women, a difference of 5.2%.
| Sex | Number | Average Earnings |
| Male | 147 (46.5%) | $26,250 |
| Female | 169 (53.5%) | $27,688 |
| Total | 316 (100.0%) | $27,500 |
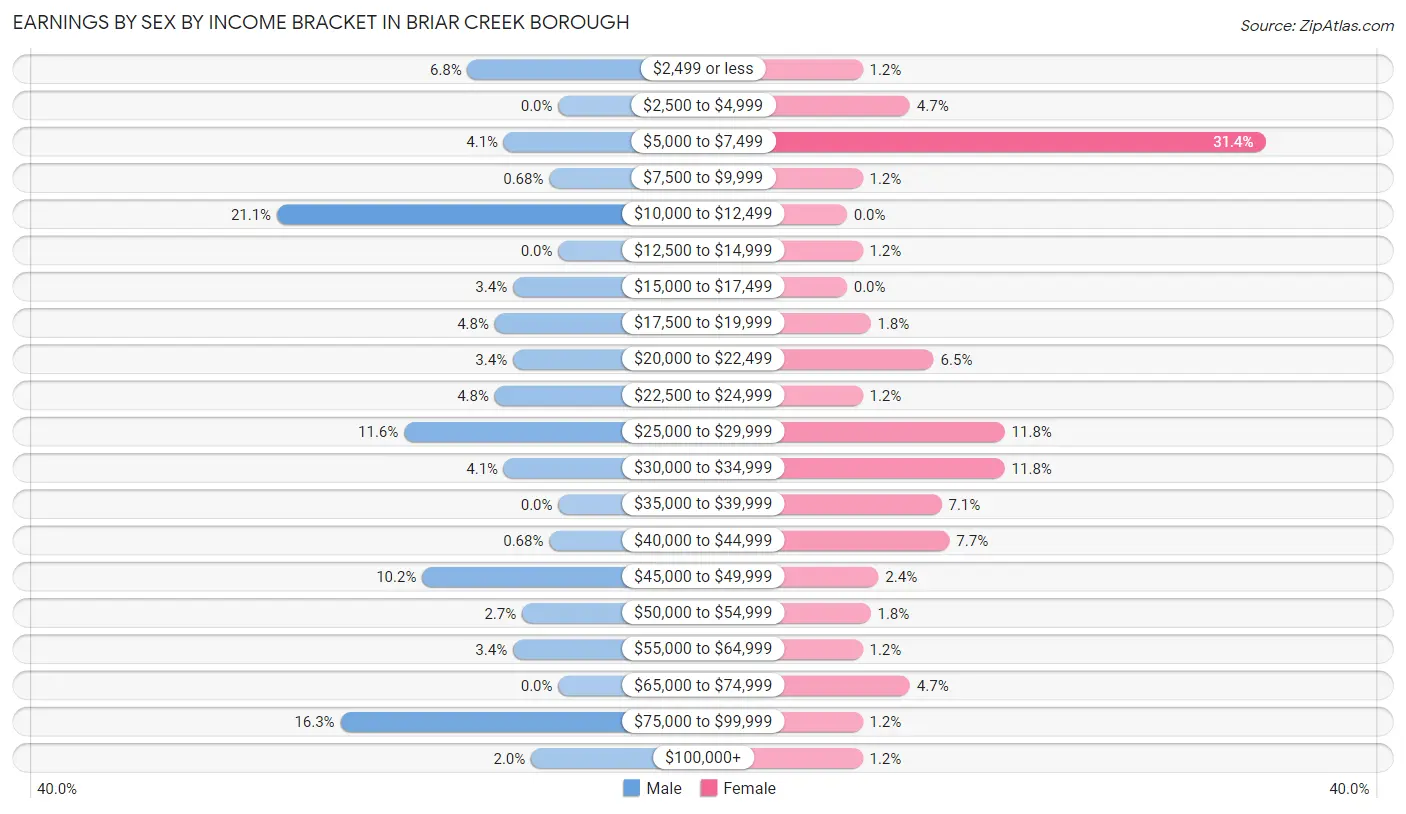
Earnings by Sex by Income Bracket in Briar Creek borough
The most common earnings brackets in Briar Creek borough are $10,000 to $12,499 for men (31 | 21.1%) and $5,000 to $7,499 for women (53 | 31.4%).
| Income | Male | Female |
| $2,499 or less | 10 (6.8%) | 2 (1.2%) |
| $2,500 to $4,999 | 0 (0.0%) | 8 (4.7%) |
| $5,000 to $7,499 | 6 (4.1%) | 53 (31.4%) |
| $7,500 to $9,999 | 1 (0.7%) | 2 (1.2%) |
| $10,000 to $12,499 | 31 (21.1%) | 0 (0.0%) |
| $12,500 to $14,999 | 0 (0.0%) | 2 (1.2%) |
| $15,000 to $17,499 | 5 (3.4%) | 0 (0.0%) |
| $17,500 to $19,999 | 7 (4.8%) | 3 (1.8%) |
| $20,000 to $22,499 | 5 (3.4%) | 11 (6.5%) |
| $22,500 to $24,999 | 7 (4.8%) | 2 (1.2%) |
| $25,000 to $29,999 | 17 (11.6%) | 20 (11.8%) |
| $30,000 to $34,999 | 6 (4.1%) | 20 (11.8%) |
| $35,000 to $39,999 | 0 (0.0%) | 12 (7.1%) |
| $40,000 to $44,999 | 1 (0.7%) | 13 (7.7%) |
| $45,000 to $49,999 | 15 (10.2%) | 4 (2.4%) |
| $50,000 to $54,999 | 4 (2.7%) | 3 (1.8%) |
| $55,000 to $64,999 | 5 (3.4%) | 2 (1.2%) |
| $65,000 to $74,999 | 0 (0.0%) | 8 (4.7%) |
| $75,000 to $99,999 | 24 (16.3%) | 2 (1.2%) |
| $100,000+ | 3 (2.0%) | 2 (1.2%) |
| Total | 147 (100.0%) | 169 (100.0%) |
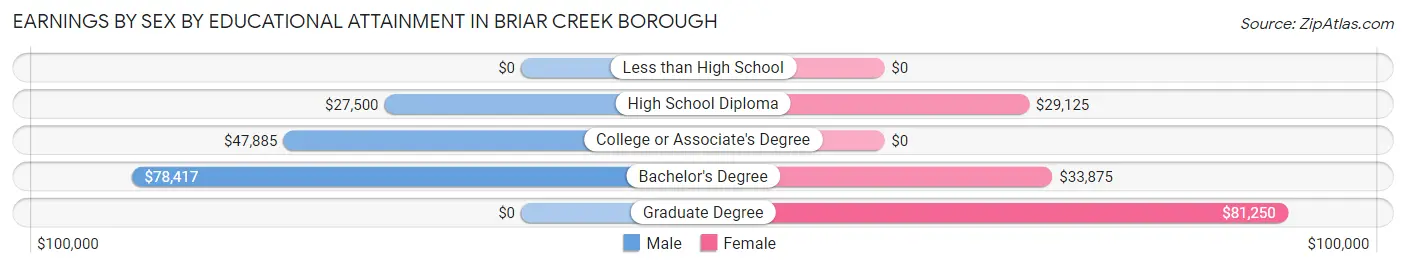
Earnings by Sex by Educational Attainment in Briar Creek borough
Average earnings in Briar Creek borough are $28,571 for men and $27,813 for women, a difference of 2.6%. Men with an educational attainment of bachelor's degree enjoy the highest average annual earnings of $78,417, while those with high school diploma education earn the least with $27,500. Women with an educational attainment of graduate degree earn the most with the average annual earnings of $81,250, while those with high school diploma education have the smallest earnings of $29,125.
| Educational Attainment | Male Income | Female Income |
| Less than High School | - | - |
| High School Diploma | $27,500 | $29,125 |
| College or Associate's Degree | $47,885 | $0 |
| Bachelor's Degree | $78,417 | $33,875 |
| Graduate Degree | - | - |
| Total | $28,571 | $27,813 |
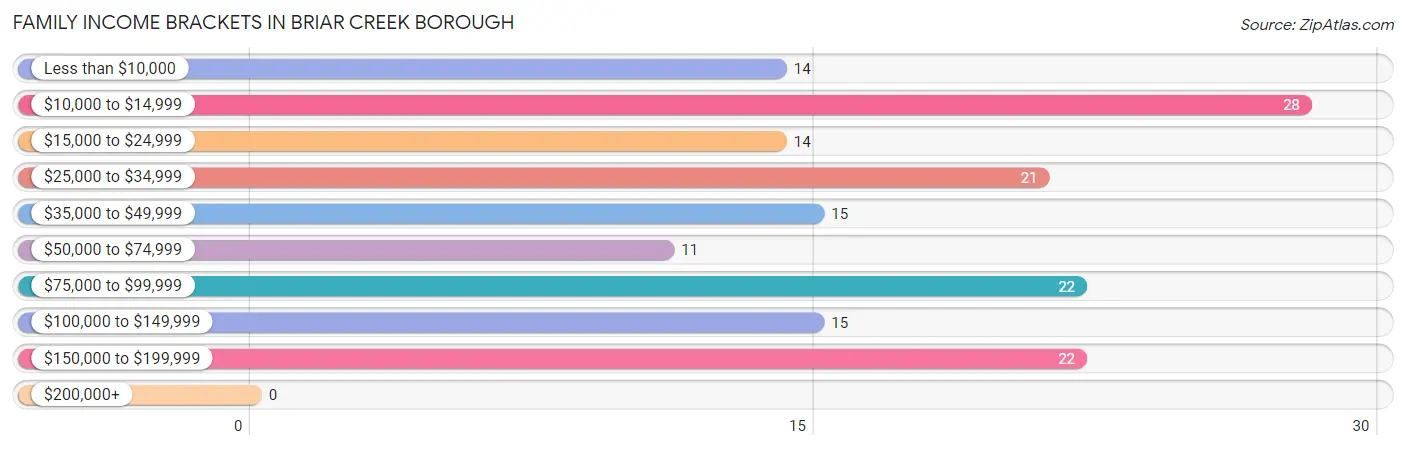
Family Income in Briar Creek borough
Family Income Brackets in Briar Creek borough
According to the Briar Creek borough family income data, there are 28 families falling into the $10,000 to $14,999 income range, which is the most common income bracket and makes up 17.3% of all families.
| Income Bracket | # Families | % Families |
| Less than $10,000 | 14 | 8.6% |
| $10,000 to $14,999 | 28 | 17.3% |
| $15,000 to $24,999 | 14 | 8.6% |
| $25,000 to $34,999 | 21 | 13.0% |
| $35,000 to $49,999 | 15 | 9.3% |
| $50,000 to $74,999 | 11 | 6.8% |
| $75,000 to $99,999 | 22 | 13.6% |
| $100,000 to $149,999 | 15 | 9.3% |
| $150,000 to $199,999 | 22 | 13.6% |
| $200,000+ | 0 | 0.0% |
Family Income by Famaliy Size in Briar Creek borough
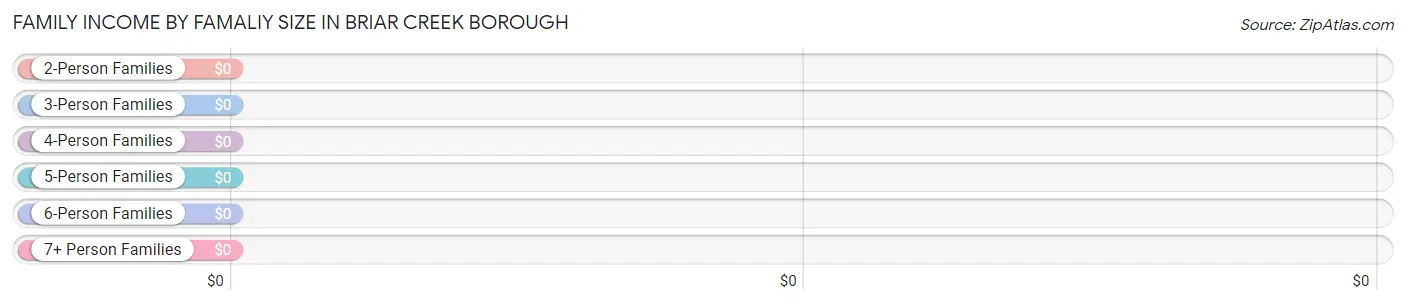
| Income Bracket | # Families | Median Income |
| 2-Person Families | 67 (41.4%) | $0 |
| 3-Person Families | 26 (16.1%) | $0 |
| 4-Person Families | 27 (16.7%) | $0 |
| 5-Person Families | 26 (16.1%) | $0 |
| 6-Person Families | 16 (9.9%) | $0 |
| 7+ Person Families | 0 (0.0%) | $0 |
| Total | 162 (100.0%) | $41,000 |
Family Income by Number of Earners in Briar Creek borough
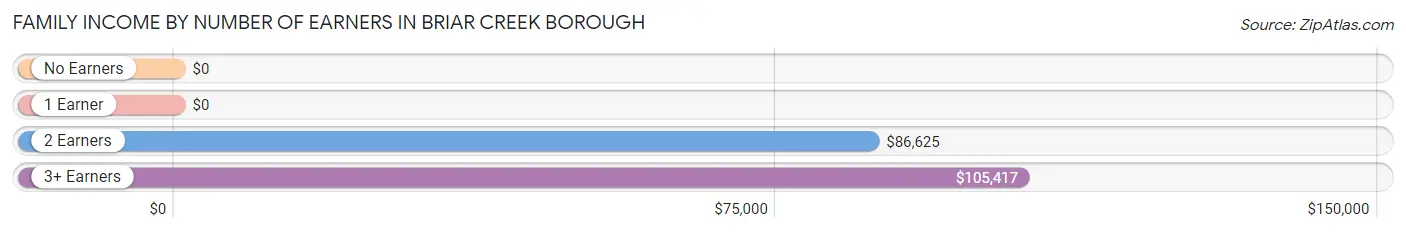
| Number of Earners | # Families | Median Income |
| No Earners | 31 (19.1%) | $0 |
| 1 Earner | 89 (54.9%) | $0 |
| 2 Earners | 33 (20.4%) | $86,625 |
| 3+ Earners | 9 (5.6%) | $105,417 |
| Total | 162 (100.0%) | $41,000 |
Household Income in Briar Creek borough
Household Income Brackets in Briar Creek borough
With 52 households falling in the category, the $50,000 to $74,999 income range is the most frequent in Briar Creek borough, accounting for 18.2% of all households.
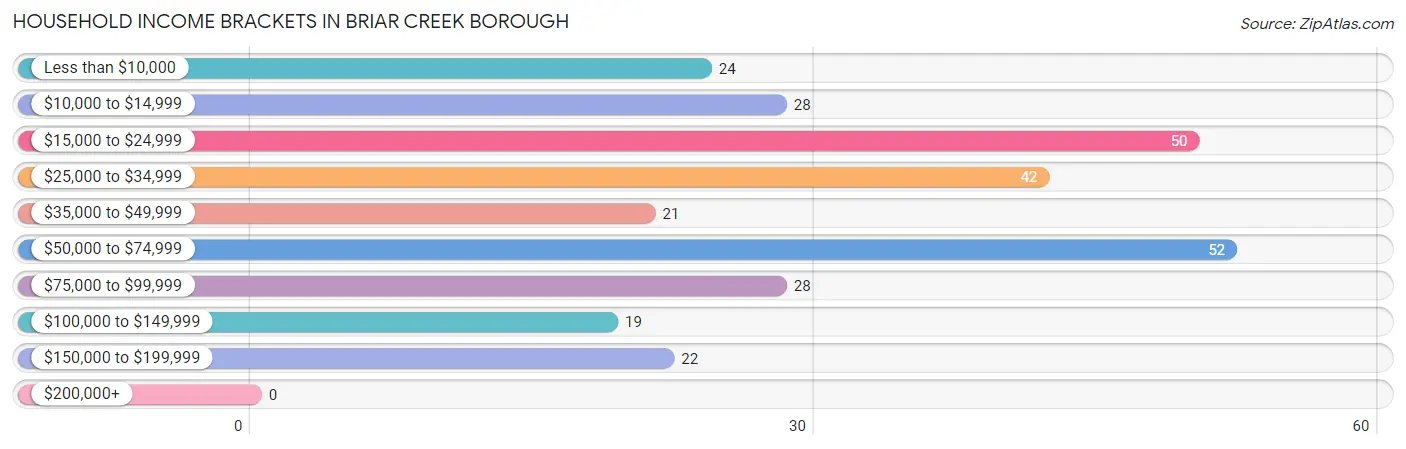
| Income Bracket | # Households | % Households |
| Less than $10,000 | 24 | 8.4% |
| $10,000 to $14,999 | 28 | 9.8% |
| $15,000 to $24,999 | 50 | 17.5% |
| $25,000 to $34,999 | 42 | 14.7% |
| $35,000 to $49,999 | 21 | 7.3% |
| $50,000 to $74,999 | 52 | 18.2% |
| $75,000 to $99,999 | 28 | 9.8% |
| $100,000 to $149,999 | 19 | 6.6% |
| $150,000 to $199,999 | 22 | 7.7% |
| $200,000+ | 0 | 0.0% |
Household Income by Householder Age in Briar Creek borough
The median household income in Briar Creek borough is $34,886, with the highest median household income of $54,643 found in the 25 to 44 years age bracket for the primary householder. A total of 94 households (32.9%) fall into this category. Meanwhile, the 15 to 24 years age bracket for the primary householder has the lowest median household income of $0, with 2 households (0.7%) in this group.
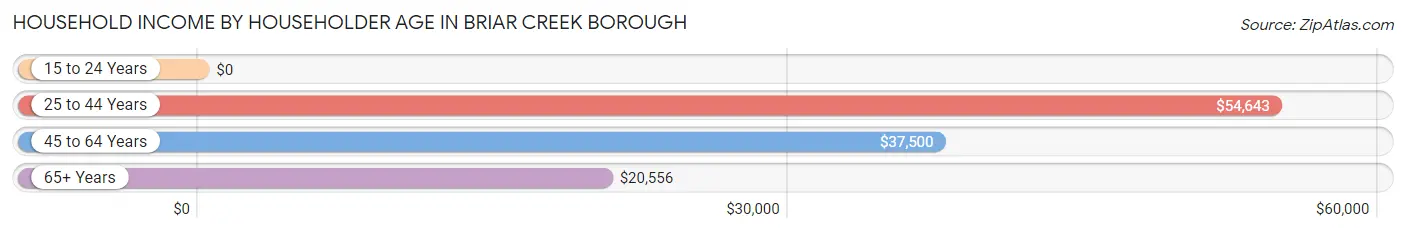
| Income Bracket | # Households | Median Income |
| 15 to 24 Years | 2 (0.7%) | $0 |
| 25 to 44 Years | 94 (32.9%) | $54,643 |
| 45 to 64 Years | 74 (25.9%) | $37,500 |
| 65+ Years | 116 (40.6%) | $20,556 |
| Total | 286 (100.0%) | $34,886 |
Poverty in Briar Creek borough
Income Below Poverty by Sex and Age in Briar Creek borough
With 39.0% poverty level for males and 34.4% for females among the residents of Briar Creek borough, under 5 year old males and 18 to 24 year old females are the most vulnerable to poverty, with 18 males (100.0%) and 65 females (85.5%) in their respective age groups living below the poverty level.
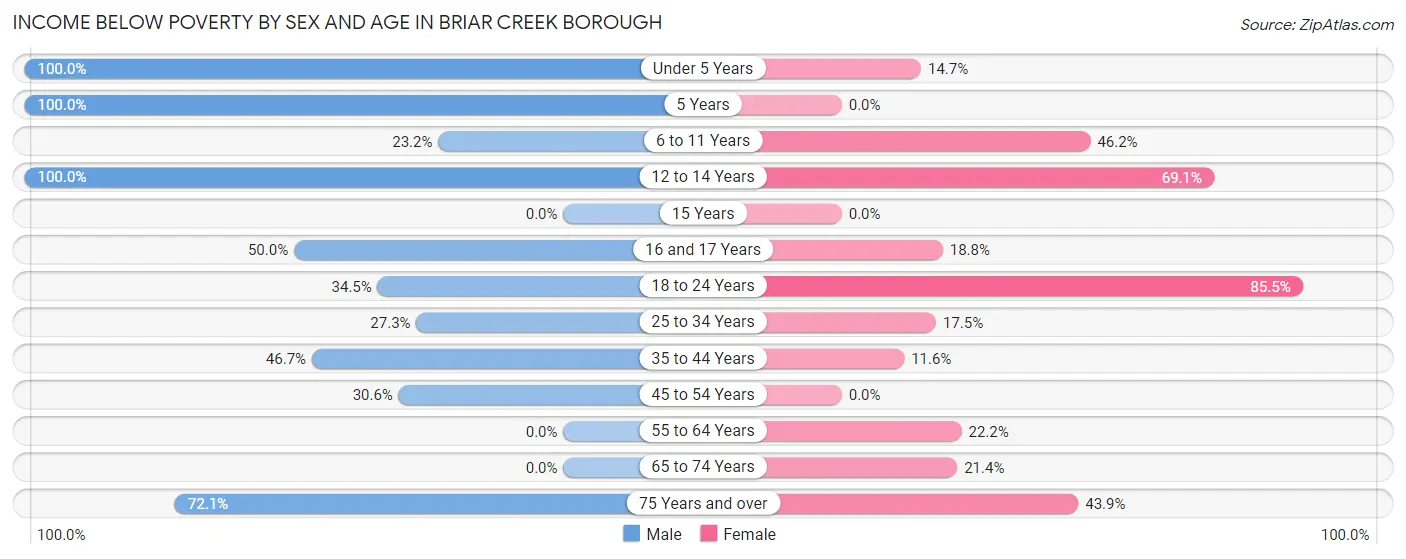
| Age Bracket | Male | Female |
| Under 5 Years | 18 (100.0%) | 5 (14.7%) |
| 5 Years | 3 (100.0%) | 0 (0.0%) |
| 6 to 11 Years | 13 (23.2%) | 12 (46.2%) |
| 12 to 14 Years | 12 (100.0%) | 29 (69.1%) |
| 15 Years | 0 (0.0%) | 0 (0.0%) |
| 16 and 17 Years | 3 (50.0%) | 3 (18.8%) |
| 18 to 24 Years | 10 (34.5%) | 65 (85.5%) |
| 25 to 34 Years | 3 (27.3%) | 7 (17.5%) |
| 35 to 44 Years | 42 (46.7%) | 11 (11.6%) |
| 45 to 54 Years | 11 (30.6%) | 0 (0.0%) |
| 55 to 64 Years | 0 (0.0%) | 10 (22.2%) |
| 65 to 74 Years | 0 (0.0%) | 9 (21.4%) |
| 75 Years and over | 31 (72.1%) | 18 (43.9%) |
| Total | 146 (39.0%) | 169 (34.4%) |
Income Above Poverty by Sex and Age in Briar Creek borough
According to the poverty statistics in Briar Creek borough, males aged 15 years and females aged 15 years are the age groups that are most secure financially, with 100.0% of males and 100.0% of females in these age groups living above the poverty line.
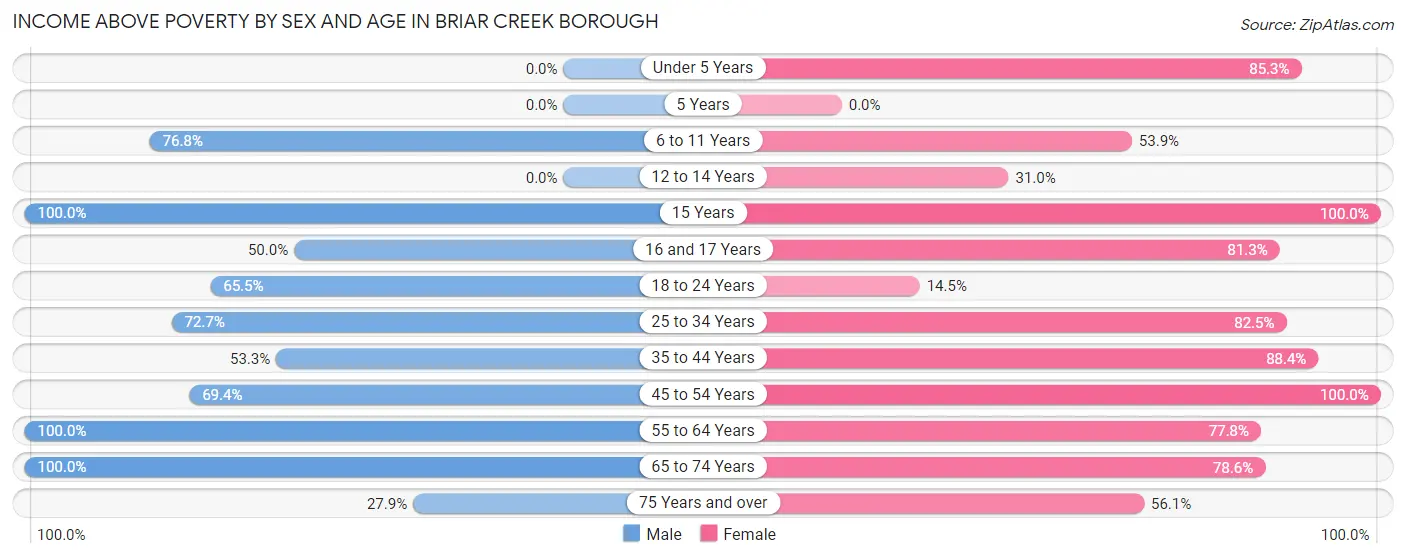
| Age Bracket | Male | Female |
| Under 5 Years | 0 (0.0%) | 29 (85.3%) |
| 5 Years | 0 (0.0%) | 0 (0.0%) |
| 6 to 11 Years | 43 (76.8%) | 14 (53.8%) |
| 12 to 14 Years | 0 (0.0%) | 13 (30.9%) |
| 15 Years | 21 (100.0%) | 11 (100.0%) |
| 16 and 17 Years | 3 (50.0%) | 13 (81.2%) |
| 18 to 24 Years | 19 (65.5%) | 11 (14.5%) |
| 25 to 34 Years | 8 (72.7%) | 33 (82.5%) |
| 35 to 44 Years | 48 (53.3%) | 84 (88.4%) |
| 45 to 54 Years | 25 (69.4%) | 23 (100.0%) |
| 55 to 64 Years | 26 (100.0%) | 35 (77.8%) |
| 65 to 74 Years | 23 (100.0%) | 33 (78.6%) |
| 75 Years and over | 12 (27.9%) | 23 (56.1%) |
| Total | 228 (61.0%) | 322 (65.6%) |
Income Below Poverty Among Married-Couple Families in Briar Creek borough
The poverty statistics for married-couple families in Briar Creek borough show that 10.4% or 10 of the total 96 families live below the poverty line. Families with 1 or 2 children have the highest poverty rate of 20.0%, comprising of 3 families. On the other hand, families with 3 or 4 children have the lowest poverty rate of 0.0%, which includes 0 families.
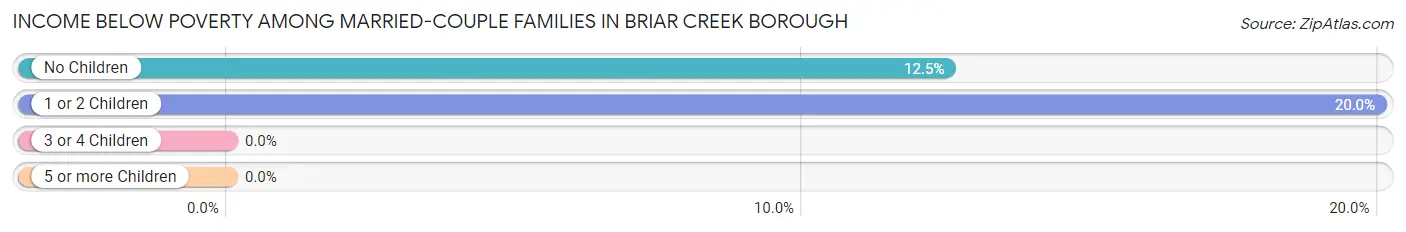
| Children | Above Poverty | Below Poverty |
| No Children | 49 (87.5%) | 7 (12.5%) |
| 1 or 2 Children | 12 (80.0%) | 3 (20.0%) |
| 3 or 4 Children | 25 (100.0%) | 0 (0.0%) |
| 5 or more Children | 0 (0.0%) | 0 (0.0%) |
| Total | 86 (89.6%) | 10 (10.4%) |
Income Below Poverty Among Single-Parent Households in Briar Creek borough
According to the poverty data in Briar Creek borough, 95.7% or 45 single-father households and 36.8% or 7 single-mother households are living below the poverty line. Among single-father households, those with 1 or 2 children have the highest poverty rate, with 28 households (100.0%) experiencing poverty. Likewise, among single-mother households, those with 3 or 4 children have the highest poverty rate, with 4 households (50.0%) falling below the poverty line.
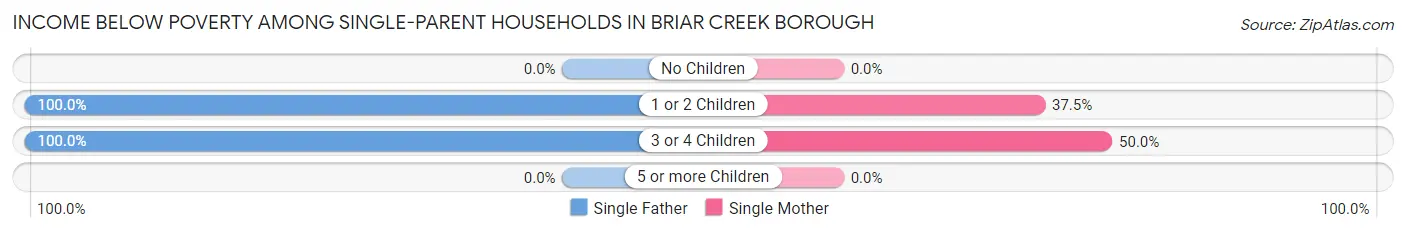
| Children | Single Father | Single Mother |
| No Children | 0 (0.0%) | 0 (0.0%) |
| 1 or 2 Children | 28 (100.0%) | 3 (37.5%) |
| 3 or 4 Children | 17 (100.0%) | 4 (50.0%) |
| 5 or more Children | 0 (0.0%) | 0 (0.0%) |
| Total | 45 (95.7%) | 7 (36.8%) |
Income Below Poverty Among Married-Couple vs Single-Parent Households in Briar Creek borough
The poverty data for Briar Creek borough shows that 10 of the married-couple family households (10.4%) and 52 of the single-parent households (78.8%) are living below the poverty level. Within the married-couple family households, those with 1 or 2 children have the highest poverty rate, with 3 households (20.0%) falling below the poverty line. Among the single-parent households, those with 1 or 2 children have the highest poverty rate, with 31 household (86.1%) living below poverty.
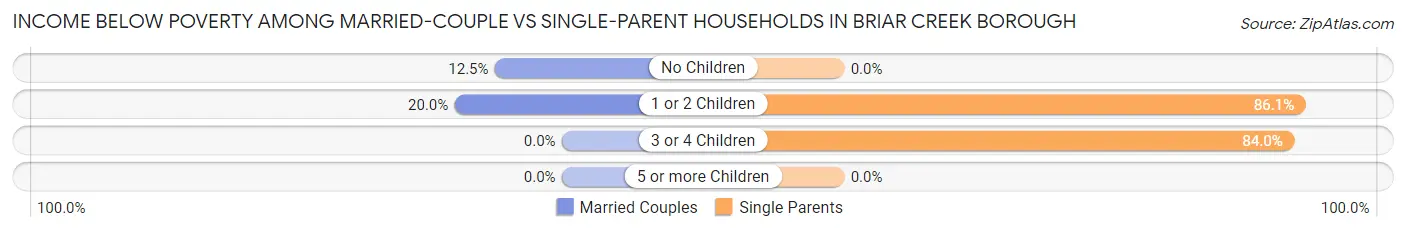
| Children | Married-Couple Families | Single-Parent Households |
| No Children | 7 (12.5%) | 0 (0.0%) |
| 1 or 2 Children | 3 (20.0%) | 31 (86.1%) |
| 3 or 4 Children | 0 (0.0%) | 21 (84.0%) |
| 5 or more Children | 0 (0.0%) | 0 (0.0%) |
| Total | 10 (10.4%) | 52 (78.8%) |
Race in Briar Creek borough
The most populous races in Briar Creek borough are White / Caucasian (887 | 94.6%), Two or more Races (41 | 4.4%), and Hispanic or Latino (38 | 4.1%).
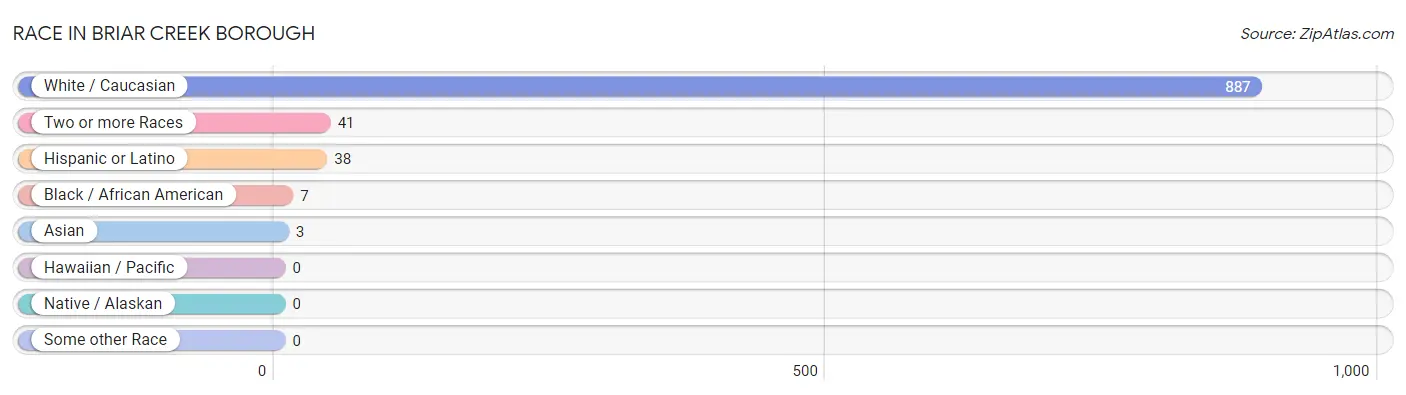
| Race | # Population | % Population |
| Asian | 3 | 0.3% |
| Black / African American | 7 | 0.7% |
| Hawaiian / Pacific | 0 | 0.0% |
| Hispanic or Latino | 38 | 4.1% |
| Native / Alaskan | 0 | 0.0% |
| White / Caucasian | 887 | 94.6% |
| Two or more Races | 41 | 4.4% |
| Some other Race | 0 | 0.0% |
| Total | 938 | 100.0% |
Ancestry in Briar Creek borough
The most populous ancestries reported in Briar Creek borough are German (196 | 20.9%), Pennsylvania German (156 | 16.6%), English (141 | 15.0%), Irish (53 | 5.7%), and Italian (42 | 4.5%), together accounting for 62.7% of all Briar Creek borough residents.
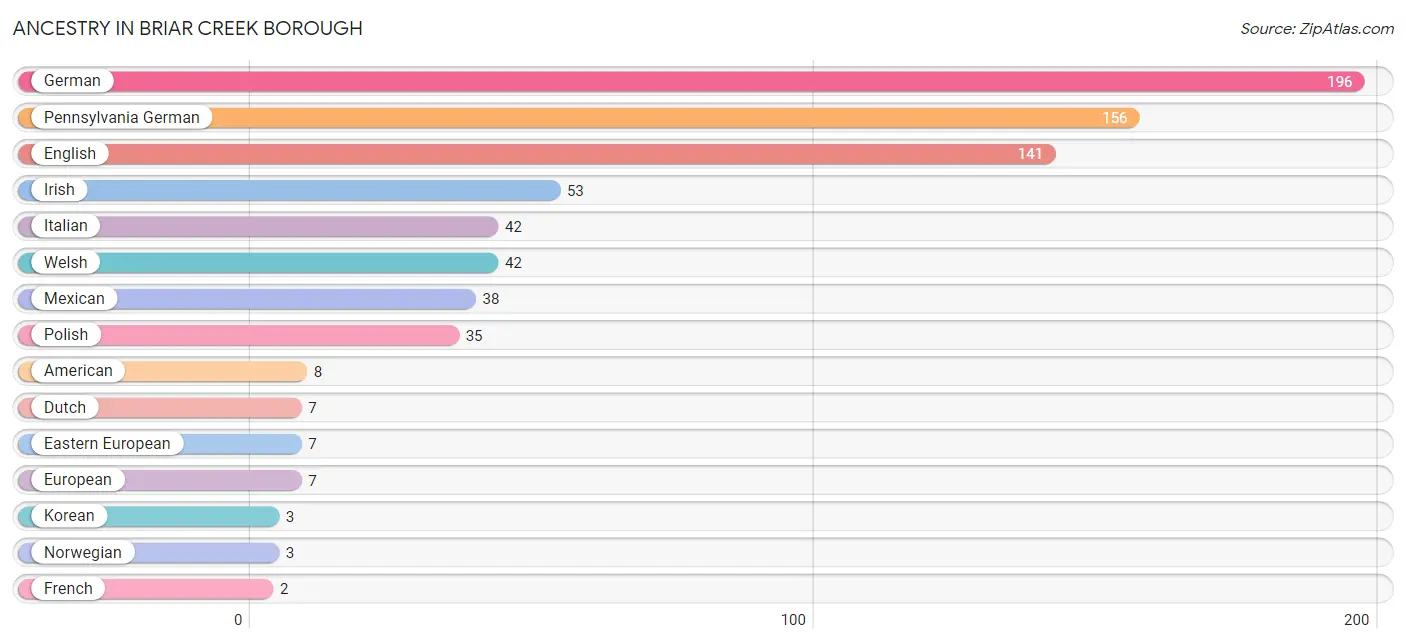
| Ancestry | # Population | % Population |
| American | 8 | 0.9% |
| Bhutanese | 1 | 0.1% |
| Dutch | 7 | 0.7% |
| Eastern European | 7 | 0.7% |
| English | 141 | 15.0% |
| European | 7 | 0.7% |
| French | 2 | 0.2% |
| French Canadian | 1 | 0.1% |
| German | 196 | 20.9% |
| Greek | 2 | 0.2% |
| Irish | 53 | 5.7% |
| Italian | 42 | 4.5% |
| Korean | 3 | 0.3% |
| Mexican | 38 | 4.1% |
| Norwegian | 3 | 0.3% |
| Pennsylvania German | 156 | 16.6% |
| Polish | 35 | 3.7% |
| Scottish | 2 | 0.2% |
| Swedish | 1 | 0.1% |
| Welsh | 42 | 4.5% | View All 20 Rows |
Immigrants in Briar Creek borough
The most numerous immigrant groups reported in Briar Creek borough came from Central America (27 | 2.9%), Latin America (27 | 2.9%), Mexico (27 | 2.9%), Asia (3 | 0.3%), and India (2 | 0.2%), together accounting for 9.2% of all Briar Creek borough residents.
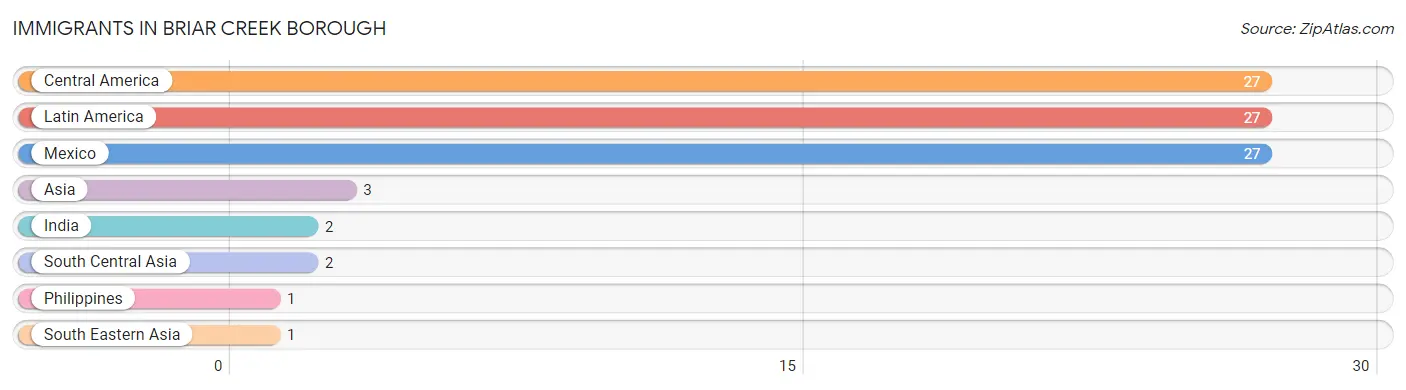
| Immigration Origin | # Population | % Population |
| Asia | 3 | 0.3% |
| Central America | 27 | 2.9% |
| India | 2 | 0.2% |
| Latin America | 27 | 2.9% |
| Mexico | 27 | 2.9% |
| Philippines | 1 | 0.1% |
| South Central Asia | 2 | 0.2% |
| South Eastern Asia | 1 | 0.1% | View All 8 Rows |
Sex and Age in Briar Creek borough
Sex and Age in Briar Creek borough
The most populous age groups in Briar Creek borough are 40 to 44 Years (69 | 17.3%) for men and 35 to 39 Years (84 | 15.6%) for women.
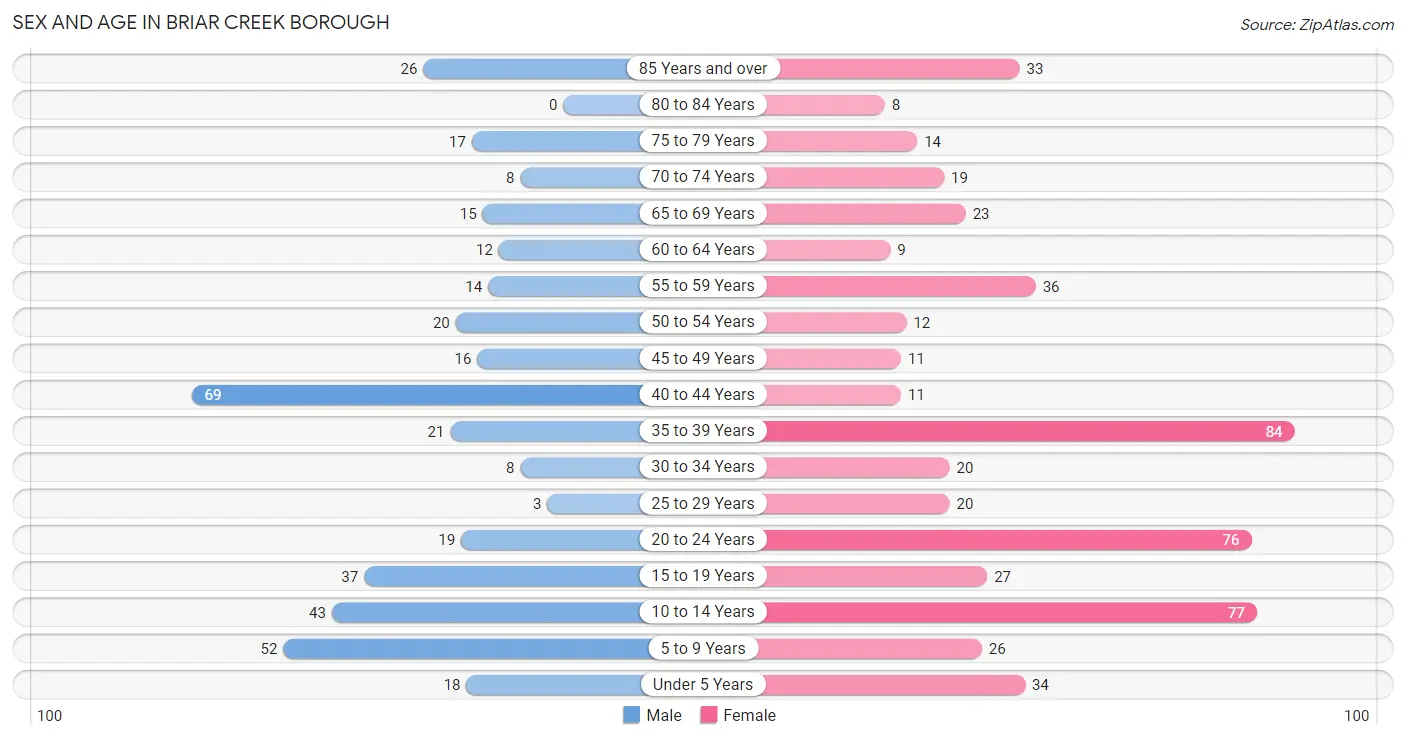
| Age Bracket | Male | Female |
| Under 5 Years | 18 (4.5%) | 34 (6.3%) |
| 5 to 9 Years | 52 (13.1%) | 26 (4.8%) |
| 10 to 14 Years | 43 (10.8%) | 77 (14.3%) |
| 15 to 19 Years | 37 (9.3%) | 27 (5.0%) |
| 20 to 24 Years | 19 (4.8%) | 76 (14.1%) |
| 25 to 29 Years | 3 (0.7%) | 20 (3.7%) |
| 30 to 34 Years | 8 (2.0%) | 20 (3.7%) |
| 35 to 39 Years | 21 (5.3%) | 84 (15.6%) |
| 40 to 44 Years | 69 (17.3%) | 11 (2.0%) |
| 45 to 49 Years | 16 (4.0%) | 11 (2.0%) |
| 50 to 54 Years | 20 (5.0%) | 12 (2.2%) |
| 55 to 59 Years | 14 (3.5%) | 36 (6.7%) |
| 60 to 64 Years | 12 (3.0%) | 9 (1.7%) |
| 65 to 69 Years | 15 (3.8%) | 23 (4.3%) |
| 70 to 74 Years | 8 (2.0%) | 19 (3.5%) |
| 75 to 79 Years | 17 (4.3%) | 14 (2.6%) |
| 80 to 84 Years | 0 (0.0%) | 8 (1.5%) |
| 85 Years and over | 26 (6.5%) | 33 (6.1%) |
| Total | 398 (100.0%) | 540 (100.0%) |
Families and Households in Briar Creek borough
Median Family Size in Briar Creek borough
The median family size in Briar Creek borough is 3.41 persons per family, with single female/mother families (19 | 11.7%) accounting for the largest median family size of 4.16 persons per family. On the other hand, single male/father families (47 | 29.0%) represent the smallest median family size with 2.66 persons per family.
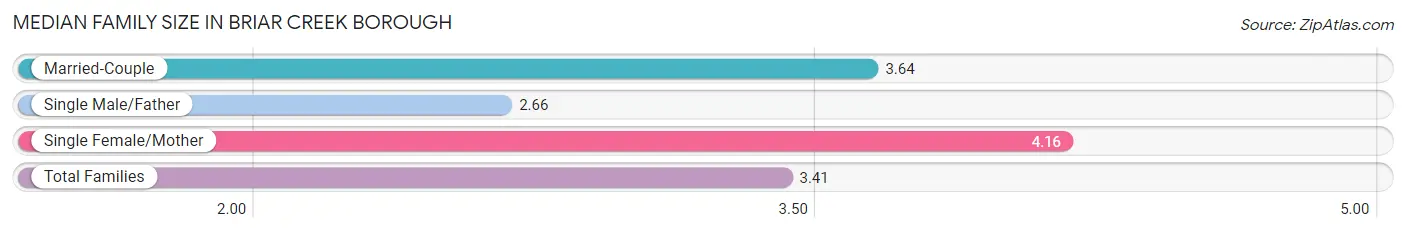
| Family Type | # Families | Family Size |
| Married-Couple | 96 (59.3%) | 3.64 |
| Single Male/Father | 47 (29.0%) | 2.66 |
| Single Female/Mother | 19 (11.7%) | 4.16 |
| Total Families | 162 (100.0%) | 3.41 |
Median Household Size in Briar Creek borough
The median household size in Briar Creek borough is 3.19 persons per household, with single male/father households (47 | 16.4%) accounting for the largest median household size of 7.09 persons per household. non-family households (124 | 43.4%) represent the smallest median household size with 1.09 persons per household.
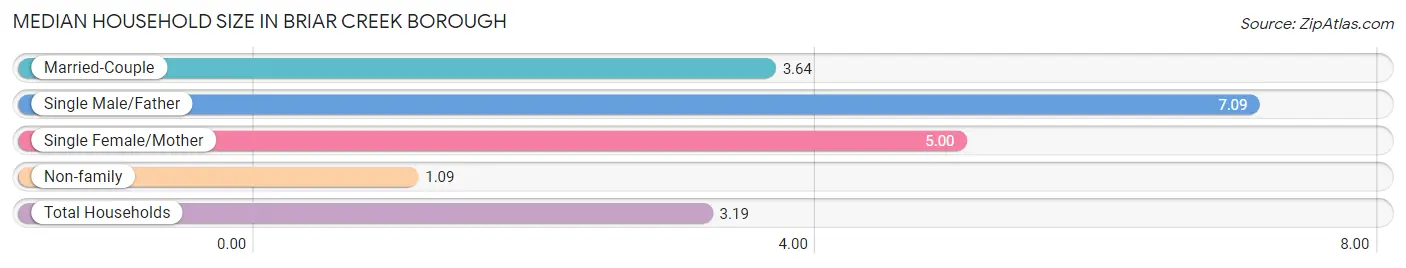
| Household Type | # Households | Household Size |
| Married-Couple | 96 (33.6%) | 3.64 |
| Single Male/Father | 47 (16.4%) | 7.09 |
| Single Female/Mother | 19 (6.6%) | 5.00 |
| Non-family | 124 (43.4%) | 1.09 |
| Total Households | 286 (100.0%) | 3.19 |
Household Size by Marriage Status in Briar Creek borough
Out of a total of 286 households in Briar Creek borough, 162 (56.6%) are family households, while 124 (43.4%) are nonfamily households. The most numerous type of family households are 2-person households, comprising 36, and the most common type of nonfamily households are 1-person households, comprising 115.
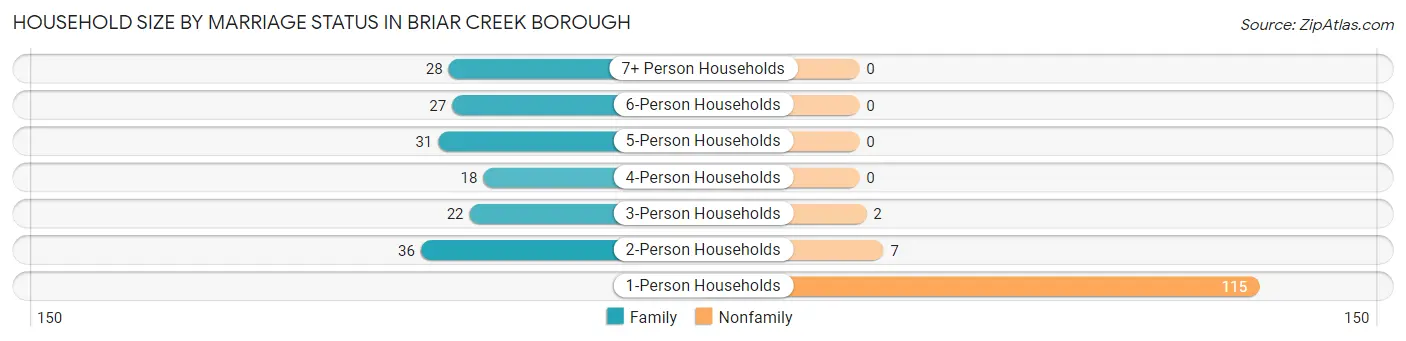
| Household Size | Family Households | Nonfamily Households |
| 1-Person Households | - | 115 (40.2%) |
| 2-Person Households | 36 (12.6%) | 7 (2.5%) |
| 3-Person Households | 22 (7.7%) | 2 (0.7%) |
| 4-Person Households | 18 (6.3%) | 0 (0.0%) |
| 5-Person Households | 31 (10.8%) | 0 (0.0%) |
| 6-Person Households | 27 (9.4%) | 0 (0.0%) |
| 7+ Person Households | 28 (9.8%) | 0 (0.0%) |
| Total | 162 (56.6%) | 124 (43.4%) |
Female Fertility in Briar Creek borough
Fertility by Age in Briar Creek borough
| Age Bracket | Women with Births | Births / 1,000 Women |
| 15 to 19 years | 0 (0.0%) | 0.0 |
| 20 to 34 years | 0 (0.0%) | 0.0 |
| 35 to 50 years | 0 (0.0%) | 0.0 |
| Total | 0 (0.0%) | 0.0 |
Fertility by Age by Marriage Status in Briar Creek borough
| Age Bracket | Married | Unmarried |
| 15 to 19 years | 0 (0.0%) | 0 (0.0%) |
| 20 to 34 years | 0 (0.0%) | 0 (0.0%) |
| 35 to 50 years | 0 (0.0%) | 0 (0.0%) |
| Total | 0 (0.0%) | 0 (0.0%) |
Fertility by Education in Briar Creek borough
| Educational Attainment | Women with Births | Births / 1,000 Women |
| Less than High School | 0 (0.0%) | 0.0 |
| High School Diploma | 0 (0.0%) | 0.0 |
| College or Associate's Degree | 0 (0.0%) | 0.0 |
| Bachelor's Degree | 0 (0.0%) | 0.0 |
| Graduate Degree | 0 (0.0%) | 0.0 |
| Total | 0 (0.0%) | 0.0 |
Fertility by Education by Marriage Status in Briar Creek borough
| Educational Attainment | Married | Unmarried |
| Less than High School | 0 (0.0%) | 0 (0.0%) |
| High School Diploma | 0 (0.0%) | 0 (0.0%) |
| College or Associate's Degree | 0 (0.0%) | 0 (0.0%) |
| Bachelor's Degree | 0 (0.0%) | 0 (0.0%) |
| Graduate Degree | 0 (0.0%) | 0 (0.0%) |
| Total | 0 (0.0%) | 0 (0.0%) |
Employment Characteristics in Briar Creek borough
Employment by Class of Employer in Briar Creek borough
Among the 246 employed individuals in Briar Creek borough, private company employees (183 | 74.4%), local government employees (34 | 13.8%), and not-for-profit organizations (10 | 4.1%) make up the most common classes of employment.
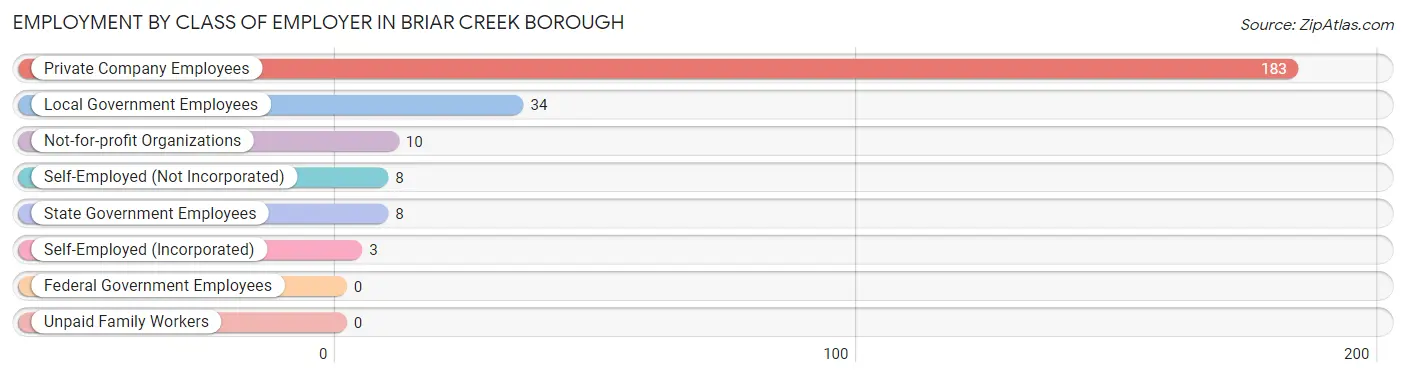
| Employer Class | # Employees | % Employees |
| Private Company Employees | 183 | 74.4% |
| Self-Employed (Incorporated) | 3 | 1.2% |
| Self-Employed (Not Incorporated) | 8 | 3.3% |
| Not-for-profit Organizations | 10 | 4.1% |
| Local Government Employees | 34 | 13.8% |
| State Government Employees | 8 | 3.3% |
| Federal Government Employees | 0 | 0.0% |
| Unpaid Family Workers | 0 | 0.0% |
| Total | 246 | 100.0% |
Employment Status by Age in Briar Creek borough
According to the labor force statistics for Briar Creek borough, out of the total population over 16 years of age (656), 56.7% or 372 individuals are in the labor force, with 33.9% or 126 of them unemployed. The age group with the highest labor force participation rate is 20 to 24 years, with 88.4% or 84 individuals in the labor force. Within the labor force, the 20 to 24 years age range has the highest percentage of unemployed individuals, with 81.0% or 68 of them being unemployed.
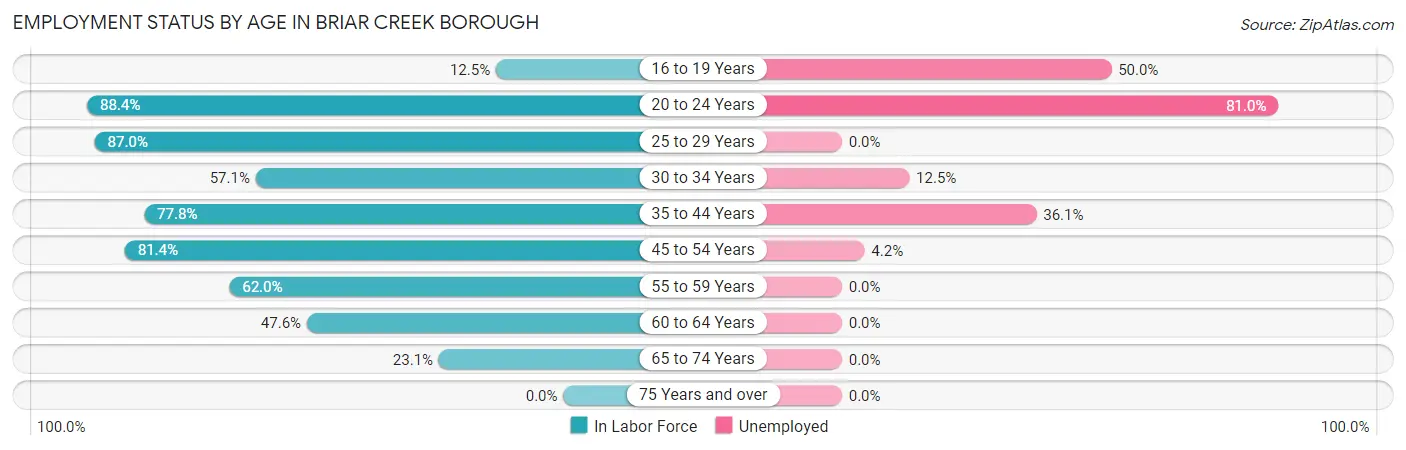
| Age Bracket | In Labor Force | Unemployed |
| 16 to 19 Years | 4 (12.5%) | 2 (50.0%) |
| 20 to 24 Years | 84 (88.4%) | 68 (81.0%) |
| 25 to 29 Years | 20 (87.0%) | 0 (0.0%) |
| 30 to 34 Years | 16 (57.1%) | 2 (12.5%) |
| 35 to 44 Years | 144 (77.8%) | 52 (36.1%) |
| 45 to 54 Years | 48 (81.4%) | 2 (4.2%) |
| 55 to 59 Years | 31 (62.0%) | 0 (0.0%) |
| 60 to 64 Years | 10 (47.6%) | 0 (0.0%) |
| 65 to 74 Years | 15 (23.1%) | 0 (0.0%) |
| 75 Years and over | 0 (0.0%) | 0 (0.0%) |
| Total | 372 (56.7%) | 126 (33.9%) |
Employment Status by Educational Attainment in Briar Creek borough
According to labor force statistics for Briar Creek borough, 73.5% of individuals (269) out of the total population between 25 and 64 years of age (366) are in the labor force, with 20.8% or 56 of them being unemployed. The group with the highest labor force participation rate are those with the educational attainment of bachelor's degree or higher, with 94.6% or 35 individuals in the labor force. Within the labor force, individuals with college / associate degree education have the highest percentage of unemployment, with 40.6% or 52 of them being unemployed.
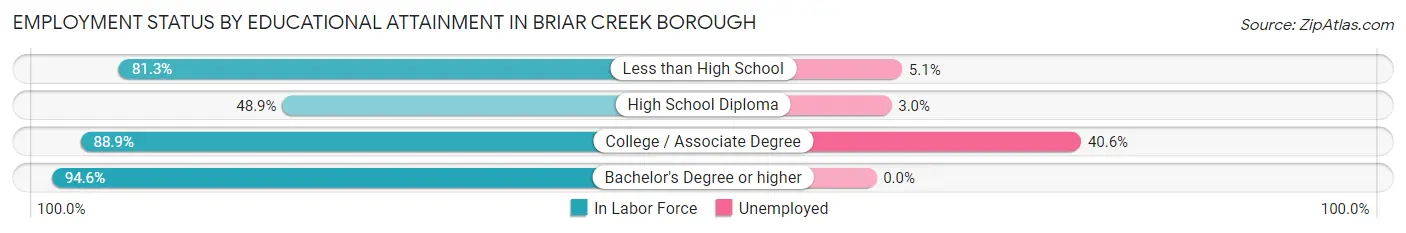
| Educational Attainment | In Labor Force | Unemployed |
| Less than High School | 39 (81.3%) | 2 (5.1%) |
| High School Diploma | 67 (48.9%) | 4 (3.0%) |
| College / Associate Degree | 128 (88.9%) | 58 (40.6%) |
| Bachelor's Degree or higher | 35 (94.6%) | 0 (0.0%) |
| Total | 269 (73.5%) | 76 (20.8%) |
Employment Occupations by Sex in Briar Creek borough
Management, Business, Science and Arts Occupations
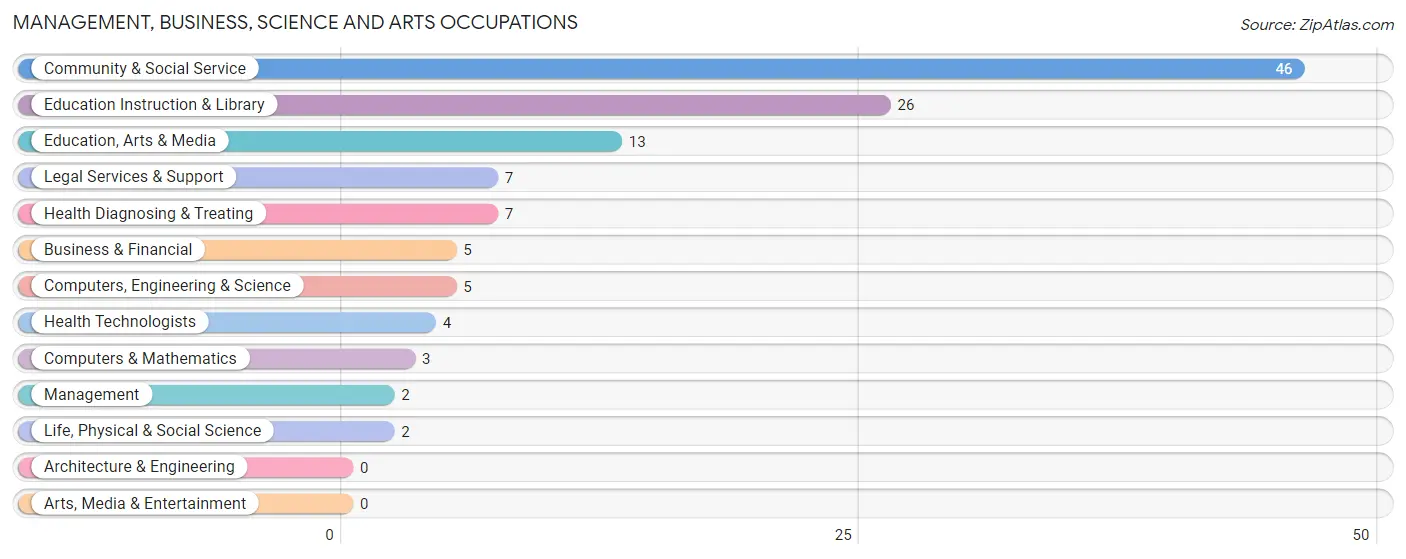
The most common Management, Business, Science and Arts occupations in Briar Creek borough are Community & Social Service (46 | 18.7%), Education Instruction & Library (26 | 10.6%), Education, Arts & Media (13 | 5.3%), Legal Services & Support (7 | 2.9%), and Health Diagnosing & Treating (7 | 2.9%).
Management, Business, Science and Arts Occupations by Sex
Within the Management, Business, Science and Arts occupations in Briar Creek borough, the most male-oriented occupations are Education Instruction & Library (57.7%), Education, Arts & Media (53.8%), and Community & Social Service (47.8%), while the most female-oriented occupations are Management (100.0%), Computers, Engineering & Science (100.0%), and Computers & Mathematics (100.0%).
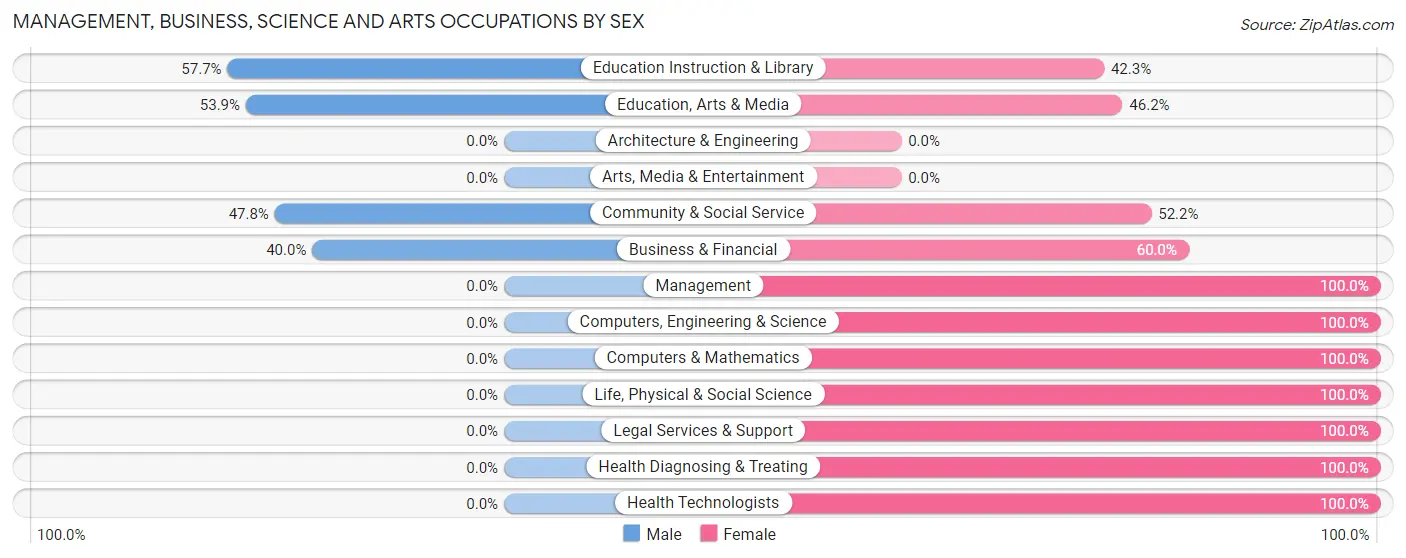
| Occupation | Male | Female |
| Management | 0 (0.0%) | 2 (100.0%) |
| Business & Financial | 2 (40.0%) | 3 (60.0%) |
| Computers, Engineering & Science | 0 (0.0%) | 5 (100.0%) |
| Computers & Mathematics | 0 (0.0%) | 3 (100.0%) |
| Architecture & Engineering | 0 (0.0%) | 0 (0.0%) |
| Life, Physical & Social Science | 0 (0.0%) | 2 (100.0%) |
| Community & Social Service | 22 (47.8%) | 24 (52.2%) |
| Education, Arts & Media | 7 (53.8%) | 6 (46.2%) |
| Legal Services & Support | 0 (0.0%) | 7 (100.0%) |
| Education Instruction & Library | 15 (57.7%) | 11 (42.3%) |
| Arts, Media & Entertainment | 0 (0.0%) | 0 (0.0%) |
| Health Diagnosing & Treating | 0 (0.0%) | 7 (100.0%) |
| Health Technologists | 0 (0.0%) | 4 (100.0%) |
| Total (Category) | 24 (36.9%) | 41 (63.1%) |
| Total (Overall) | 142 (57.7%) | 104 (42.3%) |
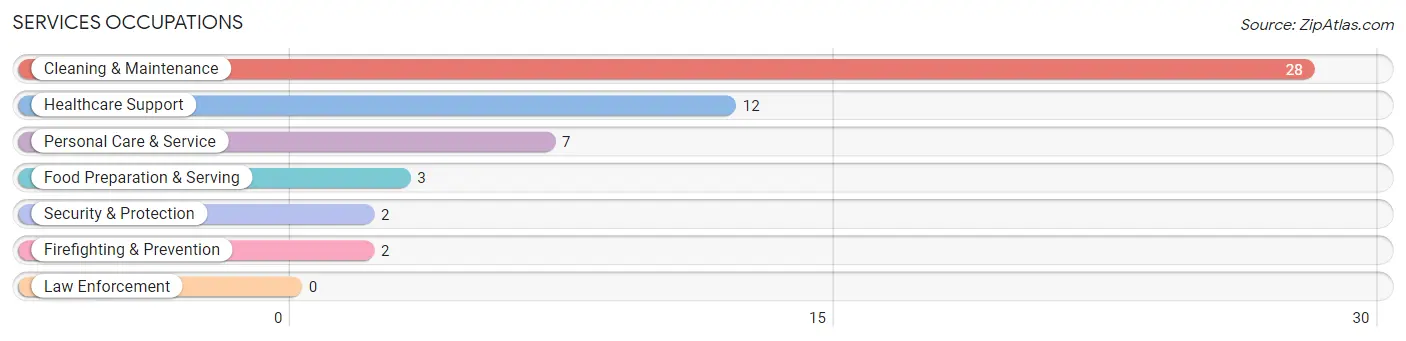
Services Occupations
The most common Services occupations in Briar Creek borough are Cleaning & Maintenance (28 | 11.4%), Healthcare Support (12 | 4.9%), Personal Care & Service (7 | 2.9%), Food Preparation & Serving (3 | 1.2%), and Security & Protection (2 | 0.8%).
Services Occupations by Sex
Within the Services occupations in Briar Creek borough, the most male-oriented occupations are Security & Protection (100.0%), Firefighting & Prevention (100.0%), and Cleaning & Maintenance (100.0%), while the most female-oriented occupations are Food Preparation & Serving (100.0%), and Healthcare Support (58.3%).
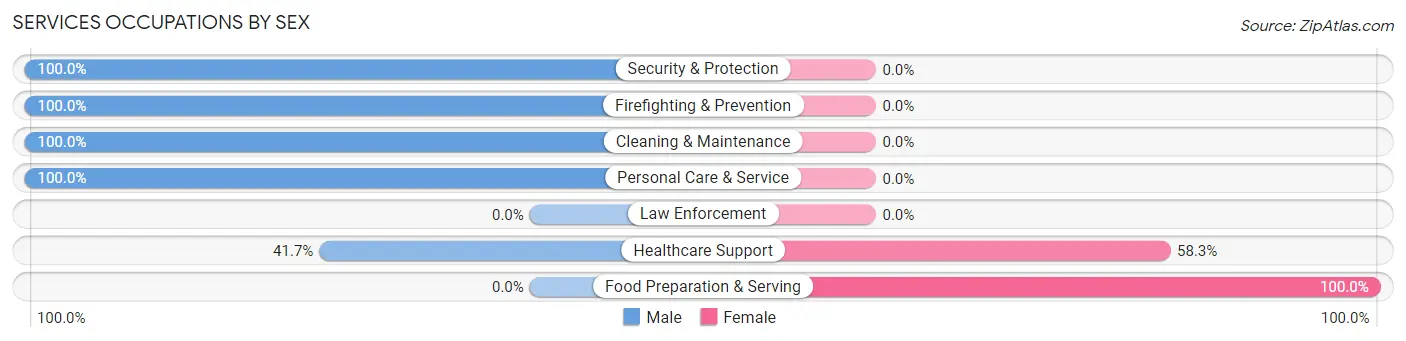
| Occupation | Male | Female |
| Healthcare Support | 5 (41.7%) | 7 (58.3%) |
| Security & Protection | 2 (100.0%) | 0 (0.0%) |
| Firefighting & Prevention | 2 (100.0%) | 0 (0.0%) |
| Law Enforcement | 0 (0.0%) | 0 (0.0%) |
| Food Preparation & Serving | 0 (0.0%) | 3 (100.0%) |
| Cleaning & Maintenance | 28 (100.0%) | 0 (0.0%) |
| Personal Care & Service | 7 (100.0%) | 0 (0.0%) |
| Total (Category) | 42 (80.8%) | 10 (19.2%) |
| Total (Overall) | 142 (57.7%) | 104 (42.3%) |
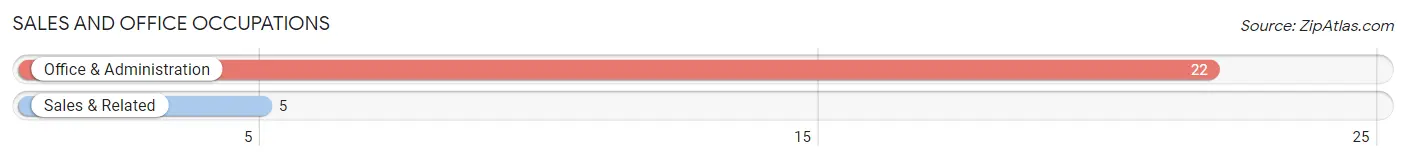
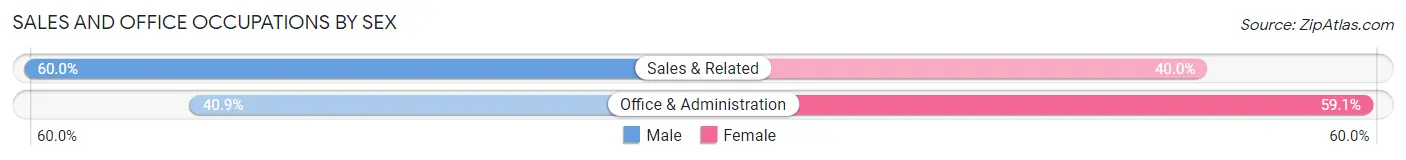
Sales and Office Occupations
The most common Sales and Office occupations in Briar Creek borough are Office & Administration (22 | 8.9%), and Sales & Related (5 | 2.0%).
Sales and Office Occupations by Sex
| Occupation | Male | Female |
| Sales & Related | 3 (60.0%) | 2 (40.0%) |
| Office & Administration | 9 (40.9%) | 13 (59.1%) |
| Total (Category) | 12 (44.4%) | 15 (55.6%) |
| Total (Overall) | 142 (57.7%) | 104 (42.3%) |
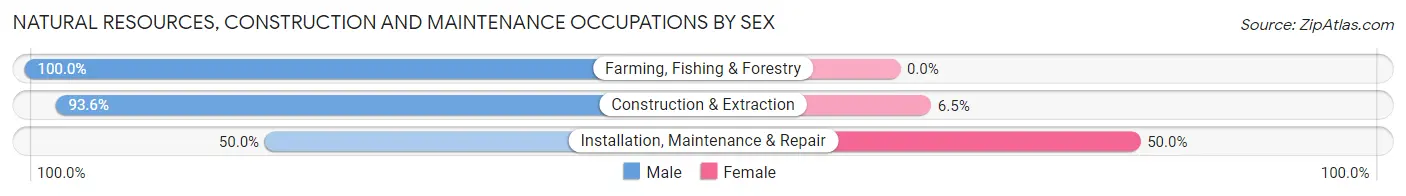
Natural Resources, Construction and Maintenance Occupations
The most common Natural Resources, Construction and Maintenance occupations in Briar Creek borough are Construction & Extraction (31 | 12.6%), Installation, Maintenance & Repair (8 | 3.3%), and Farming, Fishing & Forestry (5 | 2.0%).

Natural Resources, Construction and Maintenance Occupations by Sex
| Occupation | Male | Female |
| Farming, Fishing & Forestry | 5 (100.0%) | 0 (0.0%) |
| Construction & Extraction | 29 (93.5%) | 2 (6.5%) |
| Installation, Maintenance & Repair | 4 (50.0%) | 4 (50.0%) |
| Total (Category) | 38 (86.4%) | 6 (13.6%) |
| Total (Overall) | 142 (57.7%) | 104 (42.3%) |
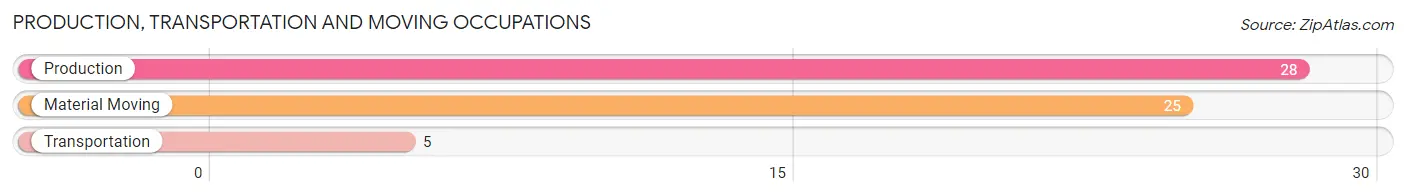
Production, Transportation and Moving Occupations
The most common Production, Transportation and Moving occupations in Briar Creek borough are Production (28 | 11.4%), Material Moving (25 | 10.2%), and Transportation (5 | 2.0%).
Production, Transportation and Moving Occupations by Sex
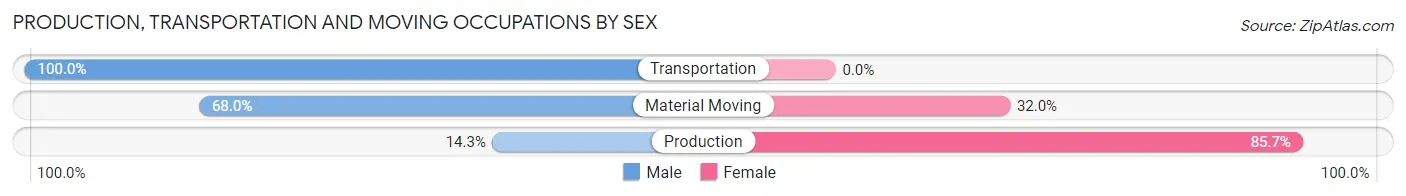
| Occupation | Male | Female |
| Production | 4 (14.3%) | 24 (85.7%) |
| Transportation | 5 (100.0%) | 0 (0.0%) |
| Material Moving | 17 (68.0%) | 8 (32.0%) |
| Total (Category) | 26 (44.8%) | 32 (55.2%) |
| Total (Overall) | 142 (57.7%) | 104 (42.3%) |
Employment Industries by Sex in Briar Creek borough
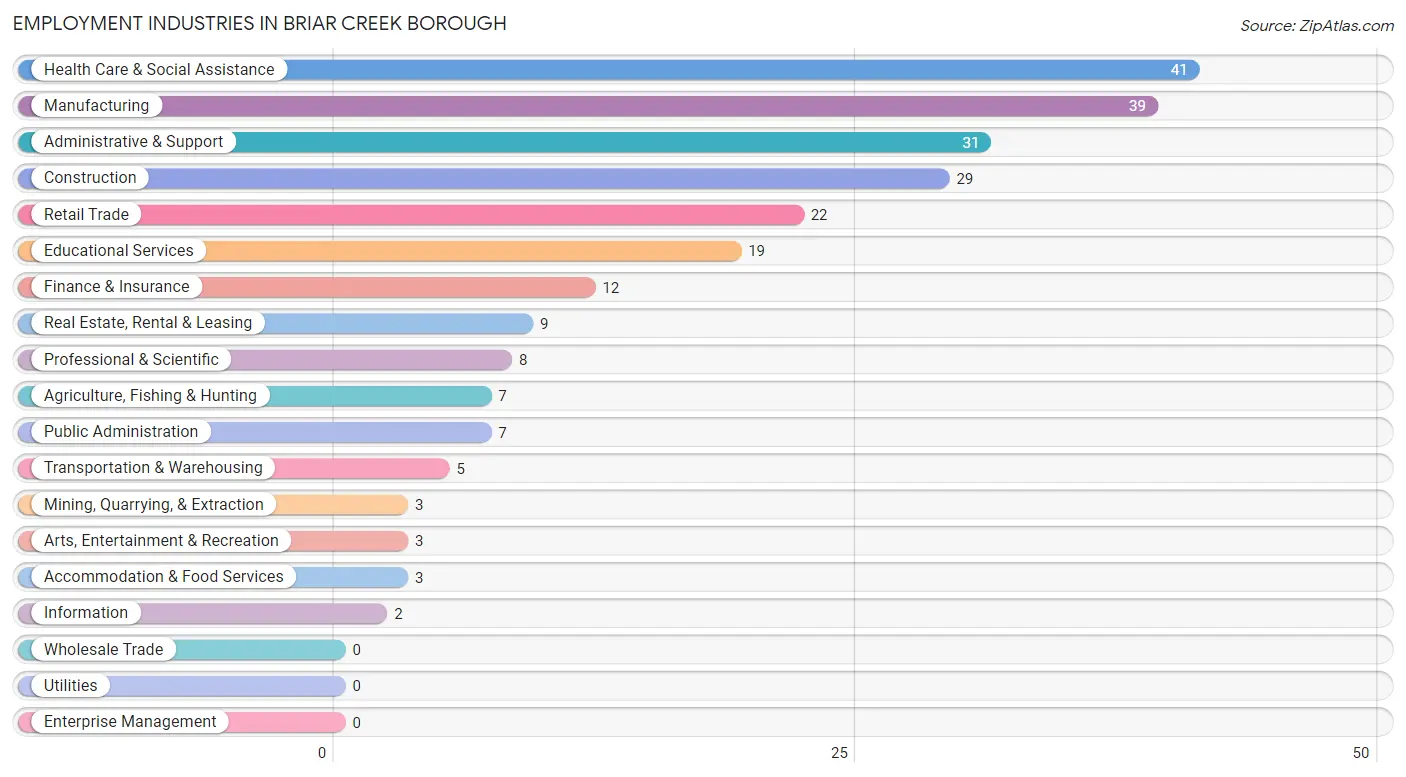
Employment Industries in Briar Creek borough
The major employment industries in Briar Creek borough include Health Care & Social Assistance (41 | 16.7%), Manufacturing (39 | 15.9%), Administrative & Support (31 | 12.6%), Construction (29 | 11.8%), and Retail Trade (22 | 8.9%).
Employment Industries by Sex in Briar Creek borough
The Briar Creek borough industries that see more men than women are Agriculture, Fishing & Hunting (100.0%), Mining, Quarrying, & Extraction (100.0%), and Transportation & Warehousing (100.0%), whereas the industries that tend to have a higher number of women are Professional & Scientific (100.0%), Accommodation & Food Services (100.0%), and Finance & Insurance (83.3%).
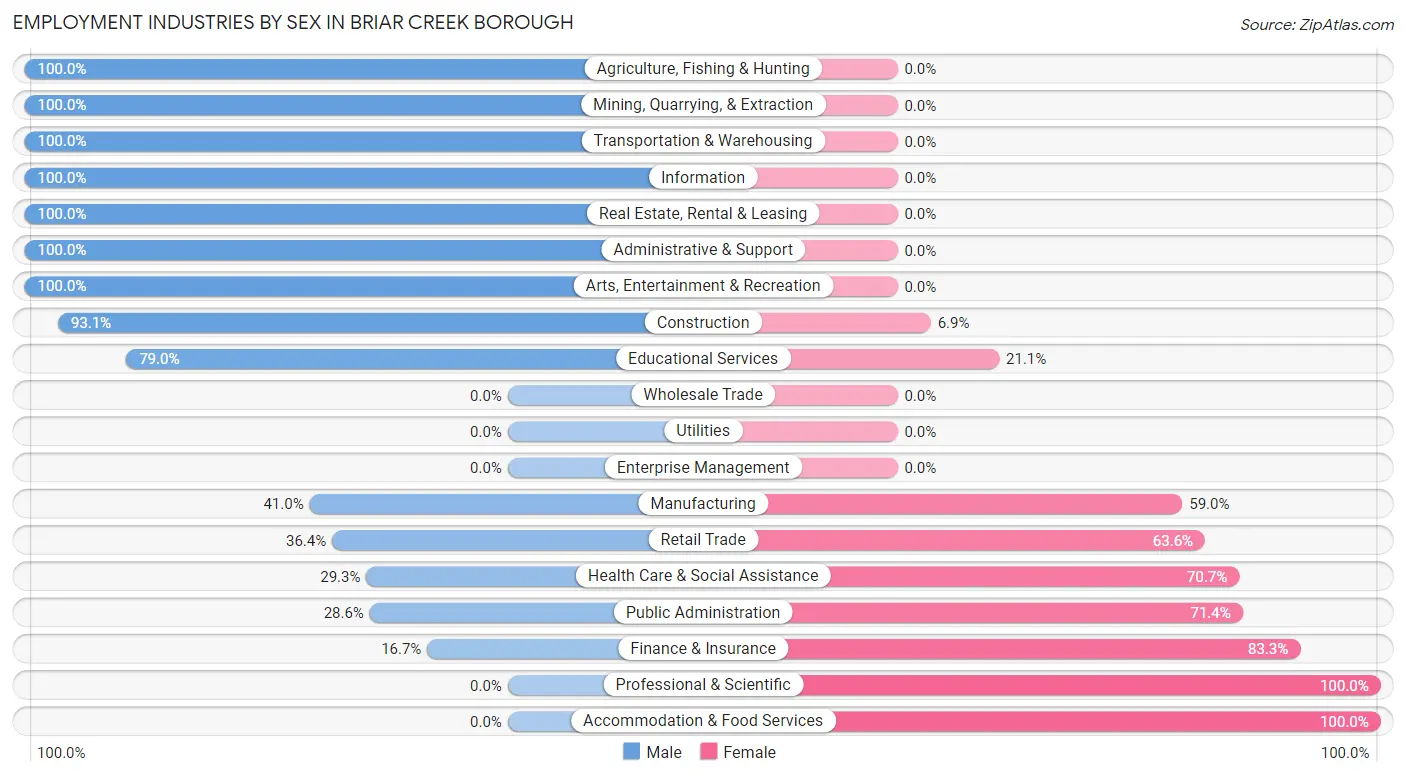
| Industry | Male | Female |
| Agriculture, Fishing & Hunting | 7 (100.0%) | 0 (0.0%) |
| Mining, Quarrying, & Extraction | 3 (100.0%) | 0 (0.0%) |
| Construction | 27 (93.1%) | 2 (6.9%) |
| Manufacturing | 16 (41.0%) | 23 (59.0%) |
| Wholesale Trade | 0 (0.0%) | 0 (0.0%) |
| Retail Trade | 8 (36.4%) | 14 (63.6%) |
| Transportation & Warehousing | 5 (100.0%) | 0 (0.0%) |
| Utilities | 0 (0.0%) | 0 (0.0%) |
| Information | 2 (100.0%) | 0 (0.0%) |
| Finance & Insurance | 2 (16.7%) | 10 (83.3%) |
| Real Estate, Rental & Leasing | 9 (100.0%) | 0 (0.0%) |
| Professional & Scientific | 0 (0.0%) | 8 (100.0%) |
| Enterprise Management | 0 (0.0%) | 0 (0.0%) |
| Administrative & Support | 31 (100.0%) | 0 (0.0%) |
| Educational Services | 15 (78.9%) | 4 (21.0%) |
| Health Care & Social Assistance | 12 (29.3%) | 29 (70.7%) |
| Arts, Entertainment & Recreation | 3 (100.0%) | 0 (0.0%) |
| Accommodation & Food Services | 0 (0.0%) | 3 (100.0%) |
| Public Administration | 2 (28.6%) | 5 (71.4%) |
| Total | 142 (57.7%) | 104 (42.3%) |
Education in Briar Creek borough
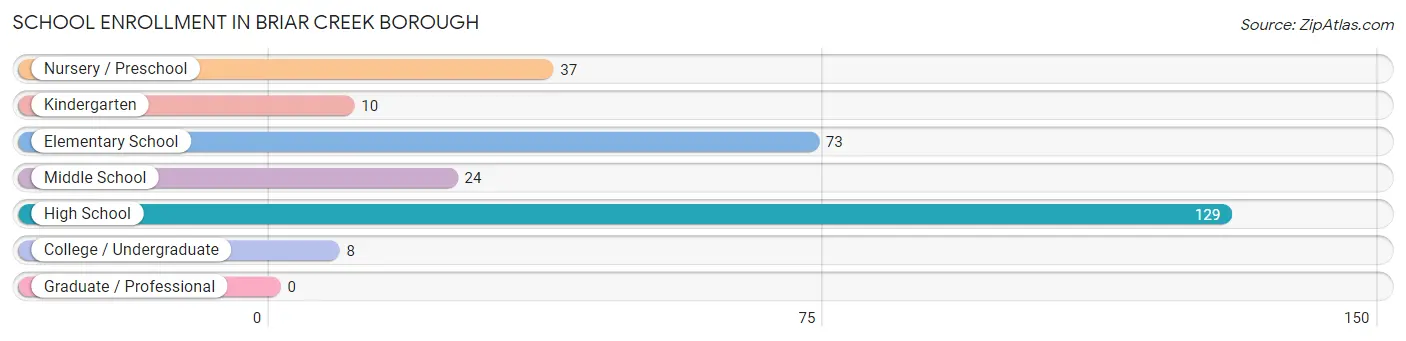
School Enrollment in Briar Creek borough
The most common levels of schooling among the 281 students in Briar Creek borough are high school (129 | 45.9%), elementary school (73 | 26.0%), and nursery / preschool (37 | 13.2%).
| School Level | # Students | % Students |
| Nursery / Preschool | 37 | 13.2% |
| Kindergarten | 10 | 3.6% |
| Elementary School | 73 | 26.0% |
| Middle School | 24 | 8.5% |
| High School | 129 | 45.9% |
| College / Undergraduate | 8 | 2.9% |
| Graduate / Professional | 0 | 0.0% |
| Total | 281 | 100.0% |
School Enrollment by Age by Funding Source in Briar Creek borough
Out of a total of 281 students who are enrolled in schools in Briar Creek borough, 58 (20.6%) attend a private institution, while the remaining 223 (79.4%) are enrolled in public schools. The age group of 3 to 4 year olds has the highest likelihood of being enrolled in private schools, with 27 (64.3% in the age bracket) enrolled. Conversely, the age group of 10 to 14 year olds has the lowest likelihood of being enrolled in a private school, with 120 (100.0% in the age bracket) attending a public institution.
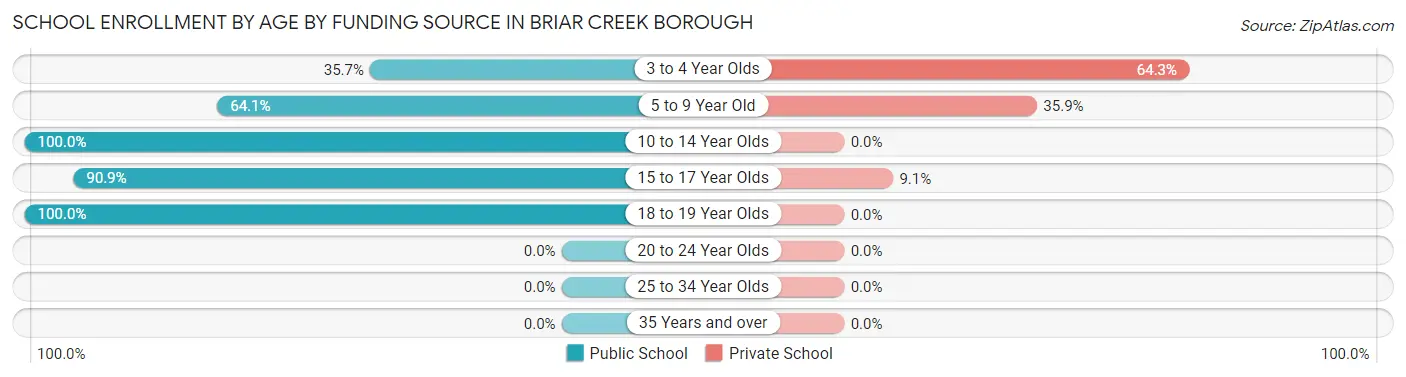
| Age Bracket | Public School | Private School |
| 3 to 4 Year Olds | 15 (35.7%) | 27 (64.3%) |
| 5 to 9 Year Old | 50 (64.1%) | 28 (35.9%) |
| 10 to 14 Year Olds | 120 (100.0%) | 0 (0.0%) |
| 15 to 17 Year Olds | 30 (90.9%) | 3 (9.1%) |
| 18 to 19 Year Olds | 8 (100.0%) | 0 (0.0%) |
| 20 to 24 Year Olds | 0 (0.0%) | 0 (0.0%) |
| 25 to 34 Year Olds | 0 (0.0%) | 0 (0.0%) |
| 35 Years and over | 0 (0.0%) | 0 (0.0%) |
| Total | 223 (79.4%) | 58 (20.6%) |
Educational Attainment by Field of Study in Briar Creek borough
Education (41 | 51.2%), arts & humanities (22 | 27.5%), physical & health sciences (6 | 7.5%), science & technology (4 | 5.0%), and business (2 | 2.5%) are the most common fields of study among 80 individuals in Briar Creek borough who have obtained a bachelor's degree or higher.
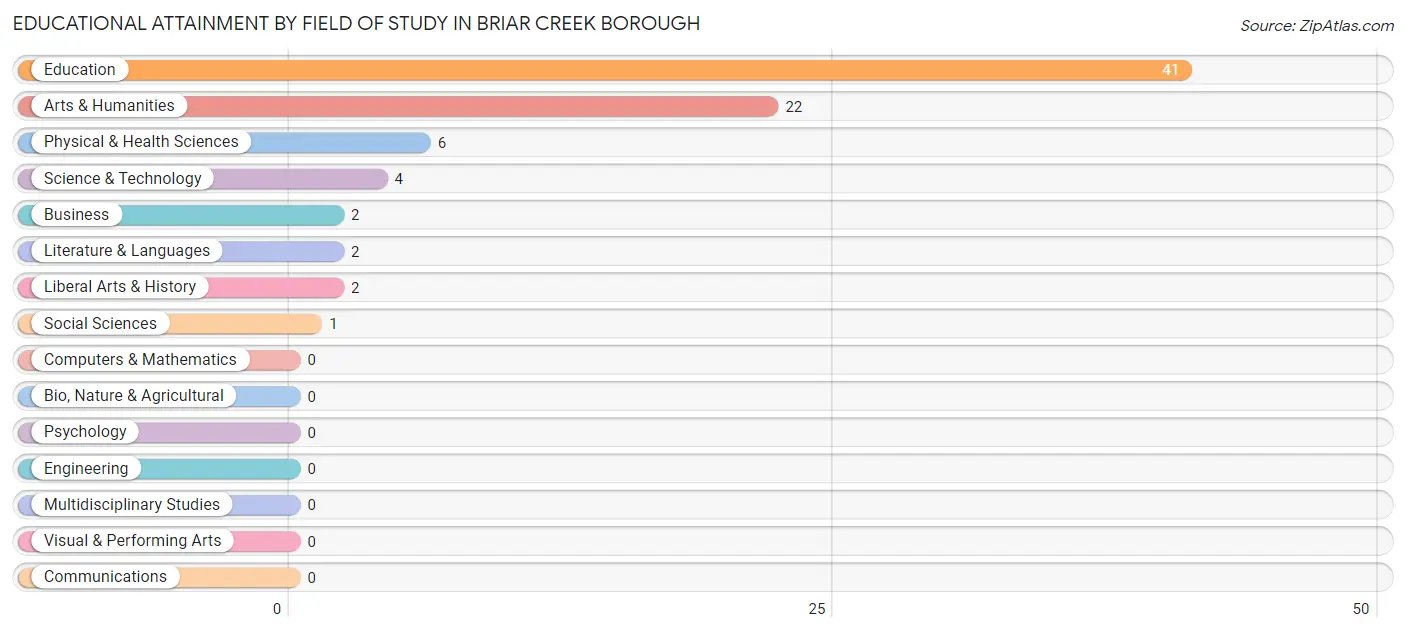
| Field of Study | # Graduates | % Graduates |
| Computers & Mathematics | 0 | 0.0% |
| Bio, Nature & Agricultural | 0 | 0.0% |
| Physical & Health Sciences | 6 | 7.5% |
| Psychology | 0 | 0.0% |
| Social Sciences | 1 | 1.3% |
| Engineering | 0 | 0.0% |
| Multidisciplinary Studies | 0 | 0.0% |
| Science & Technology | 4 | 5.0% |
| Business | 2 | 2.5% |
| Education | 41 | 51.2% |
| Literature & Languages | 2 | 2.5% |
| Liberal Arts & History | 2 | 2.5% |
| Visual & Performing Arts | 0 | 0.0% |
| Communications | 0 | 0.0% |
| Arts & Humanities | 22 | 27.5% |
| Total | 80 | 100.0% |
Transportation & Commute in Briar Creek borough
Vehicle Availability by Sex in Briar Creek borough
The most prevalent vehicle ownership categories in Briar Creek borough are males with 2 vehicles (45, accounting for 34.6%) and females with 2 vehicles (42, making up 43.3%).
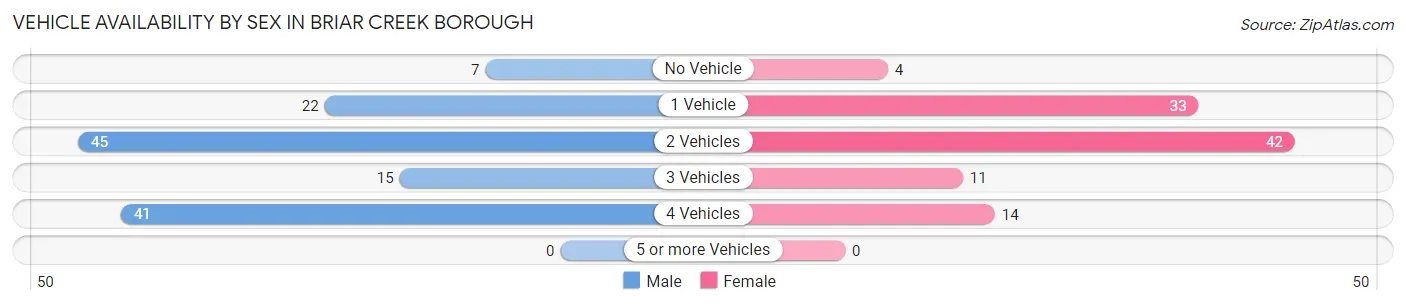
| Vehicles Available | Male | Female |
| No Vehicle | 7 (5.4%) | 4 (3.8%) |
| 1 Vehicle | 22 (16.9%) | 33 (31.7%) |
| 2 Vehicles | 45 (34.6%) | 42 (40.4%) |
| 3 Vehicles | 15 (11.5%) | 11 (10.6%) |
| 4 Vehicles | 41 (31.5%) | 14 (13.5%) |
| 5 or more Vehicles | 0 (0.0%) | 0 (0.0%) |
| Total | 130 (100.0%) | 104 (100.0%) |
Commute Time in Briar Creek borough
The most frequently occuring commute durations in Briar Creek borough are 10 to 14 minutes (55 commuters, 22.9%), 20 to 24 minutes (55 commuters, 22.9%), and 5 to 9 minutes (39 commuters, 16.3%).
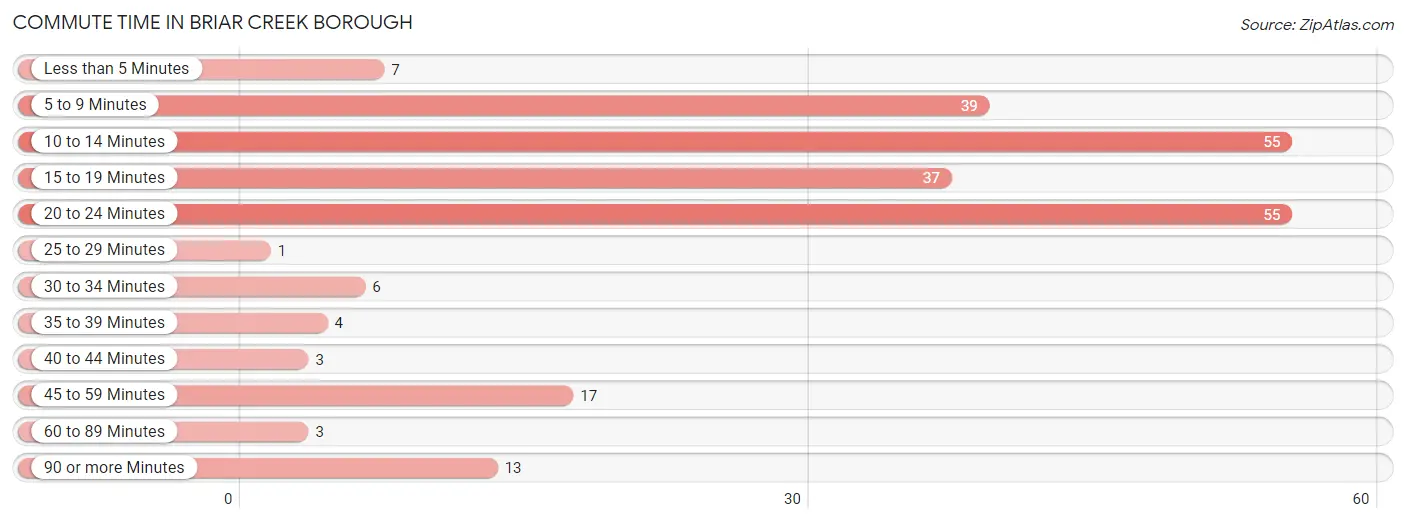
| Commute Time | # Commuters | % Commuters |
| Less than 5 Minutes | 7 | 2.9% |
| 5 to 9 Minutes | 39 | 16.3% |
| 10 to 14 Minutes | 55 | 22.9% |
| 15 to 19 Minutes | 37 | 15.4% |
| 20 to 24 Minutes | 55 | 22.9% |
| 25 to 29 Minutes | 1 | 0.4% |
| 30 to 34 Minutes | 6 | 2.5% |
| 35 to 39 Minutes | 4 | 1.7% |
| 40 to 44 Minutes | 3 | 1.3% |
| 45 to 59 Minutes | 17 | 7.1% |
| 60 to 89 Minutes | 3 | 1.3% |
| 90 or more Minutes | 13 | 5.4% |
Commute Time by Sex in Briar Creek borough
The most common commute times in Briar Creek borough are 20 to 24 minutes (36 commuters, 25.7%) for males and 10 to 14 minutes (24 commuters, 24.0%) for females.
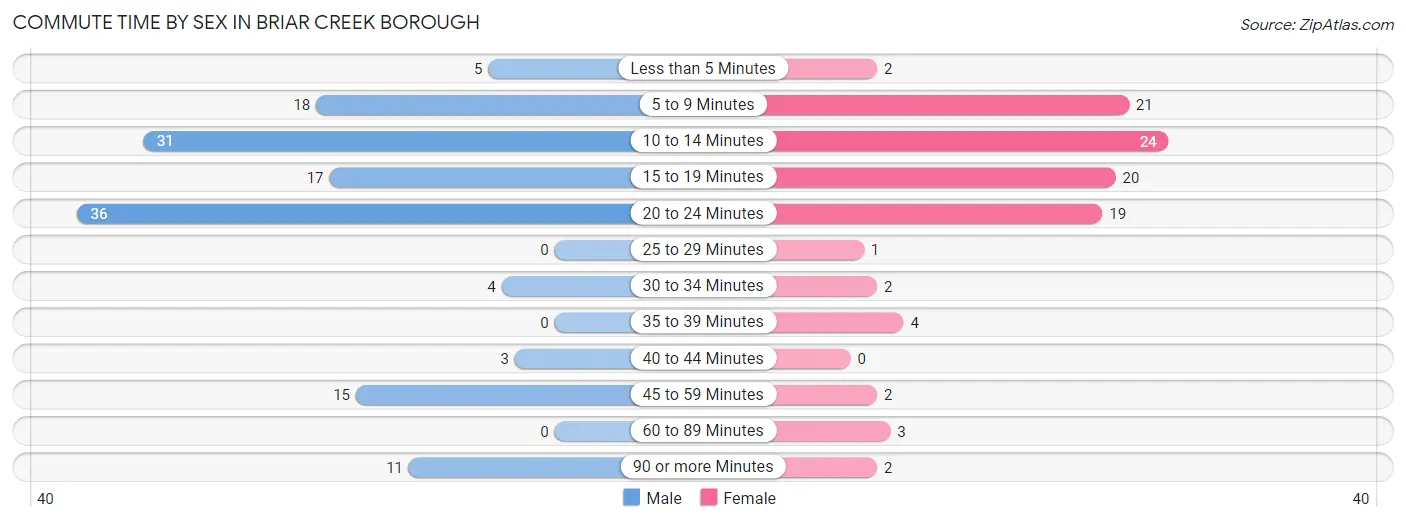
| Commute Time | Male | Female |
| Less than 5 Minutes | 5 (3.6%) | 2 (2.0%) |
| 5 to 9 Minutes | 18 (12.9%) | 21 (21.0%) |
| 10 to 14 Minutes | 31 (22.1%) | 24 (24.0%) |
| 15 to 19 Minutes | 17 (12.1%) | 20 (20.0%) |
| 20 to 24 Minutes | 36 (25.7%) | 19 (19.0%) |
| 25 to 29 Minutes | 0 (0.0%) | 1 (1.0%) |
| 30 to 34 Minutes | 4 (2.9%) | 2 (2.0%) |
| 35 to 39 Minutes | 0 (0.0%) | 4 (4.0%) |
| 40 to 44 Minutes | 3 (2.1%) | 0 (0.0%) |
| 45 to 59 Minutes | 15 (10.7%) | 2 (2.0%) |
| 60 to 89 Minutes | 0 (0.0%) | 3 (3.0%) |
| 90 or more Minutes | 11 (7.9%) | 2 (2.0%) |
Time of Departure to Work by Sex in Briar Creek borough
The most frequent times of departure to work in Briar Creek borough are 9:00 AM to 9:59 AM (36, 25.7%) for males and 6:00 AM to 6:29 AM (26, 26.0%) for females.
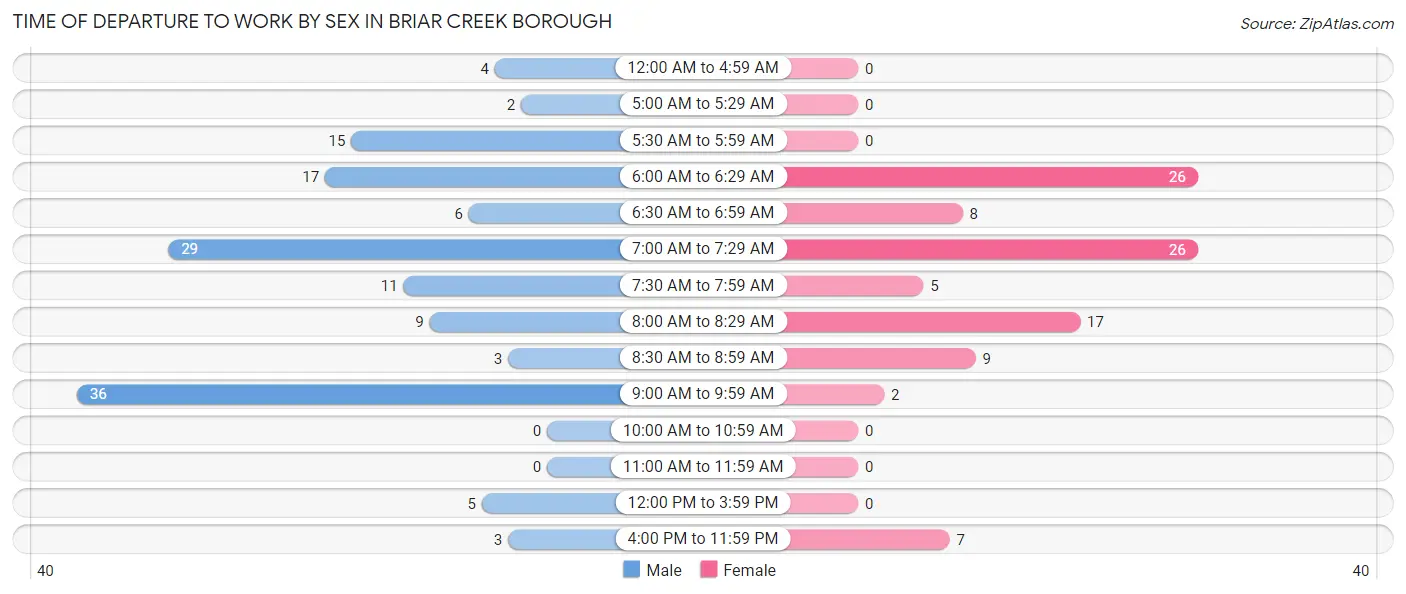
| Time of Departure | Male | Female |
| 12:00 AM to 4:59 AM | 4 (2.9%) | 0 (0.0%) |
| 5:00 AM to 5:29 AM | 2 (1.4%) | 0 (0.0%) |
| 5:30 AM to 5:59 AM | 15 (10.7%) | 0 (0.0%) |
| 6:00 AM to 6:29 AM | 17 (12.1%) | 26 (26.0%) |
| 6:30 AM to 6:59 AM | 6 (4.3%) | 8 (8.0%) |
| 7:00 AM to 7:29 AM | 29 (20.7%) | 26 (26.0%) |
| 7:30 AM to 7:59 AM | 11 (7.9%) | 5 (5.0%) |
| 8:00 AM to 8:29 AM | 9 (6.4%) | 17 (17.0%) |
| 8:30 AM to 8:59 AM | 3 (2.1%) | 9 (9.0%) |
| 9:00 AM to 9:59 AM | 36 (25.7%) | 2 (2.0%) |
| 10:00 AM to 10:59 AM | 0 (0.0%) | 0 (0.0%) |
| 11:00 AM to 11:59 AM | 0 (0.0%) | 0 (0.0%) |
| 12:00 PM to 3:59 PM | 5 (3.6%) | 0 (0.0%) |
| 4:00 PM to 11:59 PM | 3 (2.1%) | 7 (7.0%) |
| Total | 140 (100.0%) | 100 (100.0%) |
Housing Occupancy in Briar Creek borough
Occupancy by Ownership in Briar Creek borough
Of the total 286 dwellings in Briar Creek borough, owner-occupied units account for 149 (52.1%), while renter-occupied units make up 137 (47.9%).
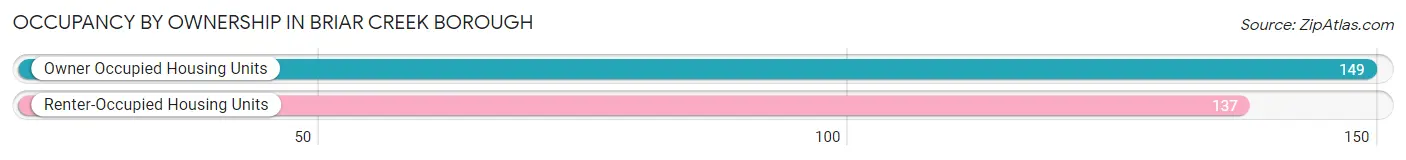
| Occupancy | # Housing Units | % Housing Units |
| Owner Occupied Housing Units | 149 | 52.1% |
| Renter-Occupied Housing Units | 137 | 47.9% |
| Total Occupied Housing Units | 286 | 100.0% |
Occupancy by Household Size in Briar Creek borough
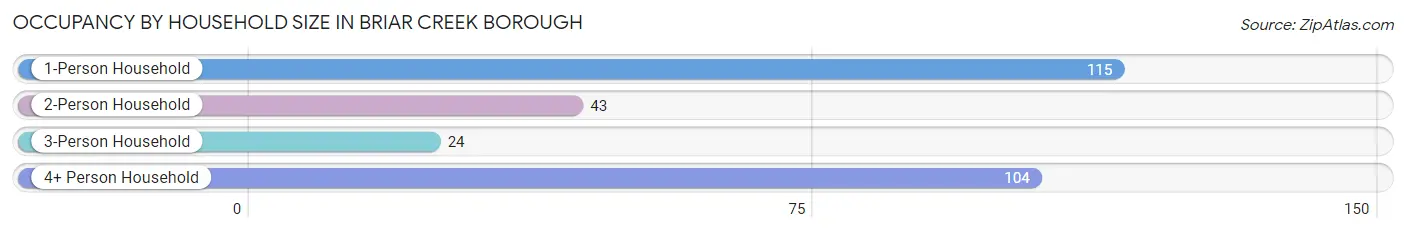
| Household Size | # Housing Units | % Housing Units |
| 1-Person Household | 115 | 40.2% |
| 2-Person Household | 43 | 15.0% |
| 3-Person Household | 24 | 8.4% |
| 4+ Person Household | 104 | 36.4% |
| Total Housing Units | 286 | 100.0% |
Occupancy by Ownership by Household Size in Briar Creek borough
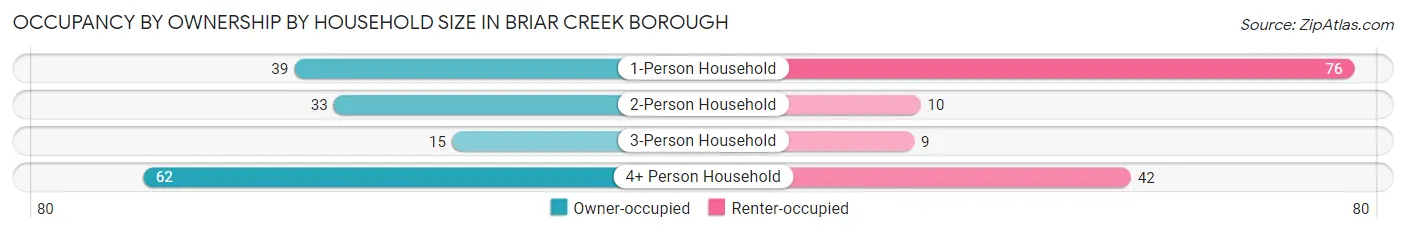
| Household Size | Owner-occupied | Renter-occupied |
| 1-Person Household | 39 (33.9%) | 76 (66.1%) |
| 2-Person Household | 33 (76.7%) | 10 (23.3%) |
| 3-Person Household | 15 (62.5%) | 9 (37.5%) |
| 4+ Person Household | 62 (59.6%) | 42 (40.4%) |
| Total Housing Units | 149 (52.1%) | 137 (47.9%) |
Occupancy by Educational Attainment in Briar Creek borough
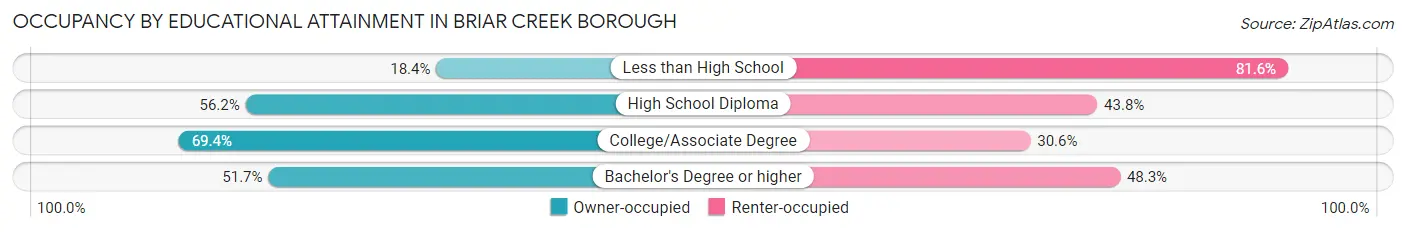
| Household Size | Owner-occupied | Renter-occupied |
| Less than High School | 9 (18.4%) | 40 (81.6%) |
| High School Diploma | 59 (56.2%) | 46 (43.8%) |
| College/Associate Degree | 50 (69.4%) | 22 (30.6%) |
| Bachelor's Degree or higher | 31 (51.7%) | 29 (48.3%) |
Occupancy by Age of Householder in Briar Creek borough
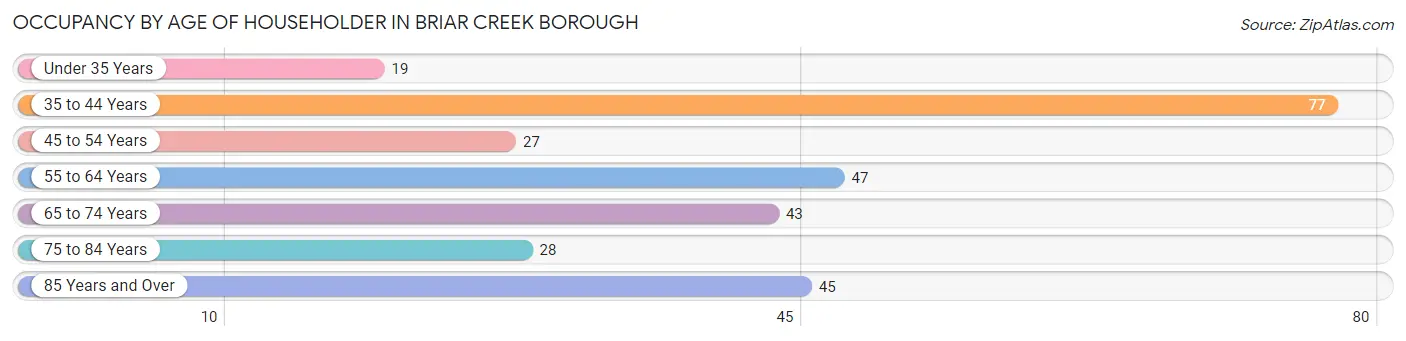
| Age Bracket | # Households | % Households |
| Under 35 Years | 19 | 6.6% |
| 35 to 44 Years | 77 | 26.9% |
| 45 to 54 Years | 27 | 9.4% |
| 55 to 64 Years | 47 | 16.4% |
| 65 to 74 Years | 43 | 15.0% |
| 75 to 84 Years | 28 | 9.8% |
| 85 Years and Over | 45 | 15.7% |
| Total | 286 | 100.0% |
Housing Finances in Briar Creek borough
Median Income by Occupancy in Briar Creek borough
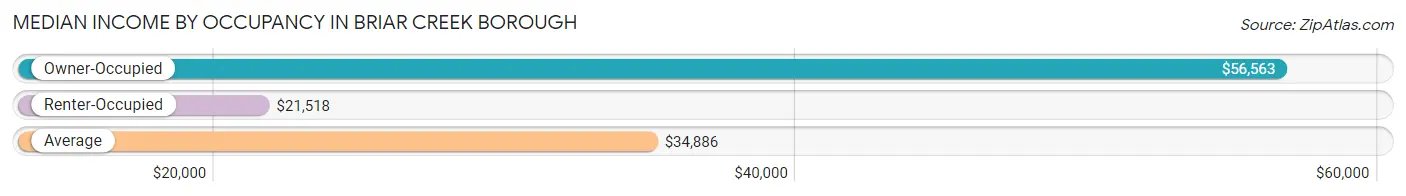
| Occupancy Type | # Households | Median Income |
| Owner-Occupied | 149 (52.1%) | $56,563 |
| Renter-Occupied | 137 (47.9%) | $21,518 |
| Average | 286 (100.0%) | $34,886 |
Occupancy by Householder Income Bracket in Briar Creek borough
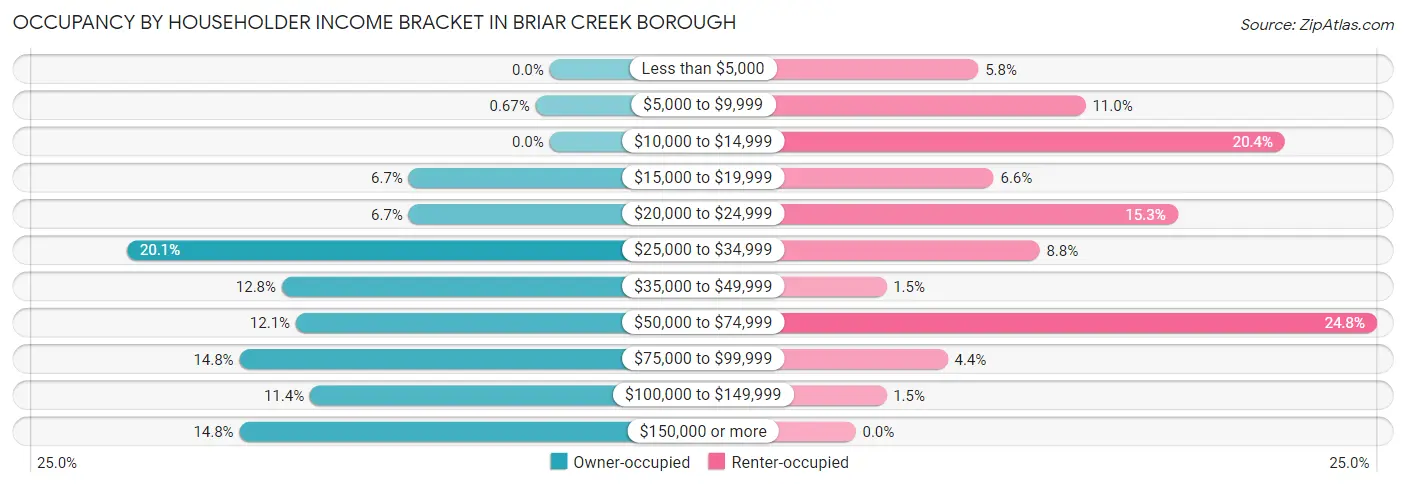
| Income Bracket | Owner-occupied | Renter-occupied |
| Less than $5,000 | 0 (0.0%) | 8 (5.8%) |
| $5,000 to $9,999 | 1 (0.7%) | 15 (11.0%) |
| $10,000 to $14,999 | 0 (0.0%) | 28 (20.4%) |
| $15,000 to $19,999 | 10 (6.7%) | 9 (6.6%) |
| $20,000 to $24,999 | 10 (6.7%) | 21 (15.3%) |
| $25,000 to $34,999 | 30 (20.1%) | 12 (8.8%) |
| $35,000 to $49,999 | 19 (12.8%) | 2 (1.5%) |
| $50,000 to $74,999 | 18 (12.1%) | 34 (24.8%) |
| $75,000 to $99,999 | 22 (14.8%) | 6 (4.4%) |
| $100,000 to $149,999 | 17 (11.4%) | 2 (1.5%) |
| $150,000 or more | 22 (14.8%) | 0 (0.0%) |
| Total | 149 (100.0%) | 137 (100.0%) |
Monthly Housing Cost Tiers in Briar Creek borough
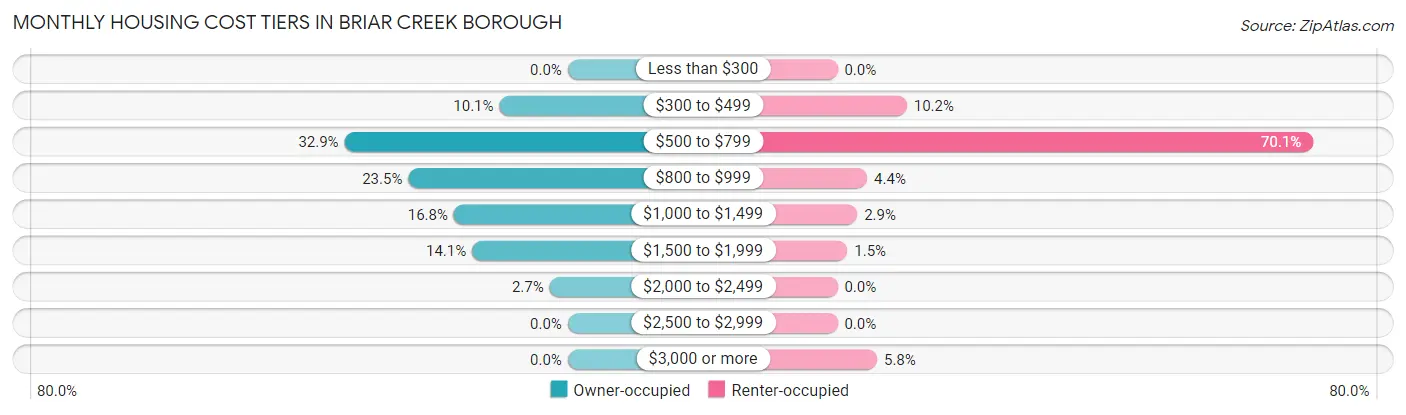
| Monthly Cost | Owner-occupied | Renter-occupied |
| Less than $300 | 0 (0.0%) | 0 (0.0%) |
| $300 to $499 | 15 (10.1%) | 14 (10.2%) |
| $500 to $799 | 49 (32.9%) | 96 (70.1%) |
| $800 to $999 | 35 (23.5%) | 6 (4.4%) |
| $1,000 to $1,499 | 25 (16.8%) | 4 (2.9%) |
| $1,500 to $1,999 | 21 (14.1%) | 2 (1.5%) |
| $2,000 to $2,499 | 4 (2.7%) | 0 (0.0%) |
| $2,500 to $2,999 | 0 (0.0%) | 0 (0.0%) |
| $3,000 or more | 0 (0.0%) | 8 (5.8%) |
| Total | 149 (100.0%) | 137 (100.0%) |
Physical Housing Characteristics in Briar Creek borough
Housing Structures in Briar Creek borough
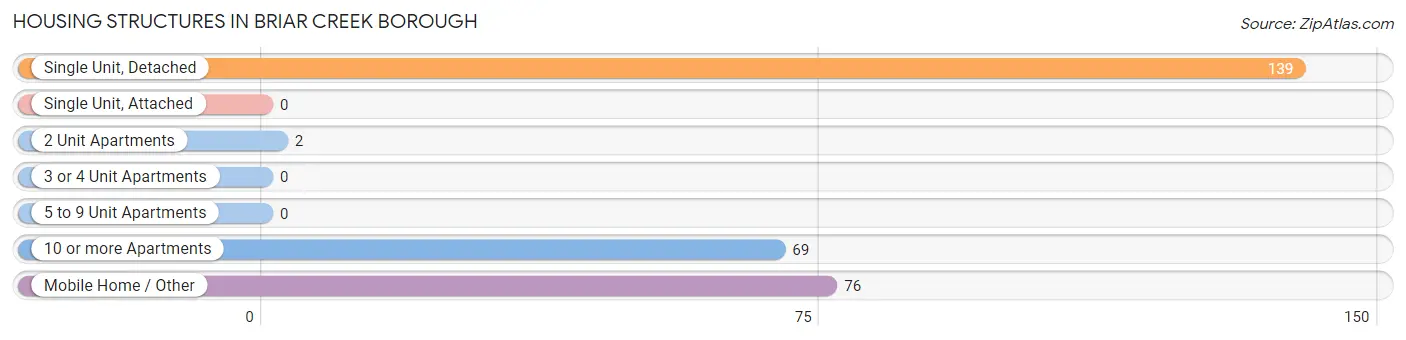
| Structure Type | # Housing Units | % Housing Units |
| Single Unit, Detached | 139 | 48.6% |
| Single Unit, Attached | 0 | 0.0% |
| 2 Unit Apartments | 2 | 0.7% |
| 3 or 4 Unit Apartments | 0 | 0.0% |
| 5 to 9 Unit Apartments | 0 | 0.0% |
| 10 or more Apartments | 69 | 24.1% |
| Mobile Home / Other | 76 | 26.6% |
| Total | 286 | 100.0% |
Housing Structures by Occupancy in Briar Creek borough
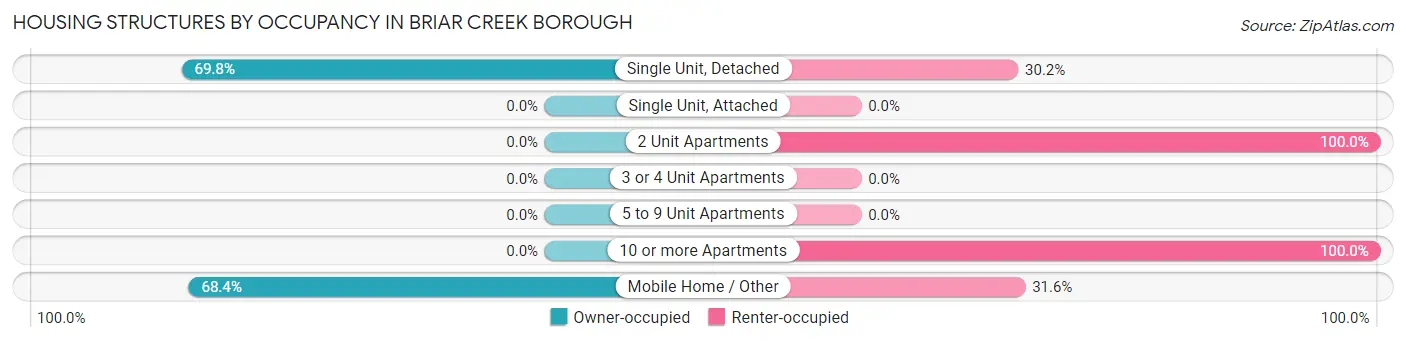
| Structure Type | Owner-occupied | Renter-occupied |
| Single Unit, Detached | 97 (69.8%) | 42 (30.2%) |
| Single Unit, Attached | 0 (0.0%) | 0 (0.0%) |
| 2 Unit Apartments | 0 (0.0%) | 2 (100.0%) |
| 3 or 4 Unit Apartments | 0 (0.0%) | 0 (0.0%) |
| 5 to 9 Unit Apartments | 0 (0.0%) | 0 (0.0%) |
| 10 or more Apartments | 0 (0.0%) | 69 (100.0%) |
| Mobile Home / Other | 52 (68.4%) | 24 (31.6%) |
| Total | 149 (52.1%) | 137 (47.9%) |
Housing Structures by Number of Rooms in Briar Creek borough
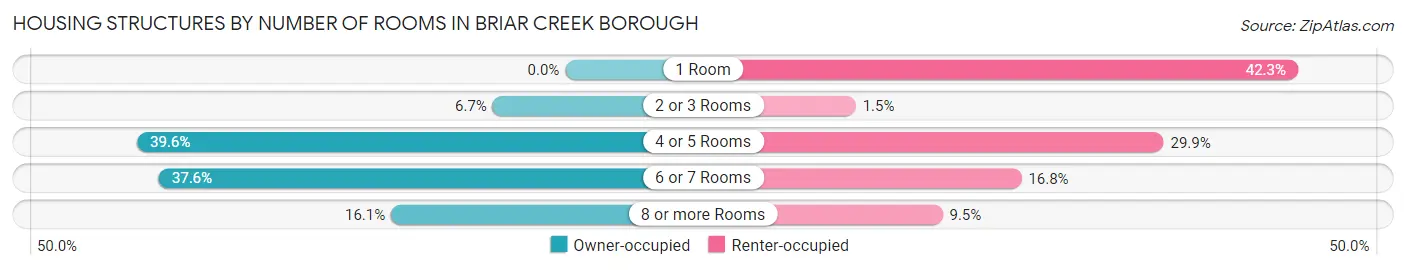
| Number of Rooms | Owner-occupied | Renter-occupied |
| 1 Room | 0 (0.0%) | 58 (42.3%) |
| 2 or 3 Rooms | 10 (6.7%) | 2 (1.5%) |
| 4 or 5 Rooms | 59 (39.6%) | 41 (29.9%) |
| 6 or 7 Rooms | 56 (37.6%) | 23 (16.8%) |
| 8 or more Rooms | 24 (16.1%) | 13 (9.5%) |
| Total | 149 (100.0%) | 137 (100.0%) |
Housing Structure by Heating Type in Briar Creek borough
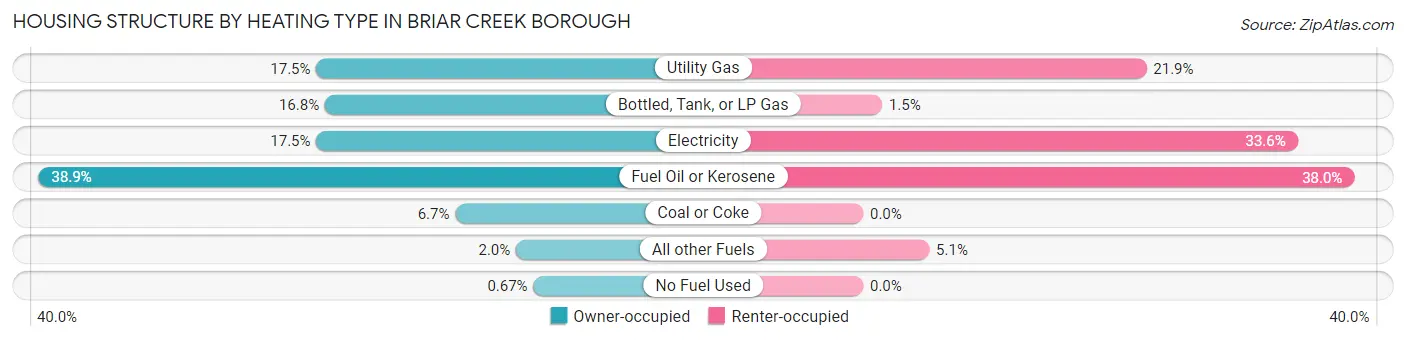
| Heating Type | Owner-occupied | Renter-occupied |
| Utility Gas | 26 (17.4%) | 30 (21.9%) |
| Bottled, Tank, or LP Gas | 25 (16.8%) | 2 (1.5%) |
| Electricity | 26 (17.4%) | 46 (33.6%) |
| Fuel Oil or Kerosene | 58 (38.9%) | 52 (38.0%) |
| Coal or Coke | 10 (6.7%) | 0 (0.0%) |
| All other Fuels | 3 (2.0%) | 7 (5.1%) |
| No Fuel Used | 1 (0.7%) | 0 (0.0%) |
| Total | 149 (100.0%) | 137 (100.0%) |
Household Vehicle Usage in Briar Creek borough
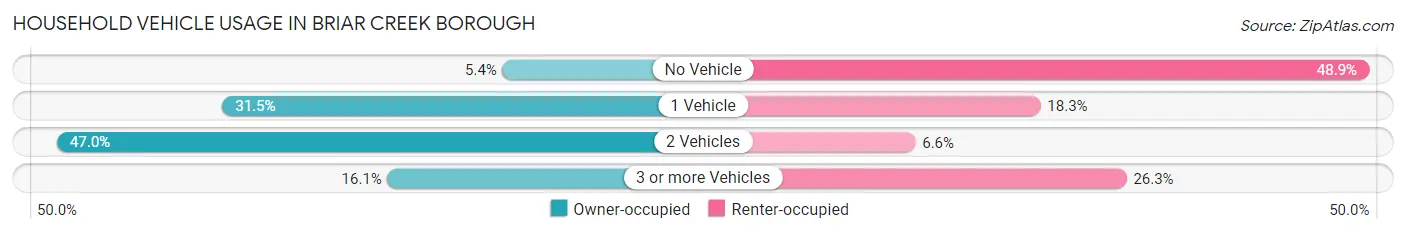
| Vehicles per Household | Owner-occupied | Renter-occupied |
| No Vehicle | 8 (5.4%) | 67 (48.9%) |
| 1 Vehicle | 47 (31.5%) | 25 (18.2%) |
| 2 Vehicles | 70 (47.0%) | 9 (6.6%) |
| 3 or more Vehicles | 24 (16.1%) | 36 (26.3%) |
| Total | 149 (100.0%) | 137 (100.0%) |
Real Estate & Mortgages in Briar Creek borough
Real Estate and Mortgage Overview in Briar Creek borough
| Characteristic | Without Mortgage | With Mortgage |
| Housing Units | 86 | 63 |
| Median Property Value | $166,700 | $194,500 |
| Median Household Income | $34,474 | $22 |
| Monthly Housing Costs | $632 | $0 |
| Real Estate Taxes | $1,333 | $0 |
Property Value by Mortgage Status in Briar Creek borough
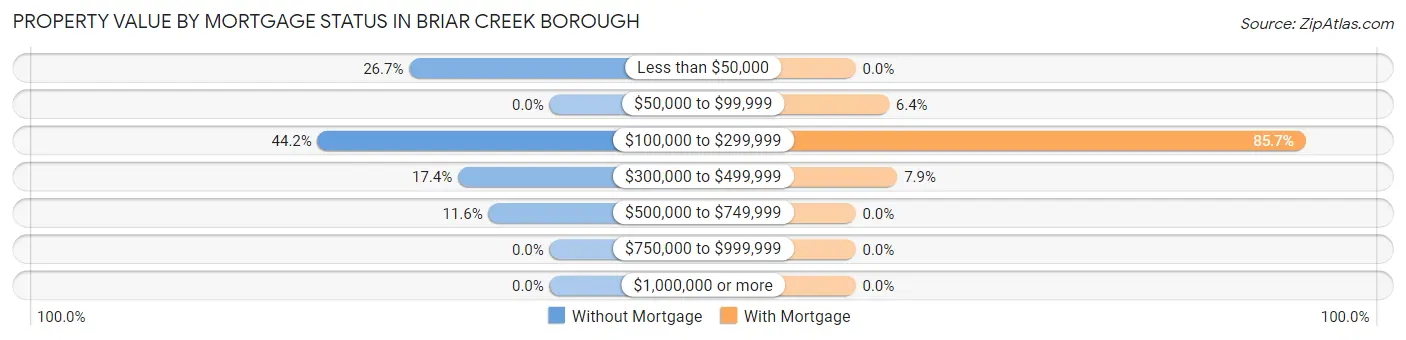
| Property Value | Without Mortgage | With Mortgage |
| Less than $50,000 | 23 (26.7%) | 0 (0.0%) |
| $50,000 to $99,999 | 0 (0.0%) | 4 (6.4%) |
| $100,000 to $299,999 | 38 (44.2%) | 54 (85.7%) |
| $300,000 to $499,999 | 15 (17.4%) | 5 (7.9%) |
| $500,000 to $749,999 | 10 (11.6%) | 0 (0.0%) |
| $750,000 to $999,999 | 0 (0.0%) | 0 (0.0%) |
| $1,000,000 or more | 0 (0.0%) | 0 (0.0%) |
| Total | 86 (100.0%) | 63 (100.0%) |
Household Income by Mortgage Status in Briar Creek borough
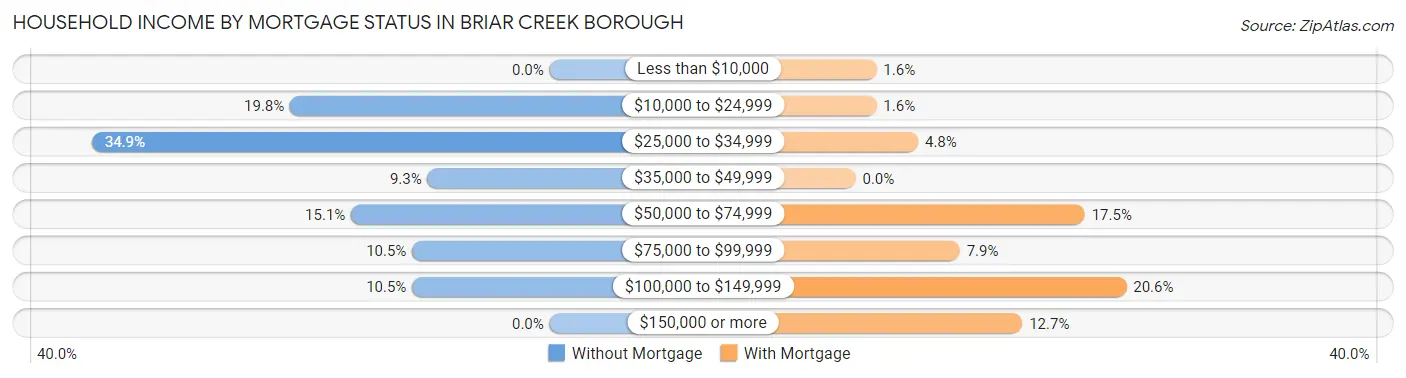
| Household Income | Without Mortgage | With Mortgage |
| Less than $10,000 | 0 (0.0%) | 1 (1.6%) |
| $10,000 to $24,999 | 17 (19.8%) | 1 (1.6%) |
| $25,000 to $34,999 | 30 (34.9%) | 3 (4.8%) |
| $35,000 to $49,999 | 8 (9.3%) | 0 (0.0%) |
| $50,000 to $74,999 | 13 (15.1%) | 11 (17.5%) |
| $75,000 to $99,999 | 9 (10.5%) | 5 (7.9%) |
| $100,000 to $149,999 | 9 (10.5%) | 13 (20.6%) |
| $150,000 or more | 0 (0.0%) | 8 (12.7%) |
| Total | 86 (100.0%) | 63 (100.0%) |
Property Value to Household Income Ratio in Briar Creek borough
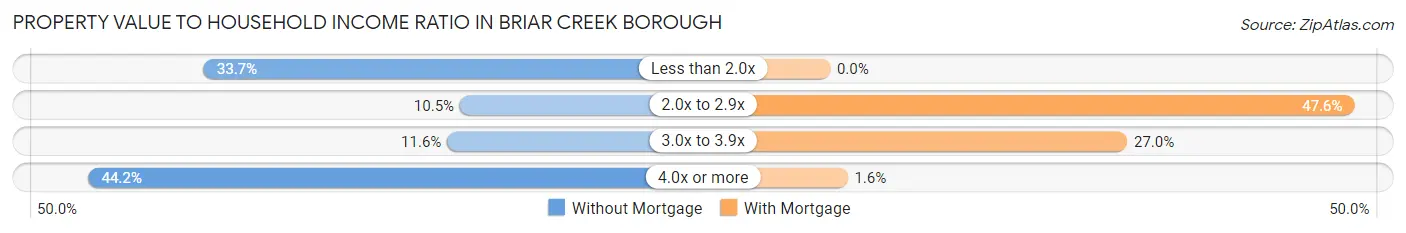
| Value-to-Income Ratio | Without Mortgage | With Mortgage |
| Less than 2.0x | 29 (33.7%) | 0 (0.0%) |
| 2.0x to 2.9x | 9 (10.5%) | 30 (47.6%) |
| 3.0x to 3.9x | 10 (11.6%) | 17 (27.0%) |
| 4.0x or more | 38 (44.2%) | 1 (1.6%) |
| Total | 86 (100.0%) | 63 (100.0%) |
Real Estate Taxes by Mortgage Status in Briar Creek borough
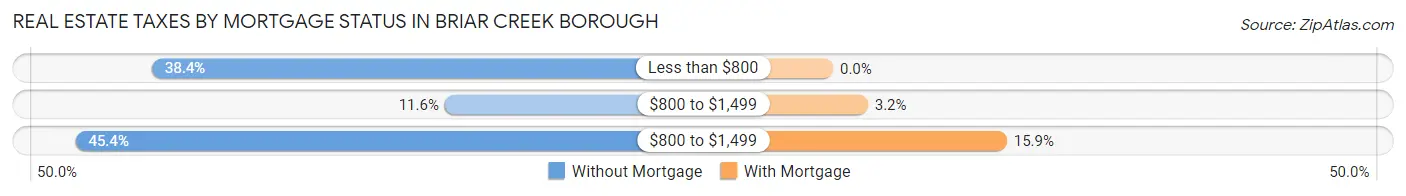
| Property Taxes | Without Mortgage | With Mortgage |
| Less than $800 | 33 (38.4%) | 0 (0.0%) |
| $800 to $1,499 | 10 (11.6%) | 2 (3.2%) |
| $800 to $1,499 | 39 (45.4%) | 10 (15.9%) |
| Total | 86 (100.0%) | 63 (100.0%) |
Health & Disability in Briar Creek borough
Health Insurance Coverage by Age in Briar Creek borough
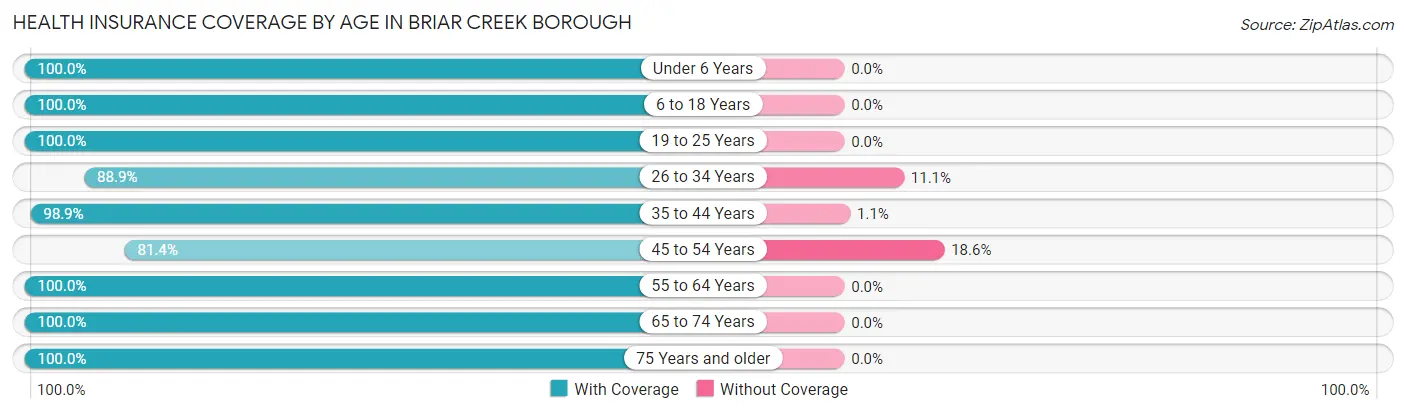
| Age Bracket | With Coverage | Without Coverage |
| Under 6 Years | 55 (100.0%) | 0 (0.0%) |
| 6 to 18 Years | 249 (100.0%) | 0 (0.0%) |
| 19 to 25 Years | 111 (100.0%) | 0 (0.0%) |
| 26 to 34 Years | 40 (88.9%) | 5 (11.1%) |
| 35 to 44 Years | 183 (98.9%) | 2 (1.1%) |
| 45 to 54 Years | 48 (81.4%) | 11 (18.6%) |
| 55 to 64 Years | 71 (100.0%) | 0 (0.0%) |
| 65 to 74 Years | 65 (100.0%) | 0 (0.0%) |
| 75 Years and older | 84 (100.0%) | 0 (0.0%) |
| Total | 906 (98.1%) | 18 (1.9%) |
Health Insurance Coverage by Citizenship Status in Briar Creek borough

| Citizenship Status | With Coverage | Without Coverage |
| Native Born | 55 (100.0%) | 0 (0.0%) |
| Foreign Born, Citizen | 249 (100.0%) | 0 (0.0%) |
| Foreign Born, not a Citizen | 111 (100.0%) | 0 (0.0%) |
Health Insurance Coverage by Household Income in Briar Creek borough
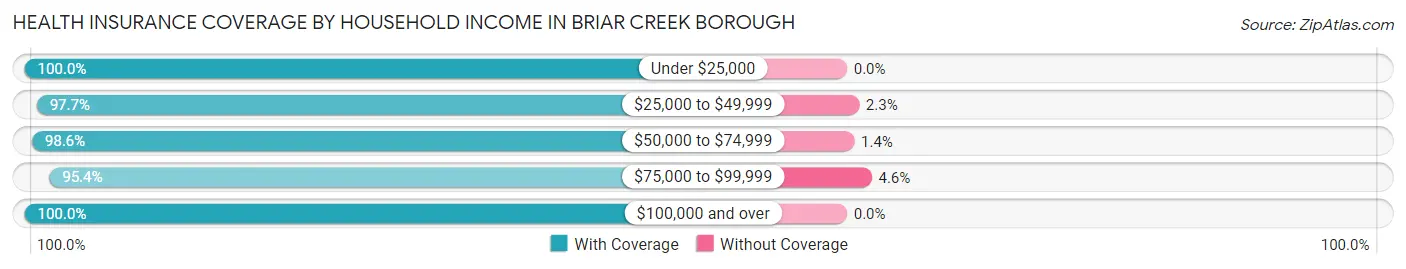
| Household Income | With Coverage | Without Coverage |
| Under $25,000 | 161 (100.0%) | 0 (0.0%) |
| $25,000 to $49,999 | 172 (97.7%) | 4 (2.3%) |
| $50,000 to $74,999 | 287 (98.6%) | 4 (1.4%) |
| $75,000 to $99,999 | 103 (95.4%) | 5 (4.6%) |
| $100,000 and over | 176 (100.0%) | 0 (0.0%) |
Public vs Private Health Insurance Coverage by Age in Briar Creek borough
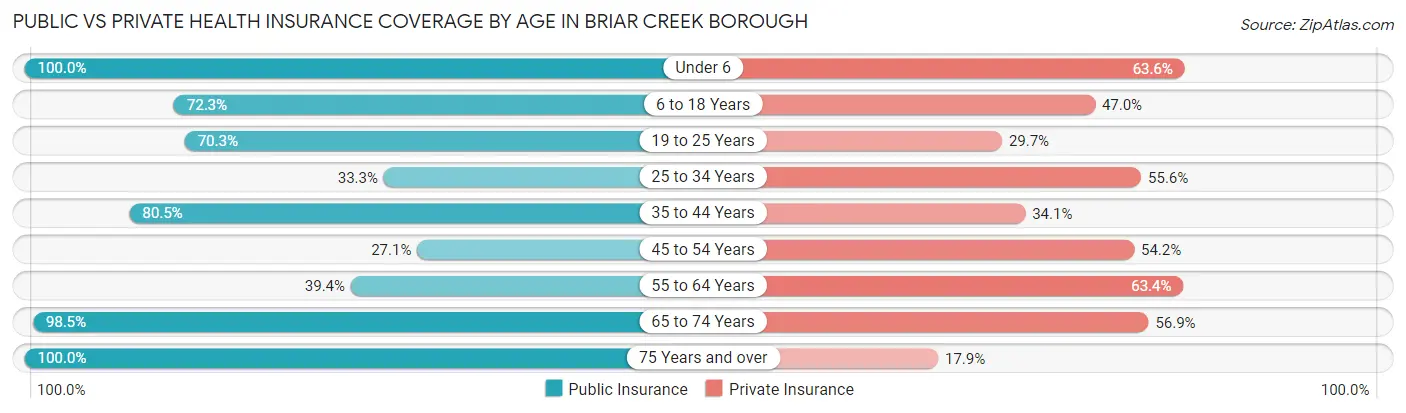
| Age Bracket | Public Insurance | Private Insurance |
| Under 6 | 55 (100.0%) | 35 (63.6%) |
| 6 to 18 Years | 180 (72.3%) | 117 (47.0%) |
| 19 to 25 Years | 78 (70.3%) | 33 (29.7%) |
| 25 to 34 Years | 15 (33.3%) | 25 (55.6%) |
| 35 to 44 Years | 149 (80.5%) | 63 (34.1%) |
| 45 to 54 Years | 16 (27.1%) | 32 (54.2%) |
| 55 to 64 Years | 28 (39.4%) | 45 (63.4%) |
| 65 to 74 Years | 64 (98.5%) | 37 (56.9%) |
| 75 Years and over | 84 (100.0%) | 15 (17.9%) |
| Total | 669 (72.4%) | 402 (43.5%) |
Disability Status by Sex by Age in Briar Creek borough
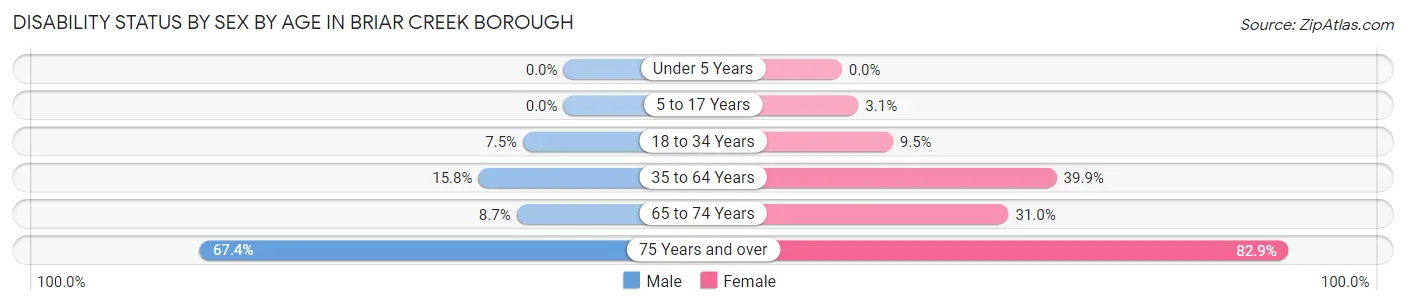
| Age Bracket | Male | Female |
| Under 5 Years | 0 (0.0%) | 0 (0.0%) |
| 5 to 17 Years | 0 (0.0%) | 4 (3.1%) |
| 18 to 34 Years | 3 (7.5%) | 11 (9.5%) |
| 35 to 64 Years | 24 (15.8%) | 65 (39.9%) |
| 65 to 74 Years | 2 (8.7%) | 13 (30.9%) |
| 75 Years and over | 29 (67.4%) | 34 (82.9%) |
Disability Class by Sex by Age in Briar Creek borough
Disability Class: Hearing Difficulty
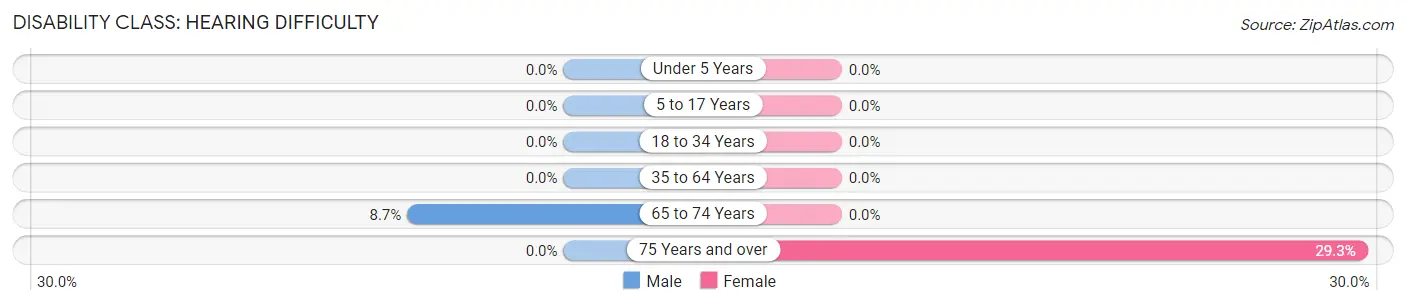
| Age Bracket | Male | Female |
| Under 5 Years | 0 (0.0%) | 0 (0.0%) |
| 5 to 17 Years | 0 (0.0%) | 0 (0.0%) |
| 18 to 34 Years | 0 (0.0%) | 0 (0.0%) |
| 35 to 64 Years | 0 (0.0%) | 0 (0.0%) |
| 65 to 74 Years | 2 (8.7%) | 0 (0.0%) |
| 75 Years and over | 0 (0.0%) | 12 (29.3%) |
Disability Class: Vision Difficulty
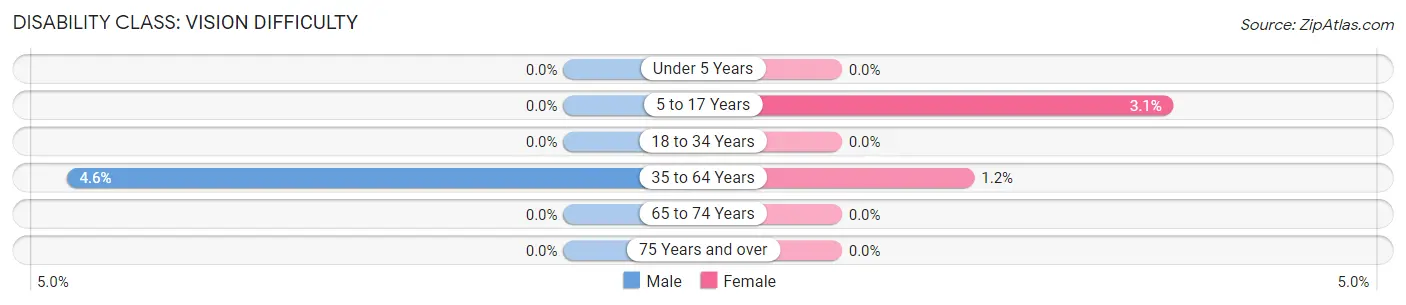
| Age Bracket | Male | Female |
| Under 5 Years | 0 (0.0%) | 0 (0.0%) |
| 5 to 17 Years | 0 (0.0%) | 4 (3.1%) |
| 18 to 34 Years | 0 (0.0%) | 0 (0.0%) |
| 35 to 64 Years | 7 (4.6%) | 2 (1.2%) |
| 65 to 74 Years | 0 (0.0%) | 0 (0.0%) |
| 75 Years and over | 0 (0.0%) | 0 (0.0%) |
Disability Class: Cognitive Difficulty
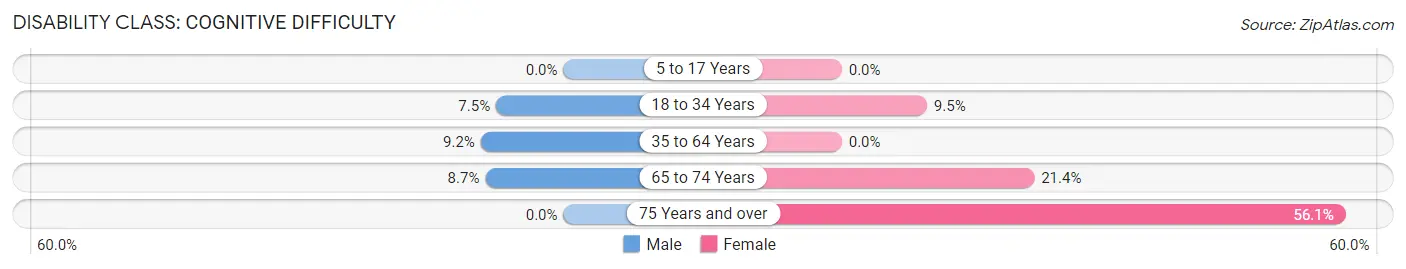
| Age Bracket | Male | Female |
| 5 to 17 Years | 0 (0.0%) | 0 (0.0%) |
| 18 to 34 Years | 3 (7.5%) | 11 (9.5%) |
| 35 to 64 Years | 14 (9.2%) | 0 (0.0%) |
| 65 to 74 Years | 2 (8.7%) | 9 (21.4%) |
| 75 Years and over | 0 (0.0%) | 23 (56.1%) |
Disability Class: Ambulatory Difficulty
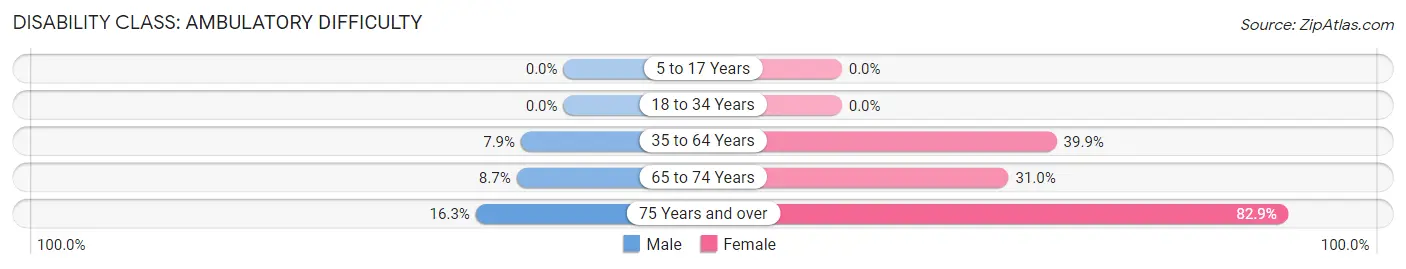
| Age Bracket | Male | Female |
| 5 to 17 Years | 0 (0.0%) | 0 (0.0%) |
| 18 to 34 Years | 0 (0.0%) | 0 (0.0%) |
| 35 to 64 Years | 12 (7.9%) | 65 (39.9%) |
| 65 to 74 Years | 2 (8.7%) | 13 (30.9%) |
| 75 Years and over | 7 (16.3%) | 34 (82.9%) |
Disability Class: Self-Care Difficulty
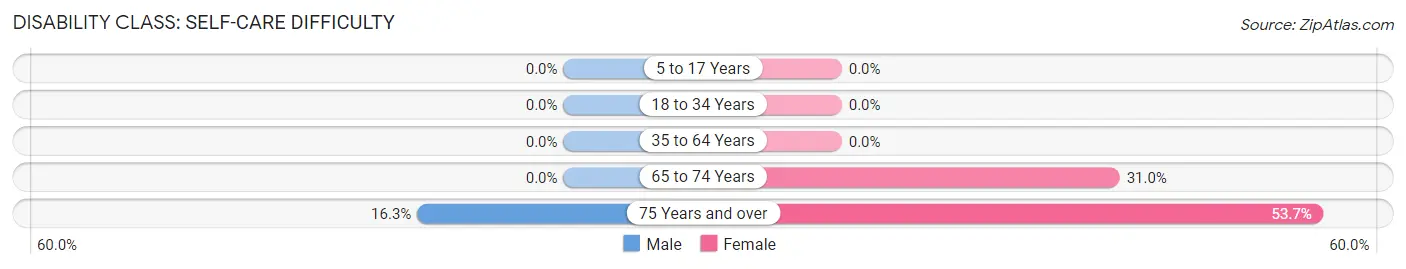
| Age Bracket | Male | Female |
| 5 to 17 Years | 0 (0.0%) | 0 (0.0%) |
| 18 to 34 Years | 0 (0.0%) | 0 (0.0%) |
| 35 to 64 Years | 0 (0.0%) | 0 (0.0%) |
| 65 to 74 Years | 0 (0.0%) | 13 (30.9%) |
| 75 Years and over | 7 (16.3%) | 22 (53.7%) |
Technology Access in Briar Creek borough
Computing Device Access in Briar Creek borough
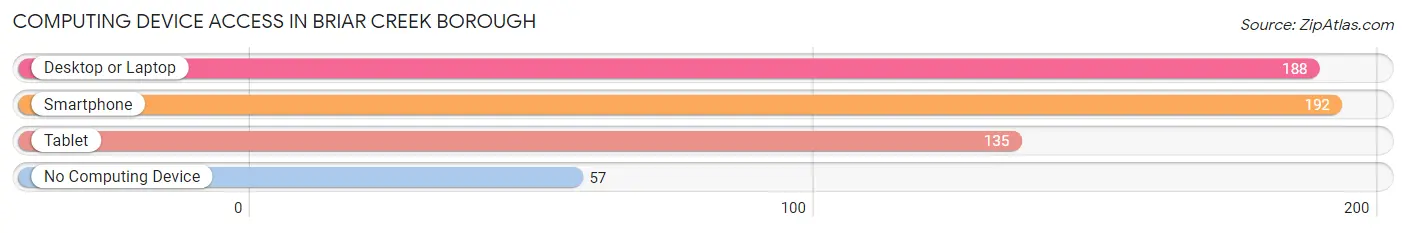
| Device Type | # Households | % Households |
| Desktop or Laptop | 188 | 65.7% |
| Smartphone | 192 | 67.1% |
| Tablet | 135 | 47.2% |
| No Computing Device | 57 | 19.9% |
| Total | 286 | 100.0% |
Internet Access in Briar Creek borough
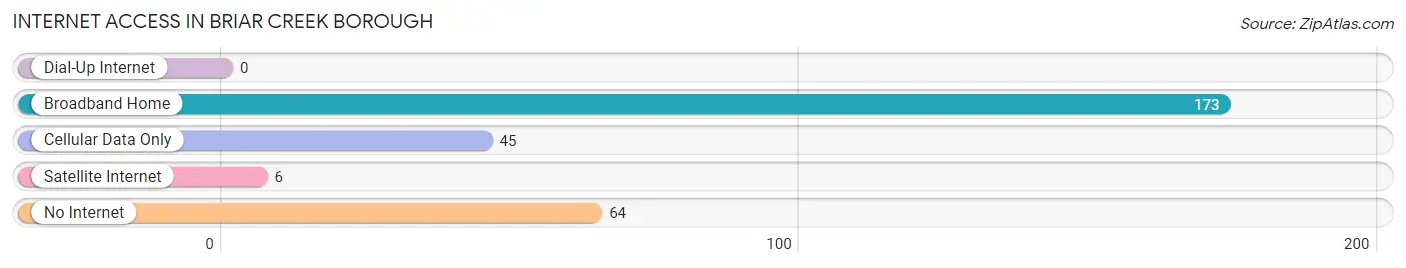
| Internet Type | # Households | % Households |
| Dial-Up Internet | 0 | 0.0% |
| Broadband Home | 173 | 60.5% |
| Cellular Data Only | 45 | 15.7% |
| Satellite Internet | 6 | 2.1% |
| No Internet | 64 | 22.4% |
| Total | 286 | 100.0% |
Briar Creek borough Summary
Briar Creek Borough is a small borough located in Columbia County, Pennsylvania. It is situated in the Susquehanna Valley, approximately 10 miles northwest of Bloomsburg. The borough was incorporated in 1876 and has a population of approximately 1,500 people.
History
The area that is now Briar Creek Borough was originally inhabited by the Susquehannock Indians. The first European settlers arrived in the area in the late 1700s. The town was originally known as “Briar Creek” and was named after the creek that runs through the area. The creek was named for the abundance of briar bushes that grew along its banks.
In 1876, the town was officially incorporated as a borough. The first mayor of Briar Creek was William H. Miller. The town quickly grew and by the early 1900s, it had become a thriving community with a population of over 1,000 people.
The town was home to several businesses, including a sawmill, a gristmill, a tannery, a blacksmith shop, and a general store. The town also had a post office, a school, and several churches.
Geography
Briar Creek Borough is located in the Susquehanna Valley in Columbia County, Pennsylvania. The borough is situated on the banks of the Susquehanna River and is approximately 10 miles northwest of Bloomsburg. The borough is bordered by Briar Creek Township to the north, Catawissa Township to the east, and Fishing Creek Township to the south.
The borough has a total area of 1.2 square miles, all of which is land. The terrain is mostly flat with some rolling hills. The borough is located in a temperate climate zone and experiences four distinct seasons.
Economy
The economy of Briar Creek Borough is largely based on agriculture and tourism. The borough is home to several farms, which produce a variety of crops, including corn, soybeans, hay, and wheat. The borough also has several wineries and breweries, which attract tourists from all over the region.
The borough is also home to several small businesses, including restaurants, retail stores, and service providers. The borough is also home to several manufacturing companies, which produce a variety of products, including furniture, clothing, and electronics.
Demographics
As of the 2010 census, the population of Briar Creek Borough was 1,521. The racial makeup of the borough was 97.3% White, 0.7% African American, 0.2% Native American, 0.3% Asian, 0.1% Pacific Islander, 0.3% from other races, and 1.2% from two or more races. Hispanic or Latino of any race were 1.2% of the population.
The median household income in the borough was $45,938 and the median family income was $51,250. The per capita income was $20,945. About 8.3% of families and 10.2% of the population were below the poverty line, including 14.2% of those under age 18 and 6.2% of those age 65 or over.
Common Questions
What is Per Capita Income in Briar Creek borough?
Per Capita income in Briar Creek borough is $17,561.
What is the Median Family Income in Briar Creek borough?
Median Family Income in Briar Creek borough is $41,000.
What is the Median Household income in Briar Creek borough?
Median Household Income in Briar Creek borough is $34,886.
What is Income or Wage Gap in Briar Creek borough?
Income or Wage Gap in Briar Creek borough is 5.2%.
Women in Briar Creek borough earn 94.8 cents for every dollar earned by a man.
What is Inequality or Gini Index in Briar Creek borough?
Inequality or Gini Index in Briar Creek borough is 0.46.
What is the Total Population of Briar Creek borough?
Total Population of Briar Creek borough is 938.
What is the Total Male Population of Briar Creek borough?
Total Male Population of Briar Creek borough is 398.
What is the Total Female Population of Briar Creek borough?
Total Female Population of Briar Creek borough is 540.
What is the Ratio of Males per 100 Females in Briar Creek borough?
There are 73.70 Males per 100 Females in Briar Creek borough.
What is the Ratio of Females per 100 Males in Briar Creek borough?
There are 135.68 Females per 100 Males in Briar Creek borough.
What is the Median Population Age in Briar Creek borough?
Median Population Age in Briar Creek borough is 35.7 Years.
What is the Average Family Size in Briar Creek borough
Average Family Size in Briar Creek borough is 3.4 People.
What is the Average Household Size in Briar Creek borough
Average Household Size in Briar Creek borough is 3.2 People.
How Large is the Labor Force in Briar Creek borough?
There are 372 People in the Labor Forcein in Briar Creek borough.
What is the Percentage of People in the Labor Force in Briar Creek borough?
56.7% of People are in the Labor Force in Briar Creek borough.
What is the Unemployment Rate in Briar Creek borough?
Unemployment Rate in Briar Creek borough is 33.9%.