Zip Codes with the Highest Percentage of Population Employed in Administrative & Support Services in New Castle, PA
RELATED REPORTS & OPTIONS
Administrative & Support Services
New Castle
Compare Zip Codes
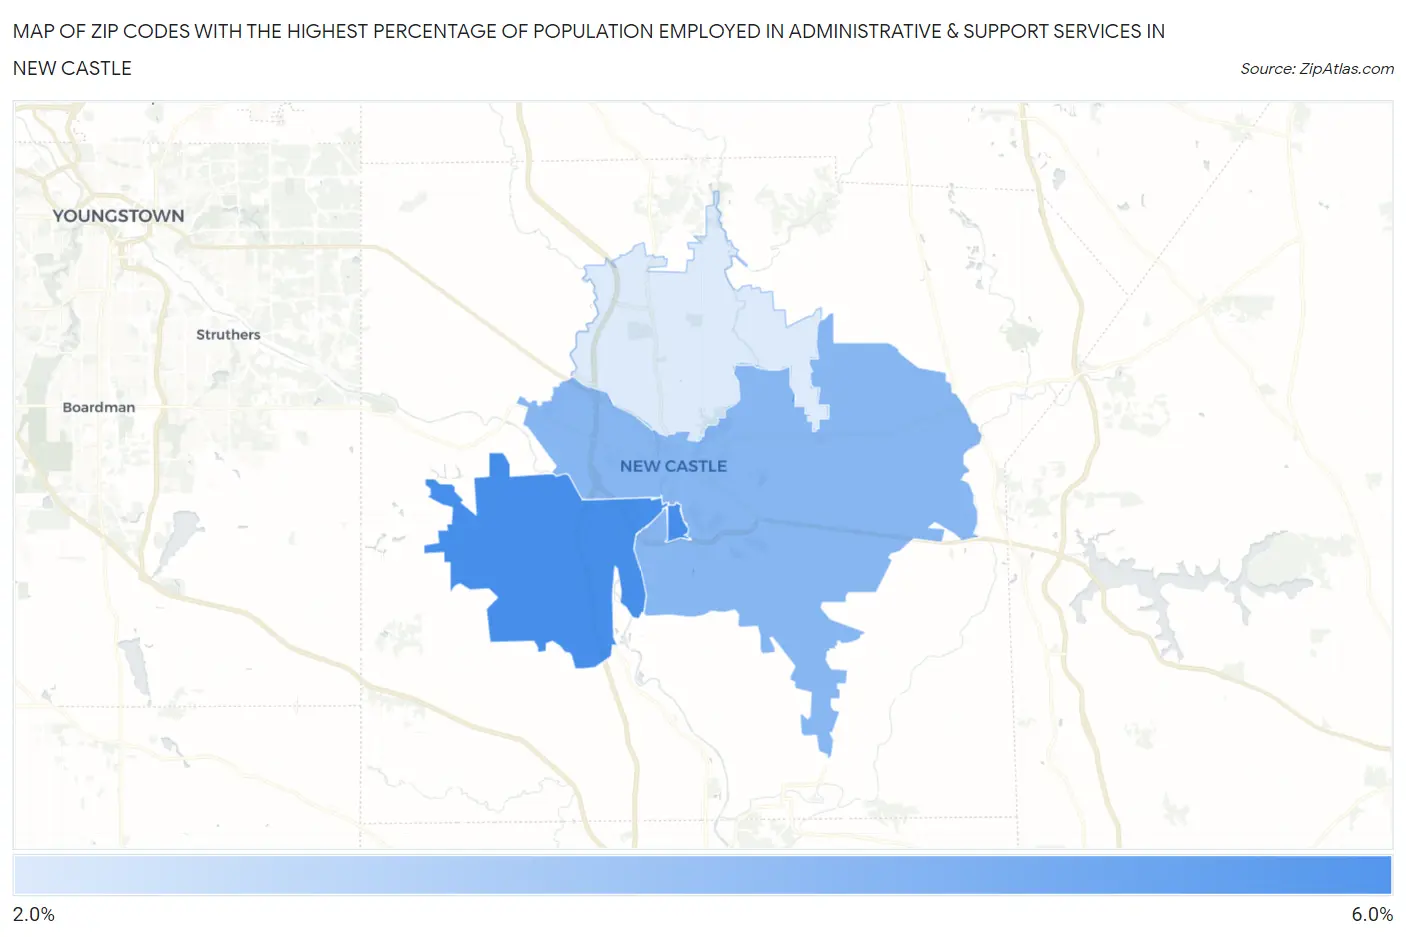
Map of Zip Codes with the Highest Percentage of Population Employed in Administrative & Support Services in New Castle
3.0%
5.2%
Zip Codes with the Highest Percentage of Population Employed in Administrative & Support Services in New Castle, PA
| Zip Code | % Employed | vs State | vs National | |
| 1. | 16102 | 5.2% | 3.6%(+1.59)#317 | 4.1%(+1.02)#6,652 |
| 2. | 16101 | 4.2% | 3.6%(+0.647)#448 | 4.1%(+0.082)#9,693 |
| 3. | 16105 | 3.0% | 3.6%(-0.614)#810 | 4.1%(-1.18)#15,619 |
1
Common Questions
What are the Top Zip Codes with the Highest Percentage of Population Employed in Administrative & Support Services in New Castle, PA?
Top Zip Codes with the Highest Percentage of Population Employed in Administrative & Support Services in New Castle, PA are:
What zip code has the Highest Percentage of Population Employed in Administrative & Support Services in New Castle, PA?
16102 has the Highest Percentage of Population Employed in Administrative & Support Services in New Castle, PA with 5.2%.
What is the Percentage of Population Employed in Administrative & Support Services in New Castle, PA?
Percentage of Population Employed in Administrative & Support Services in New Castle is 4.8%.
What is the Percentage of Population Employed in Administrative & Support Services in Pennsylvania?
Percentage of Population Employed in Administrative & Support Services in Pennsylvania is 3.6%.
What is the Percentage of Population Employed in Administrative & Support Services in the United States?
Percentage of Population Employed in Administrative & Support Services in the United States is 4.1%.