Lansford borough, PA Map & Demographics
Lansford borough Overview
$22,291
PER CAPITA INCOME
$49,609
AVG FAMILY INCOME
$43,045
AVG HOUSEHOLD INCOME
19.6%
WAGE / INCOME GAP [ % ]
80.4¢/ $1
WAGE / INCOME GAP [ $ ]
$12,775
FAMILY INCOME DEFICIT
0.41
INEQUALITY / GINI INDEX
4,129
TOTAL POPULATION
2,069
MALE POPULATION
2,060
FEMALE POPULATION
100.44
MALES / 100 FEMALES
99.57
FEMALES / 100 MALES
37.1
MEDIAN AGE
3.0
AVG FAMILY SIZE
2.4
AVG HOUSEHOLD SIZE
1,818
LABOR FORCE [ PEOPLE ]
58.3%
PERCENT IN LABOR FORCE
19.6%
UNEMPLOYMENT RATE
Income in Lansford borough
Income Overview in Lansford borough
Per Capita Income in Lansford borough is $22,291, while median incomes of families and households are $49,609 and $43,045 respectively.
| Characteristic | Number | Measure |
| Per Capita Income | 4,129 | $22,291 |
| Median Family Income | 1,067 | $49,609 |
| Mean Family Income | 1,067 | $56,757 |
| Median Household Income | 1,691 | $43,045 |
| Mean Household Income | 1,691 | $53,752 |
| Income Deficit | 1,067 | $12,775 |
| Wage / Income Gap (%) | 4,129 | 19.62% |
| Wage / Income Gap ($) | 4,129 | 80.38¢ per $1 |
| Gini / Inequality Index | 4,129 | 0.41 |
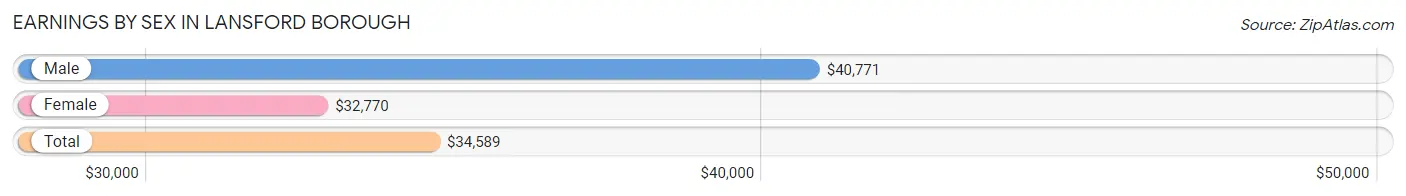
Earnings by Sex in Lansford borough
Average Earnings in Lansford borough are $34,589, $40,771 for men and $32,770 for women, a difference of 19.6%.
| Sex | Number | Average Earnings |
| Male | 953 (52.9%) | $40,771 |
| Female | 847 (47.1%) | $32,770 |
| Total | 1,800 (100.0%) | $34,589 |
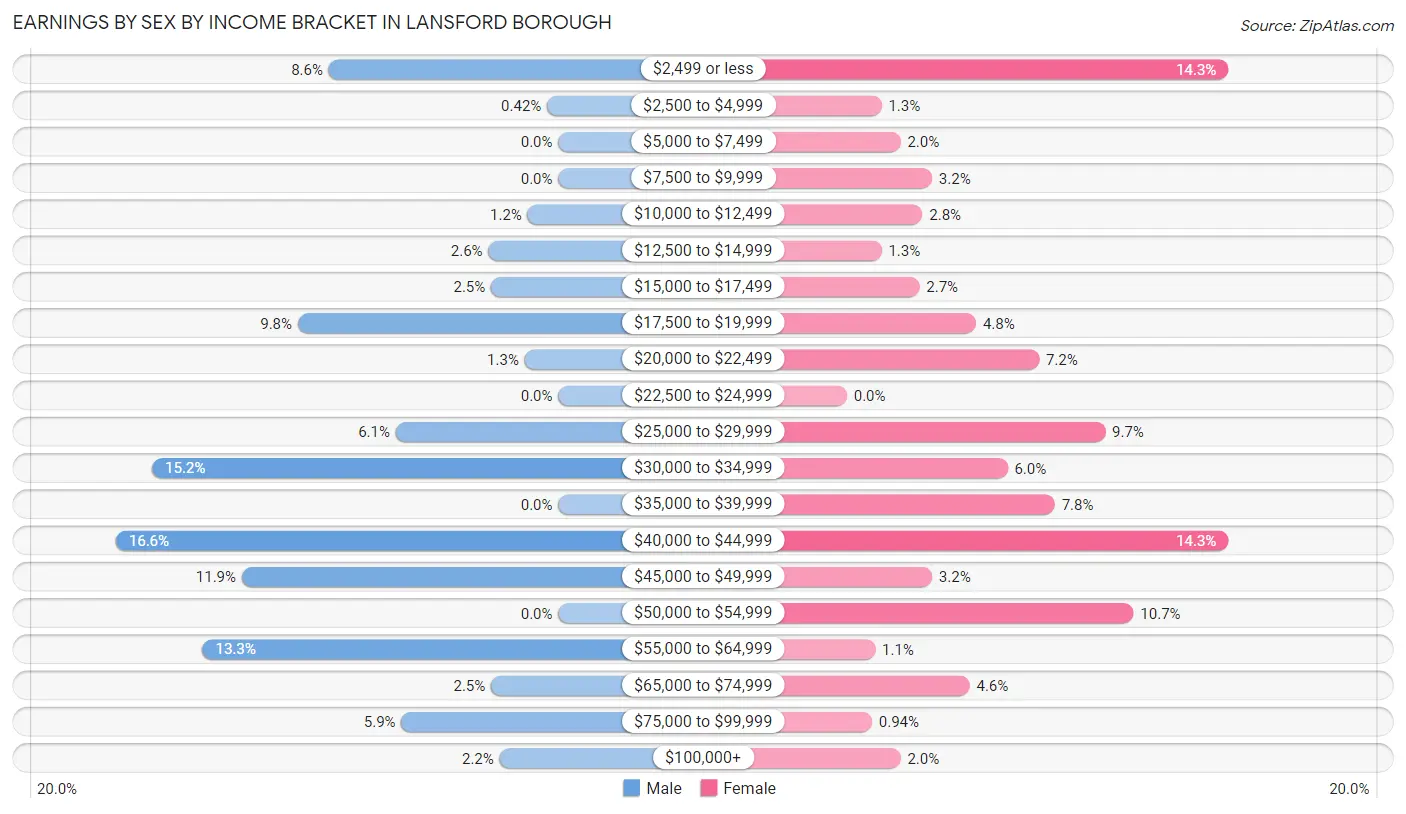
Earnings by Sex by Income Bracket in Lansford borough
The most common earnings brackets in Lansford borough are $40,000 to $44,999 for men (158 | 16.6%) and $2,499 or less for women (121 | 14.3%).
| Income | Male | Female |
| $2,499 or less | 82 (8.6%) | 121 (14.3%) |
| $2,500 to $4,999 | 4 (0.4%) | 11 (1.3%) |
| $5,000 to $7,499 | 0 (0.0%) | 17 (2.0%) |
| $7,500 to $9,999 | 0 (0.0%) | 27 (3.2%) |
| $10,000 to $12,499 | 11 (1.1%) | 24 (2.8%) |
| $12,500 to $14,999 | 25 (2.6%) | 11 (1.3%) |
| $15,000 to $17,499 | 24 (2.5%) | 23 (2.7%) |
| $17,500 to $19,999 | 93 (9.8%) | 41 (4.8%) |
| $20,000 to $22,499 | 12 (1.3%) | 61 (7.2%) |
| $22,500 to $24,999 | 0 (0.0%) | 0 (0.0%) |
| $25,000 to $29,999 | 58 (6.1%) | 82 (9.7%) |
| $30,000 to $34,999 | 145 (15.2%) | 51 (6.0%) |
| $35,000 to $39,999 | 0 (0.0%) | 66 (7.8%) |
| $40,000 to $44,999 | 158 (16.6%) | 121 (14.3%) |
| $45,000 to $49,999 | 113 (11.9%) | 27 (3.2%) |
| $50,000 to $54,999 | 0 (0.0%) | 91 (10.7%) |
| $55,000 to $64,999 | 127 (13.3%) | 9 (1.1%) |
| $65,000 to $74,999 | 24 (2.5%) | 39 (4.6%) |
| $75,000 to $99,999 | 56 (5.9%) | 8 (0.9%) |
| $100,000+ | 21 (2.2%) | 17 (2.0%) |
| Total | 953 (100.0%) | 847 (100.0%) |
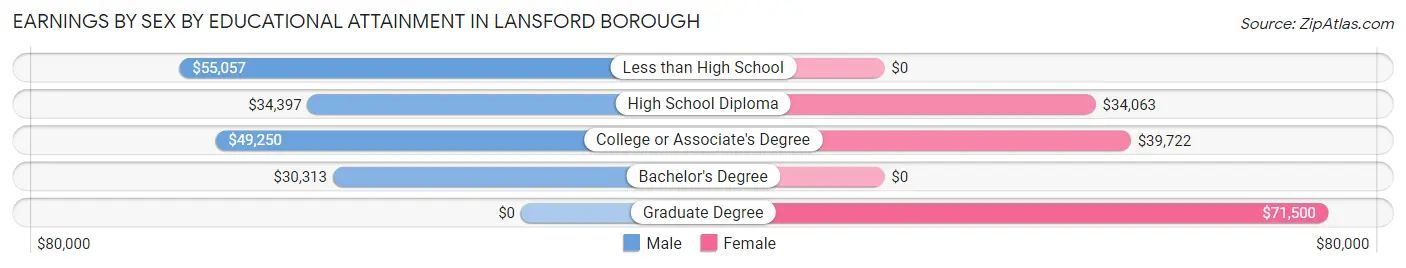
Earnings by Sex by Educational Attainment in Lansford borough
Average earnings in Lansford borough are $41,986 for men and $37,973 for women, a difference of 9.6%. Men with an educational attainment of less than high school enjoy the highest average annual earnings of $55,057, while those with bachelor's degree education earn the least with $30,313. Women with an educational attainment of graduate degree earn the most with the average annual earnings of $71,500, while those with high school diploma education have the smallest earnings of $34,063.
| Educational Attainment | Male Income | Female Income |
| Less than High School | $55,057 | $0 |
| High School Diploma | $34,397 | $34,063 |
| College or Associate's Degree | $49,250 | $39,722 |
| Bachelor's Degree | $30,313 | $0 |
| Graduate Degree | - | - |
| Total | $41,986 | $37,973 |
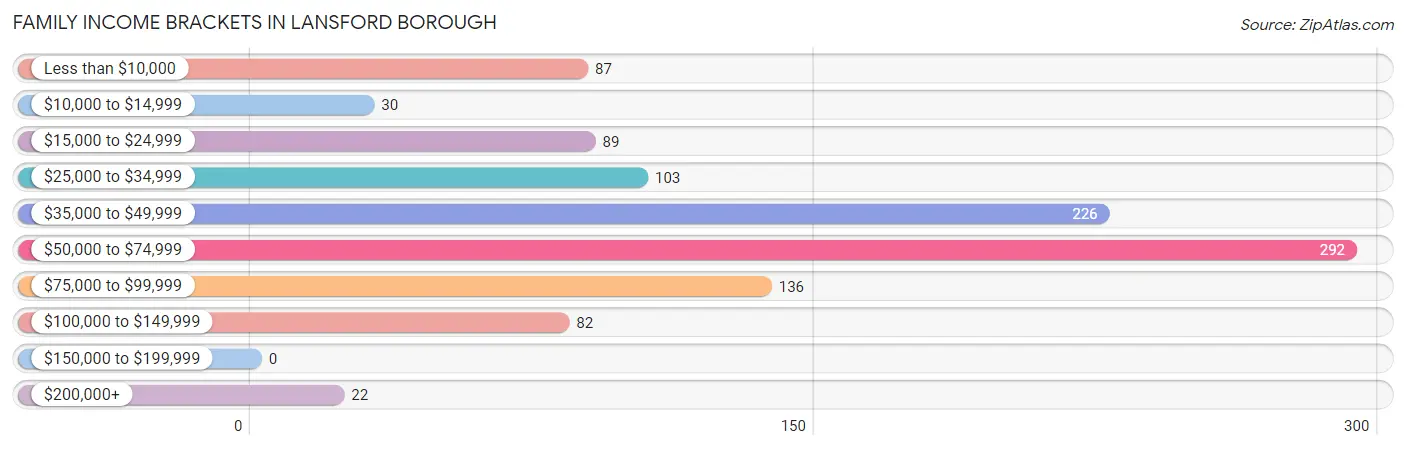
Family Income in Lansford borough
Family Income Brackets in Lansford borough
According to the Lansford borough family income data, there are 292 families falling into the $50,000 to $74,999 income range, which is the most common income bracket and makes up 27.4% of all families.
| Income Bracket | # Families | % Families |
| Less than $10,000 | 87 | 8.2% |
| $10,000 to $14,999 | 30 | 2.8% |
| $15,000 to $24,999 | 89 | 8.3% |
| $25,000 to $34,999 | 103 | 9.7% |
| $35,000 to $49,999 | 226 | 21.2% |
| $50,000 to $74,999 | 292 | 27.4% |
| $75,000 to $99,999 | 136 | 12.7% |
| $100,000 to $149,999 | 82 | 7.7% |
| $150,000 to $199,999 | 0 | 0.0% |
| $200,000+ | 22 | 2.1% |
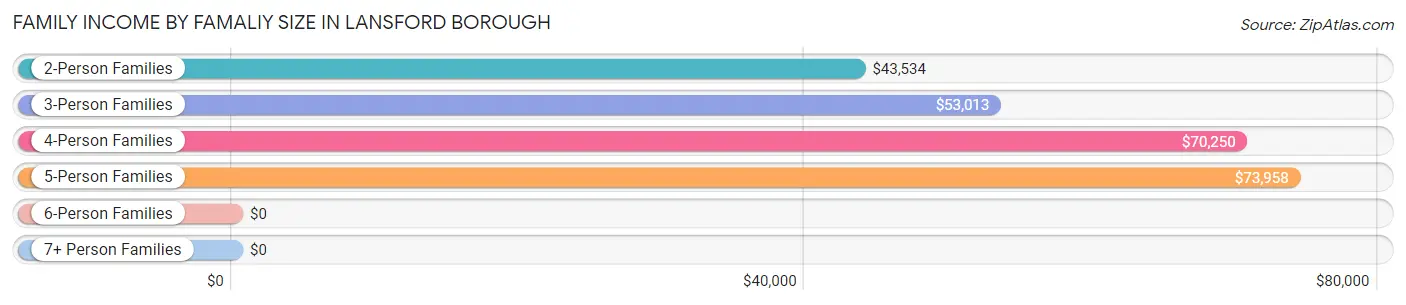
Family Income by Famaliy Size in Lansford borough
5-person families (166 | 15.6%) account for the highest median family income in Lansford borough with $73,958 per family, while 2-person families (431 | 40.4%) have the highest median income of $21,767 per family member.
| Income Bracket | # Families | Median Income |
| 2-Person Families | 431 (40.4%) | $43,534 |
| 3-Person Families | 391 (36.6%) | $53,013 |
| 4-Person Families | 68 (6.4%) | $70,250 |
| 5-Person Families | 166 (15.6%) | $73,958 |
| 6-Person Families | 0 (0.0%) | $0 |
| 7+ Person Families | 11 (1.0%) | $0 |
| Total | 1,067 (100.0%) | $49,609 |
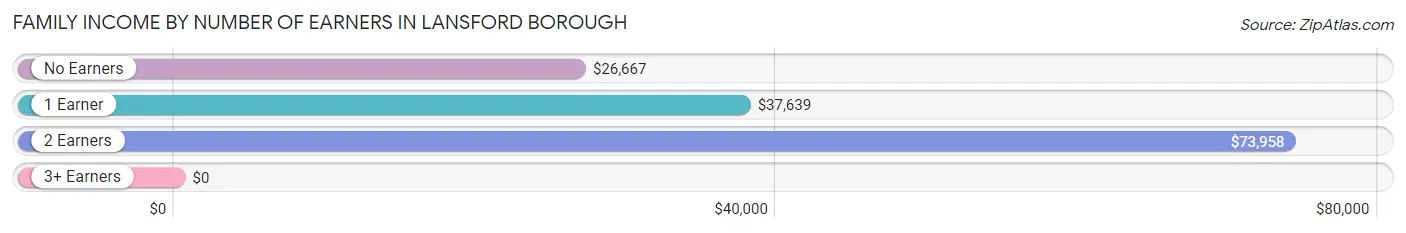
Family Income by Number of Earners in Lansford borough
| Number of Earners | # Families | Median Income |
| No Earners | 168 (15.8%) | $26,667 |
| 1 Earner | 437 (41.0%) | $37,639 |
| 2 Earners | 432 (40.5%) | $73,958 |
| 3+ Earners | 30 (2.8%) | $0 |
| Total | 1,067 (100.0%) | $49,609 |
Household Income in Lansford borough
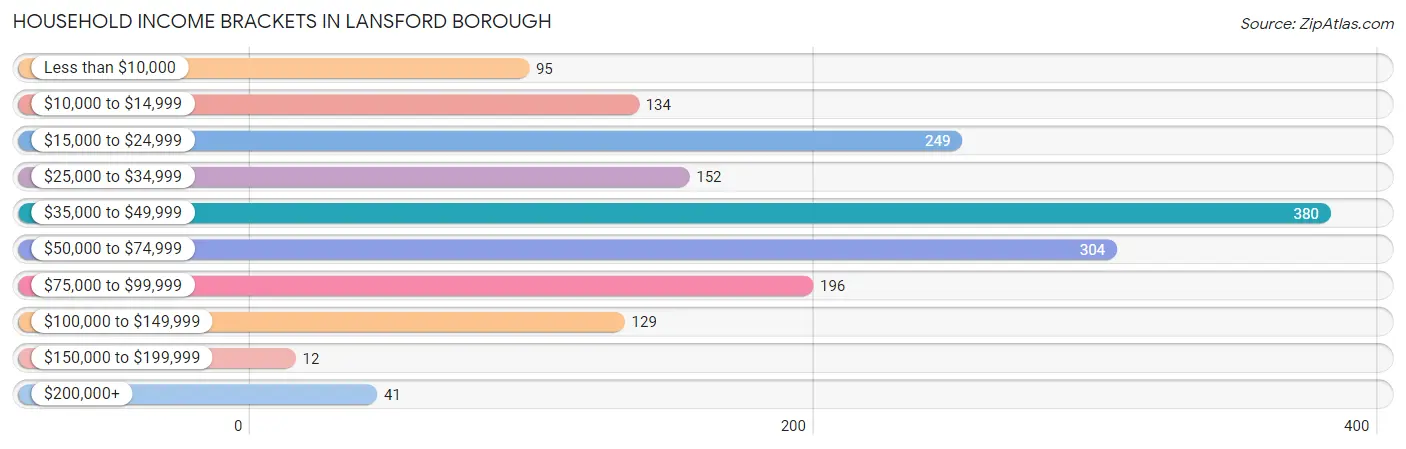
Household Income Brackets in Lansford borough
With 380 households falling in the category, the $35,000 to $49,999 income range is the most frequent in Lansford borough, accounting for 22.5% of all households. In contrast, only 12 households (0.7%) fall into the $150,000 to $199,999 income bracket, making it the least populous group.
| Income Bracket | # Households | % Households |
| Less than $10,000 | 95 | 5.6% |
| $10,000 to $14,999 | 134 | 7.9% |
| $15,000 to $24,999 | 249 | 14.7% |
| $25,000 to $34,999 | 152 | 9.0% |
| $35,000 to $49,999 | 380 | 22.5% |
| $50,000 to $74,999 | 304 | 18.0% |
| $75,000 to $99,999 | 196 | 11.6% |
| $100,000 to $149,999 | 129 | 7.6% |
| $150,000 to $199,999 | 12 | 0.7% |
| $200,000+ | 41 | 2.4% |
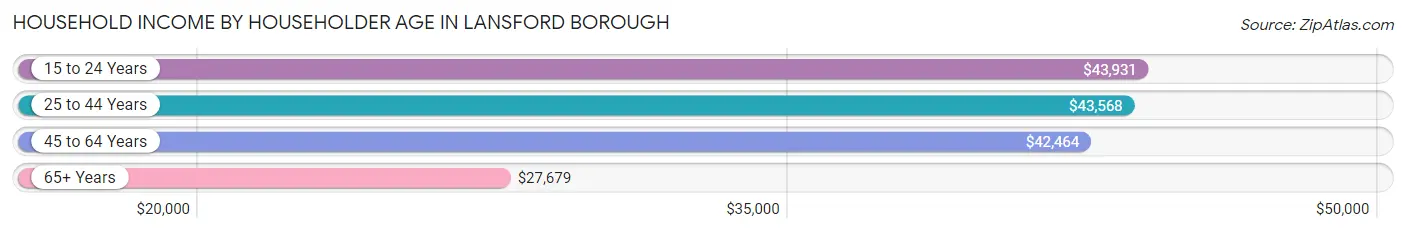
Household Income by Householder Age in Lansford borough
The median household income in Lansford borough is $43,045, with the highest median household income of $43,931 found in the 15 to 24 years age bracket for the primary householder. A total of 133 households (7.9%) fall into this category. Meanwhile, the 65+ years age bracket for the primary householder has the lowest median household income of $27,679, with 388 households (23.0%) in this group.
| Income Bracket | # Households | Median Income |
| 15 to 24 Years | 133 (7.9%) | $43,931 |
| 25 to 44 Years | 533 (31.5%) | $43,568 |
| 45 to 64 Years | 637 (37.7%) | $42,464 |
| 65+ Years | 388 (23.0%) | $27,679 |
| Total | 1,691 (100.0%) | $43,045 |
Poverty in Lansford borough
Income Below Poverty by Sex and Age in Lansford borough
With 15.0% poverty level for males and 26.7% for females among the residents of Lansford borough, under 5 year old males and under 5 year old females are the most vulnerable to poverty, with 137 males (65.5%) and 156 females (76.5%) in their respective age groups living below the poverty level.
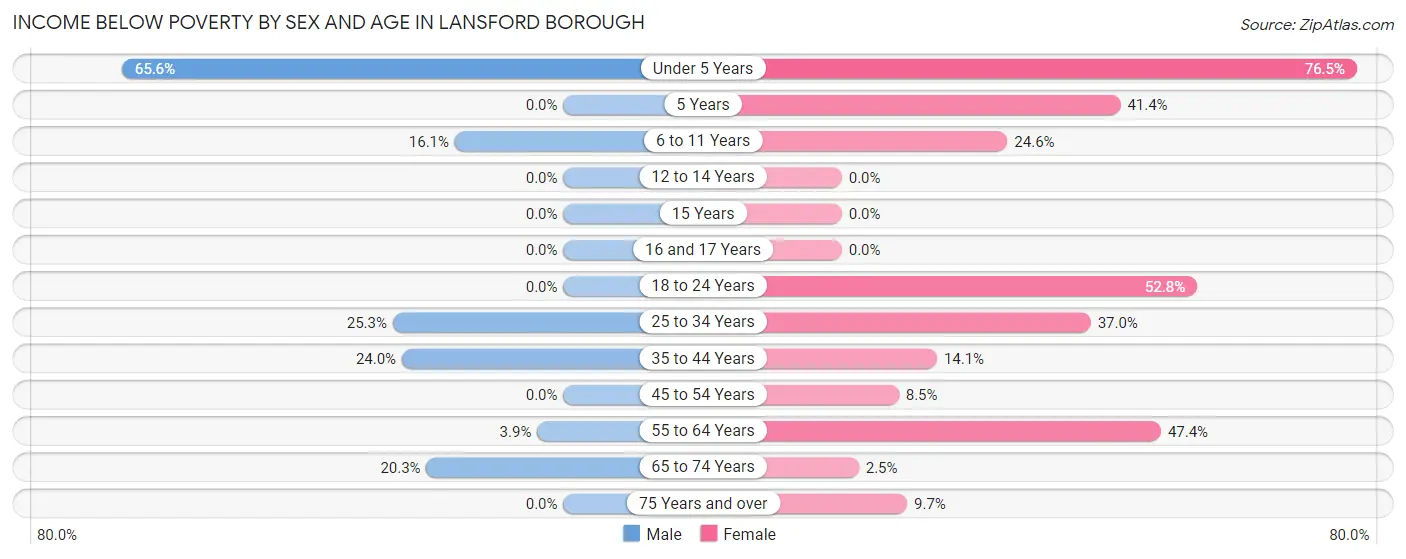
| Age Bracket | Male | Female |
| Under 5 Years | 137 (65.5%) | 156 (76.5%) |
| 5 Years | 0 (0.0%) | 12 (41.4%) |
| 6 to 11 Years | 34 (16.1%) | 15 (24.6%) |
| 12 to 14 Years | 0 (0.0%) | 0 (0.0%) |
| 15 Years | 0 (0.0%) | 0 (0.0%) |
| 16 and 17 Years | 0 (0.0%) | 0 (0.0%) |
| 18 to 24 Years | 0 (0.0%) | 115 (52.7%) |
| 25 to 34 Years | 39 (25.3%) | 68 (37.0%) |
| 35 to 44 Years | 64 (24.0%) | 39 (14.1%) |
| 45 to 54 Years | 0 (0.0%) | 22 (8.5%) |
| 55 to 64 Years | 12 (3.9%) | 100 (47.4%) |
| 65 to 74 Years | 25 (20.3%) | 6 (2.5%) |
| 75 Years and over | 0 (0.0%) | 16 (9.7%) |
| Total | 311 (15.0%) | 549 (26.7%) |
Income Above Poverty by Sex and Age in Lansford borough
According to the poverty statistics in Lansford borough, males aged 12 to 14 years and females aged 12 to 14 years are the age groups that are most secure financially, with 100.0% of males and 100.0% of females in these age groups living above the poverty line.
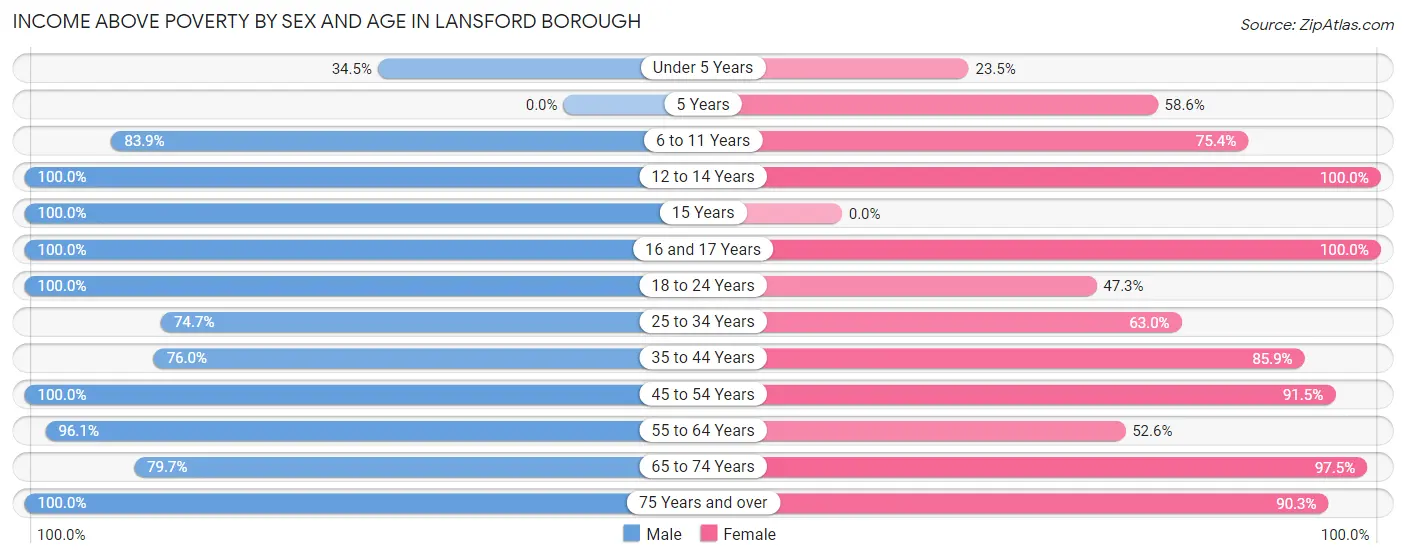
| Age Bracket | Male | Female |
| Under 5 Years | 72 (34.4%) | 48 (23.5%) |
| 5 Years | 0 (0.0%) | 17 (58.6%) |
| 6 to 11 Years | 177 (83.9%) | 46 (75.4%) |
| 12 to 14 Years | 63 (100.0%) | 193 (100.0%) |
| 15 Years | 41 (100.0%) | 0 (0.0%) |
| 16 and 17 Years | 52 (100.0%) | 21 (100.0%) |
| 18 to 24 Years | 322 (100.0%) | 103 (47.2%) |
| 25 to 34 Years | 115 (74.7%) | 116 (63.0%) |
| 35 to 44 Years | 203 (76.0%) | 237 (85.9%) |
| 45 to 54 Years | 195 (100.0%) | 238 (91.5%) |
| 55 to 64 Years | 297 (96.1%) | 111 (52.6%) |
| 65 to 74 Years | 98 (79.7%) | 232 (97.5%) |
| 75 Years and over | 123 (100.0%) | 149 (90.3%) |
| Total | 1,758 (85.0%) | 1,511 (73.4%) |
Income Below Poverty Among Married-Couple Families in Lansford borough
The poverty statistics for married-couple families in Lansford borough show that 9.8% or 56 of the total 571 families live below the poverty line. Families with 3 or 4 children have the highest poverty rate of 78.6%, comprising of 44 families. On the other hand, families with 1 or 2 children have the lowest poverty rate of 0.0%, which includes 0 families.
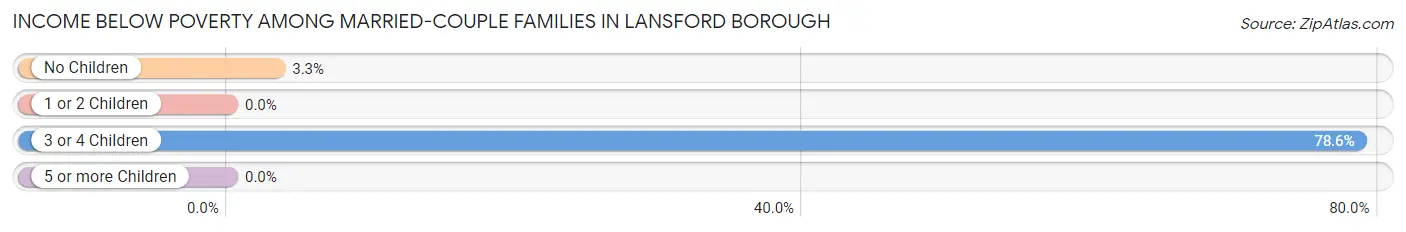
| Children | Above Poverty | Below Poverty |
| No Children | 353 (96.7%) | 12 (3.3%) |
| 1 or 2 Children | 150 (100.0%) | 0 (0.0%) |
| 3 or 4 Children | 12 (21.4%) | 44 (78.6%) |
| 5 or more Children | 0 (0.0%) | 0 (0.0%) |
| Total | 515 (90.2%) | 56 (9.8%) |
Income Below Poverty Among Single-Parent Households in Lansford borough
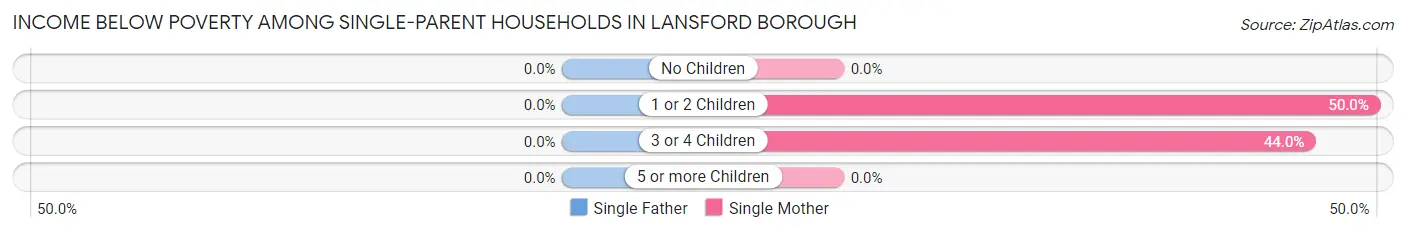
| Children | Single Father | Single Mother |
| No Children | 0 (0.0%) | 0 (0.0%) |
| 1 or 2 Children | 0 (0.0%) | 110 (50.0%) |
| 3 or 4 Children | 0 (0.0%) | 11 (44.0%) |
| 5 or more Children | 0 (0.0%) | 0 (0.0%) |
| Total | 0 (0.0%) | 121 (34.9%) |
Income Below Poverty Among Married-Couple vs Single-Parent Households in Lansford borough
The poverty data for Lansford borough shows that 56 of the married-couple family households (9.8%) and 121 of the single-parent households (24.4%) are living below the poverty level. Within the married-couple family households, those with 3 or 4 children have the highest poverty rate, with 44 households (78.6%) falling below the poverty line. Among the single-parent households, those with 3 or 4 children have the highest poverty rate, with 11 household (44.0%) living below poverty.
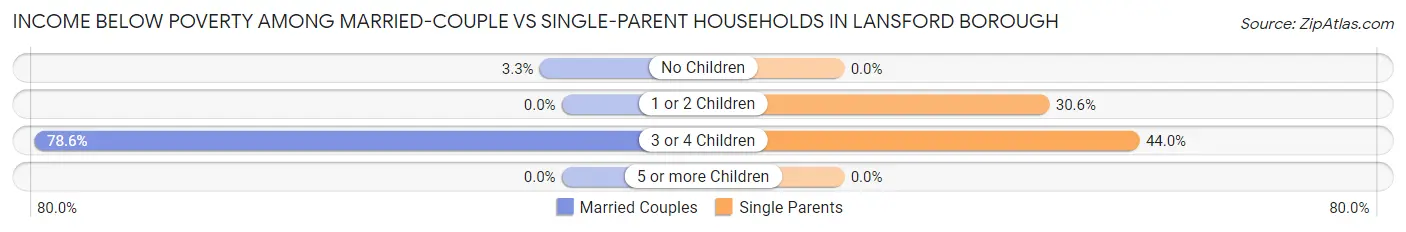
| Children | Married-Couple Families | Single-Parent Households |
| No Children | 12 (3.3%) | 0 (0.0%) |
| 1 or 2 Children | 0 (0.0%) | 110 (30.6%) |
| 3 or 4 Children | 44 (78.6%) | 11 (44.0%) |
| 5 or more Children | 0 (0.0%) | 0 (0.0%) |
| Total | 56 (9.8%) | 121 (24.4%) |
Race in Lansford borough
The most populous races in Lansford borough are White / Caucasian (3,160 | 76.5%), Hispanic or Latino (630 | 15.3%), and Two or more Races (517 | 12.5%).
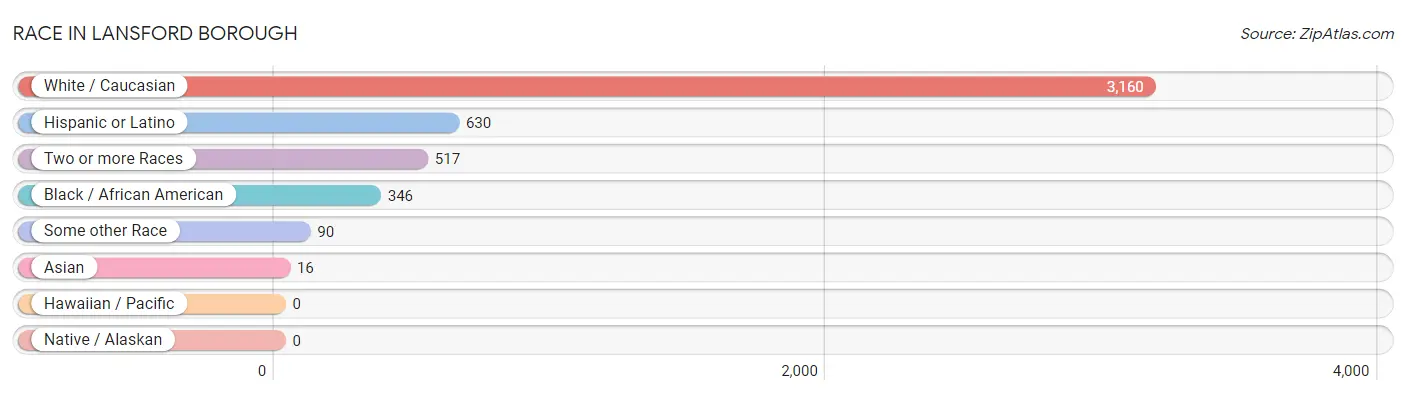
| Race | # Population | % Population |
| Asian | 16 | 0.4% |
| Black / African American | 346 | 8.4% |
| Hawaiian / Pacific | 0 | 0.0% |
| Hispanic or Latino | 630 | 15.3% |
| Native / Alaskan | 0 | 0.0% |
| White / Caucasian | 3,160 | 76.5% |
| Two or more Races | 517 | 12.5% |
| Some other Race | 90 | 2.2% |
| Total | 4,129 | 100.0% |
Ancestry in Lansford borough
The most populous ancestries reported in Lansford borough are Irish (724 | 17.5%), German (686 | 16.6%), Italian (522 | 12.6%), Slovak (247 | 6.0%), and Puerto Rican (230 | 5.6%), together accounting for 58.3% of all Lansford borough residents.
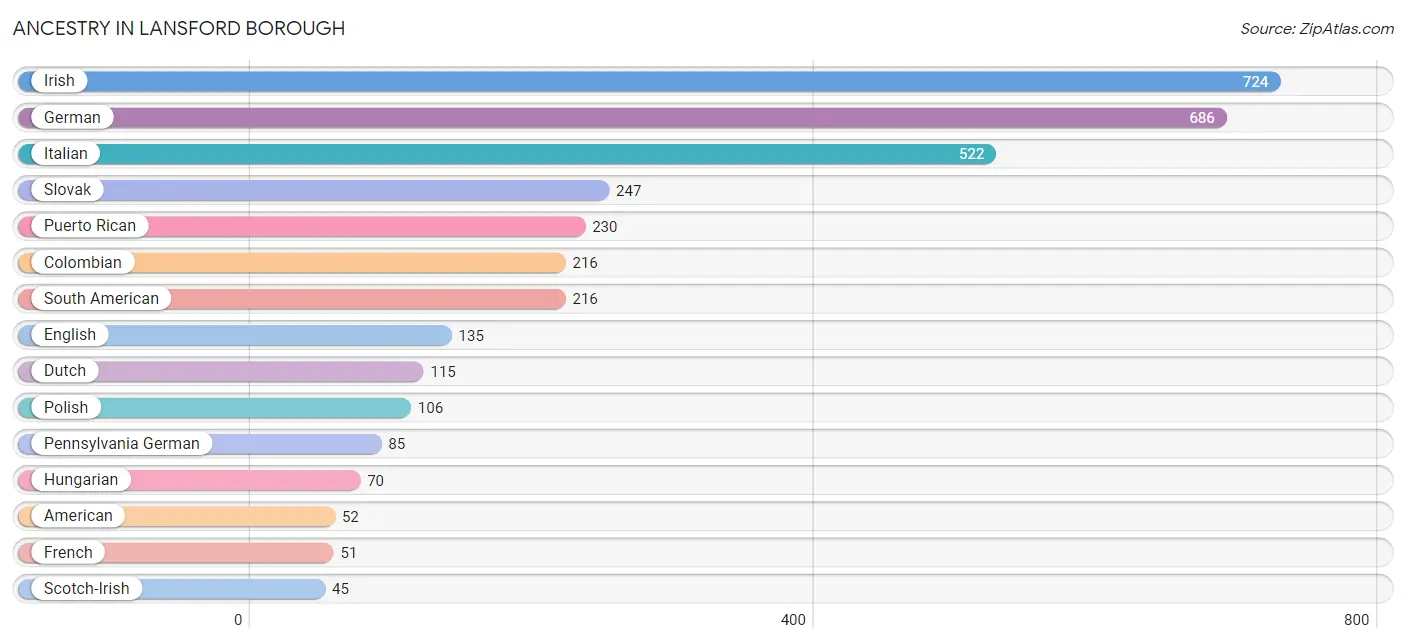
| Ancestry | # Population | % Population |
| American | 52 | 1.3% |
| Burmese | 16 | 0.4% |
| Central American | 39 | 0.9% |
| Cherokee | 15 | 0.4% |
| Colombian | 216 | 5.2% |
| Czech | 33 | 0.8% |
| Czechoslovakian | 7 | 0.2% |
| Dutch | 115 | 2.8% |
| Eastern European | 19 | 0.5% |
| English | 135 | 3.3% |
| French | 51 | 1.2% |
| German | 686 | 16.6% |
| Greek | 20 | 0.5% |
| Haitian | 29 | 0.7% |
| Hungarian | 70 | 1.7% |
| Irish | 724 | 17.5% |
| Iroquois | 4 | 0.1% |
| Italian | 522 | 12.6% |
| Lithuanian | 6 | 0.2% |
| Mexican | 26 | 0.6% |
| Norwegian | 11 | 0.3% |
| Pennsylvania German | 85 | 2.1% |
| Polish | 106 | 2.6% |
| Portuguese | 14 | 0.3% |
| Puerto Rican | 230 | 5.6% |
| Russian | 27 | 0.6% |
| Salvadoran | 39 | 0.9% |
| Scandinavian | 13 | 0.3% |
| Scotch-Irish | 45 | 1.1% |
| Scottish | 39 | 0.9% |
| Slavic | 10 | 0.2% |
| Slovak | 247 | 6.0% |
| South American | 216 | 5.2% |
| Spanish | 15 | 0.4% |
| Ukrainian | 9 | 0.2% |
| Welsh | 36 | 0.9% | View All 36 Rows |
Immigrants in Lansford borough
The most numerous immigrant groups reported in Lansford borough came from Latin America (95 | 2.3%), Colombia (60 | 1.5%), South America (60 | 1.5%), Central America (35 | 0.9%), and Honduras (35 | 0.9%), together accounting for 6.9% of all Lansford borough residents.
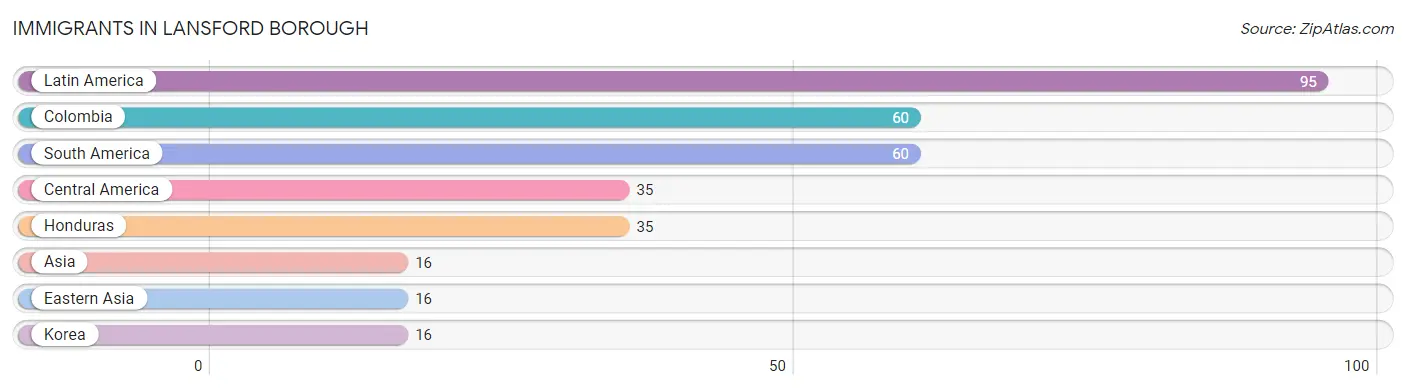
| Immigration Origin | # Population | % Population |
| Asia | 16 | 0.4% |
| Central America | 35 | 0.9% |
| Colombia | 60 | 1.5% |
| Eastern Asia | 16 | 0.4% |
| Honduras | 35 | 0.9% |
| Korea | 16 | 0.4% |
| Latin America | 95 | 2.3% |
| South America | 60 | 1.5% | View All 8 Rows |
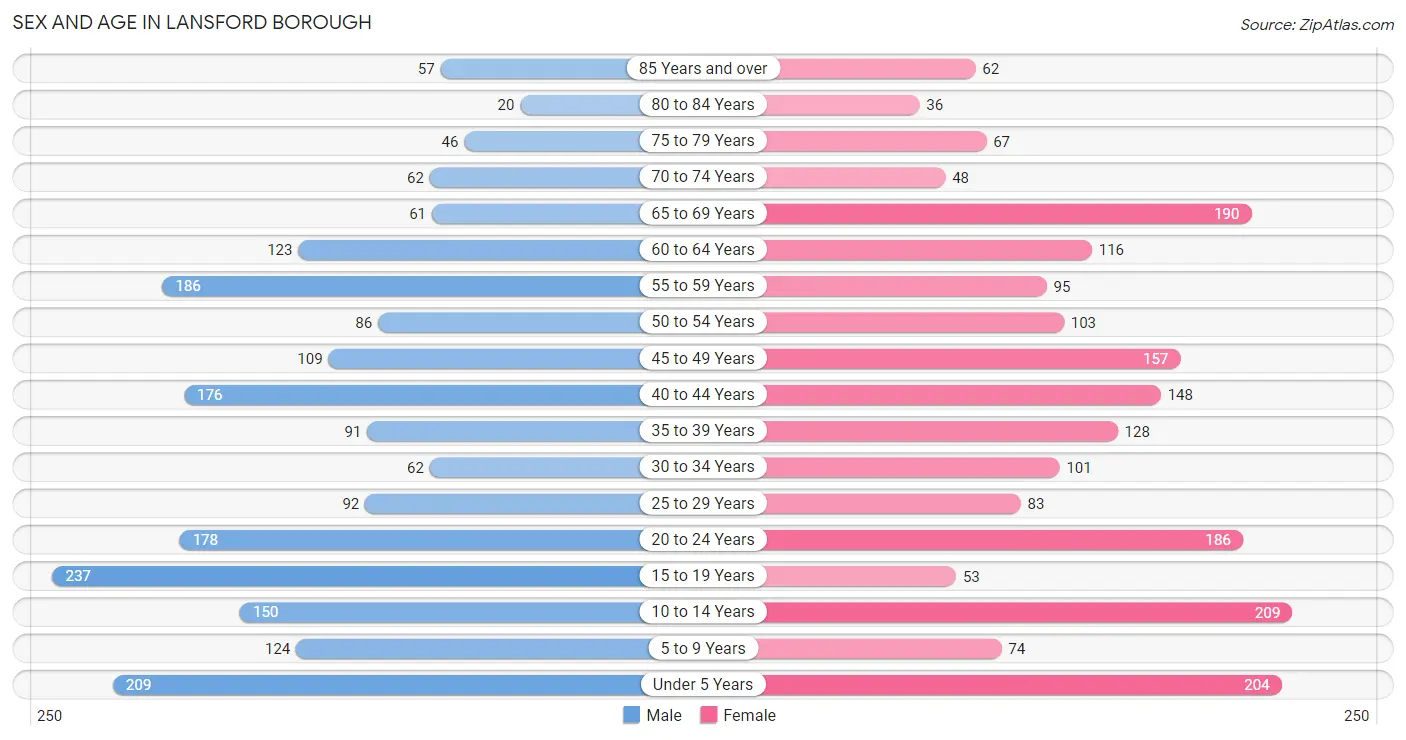
Sex and Age in Lansford borough
Sex and Age in Lansford borough
The most populous age groups in Lansford borough are 15 to 19 Years (237 | 11.5%) for men and 10 to 14 Years (209 | 10.2%) for women.
| Age Bracket | Male | Female |
| Under 5 Years | 209 (10.1%) | 204 (9.9%) |
| 5 to 9 Years | 124 (6.0%) | 74 (3.6%) |
| 10 to 14 Years | 150 (7.2%) | 209 (10.2%) |
| 15 to 19 Years | 237 (11.5%) | 53 (2.6%) |
| 20 to 24 Years | 178 (8.6%) | 186 (9.0%) |
| 25 to 29 Years | 92 (4.4%) | 83 (4.0%) |
| 30 to 34 Years | 62 (3.0%) | 101 (4.9%) |
| 35 to 39 Years | 91 (4.4%) | 128 (6.2%) |
| 40 to 44 Years | 176 (8.5%) | 148 (7.2%) |
| 45 to 49 Years | 109 (5.3%) | 157 (7.6%) |
| 50 to 54 Years | 86 (4.2%) | 103 (5.0%) |
| 55 to 59 Years | 186 (9.0%) | 95 (4.6%) |
| 60 to 64 Years | 123 (5.9%) | 116 (5.6%) |
| 65 to 69 Years | 61 (2.9%) | 190 (9.2%) |
| 70 to 74 Years | 62 (3.0%) | 48 (2.3%) |
| 75 to 79 Years | 46 (2.2%) | 67 (3.3%) |
| 80 to 84 Years | 20 (1.0%) | 36 (1.8%) |
| 85 Years and over | 57 (2.8%) | 62 (3.0%) |
| Total | 2,069 (100.0%) | 2,060 (100.0%) |
Families and Households in Lansford borough
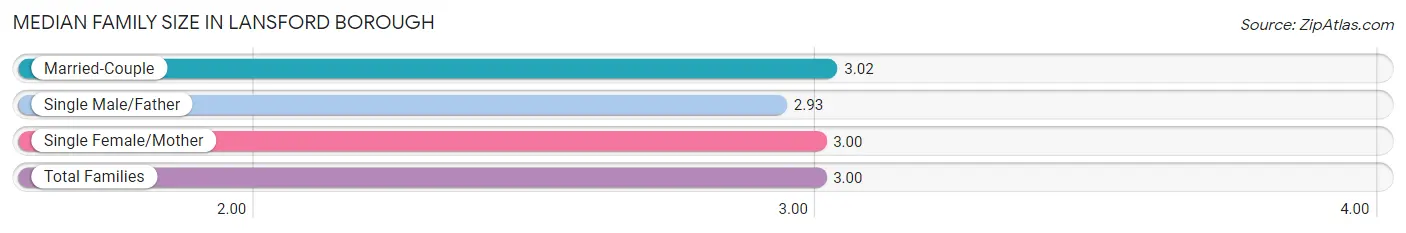
Median Family Size in Lansford borough
The median family size in Lansford borough is 3.00 persons per family, with married-couple families (571 | 53.5%) accounting for the largest median family size of 3.02 persons per family. On the other hand, single male/father families (149 | 14.0%) represent the smallest median family size with 2.93 persons per family.
| Family Type | # Families | Family Size |
| Married-Couple | 571 (53.5%) | 3.02 |
| Single Male/Father | 149 (14.0%) | 2.93 |
| Single Female/Mother | 347 (32.5%) | 3.00 |
| Total Families | 1,067 (100.0%) | 3.00 |
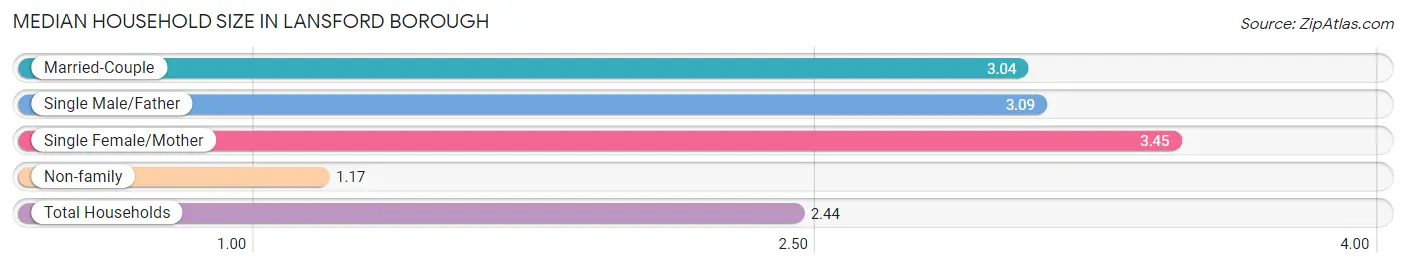
Median Household Size in Lansford borough
The median household size in Lansford borough is 2.44 persons per household, with single female/mother households (347 | 20.5%) accounting for the largest median household size of 3.45 persons per household. non-family households (624 | 36.9%) represent the smallest median household size with 1.17 persons per household.
| Household Type | # Households | Household Size |
| Married-Couple | 571 (33.8%) | 3.04 |
| Single Male/Father | 149 (8.8%) | 3.09 |
| Single Female/Mother | 347 (20.5%) | 3.45 |
| Non-family | 624 (36.9%) | 1.17 |
| Total Households | 1,691 (100.0%) | 2.44 |
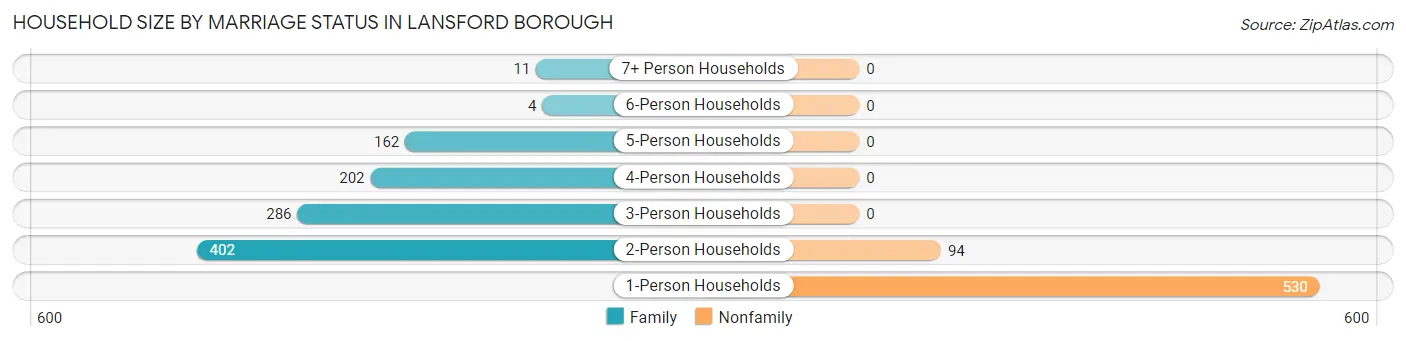
Household Size by Marriage Status in Lansford borough
Out of a total of 1,691 households in Lansford borough, 1,067 (63.1%) are family households, while 624 (36.9%) are nonfamily households. The most numerous type of family households are 2-person households, comprising 402, and the most common type of nonfamily households are 1-person households, comprising 530.
| Household Size | Family Households | Nonfamily Households |
| 1-Person Households | - | 530 (31.3%) |
| 2-Person Households | 402 (23.8%) | 94 (5.6%) |
| 3-Person Households | 286 (16.9%) | 0 (0.0%) |
| 4-Person Households | 202 (11.9%) | 0 (0.0%) |
| 5-Person Households | 162 (9.6%) | 0 (0.0%) |
| 6-Person Households | 4 (0.2%) | 0 (0.0%) |
| 7+ Person Households | 11 (0.6%) | 0 (0.0%) |
| Total | 1,067 (63.1%) | 624 (36.9%) |
Female Fertility in Lansford borough
Fertility by Age in Lansford borough
Average fertility rate in Lansford borough is 69.0 births per 1,000 women. Women in the age bracket of 20 to 34 years have the highest fertility rate with 157.0 births per 1,000 women. Women in the age bracket of 20 to 34 years acount for 96.7% of all women with births.
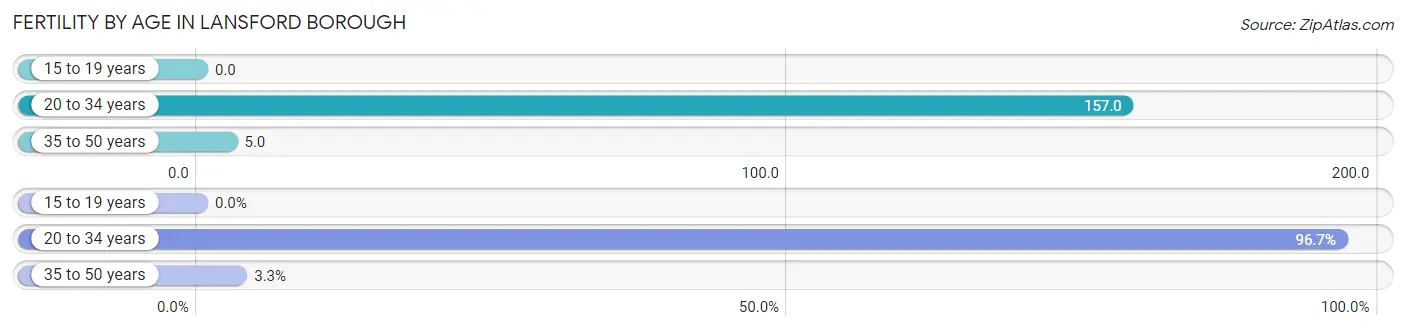
| Age Bracket | Women with Births | Births / 1,000 Women |
| 15 to 19 years | 0 (0.0%) | 0.0 |
| 20 to 34 years | 58 (96.7%) | 157.0 |
| 35 to 50 years | 2 (3.3%) | 5.0 |
| Total | 60 (100.0%) | 69.0 |
Fertility by Age by Marriage Status in Lansford borough
73.3% of women with births (60) in Lansford borough are married. The highest percentage of unmarried women with births falls into 35 to 50 years age bracket with 100.0% of them unmarried at the time of birth, while the lowest percentage of unmarried women with births belong to 20 to 34 years age bracket with 24.1% of them unmarried.
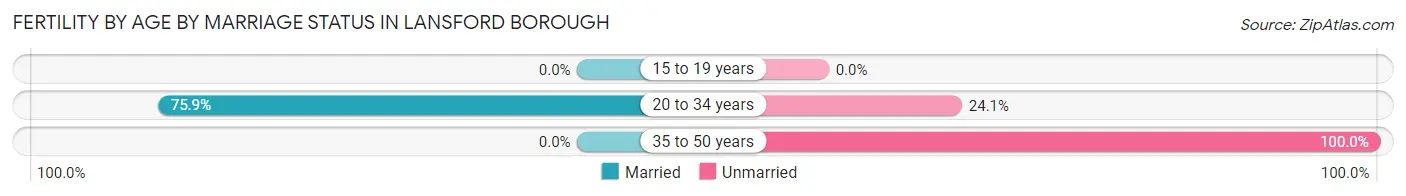
| Age Bracket | Married | Unmarried |
| 15 to 19 years | 0 (0.0%) | 0 (0.0%) |
| 20 to 34 years | 44 (75.9%) | 14 (24.1%) |
| 35 to 50 years | 0 (0.0%) | 2 (100.0%) |
| Total | 44 (73.3%) | 16 (26.7%) |
Fertility by Education in Lansford borough
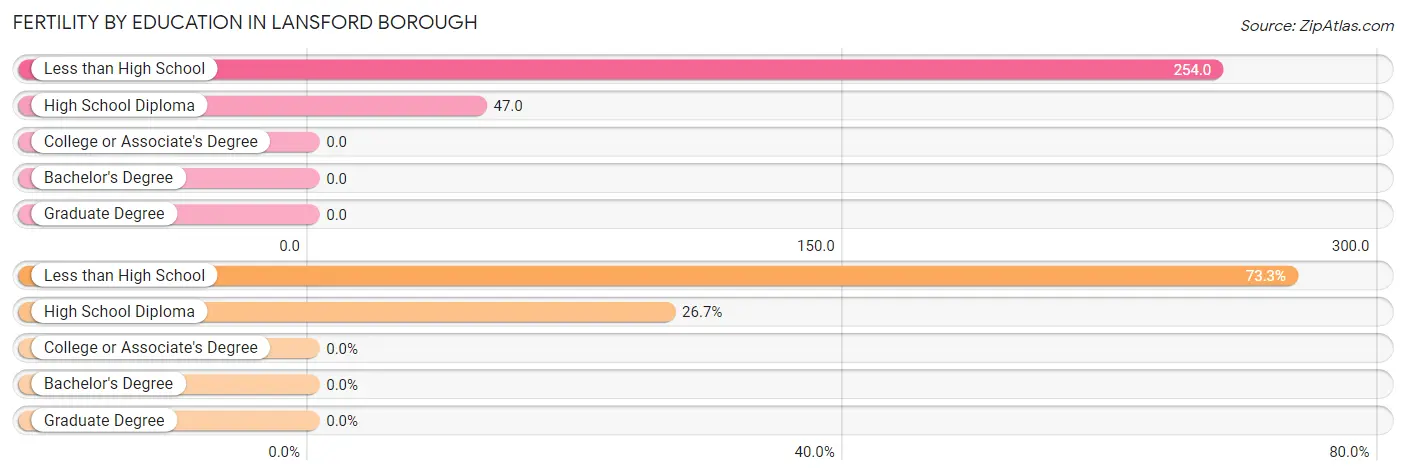
| Educational Attainment | Women with Births | Births / 1,000 Women |
| Less than High School | 44 (73.3%) | 254.0 |
| High School Diploma | 16 (26.7%) | 47.0 |
| College or Associate's Degree | 0 (0.0%) | 0.0 |
| Bachelor's Degree | 0 (0.0%) | 0.0 |
| Graduate Degree | 0 (0.0%) | 0.0 |
| Total | 60 (100.0%) | 69.0 |
Fertility by Education by Marriage Status in Lansford borough
26.7% of women with births in Lansford borough are unmarried. Women with the educational attainment of less than high school are most likely to be married with 100.0% of them married at childbirth, while women with the educational attainment of high school diploma are least likely to be married with 100.0% of them unmarried at childbirth.
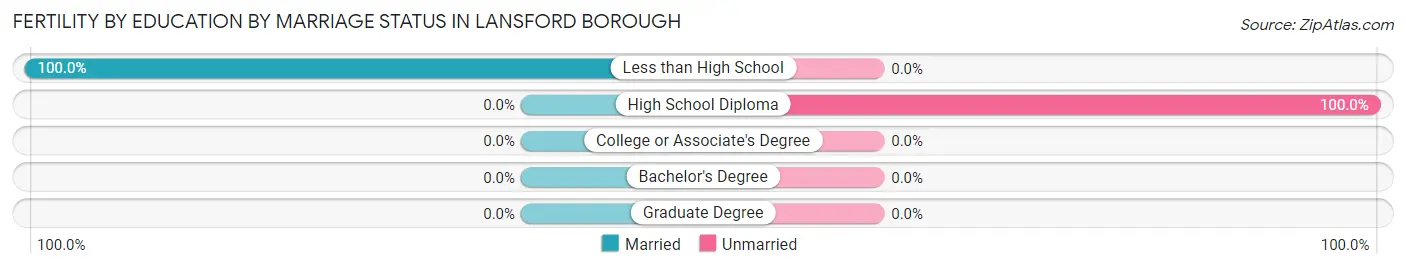
| Educational Attainment | Married | Unmarried |
| Less than High School | 44 (100.0%) | 0 (0.0%) |
| High School Diploma | 0 (0.0%) | 16 (100.0%) |
| College or Associate's Degree | 0 (0.0%) | 0 (0.0%) |
| Bachelor's Degree | 0 (0.0%) | 0 (0.0%) |
| Graduate Degree | 0 (0.0%) | 0 (0.0%) |
| Total | 44 (73.3%) | 16 (26.7%) |
Employment Characteristics in Lansford borough
Employment by Class of Employer in Lansford borough
Among the 1,426 employed individuals in Lansford borough, private company employees (1,009 | 70.8%), not-for-profit organizations (207 | 14.5%), and local government employees (80 | 5.6%) make up the most common classes of employment.
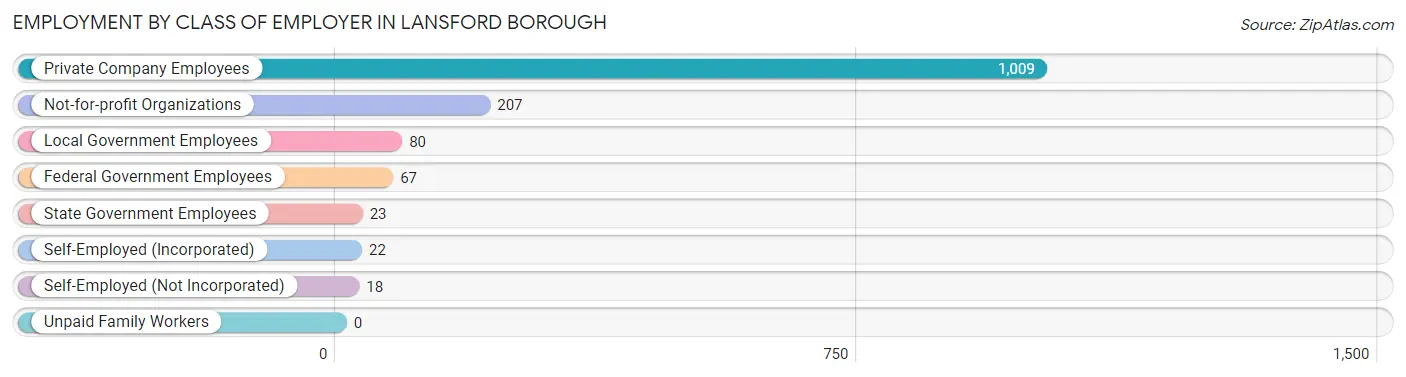
| Employer Class | # Employees | % Employees |
| Private Company Employees | 1,009 | 70.8% |
| Self-Employed (Incorporated) | 22 | 1.5% |
| Self-Employed (Not Incorporated) | 18 | 1.3% |
| Not-for-profit Organizations | 207 | 14.5% |
| Local Government Employees | 80 | 5.6% |
| State Government Employees | 23 | 1.6% |
| Federal Government Employees | 67 | 4.7% |
| Unpaid Family Workers | 0 | 0.0% |
| Total | 1,426 | 100.0% |
Employment Status by Age in Lansford borough
According to the labor force statistics for Lansford borough, out of the total population over 16 years of age (3,118), 58.3% or 1,818 individuals are in the labor force, with 19.6% or 356 of them unemployed. The age group with the highest labor force participation rate is 25 to 29 years, with 88.6% or 155 individuals in the labor force. Within the labor force, the 30 to 34 years age range has the highest percentage of unemployed individuals, with 46.9% or 45 of them being unemployed.
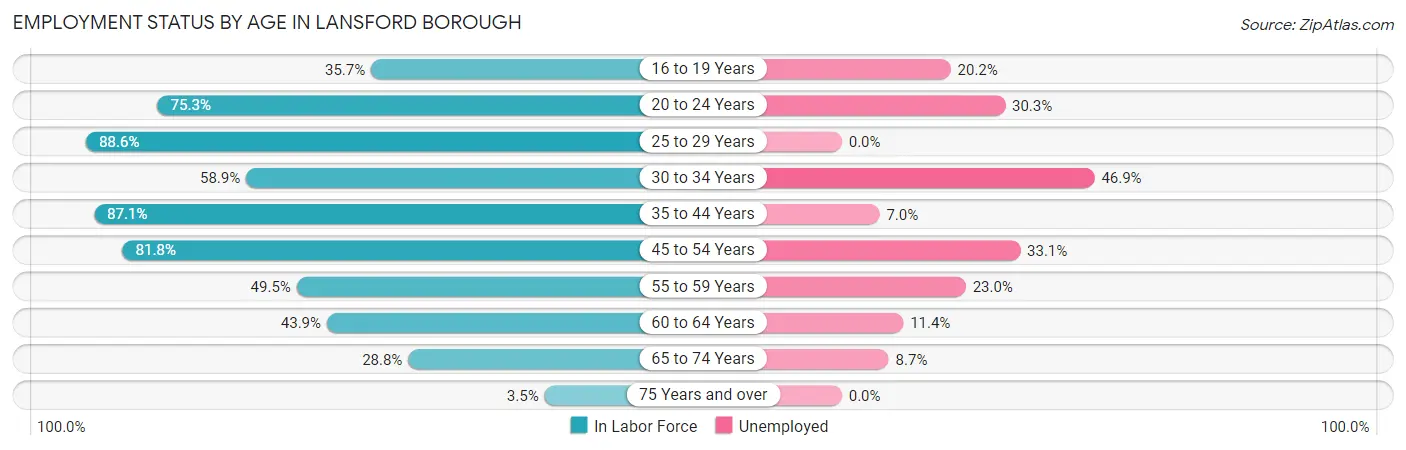
| Age Bracket | In Labor Force | Unemployed |
| 16 to 19 Years | 89 (35.7%) | 18 (20.2%) |
| 20 to 24 Years | 274 (75.3%) | 83 (30.3%) |
| 25 to 29 Years | 155 (88.6%) | 0 (0.0%) |
| 30 to 34 Years | 96 (58.9%) | 45 (46.9%) |
| 35 to 44 Years | 473 (87.1%) | 33 (7.0%) |
| 45 to 54 Years | 372 (81.8%) | 123 (33.1%) |
| 55 to 59 Years | 139 (49.5%) | 32 (23.0%) |
| 60 to 64 Years | 105 (43.9%) | 12 (11.4%) |
| 65 to 74 Years | 104 (28.8%) | 9 (8.7%) |
| 75 Years and over | 10 (3.5%) | 0 (0.0%) |
| Total | 1,818 (58.3%) | 356 (19.6%) |
Employment Status by Educational Attainment in Lansford borough
According to labor force statistics for Lansford borough, 72.2% of individuals (1,340) out of the total population between 25 and 64 years of age (1,856) are in the labor force, with 18.4% or 247 of them being unemployed. The group with the highest labor force participation rate are those with the educational attainment of bachelor's degree or higher, with 100.0% or 221 individuals in the labor force. Within the labor force, individuals with less than high school education have the highest percentage of unemployment, with 31.6% or 66 of them being unemployed.
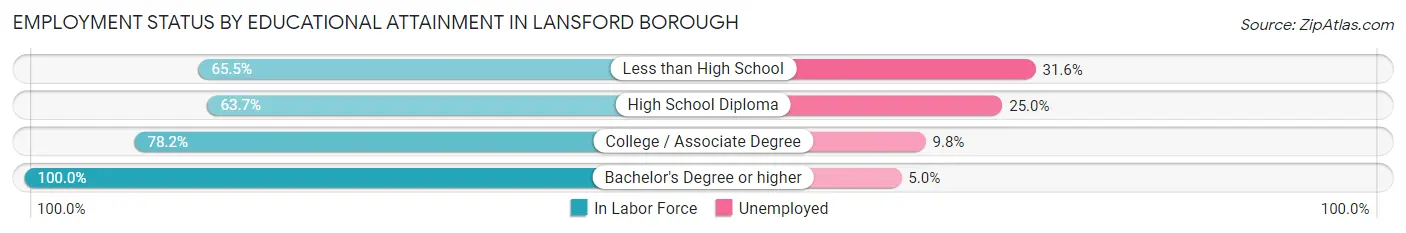
| Educational Attainment | In Labor Force | Unemployed |
| Less than High School | 209 (65.5%) | 101 (31.6%) |
| High School Diploma | 523 (63.7%) | 205 (25.0%) |
| College / Associate Degree | 387 (78.2%) | 49 (9.8%) |
| Bachelor's Degree or higher | 221 (100.0%) | 11 (5.0%) |
| Total | 1,340 (72.2%) | 342 (18.4%) |
Employment Occupations by Sex in Lansford borough
Management, Business, Science and Arts Occupations
The most common Management, Business, Science and Arts occupations in Lansford borough are Community & Social Service (170 | 11.7%), Education Instruction & Library (71 | 4.9%), Education, Arts & Media (65 | 4.5%), Health Diagnosing & Treating (49 | 3.4%), and Health Technologists (40 | 2.8%).
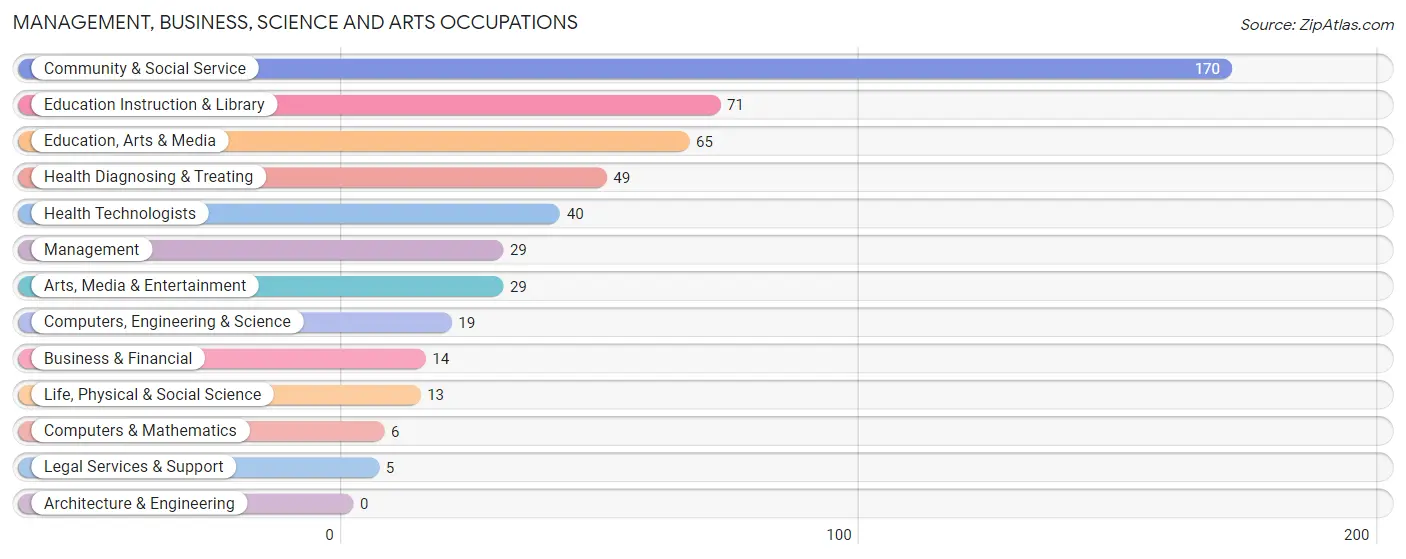
Management, Business, Science and Arts Occupations by Sex
Within the Management, Business, Science and Arts occupations in Lansford borough, the most male-oriented occupations are Life, Physical & Social Science (100.0%), Education, Arts & Media (100.0%), and Arts, Media & Entertainment (69.0%), while the most female-oriented occupations are Management (100.0%), Business & Financial (100.0%), and Computers & Mathematics (100.0%).
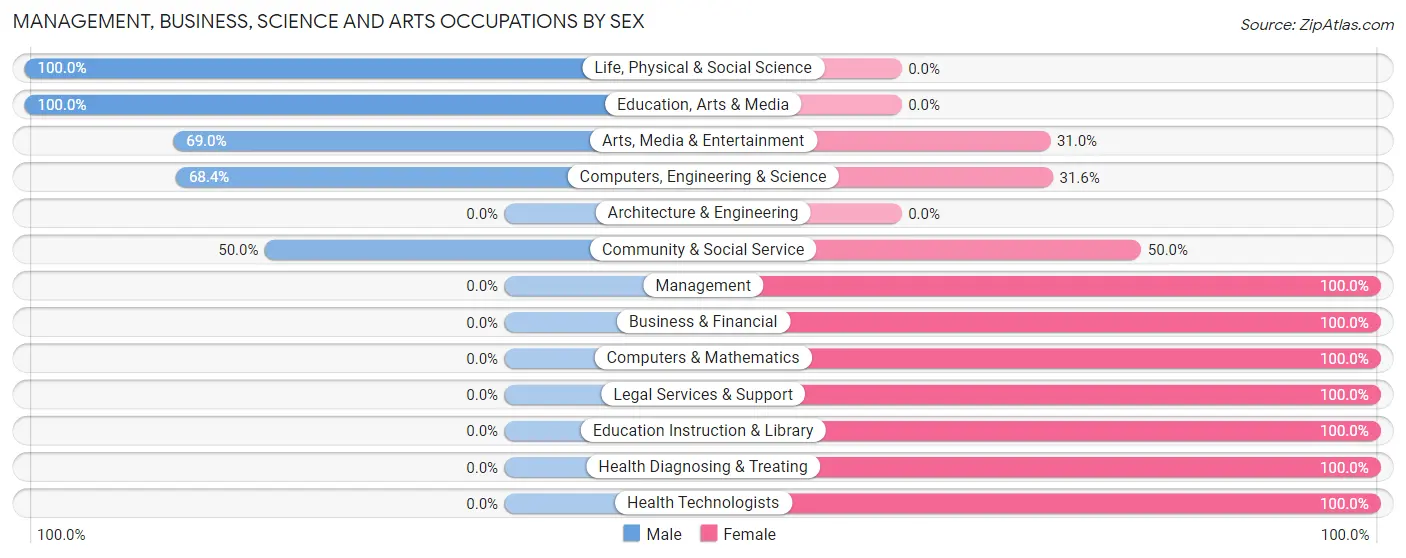
| Occupation | Male | Female |
| Management | 0 (0.0%) | 29 (100.0%) |
| Business & Financial | 0 (0.0%) | 14 (100.0%) |
| Computers, Engineering & Science | 13 (68.4%) | 6 (31.6%) |
| Computers & Mathematics | 0 (0.0%) | 6 (100.0%) |
| Architecture & Engineering | 0 (0.0%) | 0 (0.0%) |
| Life, Physical & Social Science | 13 (100.0%) | 0 (0.0%) |
| Community & Social Service | 85 (50.0%) | 85 (50.0%) |
| Education, Arts & Media | 65 (100.0%) | 0 (0.0%) |
| Legal Services & Support | 0 (0.0%) | 5 (100.0%) |
| Education Instruction & Library | 0 (0.0%) | 71 (100.0%) |
| Arts, Media & Entertainment | 20 (69.0%) | 9 (31.0%) |
| Health Diagnosing & Treating | 0 (0.0%) | 49 (100.0%) |
| Health Technologists | 0 (0.0%) | 40 (100.0%) |
| Total (Category) | 98 (34.9%) | 183 (65.1%) |
| Total (Overall) | 727 (50.1%) | 725 (49.9%) |
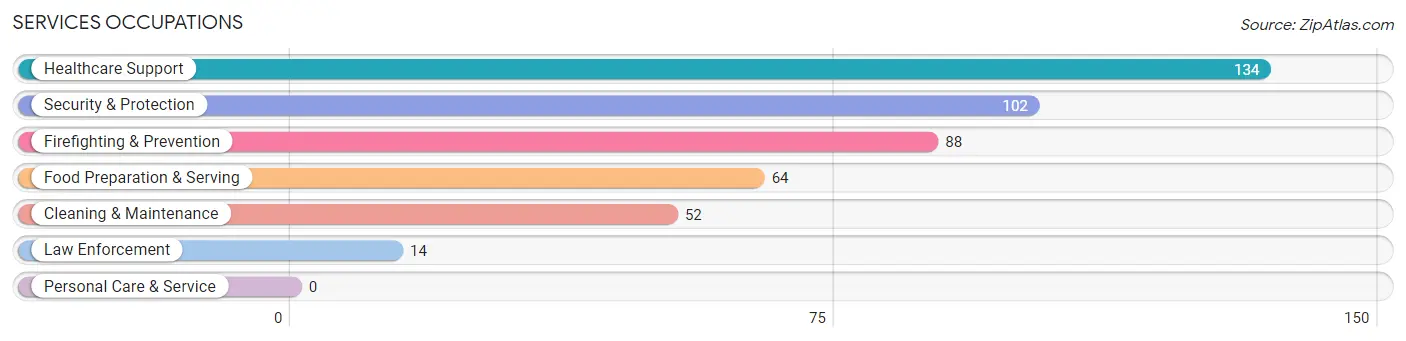
Services Occupations
The most common Services occupations in Lansford borough are Healthcare Support (134 | 9.2%), Security & Protection (102 | 7.0%), Firefighting & Prevention (88 | 6.1%), Food Preparation & Serving (64 | 4.4%), and Cleaning & Maintenance (52 | 3.6%).
Services Occupations by Sex
Within the Services occupations in Lansford borough, the most male-oriented occupations are Law Enforcement (100.0%), Cleaning & Maintenance (100.0%), and Security & Protection (61.8%), while the most female-oriented occupations are Healthcare Support (100.0%), Firefighting & Prevention (44.3%), and Food Preparation & Serving (43.8%).
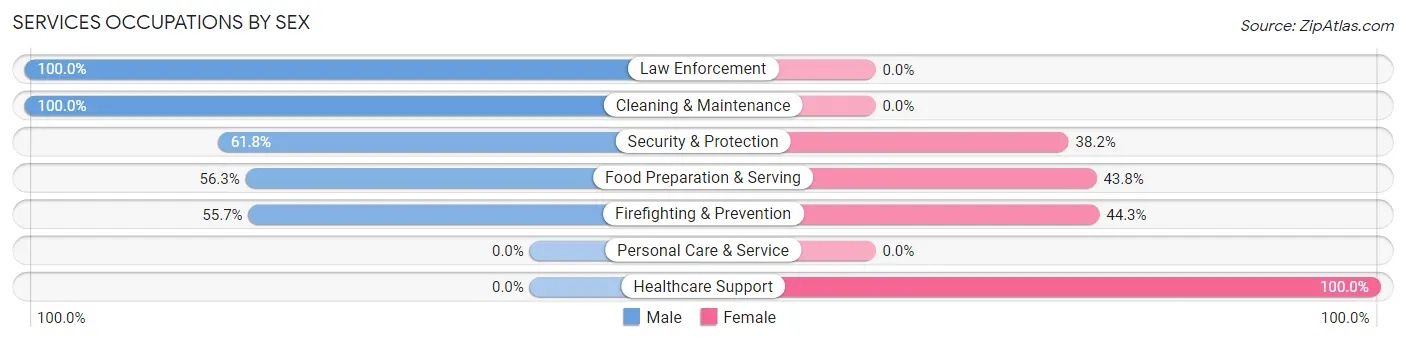
| Occupation | Male | Female |
| Healthcare Support | 0 (0.0%) | 134 (100.0%) |
| Security & Protection | 63 (61.8%) | 39 (38.2%) |
| Firefighting & Prevention | 49 (55.7%) | 39 (44.3%) |
| Law Enforcement | 14 (100.0%) | 0 (0.0%) |
| Food Preparation & Serving | 36 (56.2%) | 28 (43.8%) |
| Cleaning & Maintenance | 52 (100.0%) | 0 (0.0%) |
| Personal Care & Service | 0 (0.0%) | 0 (0.0%) |
| Total (Category) | 151 (42.9%) | 201 (57.1%) |
| Total (Overall) | 727 (50.1%) | 725 (49.9%) |
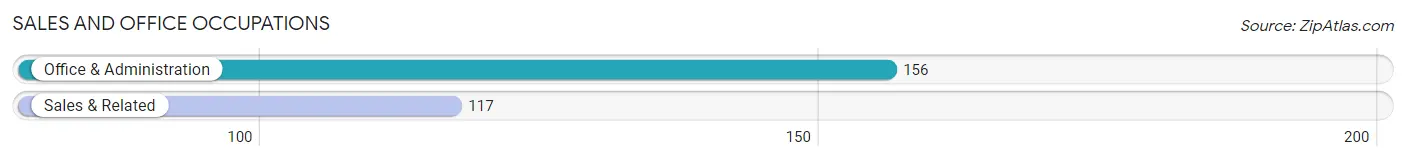
Sales and Office Occupations
The most common Sales and Office occupations in Lansford borough are Office & Administration (156 | 10.7%), and Sales & Related (117 | 8.1%).
Sales and Office Occupations by Sex
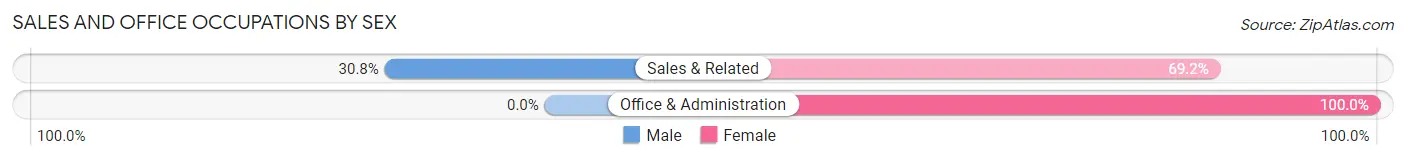
| Occupation | Male | Female |
| Sales & Related | 36 (30.8%) | 81 (69.2%) |
| Office & Administration | 0 (0.0%) | 156 (100.0%) |
| Total (Category) | 36 (13.2%) | 237 (86.8%) |
| Total (Overall) | 727 (50.1%) | 725 (49.9%) |
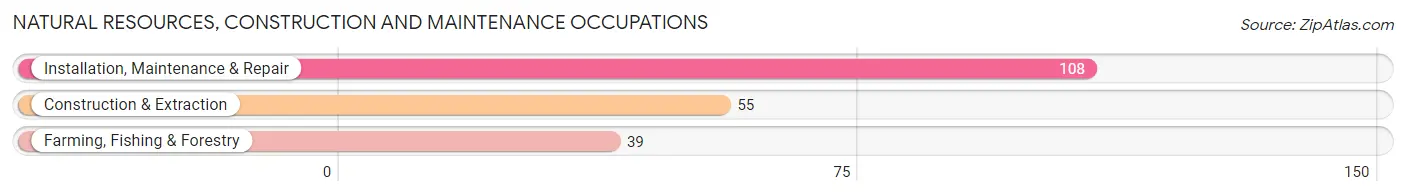
Natural Resources, Construction and Maintenance Occupations
The most common Natural Resources, Construction and Maintenance occupations in Lansford borough are Installation, Maintenance & Repair (108 | 7.4%), Construction & Extraction (55 | 3.8%), and Farming, Fishing & Forestry (39 | 2.7%).
Natural Resources, Construction and Maintenance Occupations by Sex
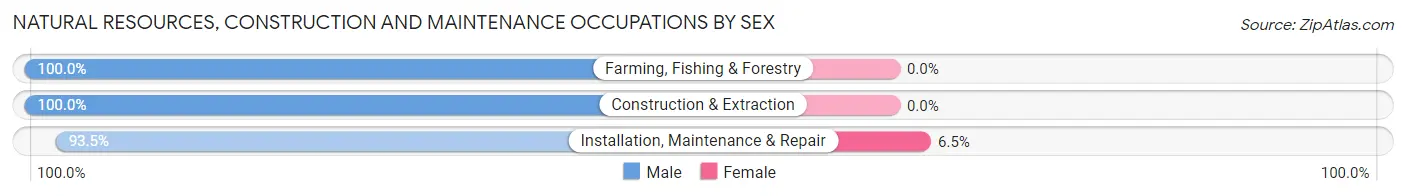
| Occupation | Male | Female |
| Farming, Fishing & Forestry | 39 (100.0%) | 0 (0.0%) |
| Construction & Extraction | 55 (100.0%) | 0 (0.0%) |
| Installation, Maintenance & Repair | 101 (93.5%) | 7 (6.5%) |
| Total (Category) | 195 (96.5%) | 7 (3.5%) |
| Total (Overall) | 727 (50.1%) | 725 (49.9%) |
Production, Transportation and Moving Occupations
The most common Production, Transportation and Moving occupations in Lansford borough are Production (157 | 10.8%), Transportation (142 | 9.8%), and Material Moving (45 | 3.1%).
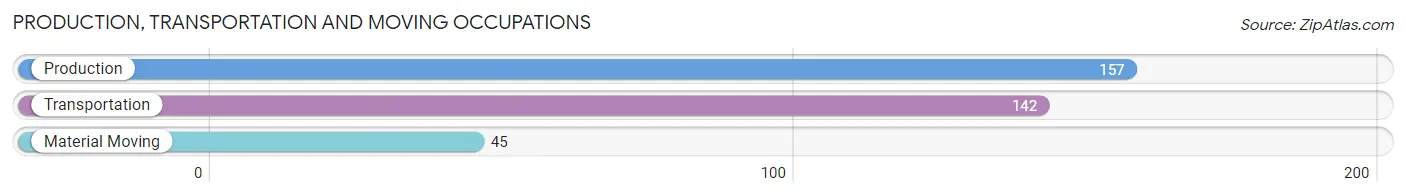
Production, Transportation and Moving Occupations by Sex
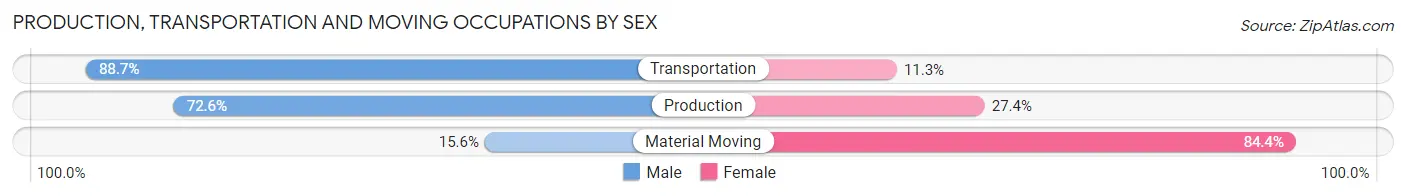
| Occupation | Male | Female |
| Production | 114 (72.6%) | 43 (27.4%) |
| Transportation | 126 (88.7%) | 16 (11.3%) |
| Material Moving | 7 (15.6%) | 38 (84.4%) |
| Total (Category) | 247 (71.8%) | 97 (28.2%) |
| Total (Overall) | 727 (50.1%) | 725 (49.9%) |
Employment Industries by Sex in Lansford borough
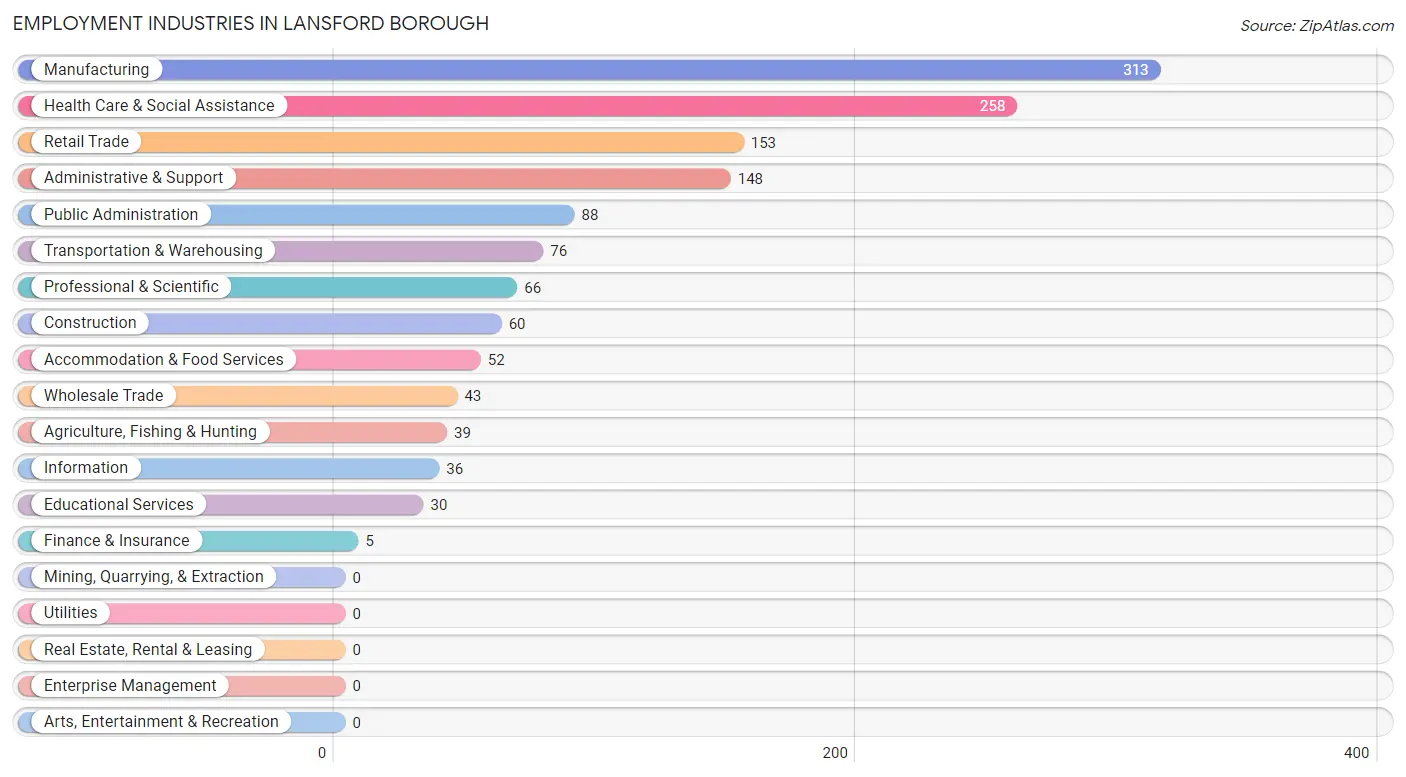
Employment Industries in Lansford borough
The major employment industries in Lansford borough include Manufacturing (313 | 21.6%), Health Care & Social Assistance (258 | 17.8%), Retail Trade (153 | 10.5%), Administrative & Support (148 | 10.2%), and Public Administration (88 | 6.1%).
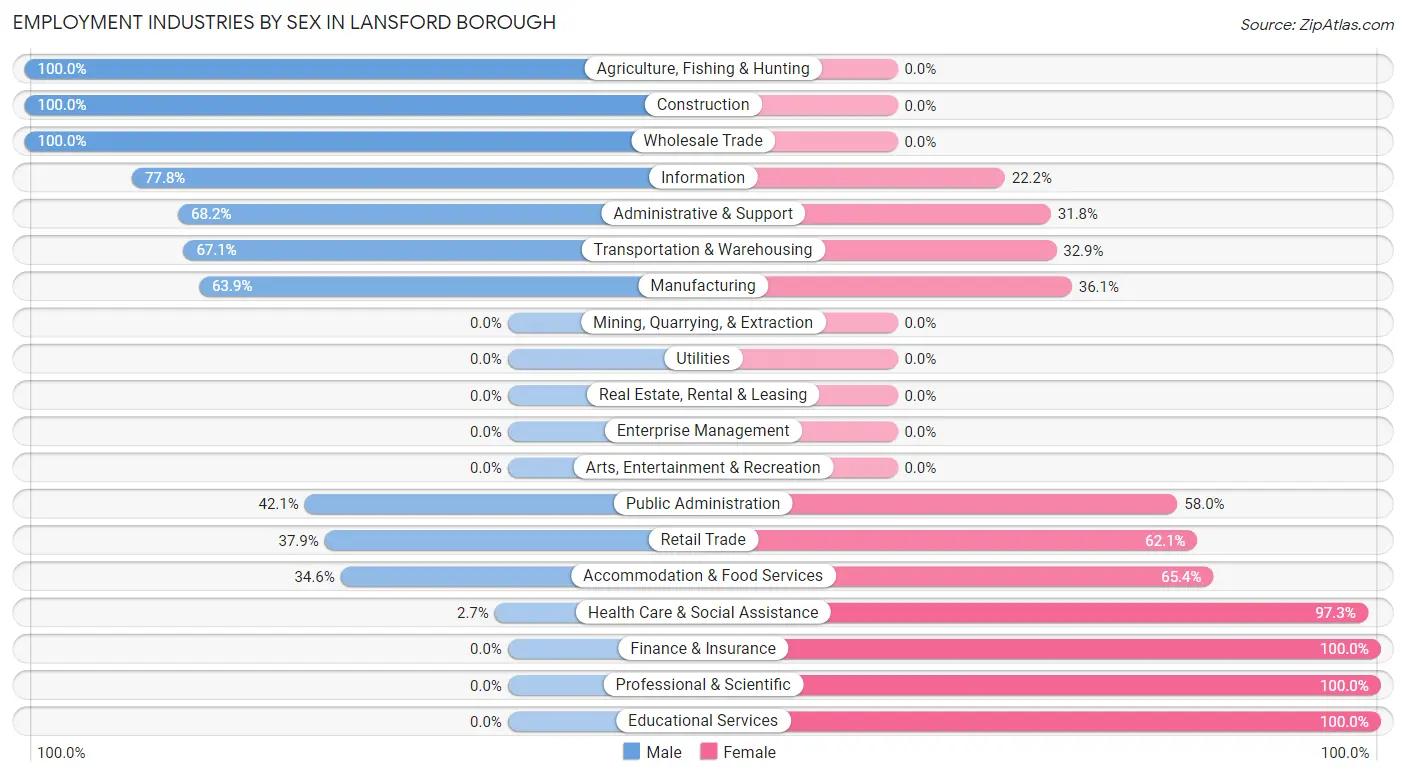
Employment Industries by Sex in Lansford borough
The Lansford borough industries that see more men than women are Agriculture, Fishing & Hunting (100.0%), Construction (100.0%), and Wholesale Trade (100.0%), whereas the industries that tend to have a higher number of women are Finance & Insurance (100.0%), Professional & Scientific (100.0%), and Educational Services (100.0%).
| Industry | Male | Female |
| Agriculture, Fishing & Hunting | 39 (100.0%) | 0 (0.0%) |
| Mining, Quarrying, & Extraction | 0 (0.0%) | 0 (0.0%) |
| Construction | 60 (100.0%) | 0 (0.0%) |
| Manufacturing | 200 (63.9%) | 113 (36.1%) |
| Wholesale Trade | 43 (100.0%) | 0 (0.0%) |
| Retail Trade | 58 (37.9%) | 95 (62.1%) |
| Transportation & Warehousing | 51 (67.1%) | 25 (32.9%) |
| Utilities | 0 (0.0%) | 0 (0.0%) |
| Information | 28 (77.8%) | 8 (22.2%) |
| Finance & Insurance | 0 (0.0%) | 5 (100.0%) |
| Real Estate, Rental & Leasing | 0 (0.0%) | 0 (0.0%) |
| Professional & Scientific | 0 (0.0%) | 66 (100.0%) |
| Enterprise Management | 0 (0.0%) | 0 (0.0%) |
| Administrative & Support | 101 (68.2%) | 47 (31.8%) |
| Educational Services | 0 (0.0%) | 30 (100.0%) |
| Health Care & Social Assistance | 7 (2.7%) | 251 (97.3%) |
| Arts, Entertainment & Recreation | 0 (0.0%) | 0 (0.0%) |
| Accommodation & Food Services | 18 (34.6%) | 34 (65.4%) |
| Public Administration | 37 (42.0%) | 51 (58.0%) |
| Total | 727 (50.1%) | 725 (49.9%) |
Education in Lansford borough
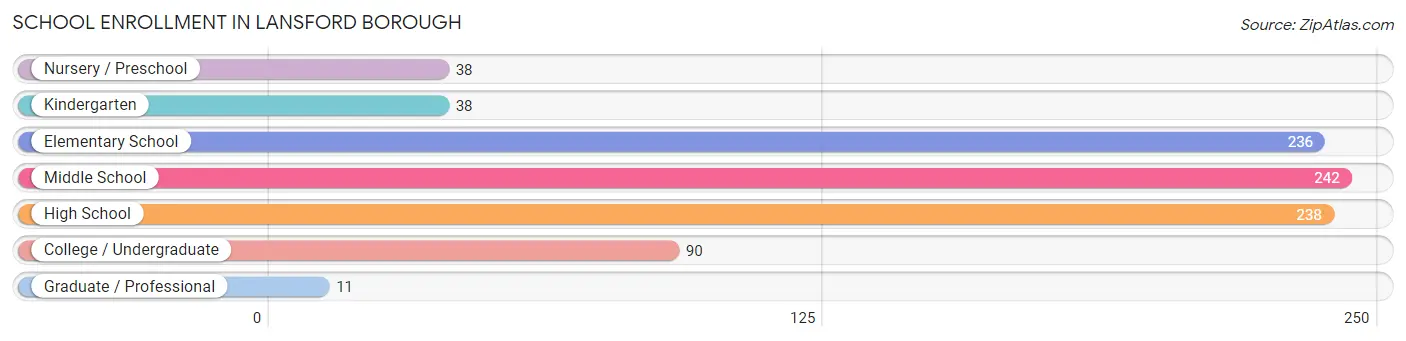
School Enrollment in Lansford borough
The most common levels of schooling among the 893 students in Lansford borough are middle school (242 | 27.1%), high school (238 | 26.7%), and elementary school (236 | 26.4%).
| School Level | # Students | % Students |
| Nursery / Preschool | 38 | 4.3% |
| Kindergarten | 38 | 4.3% |
| Elementary School | 236 | 26.4% |
| Middle School | 242 | 27.1% |
| High School | 238 | 26.7% |
| College / Undergraduate | 90 | 10.1% |
| Graduate / Professional | 11 | 1.2% |
| Total | 893 | 100.0% |
School Enrollment by Age by Funding Source in Lansford borough
Out of a total of 893 students who are enrolled in schools in Lansford borough, 142 (15.9%) attend a private institution, while the remaining 751 (84.1%) are enrolled in public schools. The age group of 3 to 4 year olds has the highest likelihood of being enrolled in private schools, with 38 (100.0% in the age bracket) enrolled. Conversely, the age group of 15 to 17 year olds has the lowest likelihood of being enrolled in a private school, with 114 (100.0% in the age bracket) attending a public institution.
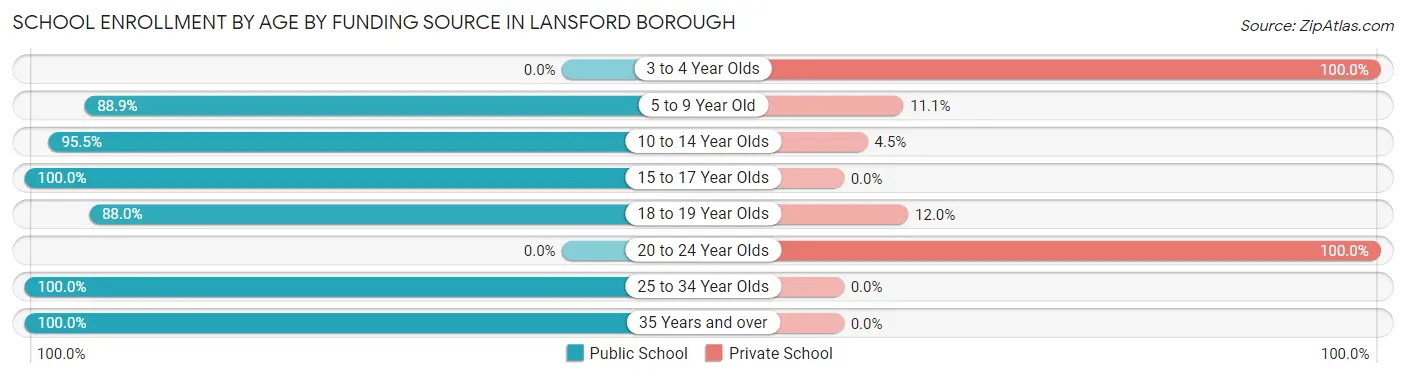
| Age Bracket | Public School | Private School |
| 3 to 4 Year Olds | 0 (0.0%) | 38 (100.0%) |
| 5 to 9 Year Old | 176 (88.9%) | 22 (11.1%) |
| 10 to 14 Year Olds | 343 (95.5%) | 16 (4.5%) |
| 15 to 17 Year Olds | 114 (100.0%) | 0 (0.0%) |
| 18 to 19 Year Olds | 44 (88.0%) | 6 (12.0%) |
| 20 to 24 Year Olds | 0 (0.0%) | 60 (100.0%) |
| 25 to 34 Year Olds | 30 (100.0%) | 0 (0.0%) |
| 35 Years and over | 44 (100.0%) | 0 (0.0%) |
| Total | 751 (84.1%) | 142 (15.9%) |
Educational Attainment by Field of Study in Lansford borough
Education (78 | 24.3%), science & technology (50 | 15.6%), bio, nature & agricultural (46 | 14.3%), liberal arts & history (42 | 13.1%), and engineering (34 | 10.6%) are the most common fields of study among 321 individuals in Lansford borough who have obtained a bachelor's degree or higher.
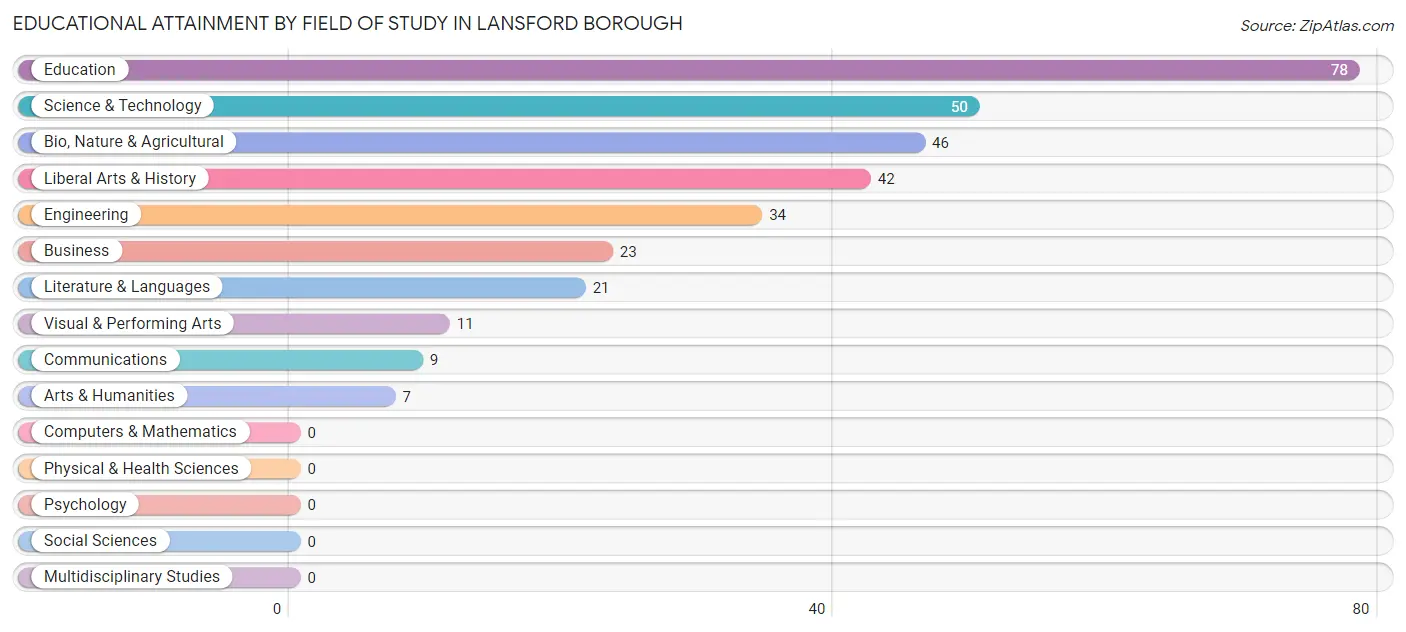
| Field of Study | # Graduates | % Graduates |
| Computers & Mathematics | 0 | 0.0% |
| Bio, Nature & Agricultural | 46 | 14.3% |
| Physical & Health Sciences | 0 | 0.0% |
| Psychology | 0 | 0.0% |
| Social Sciences | 0 | 0.0% |
| Engineering | 34 | 10.6% |
| Multidisciplinary Studies | 0 | 0.0% |
| Science & Technology | 50 | 15.6% |
| Business | 23 | 7.2% |
| Education | 78 | 24.3% |
| Literature & Languages | 21 | 6.5% |
| Liberal Arts & History | 42 | 13.1% |
| Visual & Performing Arts | 11 | 3.4% |
| Communications | 9 | 2.8% |
| Arts & Humanities | 7 | 2.2% |
| Total | 321 | 100.0% |
Transportation & Commute in Lansford borough
Vehicle Availability by Sex in Lansford borough
The most prevalent vehicle ownership categories in Lansford borough are males with 2 vehicles (355, accounting for 48.2%) and females with 2 vehicles (271, making up 51.5%).
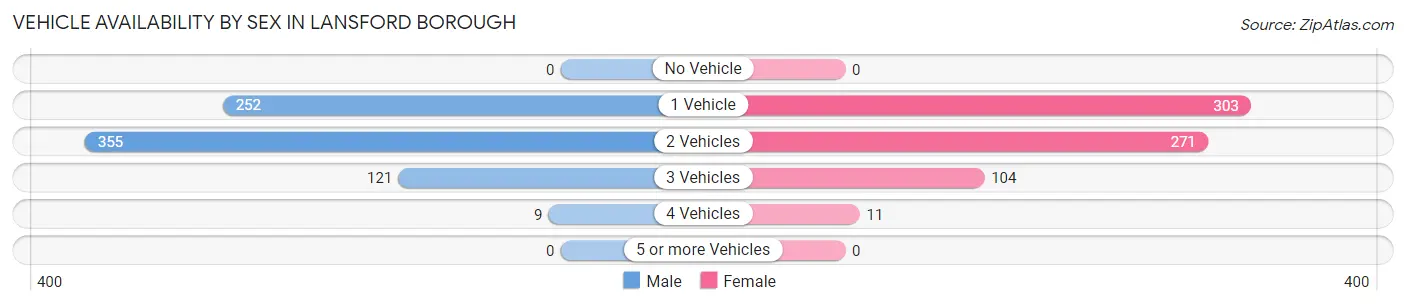
| Vehicles Available | Male | Female |
| No Vehicle | 0 (0.0%) | 0 (0.0%) |
| 1 Vehicle | 252 (34.2%) | 303 (44.0%) |
| 2 Vehicles | 355 (48.2%) | 271 (39.3%) |
| 3 Vehicles | 121 (16.4%) | 104 (15.1%) |
| 4 Vehicles | 9 (1.2%) | 11 (1.6%) |
| 5 or more Vehicles | 0 (0.0%) | 0 (0.0%) |
| Total | 737 (100.0%) | 689 (100.0%) |
Commute Time in Lansford borough
The most frequently occuring commute durations in Lansford borough are 15 to 19 minutes (247 commuters, 18.3%), 45 to 59 minutes (211 commuters, 15.6%), and 20 to 24 minutes (168 commuters, 12.4%).
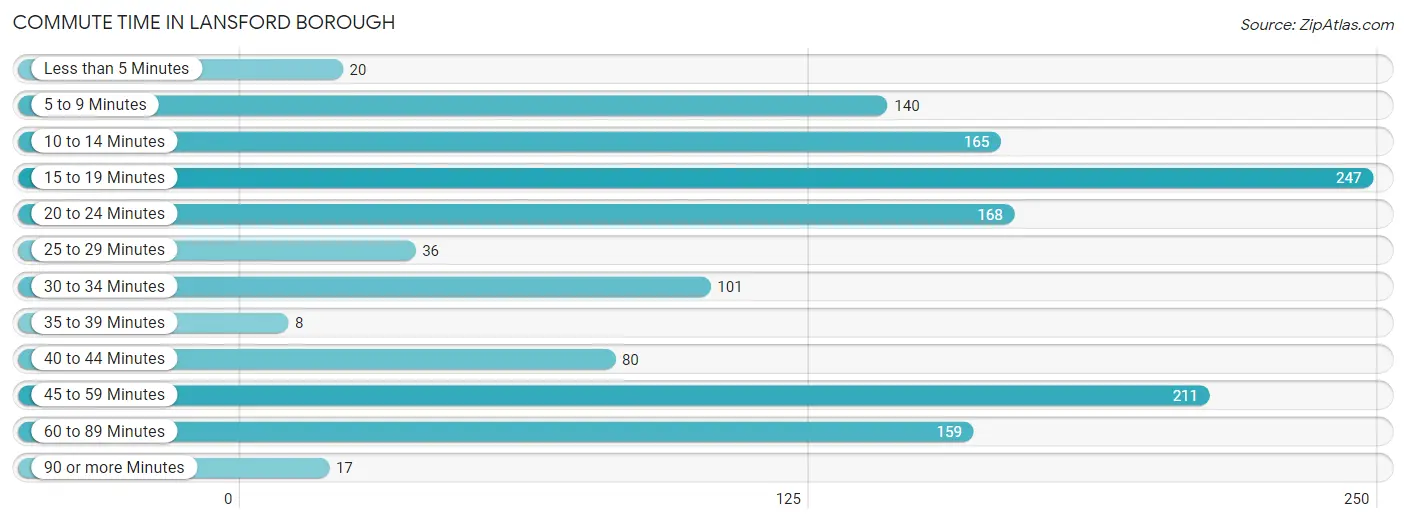
| Commute Time | # Commuters | % Commuters |
| Less than 5 Minutes | 20 | 1.5% |
| 5 to 9 Minutes | 140 | 10.4% |
| 10 to 14 Minutes | 165 | 12.2% |
| 15 to 19 Minutes | 247 | 18.3% |
| 20 to 24 Minutes | 168 | 12.4% |
| 25 to 29 Minutes | 36 | 2.7% |
| 30 to 34 Minutes | 101 | 7.5% |
| 35 to 39 Minutes | 8 | 0.6% |
| 40 to 44 Minutes | 80 | 5.9% |
| 45 to 59 Minutes | 211 | 15.6% |
| 60 to 89 Minutes | 159 | 11.8% |
| 90 or more Minutes | 17 | 1.3% |
Commute Time by Sex in Lansford borough
The most common commute times in Lansford borough are 45 to 59 minutes (185 commuters, 25.5%) for males and 20 to 24 minutes (103 commuters, 16.4%) for females.
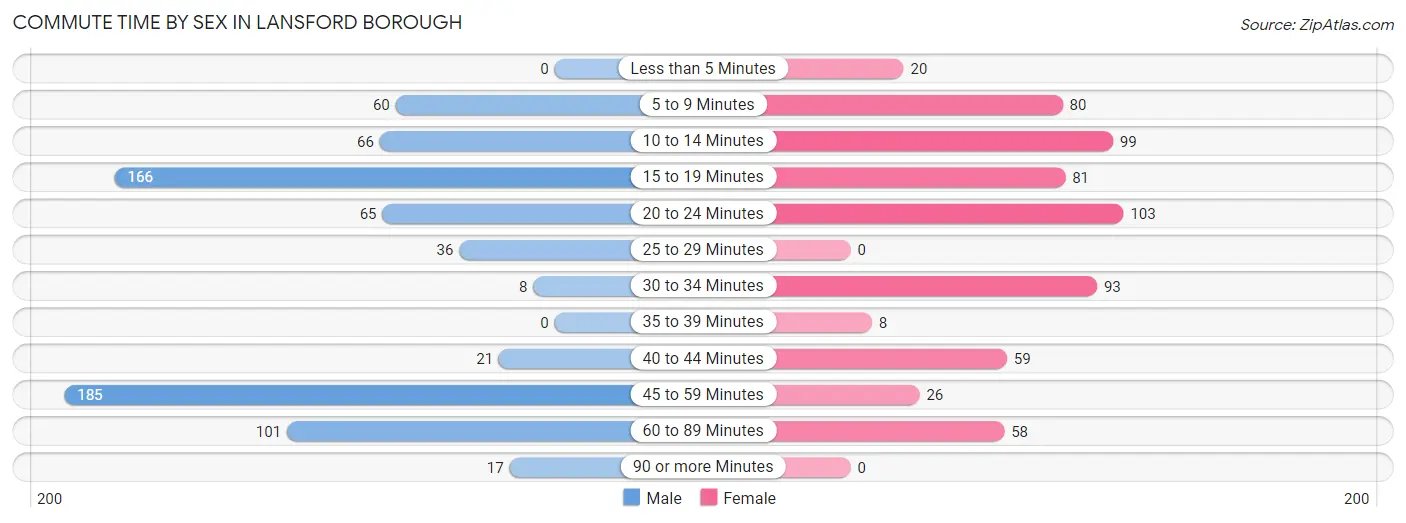
| Commute Time | Male | Female |
| Less than 5 Minutes | 0 (0.0%) | 20 (3.2%) |
| 5 to 9 Minutes | 60 (8.3%) | 80 (12.8%) |
| 10 to 14 Minutes | 66 (9.1%) | 99 (15.8%) |
| 15 to 19 Minutes | 166 (22.9%) | 81 (12.9%) |
| 20 to 24 Minutes | 65 (9.0%) | 103 (16.4%) |
| 25 to 29 Minutes | 36 (5.0%) | 0 (0.0%) |
| 30 to 34 Minutes | 8 (1.1%) | 93 (14.8%) |
| 35 to 39 Minutes | 0 (0.0%) | 8 (1.3%) |
| 40 to 44 Minutes | 21 (2.9%) | 59 (9.4%) |
| 45 to 59 Minutes | 185 (25.5%) | 26 (4.2%) |
| 60 to 89 Minutes | 101 (13.9%) | 58 (9.2%) |
| 90 or more Minutes | 17 (2.3%) | 0 (0.0%) |
Time of Departure to Work by Sex in Lansford borough
The most frequent times of departure to work in Lansford borough are 12:00 PM to 3:59 PM (221, 30.5%) for males and 6:00 AM to 6:29 AM (118, 18.8%) for females.
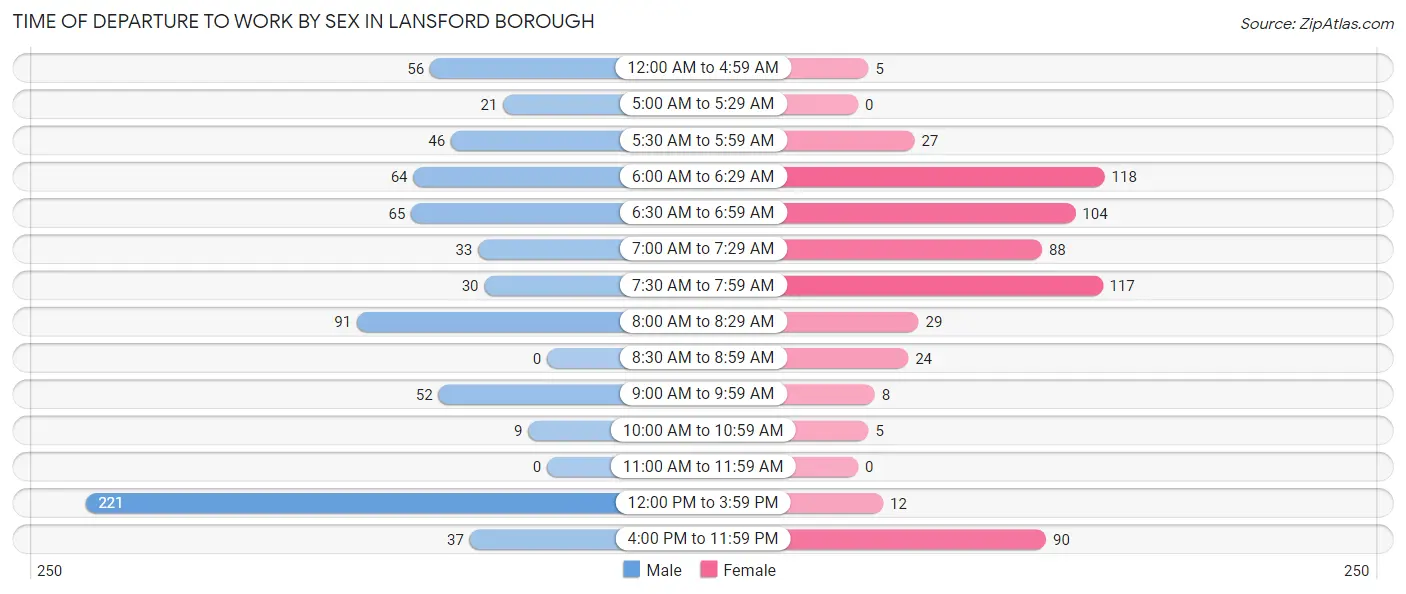
| Time of Departure | Male | Female |
| 12:00 AM to 4:59 AM | 56 (7.7%) | 5 (0.8%) |
| 5:00 AM to 5:29 AM | 21 (2.9%) | 0 (0.0%) |
| 5:30 AM to 5:59 AM | 46 (6.3%) | 27 (4.3%) |
| 6:00 AM to 6:29 AM | 64 (8.8%) | 118 (18.8%) |
| 6:30 AM to 6:59 AM | 65 (9.0%) | 104 (16.6%) |
| 7:00 AM to 7:29 AM | 33 (4.5%) | 88 (14.0%) |
| 7:30 AM to 7:59 AM | 30 (4.1%) | 117 (18.7%) |
| 8:00 AM to 8:29 AM | 91 (12.6%) | 29 (4.6%) |
| 8:30 AM to 8:59 AM | 0 (0.0%) | 24 (3.8%) |
| 9:00 AM to 9:59 AM | 52 (7.2%) | 8 (1.3%) |
| 10:00 AM to 10:59 AM | 9 (1.2%) | 5 (0.8%) |
| 11:00 AM to 11:59 AM | 0 (0.0%) | 0 (0.0%) |
| 12:00 PM to 3:59 PM | 221 (30.5%) | 12 (1.9%) |
| 4:00 PM to 11:59 PM | 37 (5.1%) | 90 (14.3%) |
| Total | 725 (100.0%) | 627 (100.0%) |
Housing Occupancy in Lansford borough
Occupancy by Ownership in Lansford borough
Of the total 1,691 dwellings in Lansford borough, owner-occupied units account for 790 (46.7%), while renter-occupied units make up 901 (53.3%).
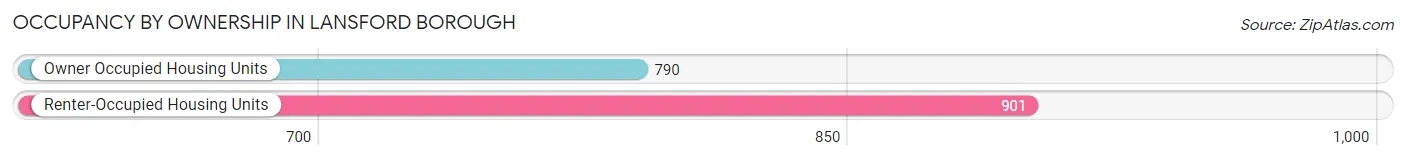
| Occupancy | # Housing Units | % Housing Units |
| Owner Occupied Housing Units | 790 | 46.7% |
| Renter-Occupied Housing Units | 901 | 53.3% |
| Total Occupied Housing Units | 1,691 | 100.0% |
Occupancy by Household Size in Lansford borough
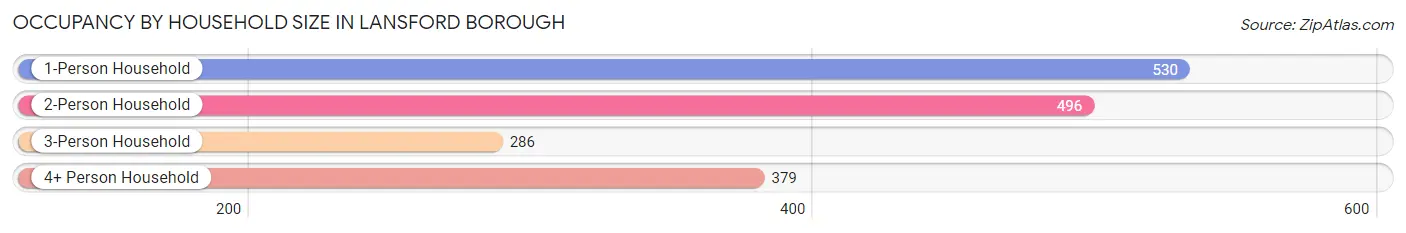
| Household Size | # Housing Units | % Housing Units |
| 1-Person Household | 530 | 31.3% |
| 2-Person Household | 496 | 29.3% |
| 3-Person Household | 286 | 16.9% |
| 4+ Person Household | 379 | 22.4% |
| Total Housing Units | 1,691 | 100.0% |
Occupancy by Ownership by Household Size in Lansford borough
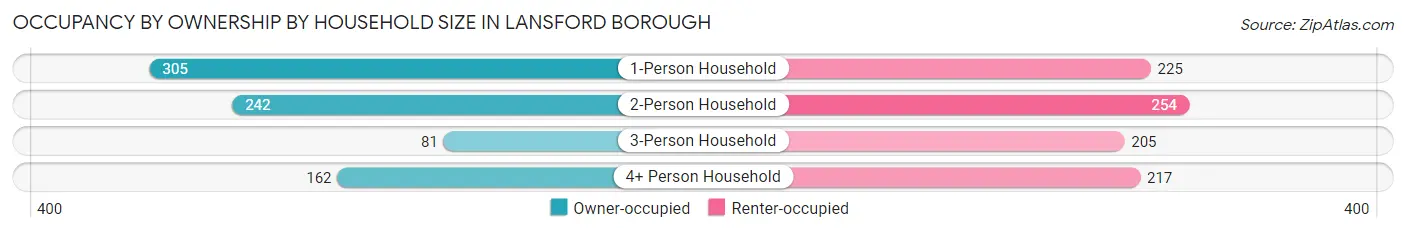
| Household Size | Owner-occupied | Renter-occupied |
| 1-Person Household | 305 (57.6%) | 225 (42.4%) |
| 2-Person Household | 242 (48.8%) | 254 (51.2%) |
| 3-Person Household | 81 (28.3%) | 205 (71.7%) |
| 4+ Person Household | 162 (42.7%) | 217 (57.3%) |
| Total Housing Units | 790 (46.7%) | 901 (53.3%) |
Occupancy by Educational Attainment in Lansford borough
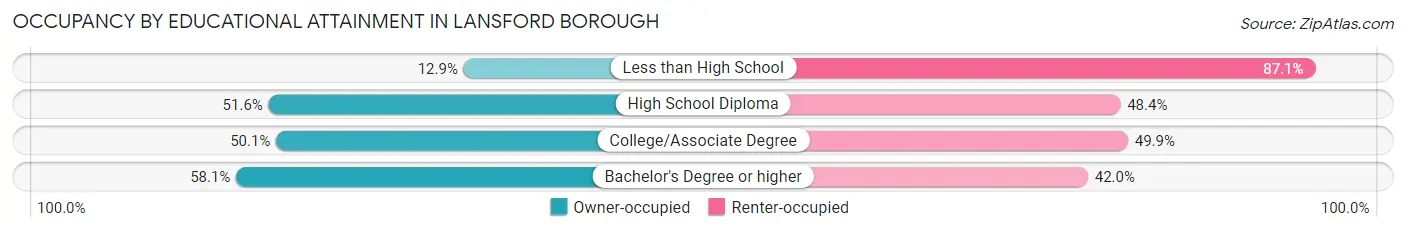
| Household Size | Owner-occupied | Renter-occupied |
| Less than High School | 30 (12.9%) | 202 (87.1%) |
| High School Diploma | 432 (51.6%) | 405 (48.4%) |
| College/Associate Degree | 209 (50.1%) | 208 (49.9%) |
| Bachelor's Degree or higher | 119 (58.1%) | 86 (41.9%) |
Occupancy by Age of Householder in Lansford borough
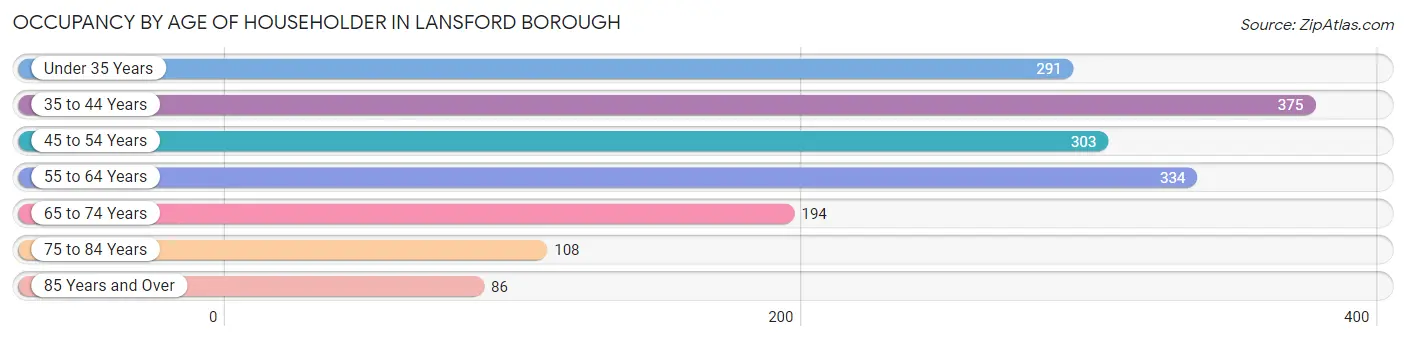
| Age Bracket | # Households | % Households |
| Under 35 Years | 291 | 17.2% |
| 35 to 44 Years | 375 | 22.2% |
| 45 to 54 Years | 303 | 17.9% |
| 55 to 64 Years | 334 | 19.8% |
| 65 to 74 Years | 194 | 11.5% |
| 75 to 84 Years | 108 | 6.4% |
| 85 Years and Over | 86 | 5.1% |
| Total | 1,691 | 100.0% |
Housing Finances in Lansford borough
Median Income by Occupancy in Lansford borough
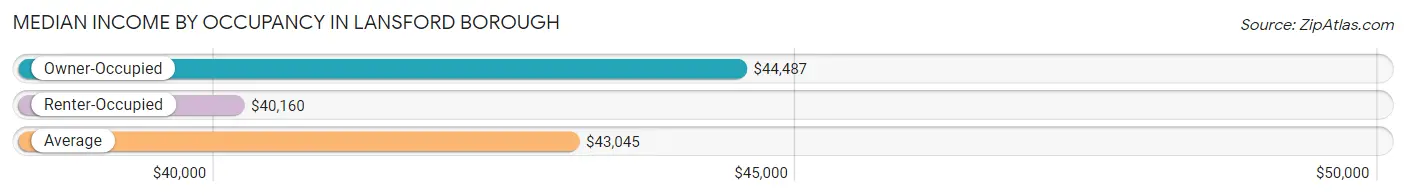
| Occupancy Type | # Households | Median Income |
| Owner-Occupied | 790 (46.7%) | $44,487 |
| Renter-Occupied | 901 (53.3%) | $40,160 |
| Average | 1,691 (100.0%) | $43,045 |
Occupancy by Householder Income Bracket in Lansford borough
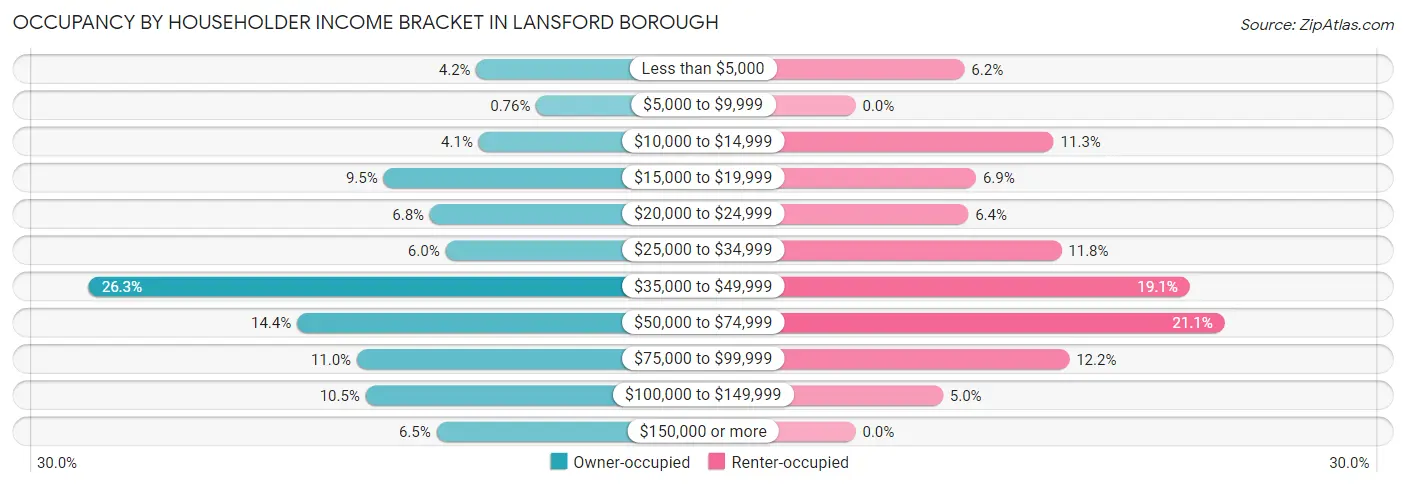
| Income Bracket | Owner-occupied | Renter-occupied |
| Less than $5,000 | 33 (4.2%) | 56 (6.2%) |
| $5,000 to $9,999 | 6 (0.8%) | 0 (0.0%) |
| $10,000 to $14,999 | 32 (4.1%) | 102 (11.3%) |
| $15,000 to $19,999 | 75 (9.5%) | 62 (6.9%) |
| $20,000 to $24,999 | 54 (6.8%) | 58 (6.4%) |
| $25,000 to $34,999 | 47 (5.9%) | 106 (11.8%) |
| $35,000 to $49,999 | 208 (26.3%) | 172 (19.1%) |
| $50,000 to $74,999 | 114 (14.4%) | 190 (21.1%) |
| $75,000 to $99,999 | 87 (11.0%) | 110 (12.2%) |
| $100,000 to $149,999 | 83 (10.5%) | 45 (5.0%) |
| $150,000 or more | 51 (6.5%) | 0 (0.0%) |
| Total | 790 (100.0%) | 901 (100.0%) |
Monthly Housing Cost Tiers in Lansford borough
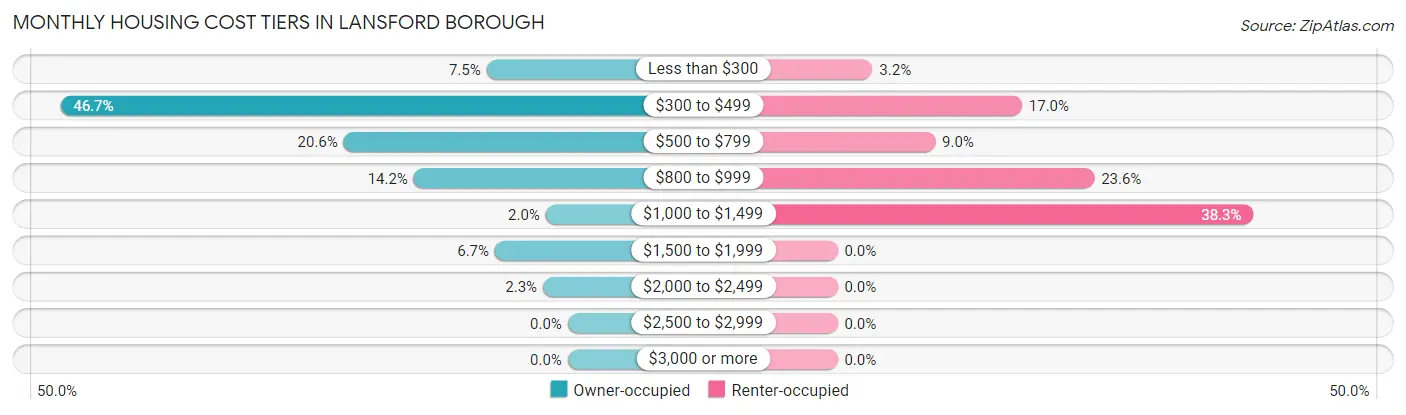
| Monthly Cost | Owner-occupied | Renter-occupied |
| Less than $300 | 59 (7.5%) | 29 (3.2%) |
| $300 to $499 | 369 (46.7%) | 153 (17.0%) |
| $500 to $799 | 163 (20.6%) | 81 (9.0%) |
| $800 to $999 | 112 (14.2%) | 213 (23.6%) |
| $1,000 to $1,499 | 16 (2.0%) | 345 (38.3%) |
| $1,500 to $1,999 | 53 (6.7%) | 0 (0.0%) |
| $2,000 to $2,499 | 18 (2.3%) | 0 (0.0%) |
| $2,500 to $2,999 | 0 (0.0%) | 0 (0.0%) |
| $3,000 or more | 0 (0.0%) | 0 (0.0%) |
| Total | 790 (100.0%) | 901 (100.0%) |
Physical Housing Characteristics in Lansford borough
Housing Structures in Lansford borough
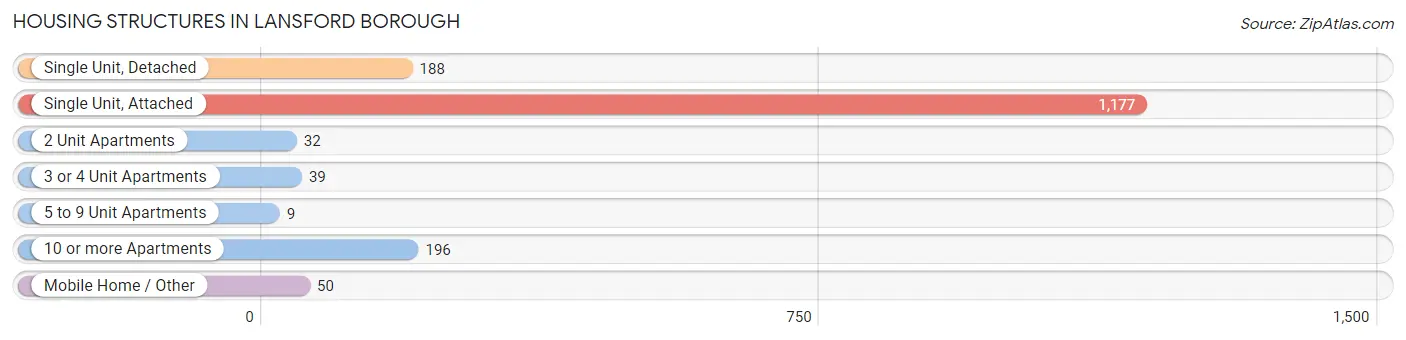
| Structure Type | # Housing Units | % Housing Units |
| Single Unit, Detached | 188 | 11.1% |
| Single Unit, Attached | 1,177 | 69.6% |
| 2 Unit Apartments | 32 | 1.9% |
| 3 or 4 Unit Apartments | 39 | 2.3% |
| 5 to 9 Unit Apartments | 9 | 0.5% |
| 10 or more Apartments | 196 | 11.6% |
| Mobile Home / Other | 50 | 3.0% |
| Total | 1,691 | 100.0% |
Housing Structures by Occupancy in Lansford borough
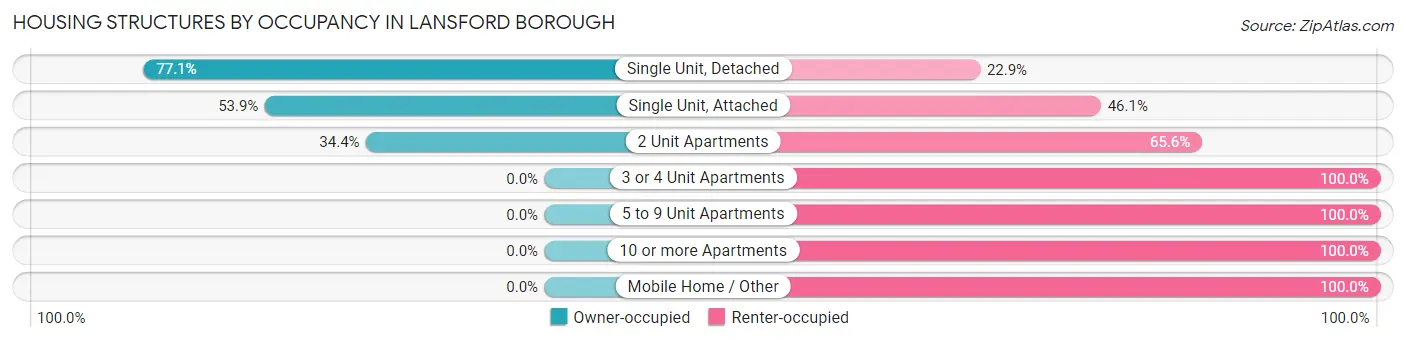
| Structure Type | Owner-occupied | Renter-occupied |
| Single Unit, Detached | 145 (77.1%) | 43 (22.9%) |
| Single Unit, Attached | 634 (53.9%) | 543 (46.1%) |
| 2 Unit Apartments | 11 (34.4%) | 21 (65.6%) |
| 3 or 4 Unit Apartments | 0 (0.0%) | 39 (100.0%) |
| 5 to 9 Unit Apartments | 0 (0.0%) | 9 (100.0%) |
| 10 or more Apartments | 0 (0.0%) | 196 (100.0%) |
| Mobile Home / Other | 0 (0.0%) | 50 (100.0%) |
| Total | 790 (46.7%) | 901 (53.3%) |
Housing Structures by Number of Rooms in Lansford borough
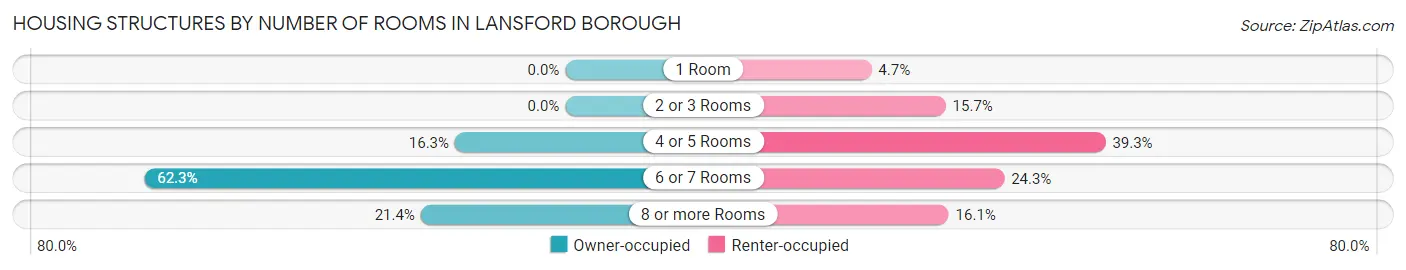
| Number of Rooms | Owner-occupied | Renter-occupied |
| 1 Room | 0 (0.0%) | 42 (4.7%) |
| 2 or 3 Rooms | 0 (0.0%) | 141 (15.7%) |
| 4 or 5 Rooms | 129 (16.3%) | 354 (39.3%) |
| 6 or 7 Rooms | 492 (62.3%) | 219 (24.3%) |
| 8 or more Rooms | 169 (21.4%) | 145 (16.1%) |
| Total | 790 (100.0%) | 901 (100.0%) |
Housing Structure by Heating Type in Lansford borough
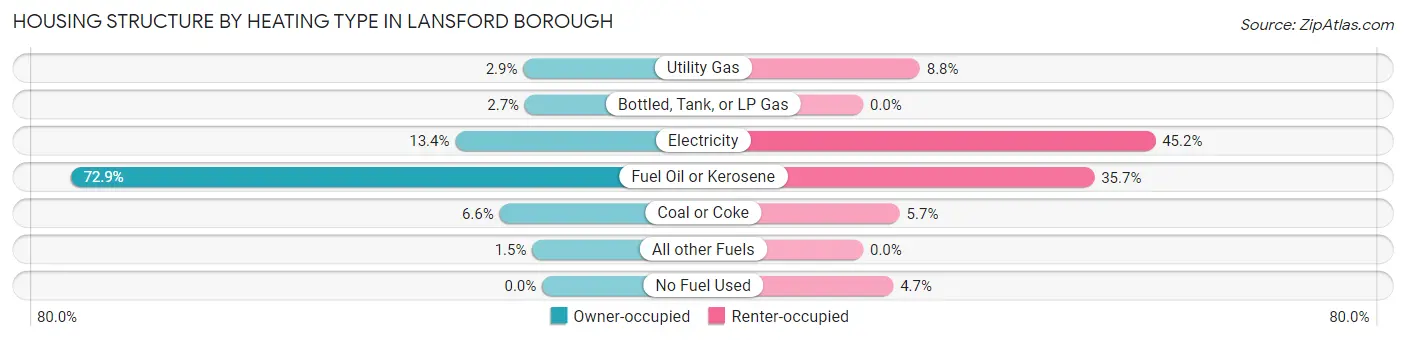
| Heating Type | Owner-occupied | Renter-occupied |
| Utility Gas | 23 (2.9%) | 79 (8.8%) |
| Bottled, Tank, or LP Gas | 21 (2.7%) | 0 (0.0%) |
| Electricity | 106 (13.4%) | 407 (45.2%) |
| Fuel Oil or Kerosene | 576 (72.9%) | 322 (35.7%) |
| Coal or Coke | 52 (6.6%) | 51 (5.7%) |
| All other Fuels | 12 (1.5%) | 0 (0.0%) |
| No Fuel Used | 0 (0.0%) | 42 (4.7%) |
| Total | 790 (100.0%) | 901 (100.0%) |
Household Vehicle Usage in Lansford borough
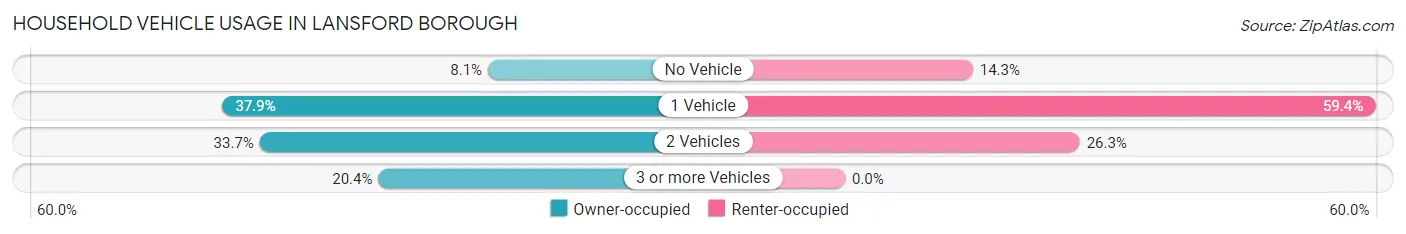
| Vehicles per Household | Owner-occupied | Renter-occupied |
| No Vehicle | 64 (8.1%) | 129 (14.3%) |
| 1 Vehicle | 299 (37.9%) | 535 (59.4%) |
| 2 Vehicles | 266 (33.7%) | 237 (26.3%) |
| 3 or more Vehicles | 161 (20.4%) | 0 (0.0%) |
| Total | 790 (100.0%) | 901 (100.0%) |
Real Estate & Mortgages in Lansford borough
Real Estate and Mortgage Overview in Lansford borough
| Characteristic | Without Mortgage | With Mortgage |
| Housing Units | 567 | 223 |
| Median Property Value | $41,700 | $73,500 |
| Median Household Income | $42,627 | $27 |
| Monthly Housing Costs | $377 | $0 |
| Real Estate Taxes | $1,038 | $0 |
Property Value by Mortgage Status in Lansford borough
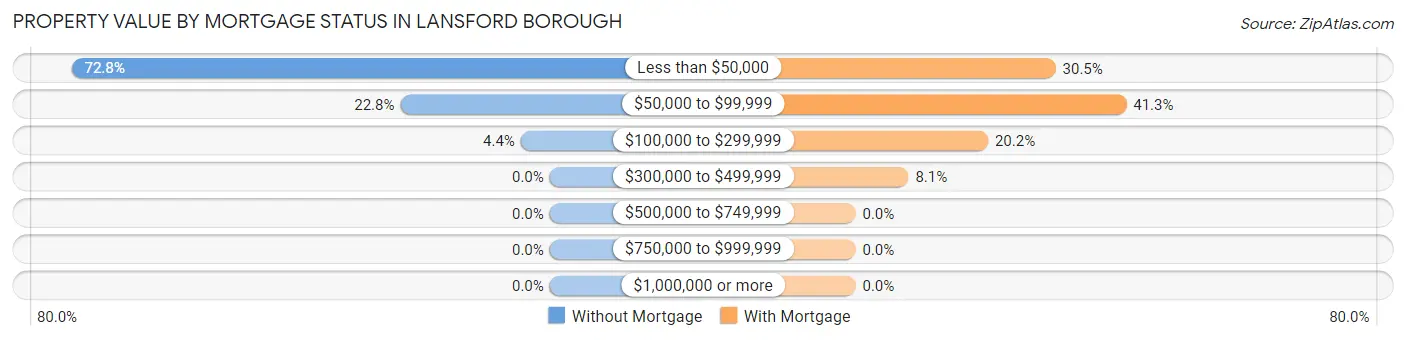
| Property Value | Without Mortgage | With Mortgage |
| Less than $50,000 | 413 (72.8%) | 68 (30.5%) |
| $50,000 to $99,999 | 129 (22.8%) | 92 (41.3%) |
| $100,000 to $299,999 | 25 (4.4%) | 45 (20.2%) |
| $300,000 to $499,999 | 0 (0.0%) | 18 (8.1%) |
| $500,000 to $749,999 | 0 (0.0%) | 0 (0.0%) |
| $750,000 to $999,999 | 0 (0.0%) | 0 (0.0%) |
| $1,000,000 or more | 0 (0.0%) | 0 (0.0%) |
| Total | 567 (100.0%) | 223 (100.0%) |
Household Income by Mortgage Status in Lansford borough
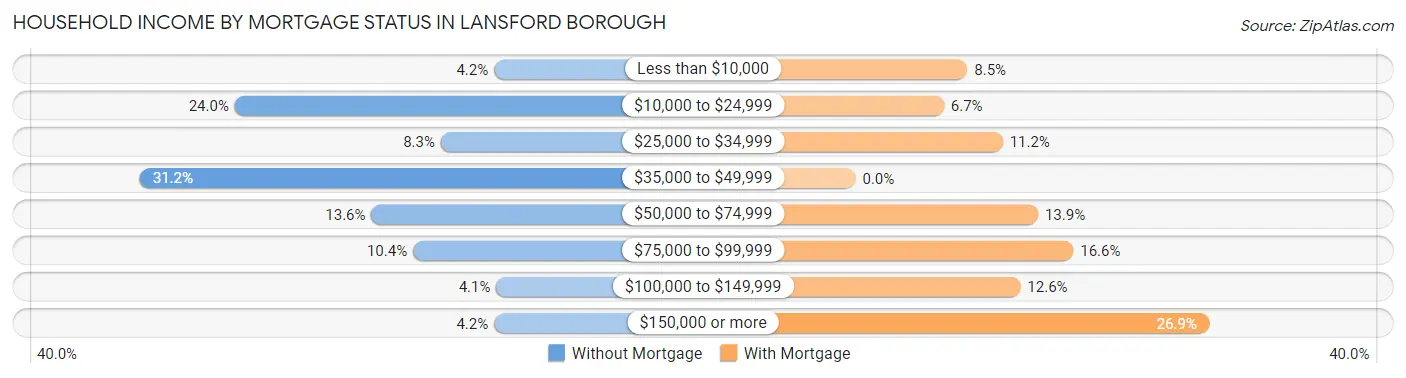
| Household Income | Without Mortgage | With Mortgage |
| Less than $10,000 | 24 (4.2%) | 19 (8.5%) |
| $10,000 to $24,999 | 136 (24.0%) | 15 (6.7%) |
| $25,000 to $34,999 | 47 (8.3%) | 25 (11.2%) |
| $35,000 to $49,999 | 177 (31.2%) | 0 (0.0%) |
| $50,000 to $74,999 | 77 (13.6%) | 31 (13.9%) |
| $75,000 to $99,999 | 59 (10.4%) | 37 (16.6%) |
| $100,000 to $149,999 | 23 (4.1%) | 28 (12.6%) |
| $150,000 or more | 24 (4.2%) | 60 (26.9%) |
| Total | 567 (100.0%) | 223 (100.0%) |
Property Value to Household Income Ratio in Lansford borough
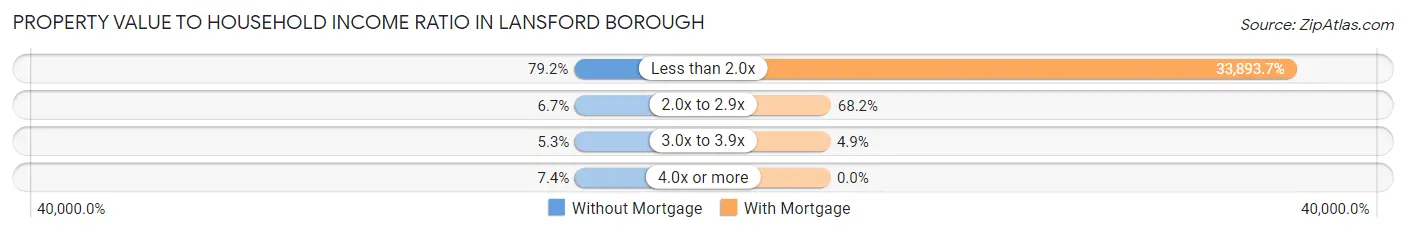
| Value-to-Income Ratio | Without Mortgage | With Mortgage |
| Less than 2.0x | 449 (79.2%) | 75,583 (33,893.7%) |
| 2.0x to 2.9x | 38 (6.7%) | 152 (68.2%) |
| 3.0x to 3.9x | 30 (5.3%) | 11 (4.9%) |
| 4.0x or more | 42 (7.4%) | 0 (0.0%) |
| Total | 567 (100.0%) | 223 (100.0%) |
Real Estate Taxes by Mortgage Status in Lansford borough
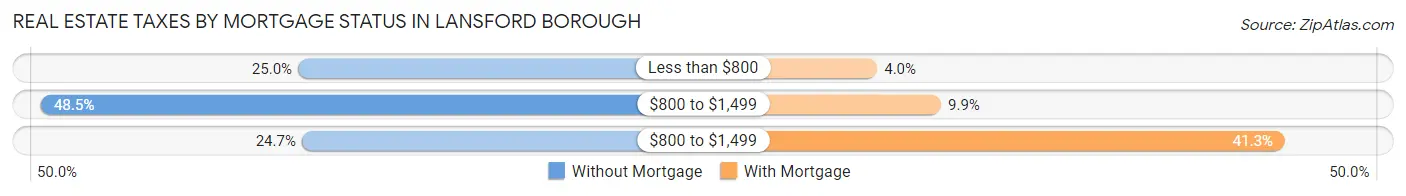
| Property Taxes | Without Mortgage | With Mortgage |
| Less than $800 | 142 (25.0%) | 9 (4.0%) |
| $800 to $1,499 | 275 (48.5%) | 22 (9.9%) |
| $800 to $1,499 | 140 (24.7%) | 92 (41.3%) |
| Total | 567 (100.0%) | 223 (100.0%) |
Health & Disability in Lansford borough
Health Insurance Coverage by Age in Lansford borough
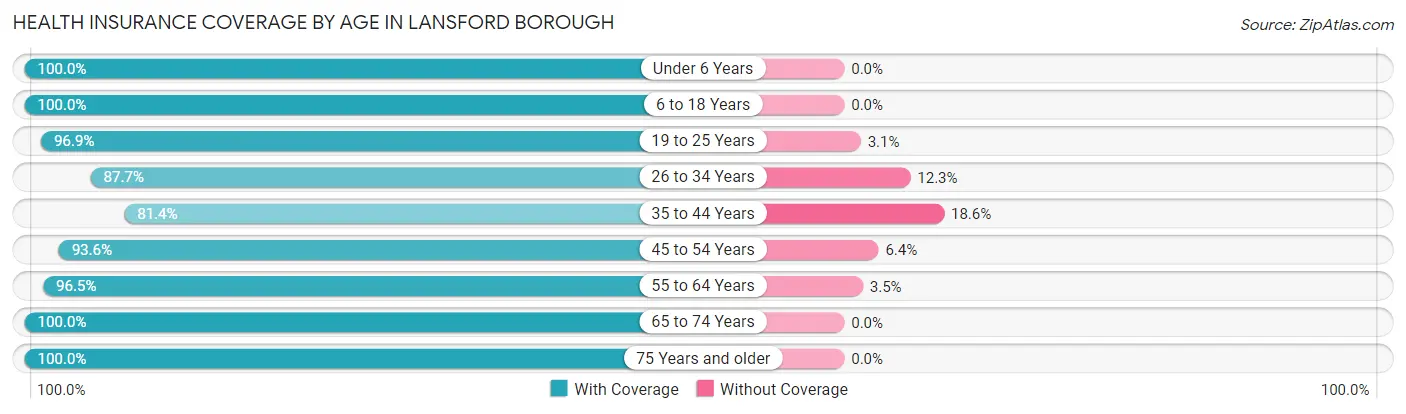
| Age Bracket | With Coverage | Without Coverage |
| Under 6 Years | 442 (100.0%) | 0 (0.0%) |
| 6 to 18 Years | 768 (100.0%) | 0 (0.0%) |
| 19 to 25 Years | 444 (96.9%) | 14 (3.1%) |
| 26 to 34 Years | 249 (87.7%) | 35 (12.3%) |
| 35 to 44 Years | 442 (81.4%) | 101 (18.6%) |
| 45 to 54 Years | 426 (93.6%) | 29 (6.4%) |
| 55 to 64 Years | 502 (96.5%) | 18 (3.5%) |
| 65 to 74 Years | 361 (100.0%) | 0 (0.0%) |
| 75 Years and older | 288 (100.0%) | 0 (0.0%) |
| Total | 3,922 (95.2%) | 197 (4.8%) |
Health Insurance Coverage by Citizenship Status in Lansford borough
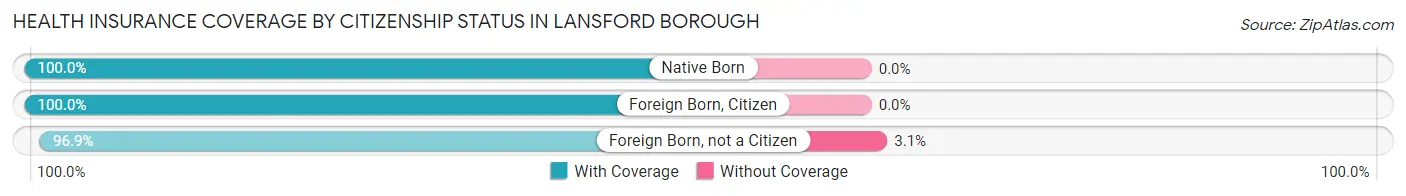
| Citizenship Status | With Coverage | Without Coverage |
| Native Born | 442 (100.0%) | 0 (0.0%) |
| Foreign Born, Citizen | 768 (100.0%) | 0 (0.0%) |
| Foreign Born, not a Citizen | 444 (96.9%) | 14 (3.1%) |
Health Insurance Coverage by Household Income in Lansford borough
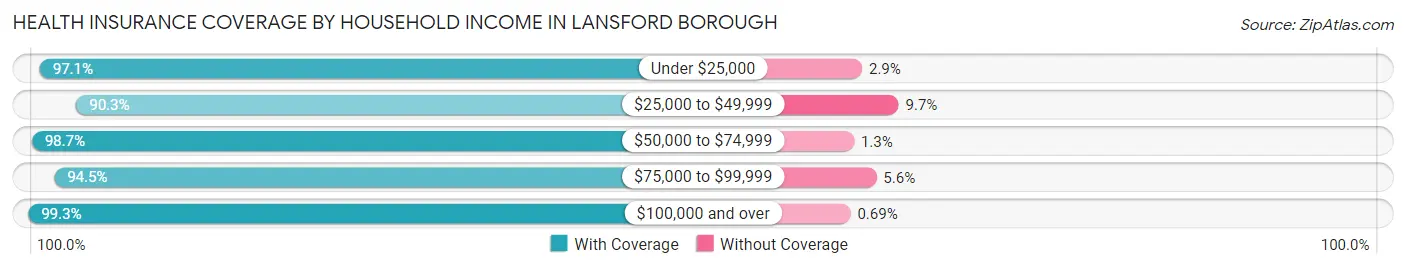
| Household Income | With Coverage | Without Coverage |
| Under $25,000 | 747 (97.1%) | 22 (2.9%) |
| $25,000 to $49,999 | 1,117 (90.3%) | 120 (9.7%) |
| $50,000 to $74,999 | 955 (98.7%) | 13 (1.3%) |
| $75,000 to $99,999 | 664 (94.5%) | 39 (5.6%) |
| $100,000 and over | 432 (99.3%) | 3 (0.7%) |
Public vs Private Health Insurance Coverage by Age in Lansford borough
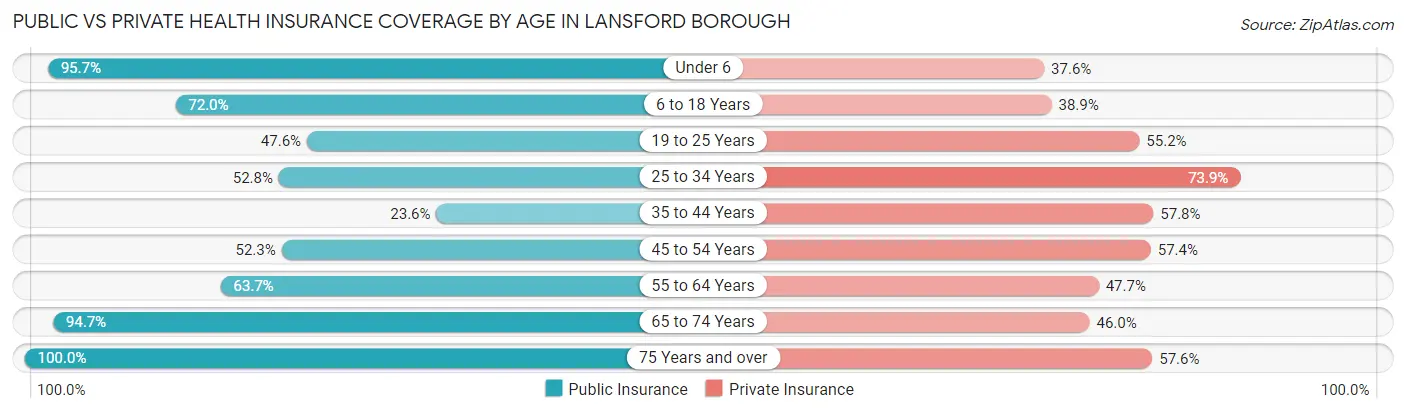
| Age Bracket | Public Insurance | Private Insurance |
| Under 6 | 423 (95.7%) | 166 (37.6%) |
| 6 to 18 Years | 553 (72.0%) | 299 (38.9%) |
| 19 to 25 Years | 218 (47.6%) | 253 (55.2%) |
| 25 to 34 Years | 150 (52.8%) | 210 (73.9%) |
| 35 to 44 Years | 128 (23.6%) | 314 (57.8%) |
| 45 to 54 Years | 238 (52.3%) | 261 (57.4%) |
| 55 to 64 Years | 331 (63.6%) | 248 (47.7%) |
| 65 to 74 Years | 342 (94.7%) | 166 (46.0%) |
| 75 Years and over | 288 (100.0%) | 166 (57.6%) |
| Total | 2,671 (64.8%) | 2,083 (50.6%) |
Disability Status by Sex by Age in Lansford borough
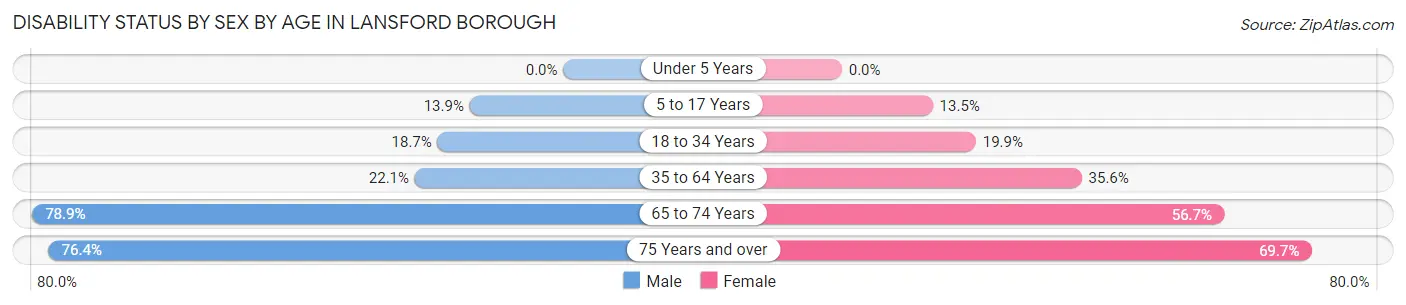
| Age Bracket | Male | Female |
| Under 5 Years | 0 (0.0%) | 0 (0.0%) |
| 5 to 17 Years | 51 (13.9%) | 41 (13.5%) |
| 18 to 34 Years | 87 (18.7%) | 80 (19.9%) |
| 35 to 64 Years | 170 (22.1%) | 266 (35.6%) |
| 65 to 74 Years | 97 (78.9%) | 135 (56.7%) |
| 75 Years and over | 94 (76.4%) | 115 (69.7%) |
Disability Class by Sex by Age in Lansford borough
Disability Class: Hearing Difficulty
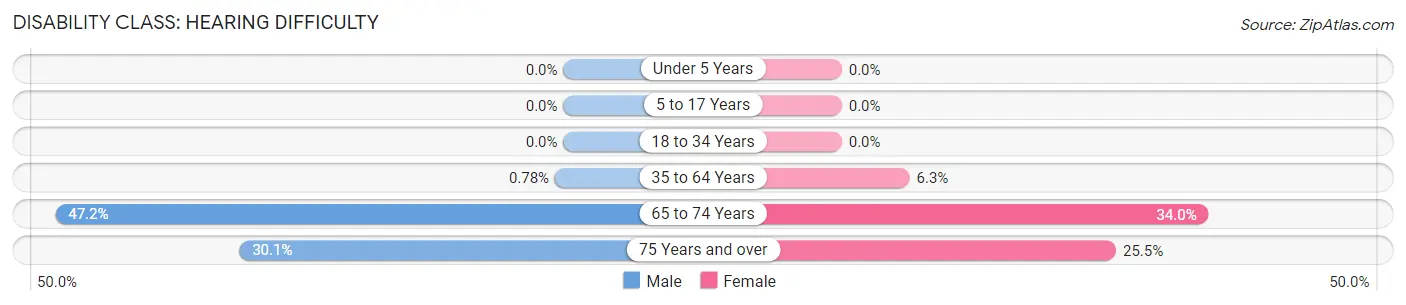
| Age Bracket | Male | Female |
| Under 5 Years | 0 (0.0%) | 0 (0.0%) |
| 5 to 17 Years | 0 (0.0%) | 0 (0.0%) |
| 18 to 34 Years | 0 (0.0%) | 0 (0.0%) |
| 35 to 64 Years | 6 (0.8%) | 47 (6.3%) |
| 65 to 74 Years | 58 (47.1%) | 81 (34.0%) |
| 75 Years and over | 37 (30.1%) | 42 (25.5%) |
Disability Class: Vision Difficulty
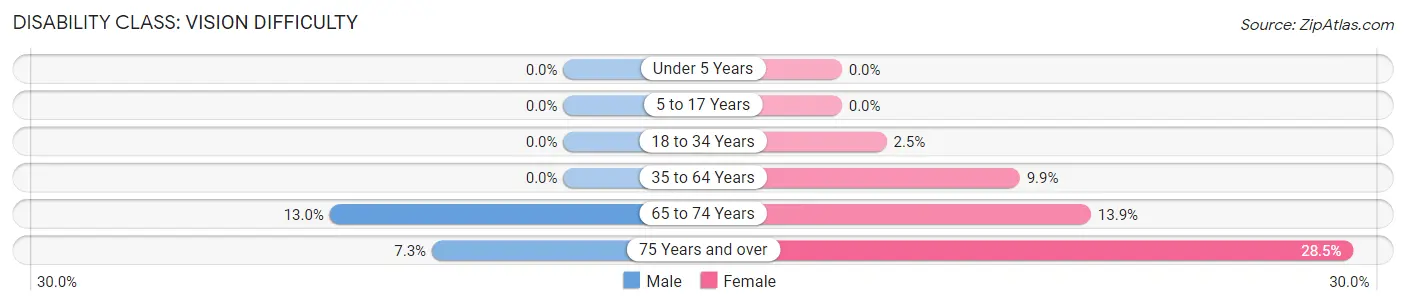
| Age Bracket | Male | Female |
| Under 5 Years | 0 (0.0%) | 0 (0.0%) |
| 5 to 17 Years | 0 (0.0%) | 0 (0.0%) |
| 18 to 34 Years | 0 (0.0%) | 10 (2.5%) |
| 35 to 64 Years | 0 (0.0%) | 74 (9.9%) |
| 65 to 74 Years | 16 (13.0%) | 33 (13.9%) |
| 75 Years and over | 9 (7.3%) | 47 (28.5%) |
Disability Class: Cognitive Difficulty
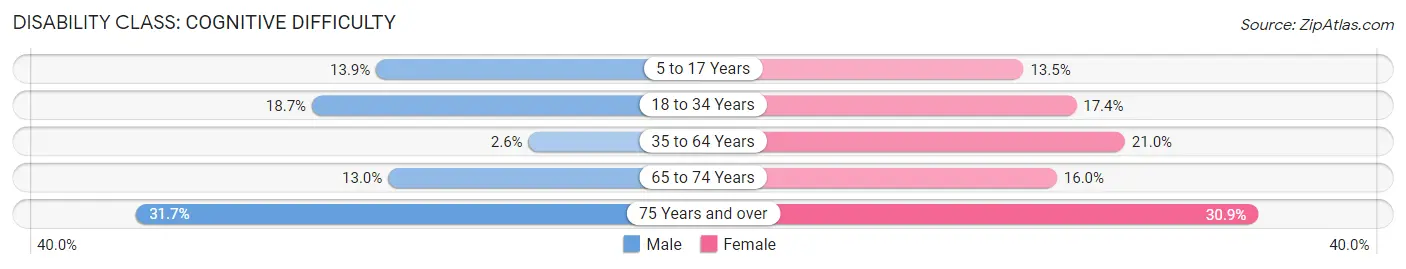
| Age Bracket | Male | Female |
| 5 to 17 Years | 51 (13.9%) | 41 (13.5%) |
| 18 to 34 Years | 87 (18.7%) | 70 (17.4%) |
| 35 to 64 Years | 20 (2.6%) | 157 (21.0%) |
| 65 to 74 Years | 16 (13.0%) | 38 (16.0%) |
| 75 Years and over | 39 (31.7%) | 51 (30.9%) |
Disability Class: Ambulatory Difficulty
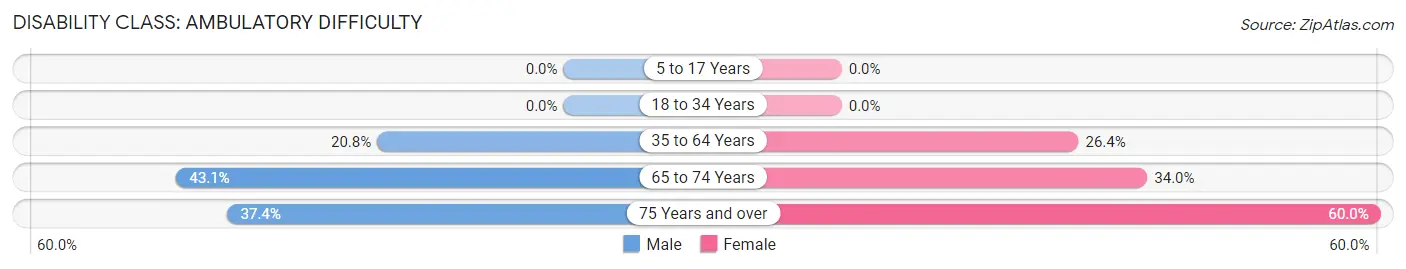
| Age Bracket | Male | Female |
| 5 to 17 Years | 0 (0.0%) | 0 (0.0%) |
| 18 to 34 Years | 0 (0.0%) | 0 (0.0%) |
| 35 to 64 Years | 160 (20.7%) | 197 (26.4%) |
| 65 to 74 Years | 53 (43.1%) | 81 (34.0%) |
| 75 Years and over | 46 (37.4%) | 99 (60.0%) |
Disability Class: Self-Care Difficulty
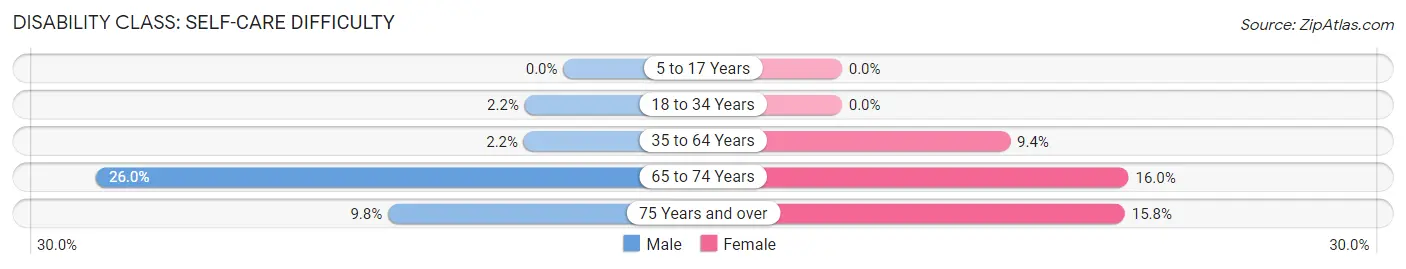
| Age Bracket | Male | Female |
| 5 to 17 Years | 0 (0.0%) | 0 (0.0%) |
| 18 to 34 Years | 10 (2.1%) | 0 (0.0%) |
| 35 to 64 Years | 17 (2.2%) | 70 (9.4%) |
| 65 to 74 Years | 32 (26.0%) | 38 (16.0%) |
| 75 Years and over | 12 (9.8%) | 26 (15.8%) |
Technology Access in Lansford borough
Computing Device Access in Lansford borough
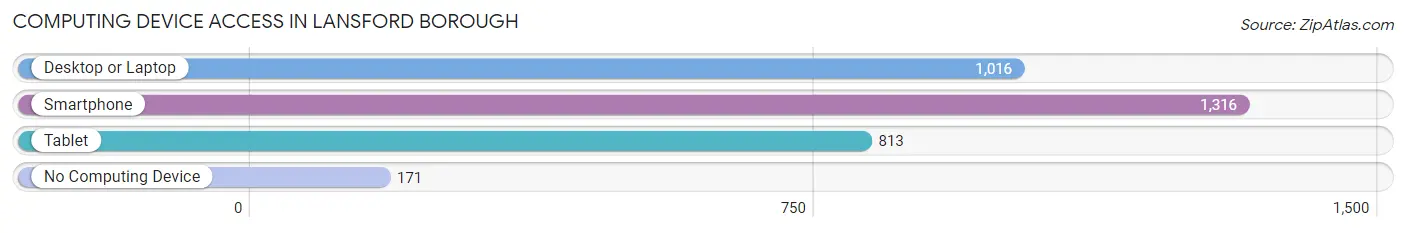
| Device Type | # Households | % Households |
| Desktop or Laptop | 1,016 | 60.1% |
| Smartphone | 1,316 | 77.8% |
| Tablet | 813 | 48.1% |
| No Computing Device | 171 | 10.1% |
| Total | 1,691 | 100.0% |
Internet Access in Lansford borough
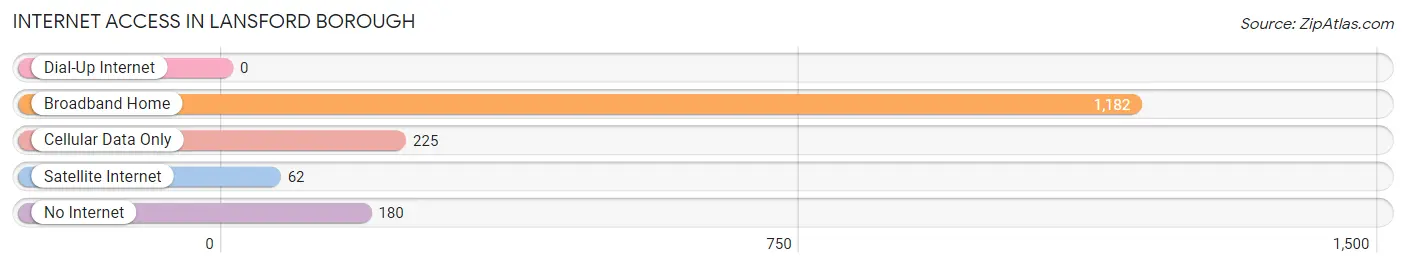
| Internet Type | # Households | % Households |
| Dial-Up Internet | 0 | 0.0% |
| Broadband Home | 1,182 | 69.9% |
| Cellular Data Only | 225 | 13.3% |
| Satellite Internet | 62 | 3.7% |
| No Internet | 180 | 10.6% |
| Total | 1,691 | 100.0% |
Lansford borough Summary
Lansford Borough is a small borough located in Carbon County, Pennsylvania. It is situated in the eastern part of the state, approximately two miles south of the city of Hazleton. The borough is part of the Lehigh Valley region and is bordered by the townships of Banks, East Penn, and Packer. The population of Lansford Borough was 3,074 at the 2010 census.
History
Lansford Borough was founded in 1864 by a group of miners from the Lehigh Valley Coal Company. The miners named the town after their leader, John Lansford. The town was originally a mining town, and the coal industry was the main source of employment for the residents. The coal industry declined in the late 19th century, and the town began to diversify its economy.
In the early 20th century, Lansford Borough became a center for the silk industry. The silk industry provided employment for many of the town’s residents, and the town’s population grew rapidly. The silk industry declined in the mid-20th century, and the town’s economy shifted to other industries, such as manufacturing and retail.
Geography
Lansford Borough is located in Carbon County, Pennsylvania. It is situated in the eastern part of the state, approximately two miles south of the city of Hazleton. The borough is part of the Lehigh Valley region and is bordered by the townships of Banks, East Penn, and Packer. The borough has a total area of 0.7 square miles, all of which is land.
The borough is located in the Appalachian Mountains, and the terrain is mostly hilly. The highest point in the borough is 1,400 feet above sea level. The borough is located in the Lehigh Valley region, and the climate is humid continental. The average temperature in the summer is around 75 degrees Fahrenheit, and the average temperature in the winter is around 30 degrees Fahrenheit.
Economy
The economy of Lansford Borough is largely based on manufacturing and retail. The borough is home to several manufacturing companies, including a steel mill, a paper mill, and a plastics factory. The borough also has several retail stores, including a grocery store, a hardware store, and a clothing store.
The borough also has a number of restaurants and bars, as well as a movie theater. The borough is home to several small businesses, including a bakery, a florist, and a pet store. The borough also has a number of professional services, such as lawyers, accountants, and doctors.
Demographics
As of the 2010 census, the population of Lansford Borough was 3,074. The population is largely white (90.2%), with a small percentage of African Americans (3.2%), Hispanics (2.7%), and Asians (1.3%). The median household income in the borough is $37,941, and the median age is 41.7 years.
The borough has a high rate of poverty, with 24.3% of the population living below the poverty line. The borough also has a high rate of unemployment, with 8.3% of the population unemployed. The borough has a high rate of crime, with a crime rate of 8.3 per 1,000 residents.
Conclusion
Lansford Borough is a small borough located in Carbon County, Pennsylvania. It is situated in the eastern part of the state, approximately two miles south of the city of Hazleton. The borough is part of the Lehigh Valley region and is bordered by the townships of Banks, East Penn, and Packer. The population of Lansford Borough was 3,074 at the 2010 census. The economy of the borough is largely based on manufacturing and retail, and the borough has a high rate of poverty and unemployment. The borough also has a high rate of crime.
Common Questions
What is Per Capita Income in Lansford borough?
Per Capita income in Lansford borough is $22,291.
What is the Median Family Income in Lansford borough?
Median Family Income in Lansford borough is $49,609.
What is the Median Household income in Lansford borough?
Median Household Income in Lansford borough is $43,045.
What is Income or Wage Gap in Lansford borough?
Income or Wage Gap in Lansford borough is 19.6%.
Women in Lansford borough earn 80.4 cents for every dollar earned by a man.
What is Family Income Deficit in Lansford borough?
Family Income Deficit in Lansford borough is $12,775.
Families that are below poverty line in Lansford borough earn $12,775 less on average than the poverty threshold level.
What is Inequality or Gini Index in Lansford borough?
Inequality or Gini Index in Lansford borough is 0.41.
What is the Total Population of Lansford borough?
Total Population of Lansford borough is 4,129.
What is the Total Male Population of Lansford borough?
Total Male Population of Lansford borough is 2,069.
What is the Total Female Population of Lansford borough?
Total Female Population of Lansford borough is 2,060.
What is the Ratio of Males per 100 Females in Lansford borough?
There are 100.44 Males per 100 Females in Lansford borough.
What is the Ratio of Females per 100 Males in Lansford borough?
There are 99.57 Females per 100 Males in Lansford borough.
What is the Median Population Age in Lansford borough?
Median Population Age in Lansford borough is 37.1 Years.
What is the Average Family Size in Lansford borough
Average Family Size in Lansford borough is 3.0 People.
What is the Average Household Size in Lansford borough
Average Household Size in Lansford borough is 2.4 People.
How Large is the Labor Force in Lansford borough?
There are 1,818 People in the Labor Forcein in Lansford borough.
What is the Percentage of People in the Labor Force in Lansford borough?
58.3% of People are in the Labor Force in Lansford borough.
What is the Unemployment Rate in Lansford borough?
Unemployment Rate in Lansford borough is 19.6%.