Cities with the Highest Percentage of Population Employed in Administrative & Support Services in Oregon
RELATED REPORTS & OPTIONS
Administrative & Support Services
Oregon
Compare Cities
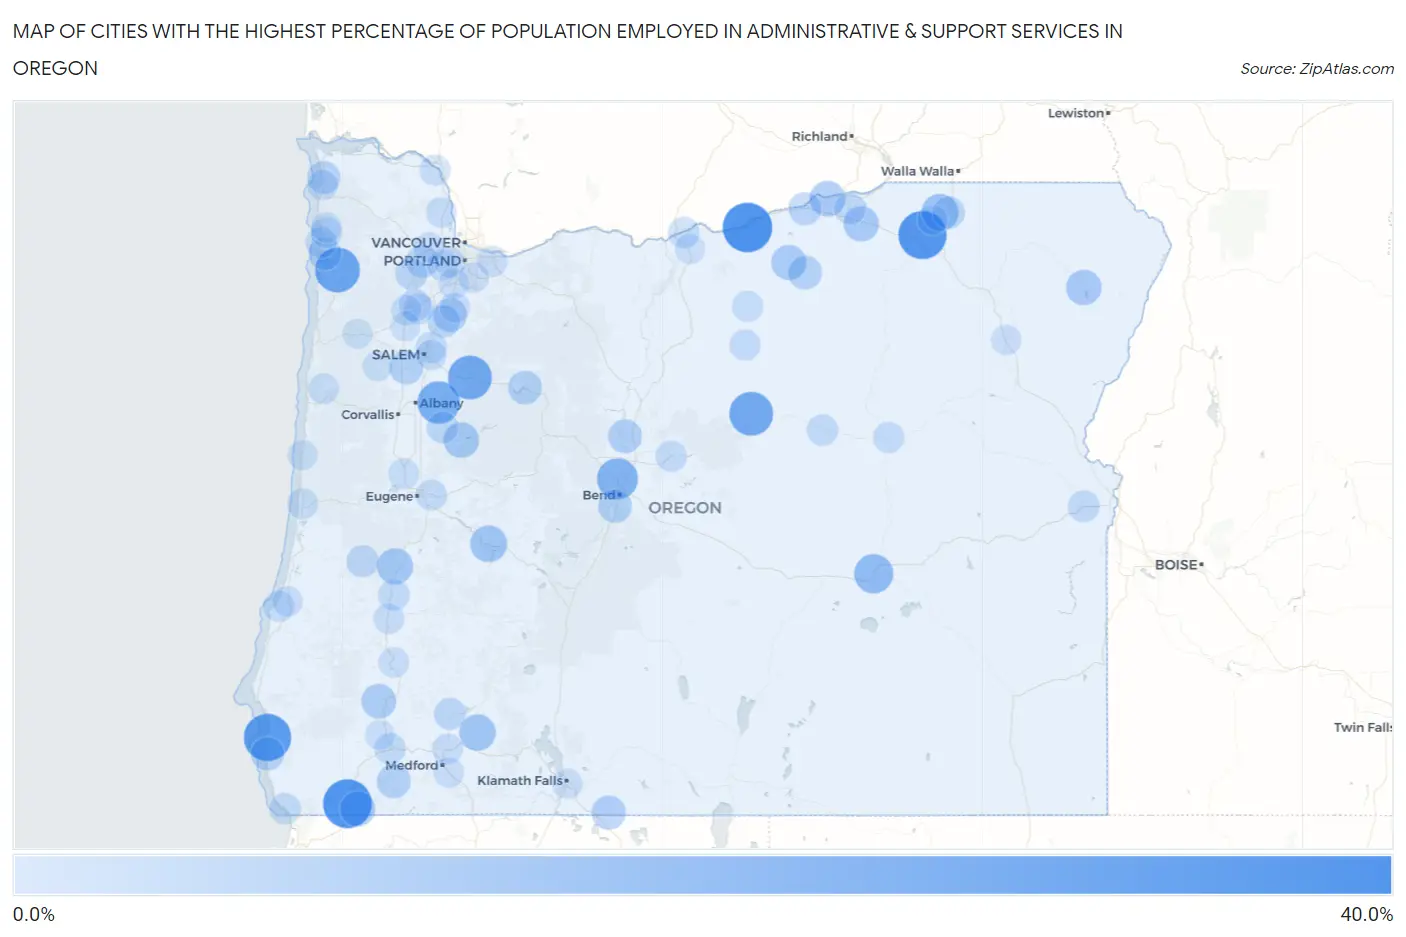
Map of Cities with the Highest Percentage of Population Employed in Administrative & Support Services in Oregon
0.0%
40.0%
Cities with the Highest Percentage of Population Employed in Administrative & Support Services in Oregon
| City | % Employed | vs State | vs National | |
| 1. | Arlington | 31.8% | 3.9%(+27.9)#1 | 4.1%(+27.7)#163 |
| 2. | O Brien | 30.8% | 3.9%(+26.8)#2 | 4.1%(+26.6)#173 |
| 3. | Kirkpatrick | 29.9% | 3.9%(+25.9)#3 | 4.1%(+25.7)#185 |
| 4. | Nesika Beach | 28.7% | 3.9%(+24.8)#4 | 4.1%(+24.6)#212 |
| 5. | Fairview | 25.1% | 3.9%(+21.2)#5 | 4.1%(+21.0)#272 |
| 6. | Mehama | 23.7% | 3.9%(+19.7)#6 | 4.1%(+19.5)#319 |
| 7. | Mitchell | 23.6% | 3.9%(+19.7)#7 | 4.1%(+19.5)#321 |
| 8. | Crabtree | 21.9% | 3.9%(+18.0)#8 | 4.1%(+17.8)#379 |
| 9. | Prineville Lake Acres | 21.7% | 3.9%(+17.8)#9 | 4.1%(+17.6)#386 |
| 10. | Tumalo | 19.7% | 3.9%(+15.8)#10 | 4.1%(+15.6)#456 |
| 11. | Hines | 17.2% | 3.9%(+13.3)#11 | 4.1%(+13.1)#592 |
| 12. | Cheshire | 17.0% | 3.9%(+13.0)#12 | 4.1%(+12.8)#612 |
| 13. | Jasper | 16.4% | 3.9%(+12.4)#13 | 4.1%(+12.2)#656 |
| 14. | Chemult | 16.3% | 3.9%(+12.3)#14 | 4.1%(+12.1)#664 |
| 15. | Athena | 14.5% | 3.9%(+10.6)#15 | 4.1%(+10.4)#860 |
| 16. | Oakridge | 14.0% | 3.9%(+10.1)#16 | 4.1%(+9.89)#937 |
| 17. | Butte Falls | 13.4% | 3.9%(+9.47)#17 | 4.1%(+9.26)#1,045 |
| 18. | Yoncalla | 13.0% | 3.9%(+9.09)#18 | 4.1%(+8.88)#1,118 |
| 19. | Bayshore | 12.4% | 3.9%(+8.43)#19 | 4.1%(+8.23)#1,230 |
| 20. | Sweet Home | 12.3% | 3.9%(+8.37)#20 | 4.1%(+8.16)#1,243 |
| 21. | Irrigon | 12.2% | 3.9%(+8.30)#21 | 4.1%(+8.10)#1,254 |
| 22. | Ochoco West | 12.1% | 3.9%(+8.18)#22 | 4.1%(+7.97)#1,282 |
| 23. | Joseph | 12.1% | 3.9%(+8.16)#23 | 4.1%(+7.96)#1,288 |
| 24. | Echo | 12.0% | 3.9%(+8.06)#24 | 4.1%(+7.85)#1,309 |
| 25. | Takilma | 11.9% | 3.9%(+7.94)#25 | 4.1%(+7.74)#1,339 |
| 26. | Ione | 11.4% | 3.9%(+7.47)#26 | 4.1%(+7.26)#1,441 |
| 27. | Glendale | 11.1% | 3.9%(+7.14)#27 | 4.1%(+6.93)#1,534 |
| 28. | Hubbard | 10.2% | 3.9%(+6.29)#28 | 4.1%(+6.08)#1,803 |
| 29. | Malin | 10.2% | 3.9%(+6.27)#29 | 4.1%(+6.07)#1,811 |
| 30. | Crooked River Ranch | 10.1% | 3.9%(+6.14)#30 | 4.1%(+5.93)#1,866 |
| 31. | Mapleton | 10.1% | 3.9%(+6.13)#31 | 4.1%(+5.92)#1,871 |
| 32. | Detroit | 10.0% | 3.9%(+6.06)#32 | 4.1%(+5.85)#1,908 |
| 33. | Williams | 10.0% | 3.9%(+6.04)#33 | 4.1%(+5.83)#1,924 |
| 34. | Independence | 9.9% | 3.9%(+5.95)#34 | 4.1%(+5.74)#1,956 |
| 35. | Lexington | 9.8% | 3.9%(+5.86)#35 | 4.1%(+5.65)#1,992 |
| 36. | Deschutes River Woods | 9.6% | 3.9%(+5.70)#36 | 4.1%(+5.49)#2,055 |
| 37. | Gold Beach | 9.4% | 3.9%(+5.46)#37 | 4.1%(+5.25)#2,166 |
| 38. | Pleasant Valley | 9.1% | 3.9%(+5.15)#38 | 4.1%(+4.94)#2,314 |
| 39. | Gearhart | 9.0% | 3.9%(+5.03)#39 | 4.1%(+4.82)#2,391 |
| 40. | Boardman | 8.7% | 3.9%(+4.76)#40 | 4.1%(+4.55)#2,549 |
| 41. | Cornelius | 8.5% | 3.9%(+4.59)#41 | 4.1%(+4.38)#2,662 |
| 42. | Garibaldi | 8.4% | 3.9%(+4.47)#42 | 4.1%(+4.27)#2,725 |
| 43. | Cherry Grove | 8.3% | 3.9%(+4.34)#43 | 4.1%(+4.14)#2,814 |
| 44. | Woodburn | 8.2% | 3.9%(+4.30)#44 | 4.1%(+4.10)#2,837 |
| 45. | Weston | 7.9% | 3.9%(+3.99)#45 | 4.1%(+3.79)#3,040 |
| 46. | Elkton | 7.7% | 3.9%(+3.75)#46 | 4.1%(+3.54)#3,226 |
| 47. | Lafayette | 7.6% | 3.9%(+3.70)#47 | 4.1%(+3.50)#3,269 |
| 48. | Trail | 7.5% | 3.9%(+3.58)#48 | 4.1%(+3.38)#3,364 |
| 49. | Gaston | 7.4% | 3.9%(+3.49)#49 | 4.1%(+3.28)#3,469 |
| 50. | Vale | 7.2% | 3.9%(+3.30)#50 | 4.1%(+3.09)#3,644 |
| 51. | Sodaville | 7.0% | 3.9%(+3.10)#51 | 4.1%(+2.89)#3,864 |
| 52. | Hermiston | 7.0% | 3.9%(+3.03)#52 | 4.1%(+2.82)#3,936 |
| 53. | Harbor | 6.9% | 3.9%(+2.93)#53 | 4.1%(+2.72)#4,023 |
| 54. | Rockaway Beach | 6.9% | 3.9%(+2.91)#54 | 4.1%(+2.71)#4,041 |
| 55. | Dayville | 6.7% | 3.9%(+2.79)#55 | 4.1%(+2.58)#4,161 |
| 56. | Grants Pass | 6.7% | 3.9%(+2.73)#56 | 4.1%(+2.53)#4,208 |
| 57. | Hayesville | 6.7% | 3.9%(+2.73)#57 | 4.1%(+2.52)#4,213 |
| 58. | Oakland | 6.7% | 3.9%(+2.72)#58 | 4.1%(+2.52)#4,218 |
| 59. | Prineville | 6.6% | 3.9%(+2.61)#59 | 4.1%(+2.40)#4,372 |
| 60. | Rufus | 6.5% | 3.9%(+2.55)#60 | 4.1%(+2.34)#4,452 |
| 61. | Barnesdale | 6.5% | 3.9%(+2.51)#61 | 4.1%(+2.30)#4,506 |
| 62. | John Day | 6.4% | 3.9%(+2.46)#62 | 4.1%(+2.25)#4,569 |
| 63. | Fossil | 6.4% | 3.9%(+2.45)#63 | 4.1%(+2.25)#4,573 |
| 64. | Wheeler | 6.4% | 3.9%(+2.43)#64 | 4.1%(+2.22)#4,596 |
| 65. | Barview | 6.3% | 3.9%(+2.41)#65 | 4.1%(+2.20)#4,621 |
| 66. | Springfield | 6.3% | 3.9%(+2.35)#66 | 4.1%(+2.15)#4,700 |
| 67. | Aloha | 6.2% | 3.9%(+2.26)#67 | 4.1%(+2.06)#4,820 |
| 68. | Condon | 6.2% | 3.9%(+2.21)#68 | 4.1%(+2.00)#4,900 |
| 69. | River Road | 6.1% | 3.9%(+2.12)#69 | 4.1%(+1.91)#5,036 |
| 70. | Marcola | 6.0% | 3.9%(+2.10)#70 | 4.1%(+1.89)#5,067 |
| 71. | Rainier | 6.0% | 3.9%(+2.04)#71 | 4.1%(+1.84)#5,166 |
| 72. | White City | 6.0% | 3.9%(+2.02)#72 | 4.1%(+1.82)#5,201 |
| 73. | Siletz | 5.9% | 3.9%(+1.99)#73 | 4.1%(+1.79)#5,253 |
| 74. | Junction City | 5.9% | 3.9%(+1.97)#74 | 4.1%(+1.76)#5,288 |
| 75. | Dayton | 5.8% | 3.9%(+1.82)#75 | 4.1%(+1.61)#5,522 |
| 76. | Warren | 5.7% | 3.9%(+1.78)#76 | 4.1%(+1.57)#5,582 |
| 77. | Florence | 5.7% | 3.9%(+1.75)#77 | 4.1%(+1.54)#5,639 |
| 78. | Roseburg North | 5.7% | 3.9%(+1.74)#78 | 4.1%(+1.54)#5,651 |
| 79. | Seaside | 5.7% | 3.9%(+1.73)#79 | 4.1%(+1.53)#5,676 |
| 80. | Cedar Hills | 5.7% | 3.9%(+1.71)#80 | 4.1%(+1.51)#5,701 |
| 81. | Four Corners | 5.6% | 3.9%(+1.67)#81 | 4.1%(+1.46)#5,773 |
| 82. | Tri City | 5.6% | 3.9%(+1.63)#82 | 4.1%(+1.42)#5,847 |
| 83. | Tualatin | 5.6% | 3.9%(+1.61)#83 | 4.1%(+1.40)#5,896 |
| 84. | Oatfield | 5.5% | 3.9%(+1.56)#84 | 4.1%(+1.36)#5,977 |
| 85. | Nehalem | 5.5% | 3.9%(+1.53)#85 | 4.1%(+1.32)#6,064 |
| 86. | Phoenix | 5.5% | 3.9%(+1.51)#86 | 4.1%(+1.30)#6,094 |
| 87. | North Plains | 5.5% | 3.9%(+1.51)#87 | 4.1%(+1.30)#6,097 |
| 88. | Klamath Falls | 5.4% | 3.9%(+1.42)#88 | 4.1%(+1.21)#6,266 |
| 89. | North Powder | 5.3% | 3.9%(+1.38)#89 | 4.1%(+1.18)#6,328 |
| 90. | Adams | 5.3% | 3.9%(+1.38)#90 | 4.1%(+1.18)#6,334 |
| 91. | Gresham | 5.3% | 3.9%(+1.38)#91 | 4.1%(+1.17)#6,342 |
| 92. | Coos Bay | 5.3% | 3.9%(+1.37)#92 | 4.1%(+1.16)#6,362 |
| 93. | Mcminnville | 5.3% | 3.9%(+1.34)#93 | 4.1%(+1.13)#6,425 |
| 94. | Wasco | 5.2% | 3.9%(+1.26)#94 | 4.1%(+1.06)#6,599 |
| 95. | Aurora | 5.1% | 3.9%(+1.20)#95 | 4.1%(+0.996)#6,725 |
| 96. | Yachats | 5.0% | 3.9%(+1.09)#96 | 4.1%(+0.886)#6,965 |
| 97. | Grand Ronde | 5.0% | 3.9%(+1.09)#97 | 4.1%(+0.884)#6,967 |
| 98. | Falls City | 5.0% | 3.9%(+1.05)#98 | 4.1%(+0.841)#7,083 |
| 99. | Amity | 4.9% | 3.9%(+1.00)#99 | 4.1%(+0.794)#7,177 |
| 100. | Merlin | 4.9% | 3.9%(+0.956)#100 | 4.1%(+0.750)#7,284 |
Common Questions
What are the Top 10 Cities with the Highest Percentage of Population Employed in Administrative & Support Services in Oregon?
Top 10 Cities with the Highest Percentage of Population Employed in Administrative & Support Services in Oregon are:
#1
31.8%
#2
30.8%
#3
29.9%
#4
28.7%
#5
25.1%
#6
23.7%
#7
23.6%
#8
21.9%
#9
19.7%
#10
17.2%
What city has the Highest Percentage of Population Employed in Administrative & Support Services in Oregon?
Arlington has the Highest Percentage of Population Employed in Administrative & Support Services in Oregon with 31.8%.
What is the Percentage of Population Employed in Administrative & Support Services in the State of Oregon?
Percentage of Population Employed in Administrative & Support Services in Oregon is 3.9%.
What is the Percentage of Population Employed in Administrative & Support Services in the United States?
Percentage of Population Employed in Administrative & Support Services in the United States is 4.1%.