Trainer borough, PA Map & Demographics
Trainer borough Overview
$28,848
PER CAPITA INCOME
$83,906
AVG HOUSEHOLD INCOME
21.5%
WAGE / INCOME GAP [ % ]
78.5¢/ $1
WAGE / INCOME GAP [ $ ]
0.38
INEQUALITY / GINI INDEX
1,637
TOTAL POPULATION
803
MALE POPULATION
834
FEMALE POPULATION
96.28
MALES / 100 FEMALES
103.86
FEMALES / 100 MALES
38.4
MEDIAN AGE
2.5
AVG FAMILY SIZE
2.3
AVG HOUSEHOLD SIZE
860
LABOR FORCE [ PEOPLE ]
67.1%
PERCENT IN LABOR FORCE
4.4%
UNEMPLOYMENT RATE
Income in Trainer borough
Income Overview in Trainer borough
| Characteristic | Number | Measure |
| Per Capita Income | 1,637 | $28,848 |
| Median Family Income | 548 | $0 |
| Mean Family Income | 548 | $118,624 |
| Median Household Income | 724 | $83,906 |
| Mean Household Income | 724 | $103,058 |
| Income Deficit | 548 | $0 |
| Wage / Income Gap (%) | 1,637 | 21.54% |
| Wage / Income Gap ($) | 1,637 | 78.46¢ per $1 |
| Gini / Inequality Index | 1,637 | 0.38 |
Earnings by Sex in Trainer borough
Average Earnings in Trainer borough are $45,190, $46,004 for men and $36,094 for women, a difference of 21.5%.
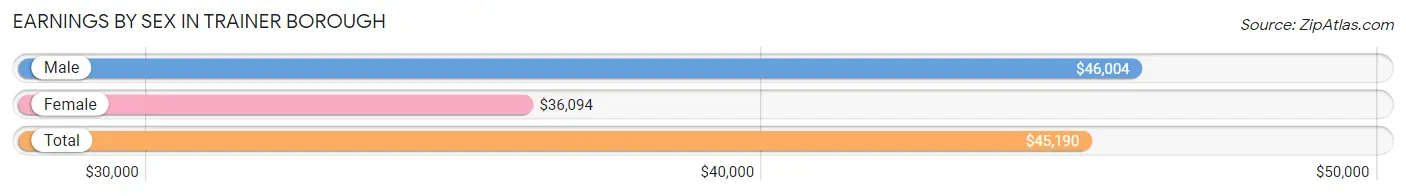
| Sex | Number | Average Earnings |
| Male | 526 (62.1%) | $46,004 |
| Female | 321 (37.9%) | $36,094 |
| Total | 847 (100.0%) | $45,190 |
Earnings by Sex by Income Bracket in Trainer borough
The most common earnings brackets in Trainer borough are $45,000 to $49,999 for men (232 | 44.1%) and $40,000 to $44,999 for women (54 | 16.8%).

| Income | Male | Female |
| $2,499 or less | 14 (2.7%) | 23 (7.2%) |
| $2,500 to $4,999 | 5 (0.9%) | 4 (1.3%) |
| $5,000 to $7,499 | 11 (2.1%) | 2 (0.6%) |
| $7,500 to $9,999 | 1 (0.2%) | 13 (4.1%) |
| $10,000 to $12,499 | 18 (3.4%) | 6 (1.9%) |
| $12,500 to $14,999 | 8 (1.5%) | 10 (3.1%) |
| $15,000 to $17,499 | 20 (3.8%) | 6 (1.9%) |
| $17,500 to $19,999 | 13 (2.5%) | 6 (1.9%) |
| $20,000 to $22,499 | 0 (0.0%) | 13 (4.1%) |
| $22,500 to $24,999 | 5 (0.9%) | 19 (5.9%) |
| $25,000 to $29,999 | 22 (4.2%) | 21 (6.5%) |
| $30,000 to $34,999 | 8 (1.5%) | 27 (8.4%) |
| $35,000 to $39,999 | 37 (7.0%) | 30 (9.3%) |
| $40,000 to $44,999 | 9 (1.7%) | 54 (16.8%) |
| $45,000 to $49,999 | 232 (44.1%) | 14 (4.4%) |
| $50,000 to $54,999 | 35 (6.7%) | 19 (5.9%) |
| $55,000 to $64,999 | 24 (4.6%) | 7 (2.2%) |
| $65,000 to $74,999 | 9 (1.7%) | 14 (4.4%) |
| $75,000 to $99,999 | 48 (9.1%) | 33 (10.3%) |
| $100,000+ | 7 (1.3%) | 0 (0.0%) |
| Total | 526 (100.0%) | 321 (100.0%) |
Earnings by Sex by Educational Attainment in Trainer borough
Average earnings in Trainer borough are $46,097 for men and $40,345 for women, a difference of 12.5%. Men with an educational attainment of bachelor's degree enjoy the highest average annual earnings of $86,172, while those with less than high school education earn the least with $35,486. Women with an educational attainment of graduate degree earn the most with the average annual earnings of $66,719, while those with less than high school education have the smallest earnings of $20,000.
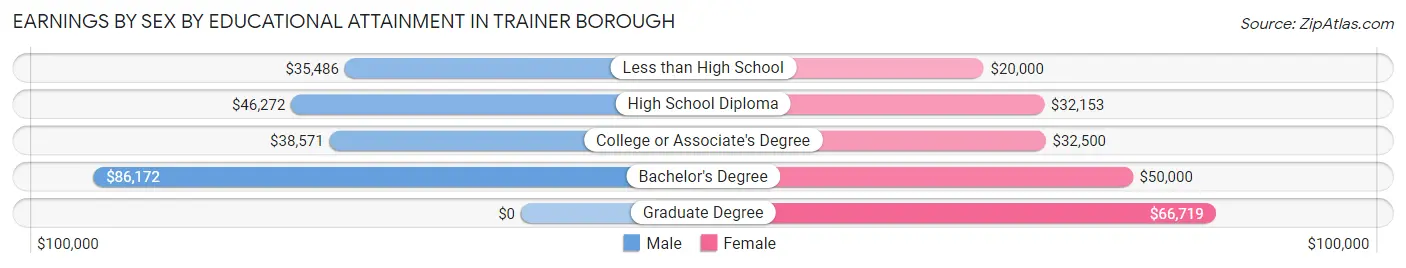
| Educational Attainment | Male Income | Female Income |
| Less than High School | $35,486 | $20,000 |
| High School Diploma | $46,272 | $32,153 |
| College or Associate's Degree | $38,571 | $32,500 |
| Bachelor's Degree | $86,172 | $50,000 |
| Graduate Degree | - | - |
| Total | $46,097 | $40,345 |
Family Income in Trainer borough
Family Income Brackets in Trainer borough
According to the Trainer borough family income data, there are 229 families falling into the $150,000 to $199,999 income range, which is the most common income bracket and makes up 41.8% of all families.
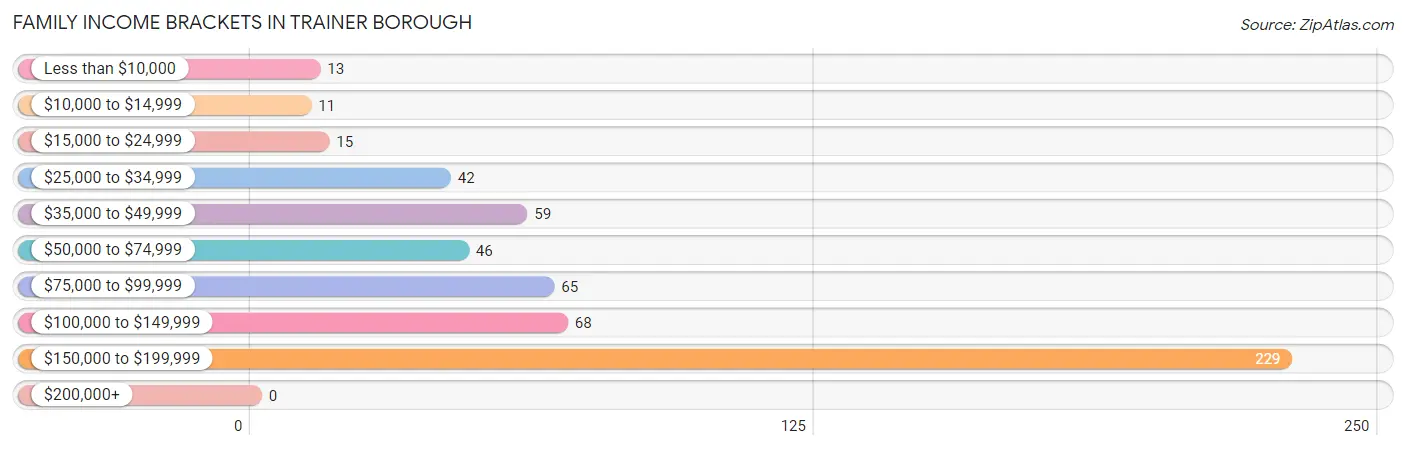
| Income Bracket | # Families | % Families |
| Less than $10,000 | 13 | 2.4% |
| $10,000 to $14,999 | 11 | 2.0% |
| $15,000 to $24,999 | 15 | 2.7% |
| $25,000 to $34,999 | 42 | 7.7% |
| $35,000 to $49,999 | 59 | 10.8% |
| $50,000 to $74,999 | 46 | 8.4% |
| $75,000 to $99,999 | 65 | 11.9% |
| $100,000 to $149,999 | 68 | 12.4% |
| $150,000 to $199,999 | 229 | 41.8% |
| $200,000+ | 0 | 0.0% |
Family Income by Famaliy Size in Trainer borough
6-person families (275 | 50.2%) account for the highest median family income in Trainer borough with $193,459 per family, while 2-person families (133 | 24.3%) have the highest median income of $43,848 per family member.
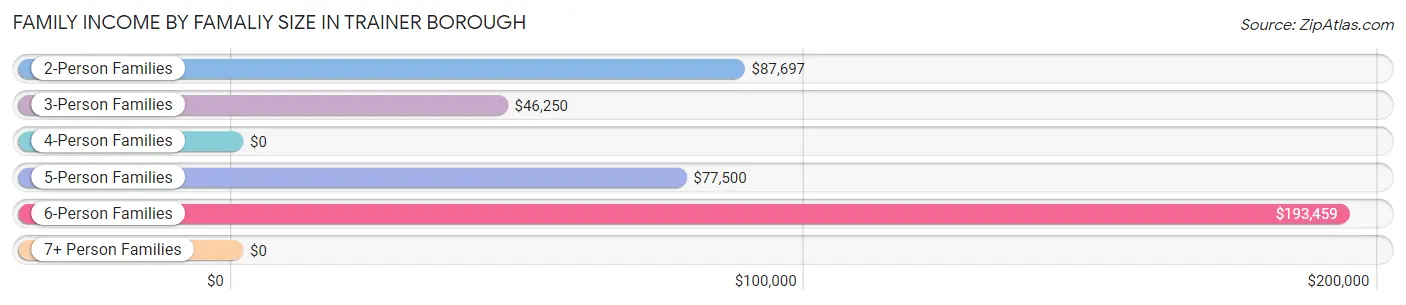
| Income Bracket | # Families | Median Income |
| 2-Person Families | 133 (24.3%) | $87,697 |
| 3-Person Families | 75 (13.7%) | $46,250 |
| 4-Person Families | 42 (7.7%) | $0 |
| 5-Person Families | 22 (4.0%) | $77,500 |
| 6-Person Families | 275 (50.2%) | $193,459 |
| 7+ Person Families | 1 (0.2%) | $0 |
| Total | 548 (100.0%) | $0 |
Family Income by Number of Earners in Trainer borough
| Number of Earners | # Families | Median Income |
| No Earners | 88 (16.1%) | $30,833 |
| 1 Earner | 103 (18.8%) | $43,750 |
| 2 Earners | 90 (16.4%) | $88,125 |
| 3+ Earners | 267 (48.7%) | $193,503 |
| Total | 548 (100.0%) | $0 |
Household Income in Trainer borough
Household Income Brackets in Trainer borough
With 239 households falling in the category, the $150,000 to $199,999 income range is the most frequent in Trainer borough, accounting for 33.0% of all households. In contrast, only 3 households (0.4%) fall into the $200,000+ income bracket, making it the least populous group.
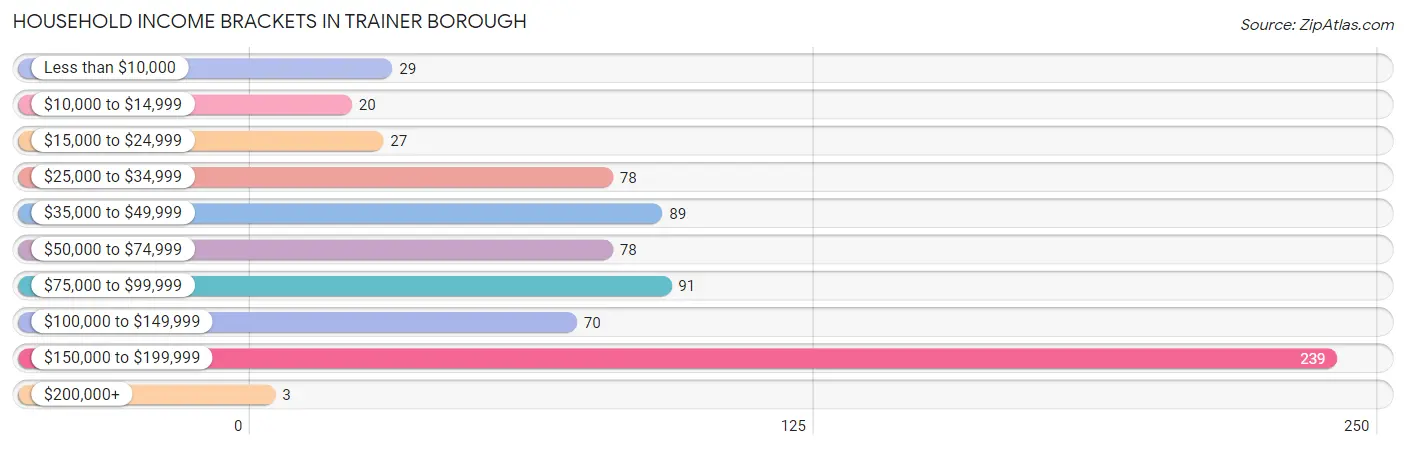
| Income Bracket | # Households | % Households |
| Less than $10,000 | 29 | 4.0% |
| $10,000 to $14,999 | 20 | 2.8% |
| $15,000 to $24,999 | 27 | 3.7% |
| $25,000 to $34,999 | 78 | 10.8% |
| $35,000 to $49,999 | 89 | 12.3% |
| $50,000 to $74,999 | 78 | 10.8% |
| $75,000 to $99,999 | 91 | 12.6% |
| $100,000 to $149,999 | 70 | 9.7% |
| $150,000 to $199,999 | 239 | 33.0% |
| $200,000+ | 3 | 0.4% |
Household Income by Householder Age in Trainer borough
The median household income in Trainer borough is $83,906, with the highest median household income of $193,044 found in the 65+ years age bracket for the primary householder. A total of 349 households (48.2%) fall into this category. Meanwhile, the 15 to 24 years age bracket for the primary householder has the lowest median household income of $30,938, with 15 households (2.1%) in this group.
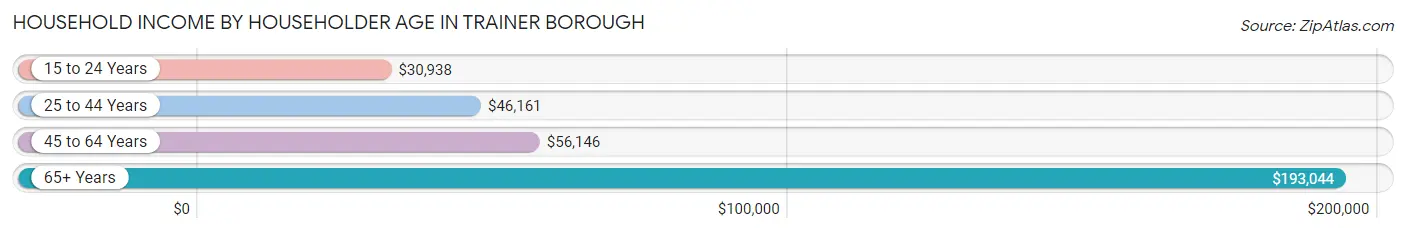
| Income Bracket | # Households | Median Income |
| 15 to 24 Years | 15 (2.1%) | $30,938 |
| 25 to 44 Years | 189 (26.1%) | $46,161 |
| 45 to 64 Years | 171 (23.6%) | $56,146 |
| 65+ Years | 349 (48.2%) | $193,044 |
| Total | 724 (100.0%) | $83,906 |
Poverty in Trainer borough
Income Below Poverty by Sex and Age in Trainer borough
With 12.2% poverty level for males and 27.4% for females among the residents of Trainer borough, 15 year old males and 5 year old females are the most vulnerable to poverty, with 5 males (100.0%) and 17 females (85.0%) in their respective age groups living below the poverty level.
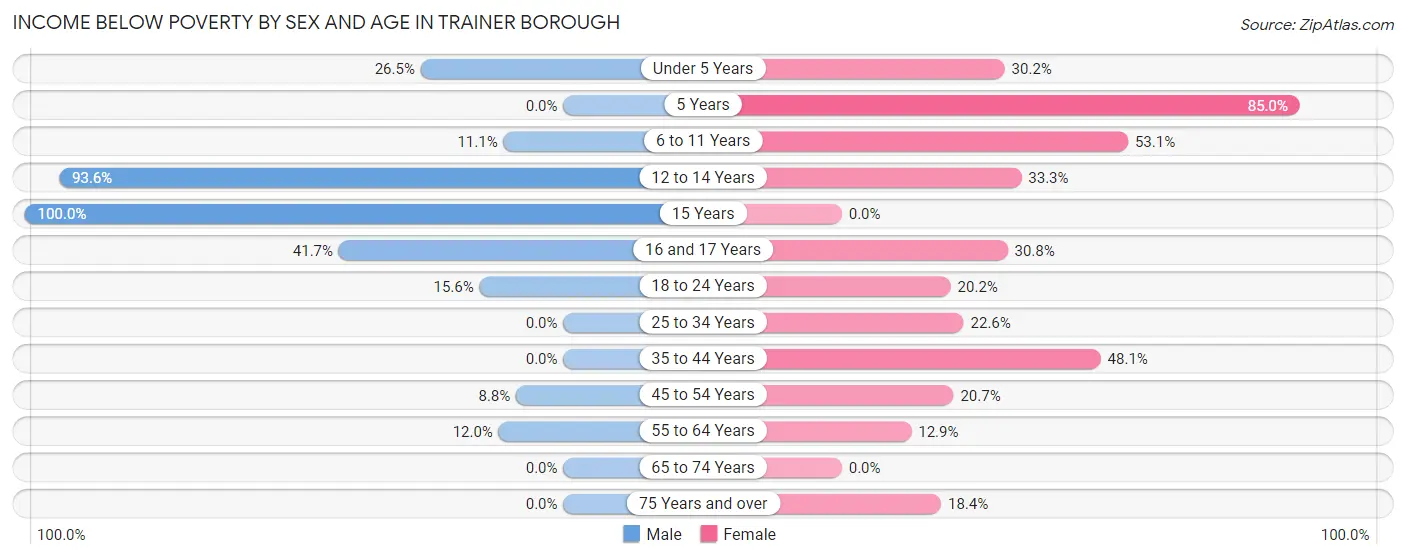
| Age Bracket | Male | Female |
| Under 5 Years | 9 (26.5%) | 13 (30.2%) |
| 5 Years | 0 (0.0%) | 17 (85.0%) |
| 6 to 11 Years | 4 (11.1%) | 51 (53.1%) |
| 12 to 14 Years | 44 (93.6%) | 14 (33.3%) |
| 15 Years | 5 (100.0%) | 0 (0.0%) |
| 16 and 17 Years | 15 (41.7%) | 8 (30.8%) |
| 18 to 24 Years | 7 (15.6%) | 19 (20.2%) |
| 25 to 34 Years | 0 (0.0%) | 26 (22.6%) |
| 35 to 44 Years | 0 (0.0%) | 37 (48.0%) |
| 45 to 54 Years | 5 (8.8%) | 17 (20.7%) |
| 55 to 64 Years | 9 (12.0%) | 12 (12.9%) |
| 65 to 74 Years | 0 (0.0%) | 0 (0.0%) |
| 75 Years and over | 0 (0.0%) | 14 (18.4%) |
| Total | 98 (12.2%) | 228 (27.4%) |
Income Above Poverty by Sex and Age in Trainer borough
According to the poverty statistics in Trainer borough, males aged 5 years and females aged 15 years are the age groups that are most secure financially, with 100.0% of males and 100.0% of females in these age groups living above the poverty line.
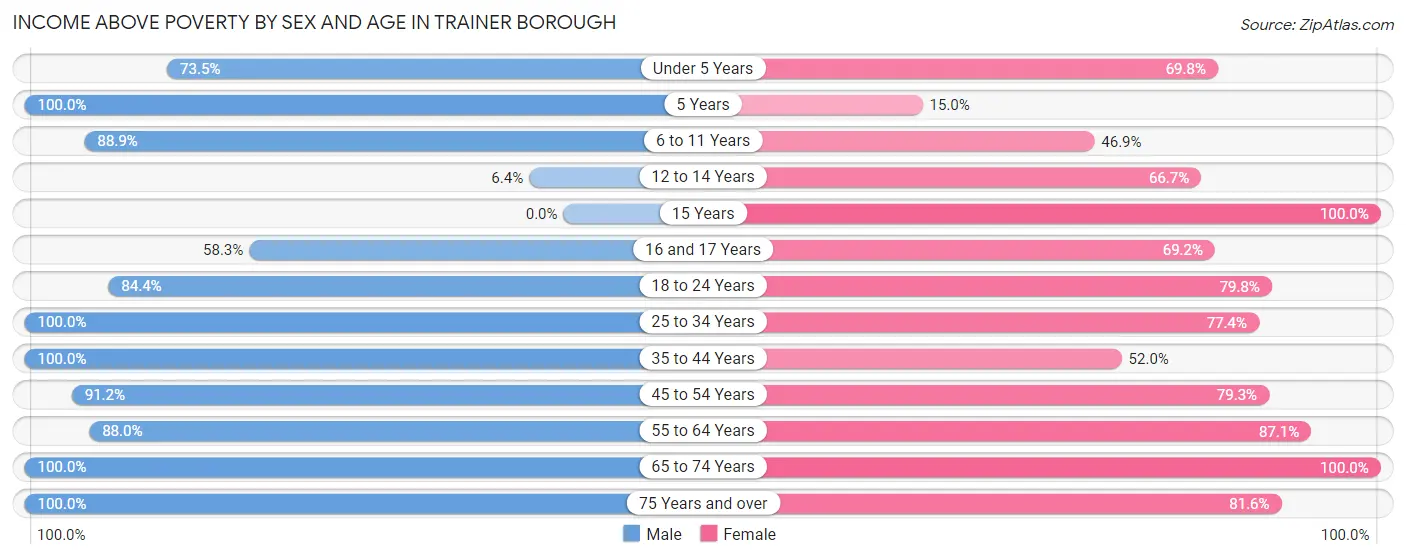
| Age Bracket | Male | Female |
| Under 5 Years | 25 (73.5%) | 30 (69.8%) |
| 5 Years | 1 (100.0%) | 3 (15.0%) |
| 6 to 11 Years | 32 (88.9%) | 45 (46.9%) |
| 12 to 14 Years | 3 (6.4%) | 28 (66.7%) |
| 15 Years | 0 (0.0%) | 29 (100.0%) |
| 16 and 17 Years | 21 (58.3%) | 18 (69.2%) |
| 18 to 24 Years | 38 (84.4%) | 75 (79.8%) |
| 25 to 34 Years | 83 (100.0%) | 89 (77.4%) |
| 35 to 44 Years | 91 (100.0%) | 40 (51.9%) |
| 45 to 54 Years | 52 (91.2%) | 65 (79.3%) |
| 55 to 64 Years | 66 (88.0%) | 81 (87.1%) |
| 65 to 74 Years | 265 (100.0%) | 39 (100.0%) |
| 75 Years and over | 28 (100.0%) | 62 (81.6%) |
| Total | 705 (87.8%) | 604 (72.6%) |
Income Below Poverty Among Married-Couple Families in Trainer borough
The poverty statistics for married-couple families in Trainer borough show that 1.8% or 6 of the total 341 families live below the poverty line. Families with 1 or 2 children have the highest poverty rate of 12.5%, comprising of 6 families. On the other hand, families with no children have the lowest poverty rate of 0.0%, which includes 0 families.
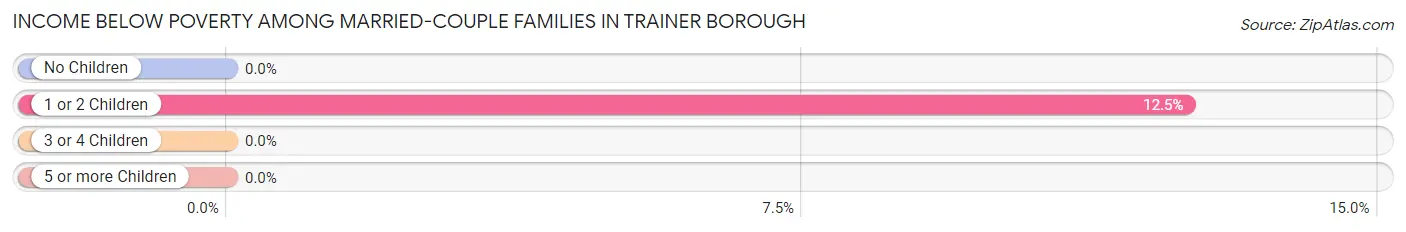
| Children | Above Poverty | Below Poverty |
| No Children | 292 (100.0%) | 0 (0.0%) |
| 1 or 2 Children | 42 (87.5%) | 6 (12.5%) |
| 3 or 4 Children | 0 (0.0%) | 0 (0.0%) |
| 5 or more Children | 1 (100.0%) | 0 (0.0%) |
| Total | 335 (98.2%) | 6 (1.8%) |
Income Below Poverty Among Single-Parent Households in Trainer borough
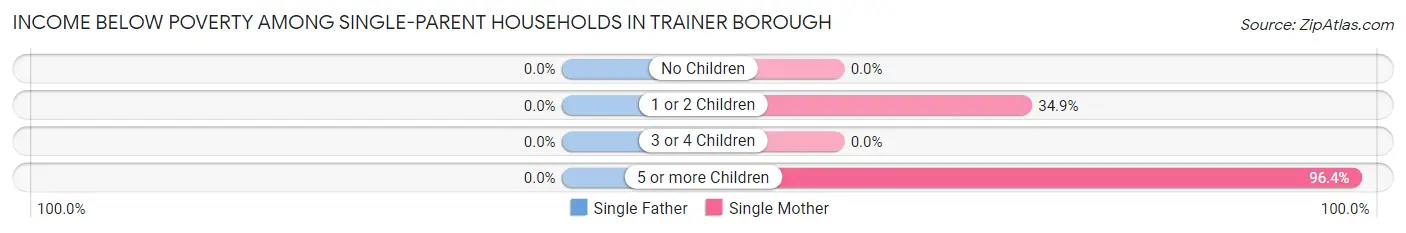
| Children | Single Father | Single Mother |
| No Children | 0 (0.0%) | 0 (0.0%) |
| 1 or 2 Children | 0 (0.0%) | 29 (34.9%) |
| 3 or 4 Children | 0 (0.0%) | 0 (0.0%) |
| 5 or more Children | 0 (0.0%) | 27 (96.4%) |
| Total | 0 (0.0%) | 56 (32.4%) |
Income Below Poverty Among Married-Couple vs Single-Parent Households in Trainer borough
The poverty data for Trainer borough shows that 6 of the married-couple family households (1.8%) and 56 of the single-parent households (27.1%) are living below the poverty level. Within the married-couple family households, those with 1 or 2 children have the highest poverty rate, with 6 households (12.5%) falling below the poverty line. Among the single-parent households, those with 5 or more children have the highest poverty rate, with 27 household (96.4%) living below poverty.
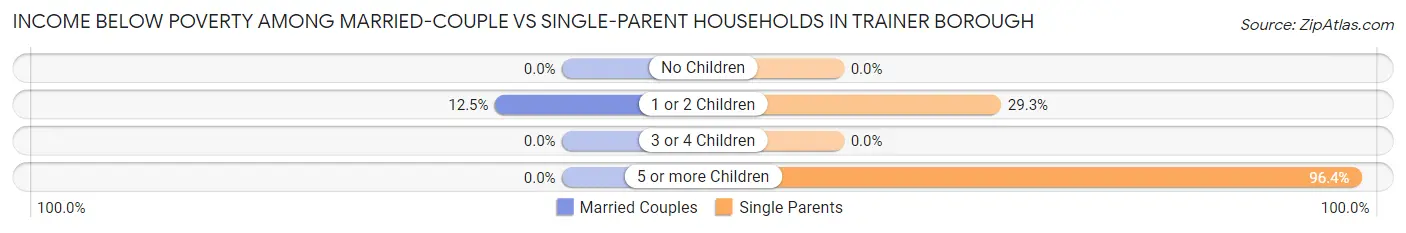
| Children | Married-Couple Families | Single-Parent Households |
| No Children | 0 (0.0%) | 0 (0.0%) |
| 1 or 2 Children | 6 (12.5%) | 29 (29.3%) |
| 3 or 4 Children | 0 (0.0%) | 0 (0.0%) |
| 5 or more Children | 0 (0.0%) | 27 (96.4%) |
| Total | 6 (1.8%) | 56 (27.1%) |
Race in Trainer borough
The most populous races in Trainer borough are White / Caucasian (770 | 47.0%), Black / African American (496 | 30.3%), and Some other Race (248 | 15.1%).
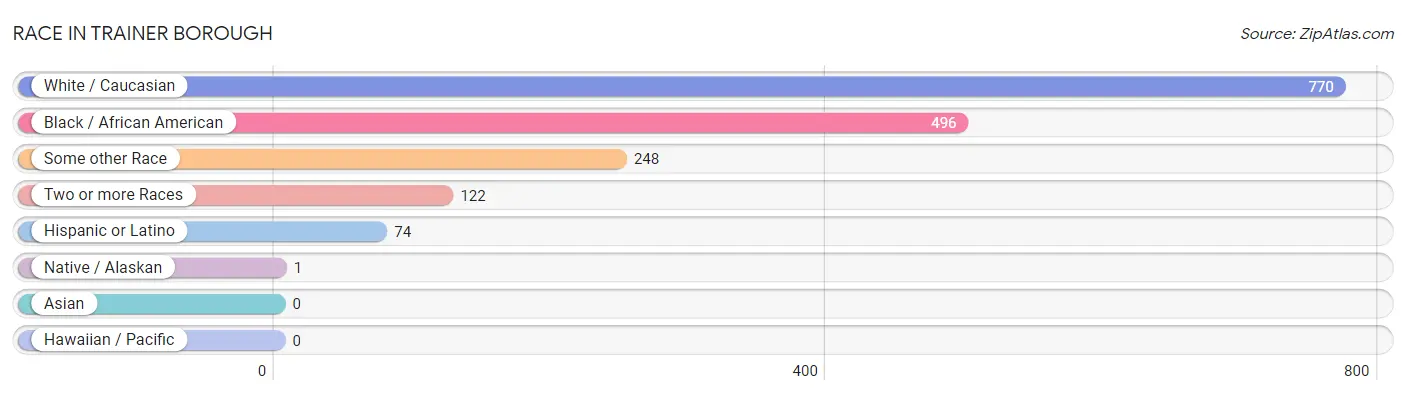
| Race | # Population | % Population |
| Asian | 0 | 0.0% |
| Black / African American | 496 | 30.3% |
| Hawaiian / Pacific | 0 | 0.0% |
| Hispanic or Latino | 74 | 4.5% |
| Native / Alaskan | 1 | 0.1% |
| White / Caucasian | 770 | 47.0% |
| Two or more Races | 122 | 7.4% |
| Some other Race | 248 | 15.1% |
| Total | 1,637 | 100.0% |
Ancestry in Trainer borough
The most populous ancestries reported in Trainer borough are Polish (316 | 19.3%), Irish (273 | 16.7%), Ukrainian (230 | 14.1%), Italian (140 | 8.6%), and German (121 | 7.4%), together accounting for 66.0% of all Trainer borough residents.
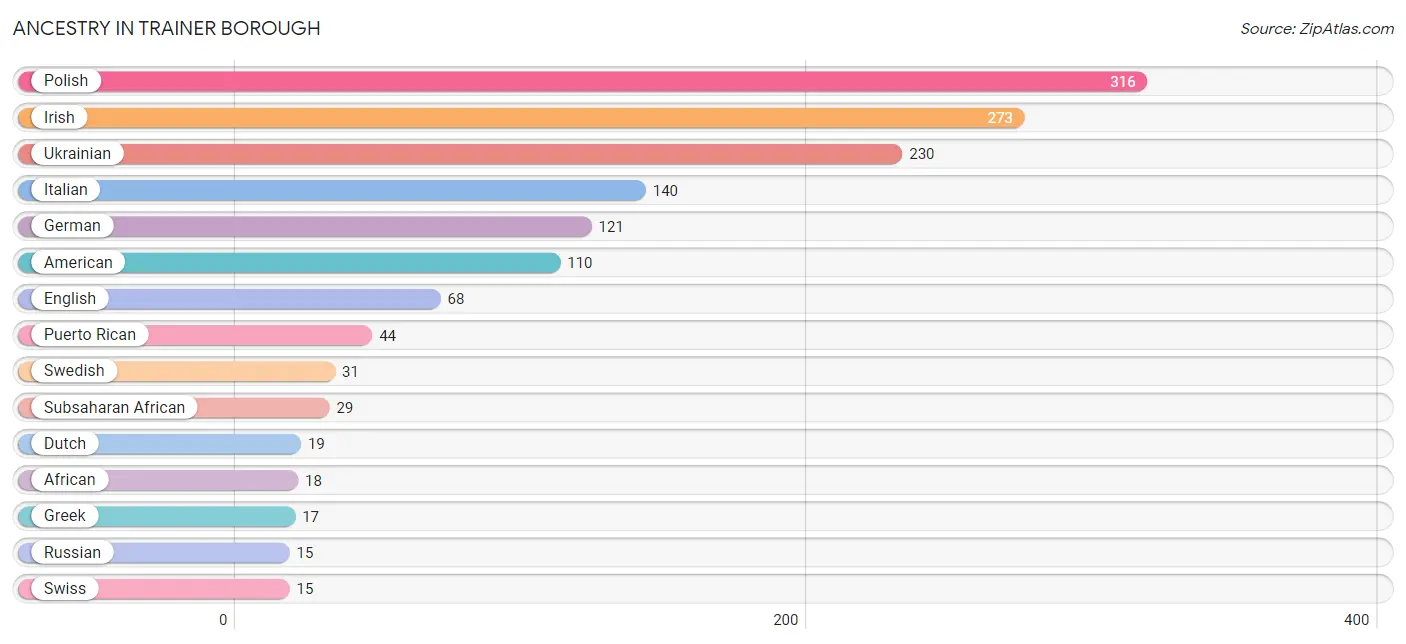
| Ancestry | # Population | % Population |
| African | 18 | 1.1% |
| American | 110 | 6.7% |
| Arab | 2 | 0.1% |
| Austrian | 3 | 0.2% |
| Canadian | 2 | 0.1% |
| Delaware | 1 | 0.1% |
| Dominican | 1 | 0.1% |
| Dutch | 19 | 1.2% |
| English | 68 | 4.2% |
| European | 7 | 0.4% |
| French | 10 | 0.6% |
| German | 121 | 7.4% |
| Greek | 17 | 1.0% |
| Irish | 273 | 16.7% |
| Italian | 140 | 8.6% |
| Lebanese | 1 | 0.1% |
| Liberian | 11 | 0.7% |
| Pennsylvania German | 5 | 0.3% |
| Polish | 316 | 19.3% |
| Puerto Rican | 44 | 2.7% |
| Russian | 15 | 0.9% |
| Scottish | 12 | 0.7% |
| Slovene | 6 | 0.4% |
| Spaniard | 1 | 0.1% |
| Spanish | 6 | 0.4% |
| Subsaharan African | 29 | 1.8% |
| Swedish | 31 | 1.9% |
| Swiss | 15 | 0.9% |
| Ukrainian | 230 | 14.1% |
| Welsh | 11 | 0.7% |
| Yugoslavian | 1 | 0.1% | View All 31 Rows |
Immigrants in Trainer borough
The most numerous immigrant groups reported in Trainer borough came from Africa (40 | 2.4%), Liberia (40 | 2.4%), Western Africa (40 | 2.4%), Eastern Europe (11 | 0.7%), and Europe (11 | 0.7%), together accounting for 8.7% of all Trainer borough residents.
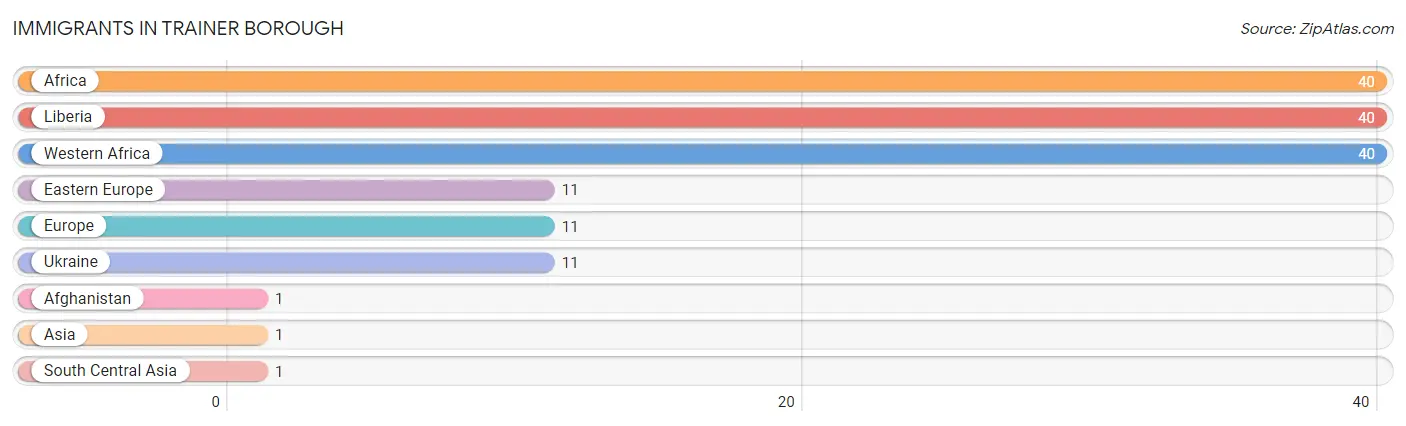
| Immigration Origin | # Population | % Population |
| Afghanistan | 1 | 0.1% |
| Africa | 40 | 2.4% |
| Asia | 1 | 0.1% |
| Eastern Europe | 11 | 0.7% |
| Europe | 11 | 0.7% |
| Liberia | 40 | 2.4% |
| South Central Asia | 1 | 0.1% |
| Ukraine | 11 | 0.7% |
| Western Africa | 40 | 2.4% | View All 9 Rows |
Sex and Age in Trainer borough
Sex and Age in Trainer borough
The most populous age groups in Trainer borough are 65 to 69 Years (255 | 31.8%) for men and 10 to 14 Years (84 | 10.1%) for women.
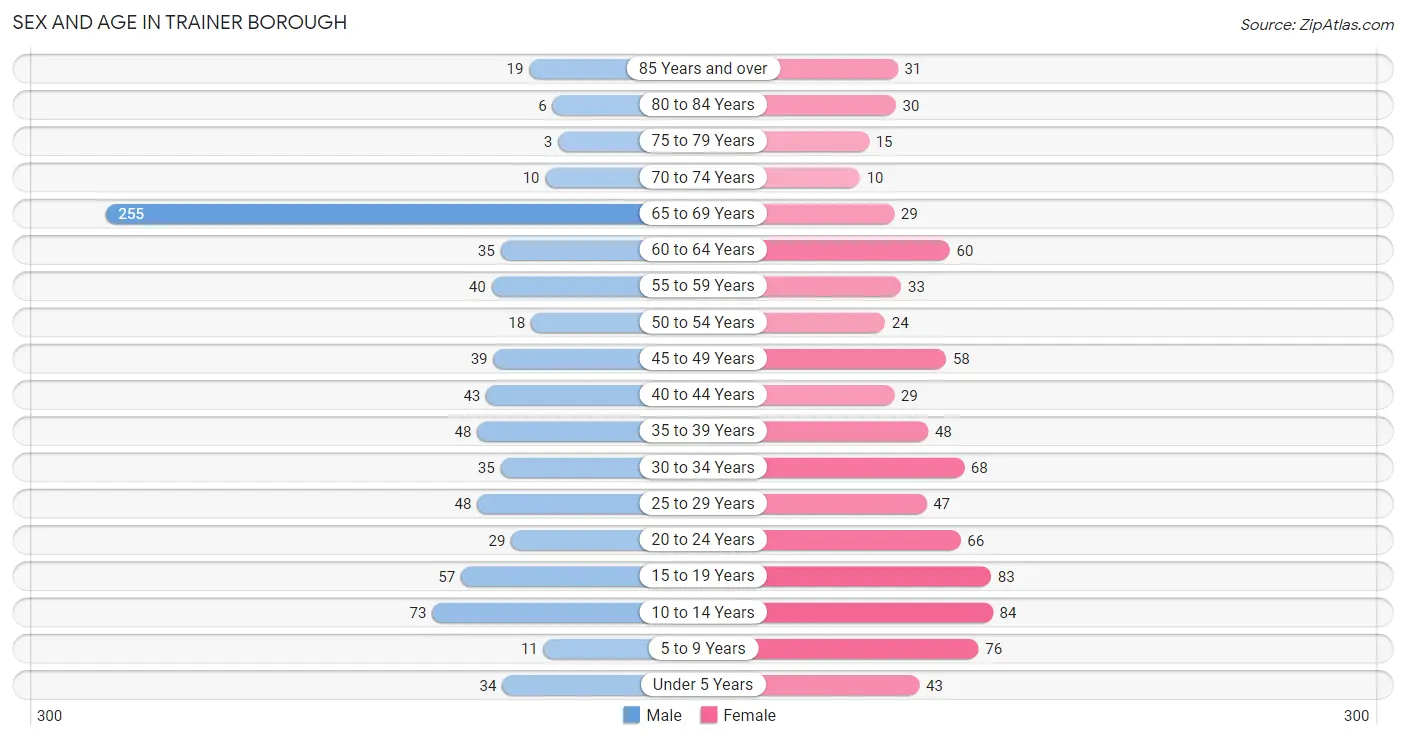
| Age Bracket | Male | Female |
| Under 5 Years | 34 (4.2%) | 43 (5.2%) |
| 5 to 9 Years | 11 (1.4%) | 76 (9.1%) |
| 10 to 14 Years | 73 (9.1%) | 84 (10.1%) |
| 15 to 19 Years | 57 (7.1%) | 83 (10.0%) |
| 20 to 24 Years | 29 (3.6%) | 66 (7.9%) |
| 25 to 29 Years | 48 (6.0%) | 47 (5.6%) |
| 30 to 34 Years | 35 (4.4%) | 68 (8.2%) |
| 35 to 39 Years | 48 (6.0%) | 48 (5.8%) |
| 40 to 44 Years | 43 (5.3%) | 29 (3.5%) |
| 45 to 49 Years | 39 (4.9%) | 58 (7.0%) |
| 50 to 54 Years | 18 (2.2%) | 24 (2.9%) |
| 55 to 59 Years | 40 (5.0%) | 33 (4.0%) |
| 60 to 64 Years | 35 (4.4%) | 60 (7.2%) |
| 65 to 69 Years | 255 (31.8%) | 29 (3.5%) |
| 70 to 74 Years | 10 (1.3%) | 10 (1.2%) |
| 75 to 79 Years | 3 (0.4%) | 15 (1.8%) |
| 80 to 84 Years | 6 (0.7%) | 30 (3.6%) |
| 85 Years and over | 19 (2.4%) | 31 (3.7%) |
| Total | 803 (100.0%) | 834 (100.0%) |
Families and Households in Trainer borough
Median Family Size in Trainer borough
The median family size in Trainer borough is 2.47 persons per family, with single female/mother families (173 | 31.6%) accounting for the largest median family size of 3.8 persons per family. On the other hand, married-couple families (341 | 62.2%) represent the smallest median family size with 1.78 persons per family.
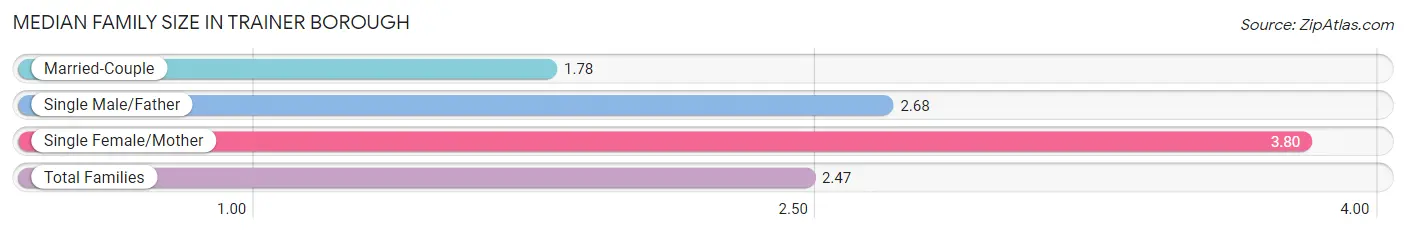
| Family Type | # Families | Family Size |
| Married-Couple | 341 (62.2%) | 1.78 |
| Single Male/Father | 34 (6.2%) | 2.68 |
| Single Female/Mother | 173 (31.6%) | 3.80 |
| Total Families | 548 (100.0%) | 2.47 |
Median Household Size in Trainer borough
The median household size in Trainer borough is 2.26 persons per household, with single female/mother households (173 | 23.9%) accounting for the largest median household size of 3.88 persons per household. non-family households (176 | 24.3%) represent the smallest median household size with 1.32 persons per household.
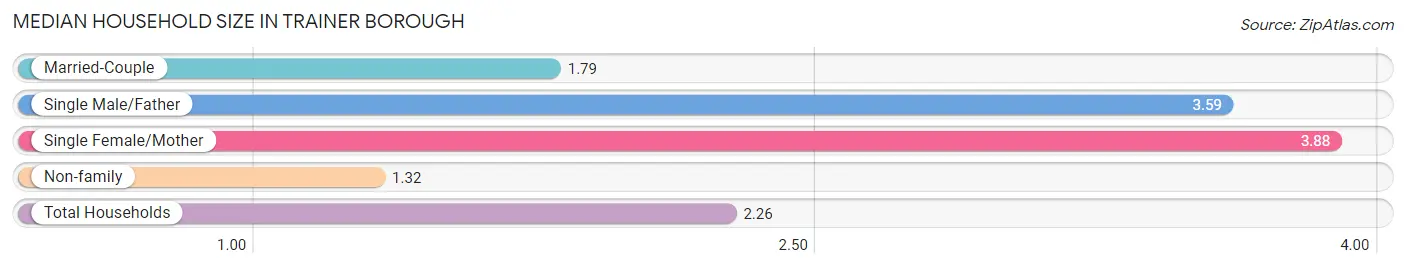
| Household Type | # Households | Household Size |
| Married-Couple | 341 (47.1%) | 1.79 |
| Single Male/Father | 34 (4.7%) | 3.59 |
| Single Female/Mother | 173 (23.9%) | 3.88 |
| Non-family | 176 (24.3%) | 1.32 |
| Total Households | 724 (100.0%) | 2.26 |
Household Size by Marriage Status in Trainer borough
Out of a total of 724 households in Trainer borough, 548 (75.7%) are family households, while 176 (24.3%) are nonfamily households. The most numerous type of family households are 6-person households, comprising 283, and the most common type of nonfamily households are 1-person households, comprising 148.
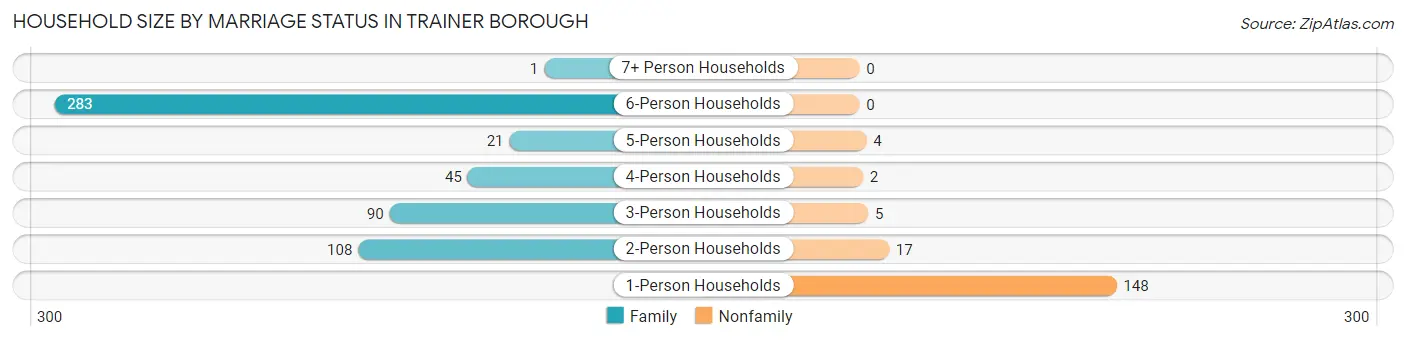
| Household Size | Family Households | Nonfamily Households |
| 1-Person Households | - | 148 (20.4%) |
| 2-Person Households | 108 (14.9%) | 17 (2.4%) |
| 3-Person Households | 90 (12.4%) | 5 (0.7%) |
| 4-Person Households | 45 (6.2%) | 2 (0.3%) |
| 5-Person Households | 21 (2.9%) | 4 (0.5%) |
| 6-Person Households | 283 (39.1%) | 0 (0.0%) |
| 7+ Person Households | 1 (0.1%) | 0 (0.0%) |
| Total | 548 (75.7%) | 176 (24.3%) |
Female Fertility in Trainer borough
Fertility by Age in Trainer borough
Average fertility rate in Trainer borough is 5.0 births per 1,000 women. Women in the age bracket of 20 to 34 years have the highest fertility rate with 11.0 births per 1,000 women. Women in the age bracket of 20 to 34 years acount for 100.0% of all women with births.
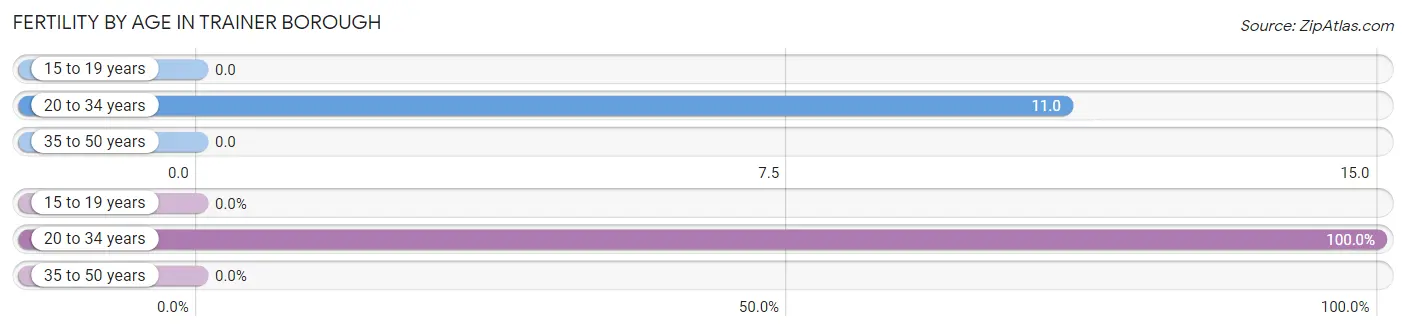
| Age Bracket | Women with Births | Births / 1,000 Women |
| 15 to 19 years | 0 (0.0%) | 0.0 |
| 20 to 34 years | 2 (100.0%) | 11.0 |
| 35 to 50 years | 0 (0.0%) | 0.0 |
| Total | 2 (100.0%) | 5.0 |
Fertility by Age by Marriage Status in Trainer borough
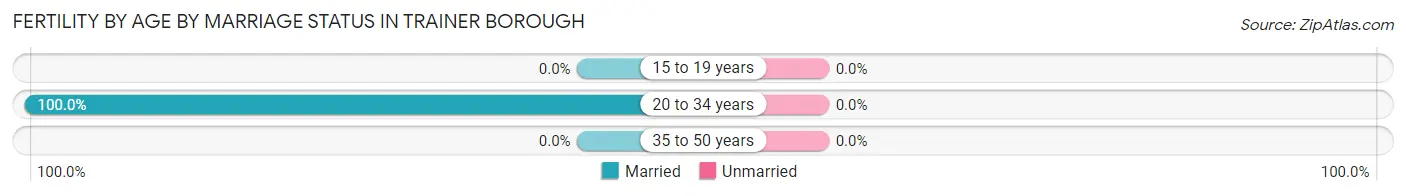
| Age Bracket | Married | Unmarried |
| 15 to 19 years | 0 (0.0%) | 0 (0.0%) |
| 20 to 34 years | 2 (100.0%) | 0 (0.0%) |
| 35 to 50 years | 0 (0.0%) | 0 (0.0%) |
| Total | 2 (100.0%) | 0 (0.0%) |
Fertility by Education in Trainer borough
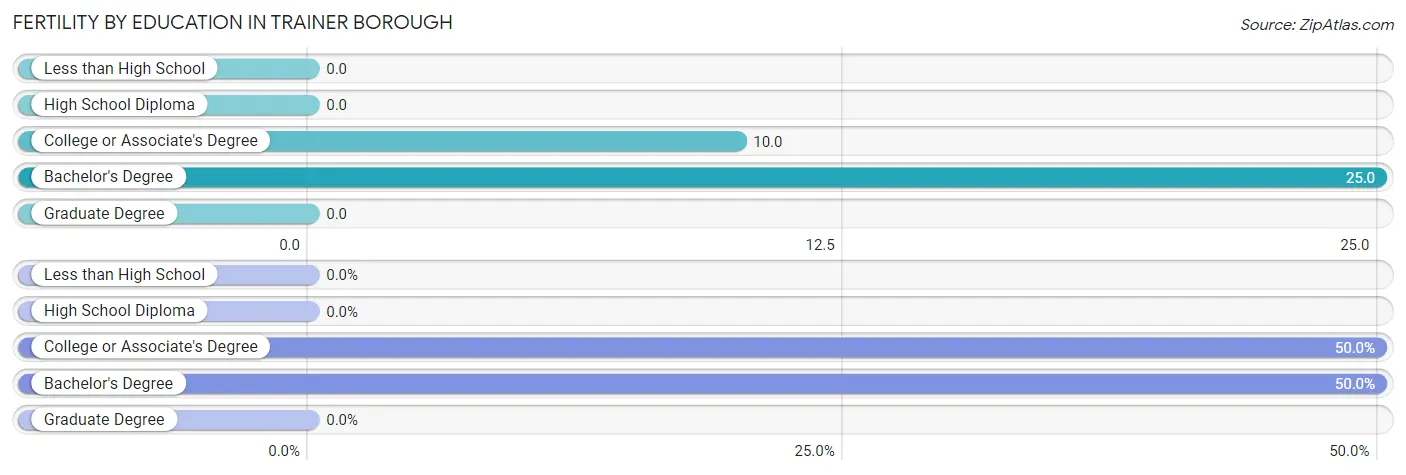
| Educational Attainment | Women with Births | Births / 1,000 Women |
| Less than High School | 0 (0.0%) | 0.0 |
| High School Diploma | 0 (0.0%) | 0.0 |
| College or Associate's Degree | 1 (50.0%) | 10.0 |
| Bachelor's Degree | 1 (50.0%) | 25.0 |
| Graduate Degree | 0 (0.0%) | 0.0 |
| Total | 2 (100.0%) | 5.0 |
Fertility by Education by Marriage Status in Trainer borough
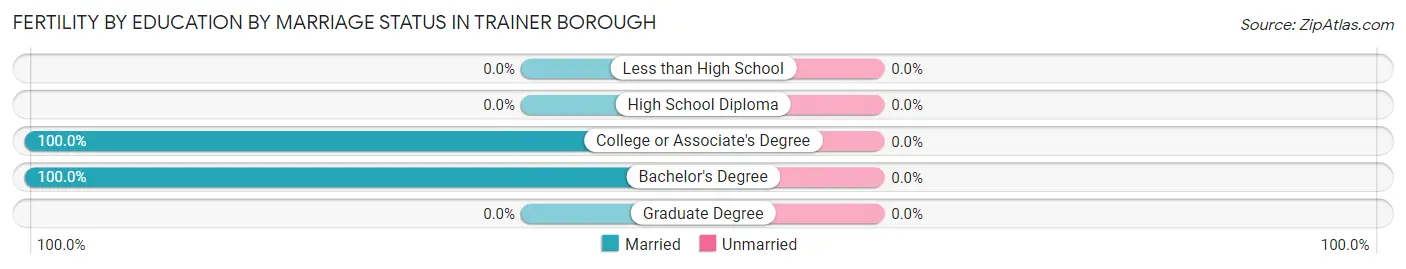
| Educational Attainment | Married | Unmarried |
| Less than High School | 0 (0.0%) | 0 (0.0%) |
| High School Diploma | 0 (0.0%) | 0 (0.0%) |
| College or Associate's Degree | 1 (100.0%) | 0 (0.0%) |
| Bachelor's Degree | 1 (100.0%) | 0 (0.0%) |
| Graduate Degree | 0 (0.0%) | 0 (0.0%) |
| Total | 2 (100.0%) | 0 (0.0%) |
Employment Characteristics in Trainer borough
Employment by Class of Employer in Trainer borough
Among the 805 employed individuals in Trainer borough, private company employees (646 | 80.2%), state government employees (57 | 7.1%), and local government employees (46 | 5.7%) make up the most common classes of employment.
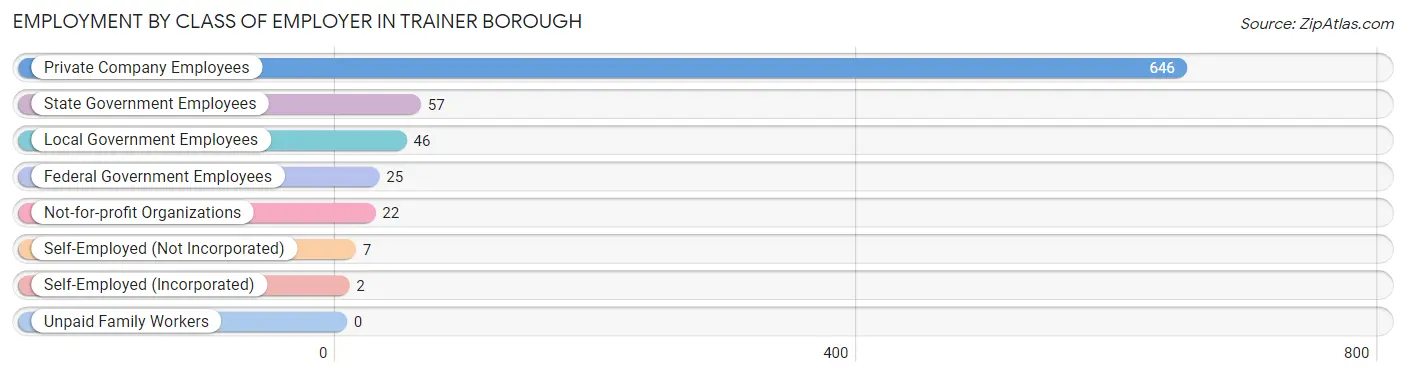
| Employer Class | # Employees | % Employees |
| Private Company Employees | 646 | 80.2% |
| Self-Employed (Incorporated) | 2 | 0.3% |
| Self-Employed (Not Incorporated) | 7 | 0.9% |
| Not-for-profit Organizations | 22 | 2.7% |
| Local Government Employees | 46 | 5.7% |
| State Government Employees | 57 | 7.1% |
| Federal Government Employees | 25 | 3.1% |
| Unpaid Family Workers | 0 | 0.0% |
| Total | 805 | 100.0% |
Employment Status by Age in Trainer borough
According to the labor force statistics for Trainer borough, out of the total population over 16 years of age (1,282), 67.1% or 860 individuals are in the labor force, with 4.4% or 38 of them unemployed. The age group with the highest labor force participation rate is 30 to 34 years, with 96.1% or 99 individuals in the labor force. Within the labor force, the 20 to 24 years age range has the highest percentage of unemployed individuals, with 19.2% or 15 of them being unemployed.
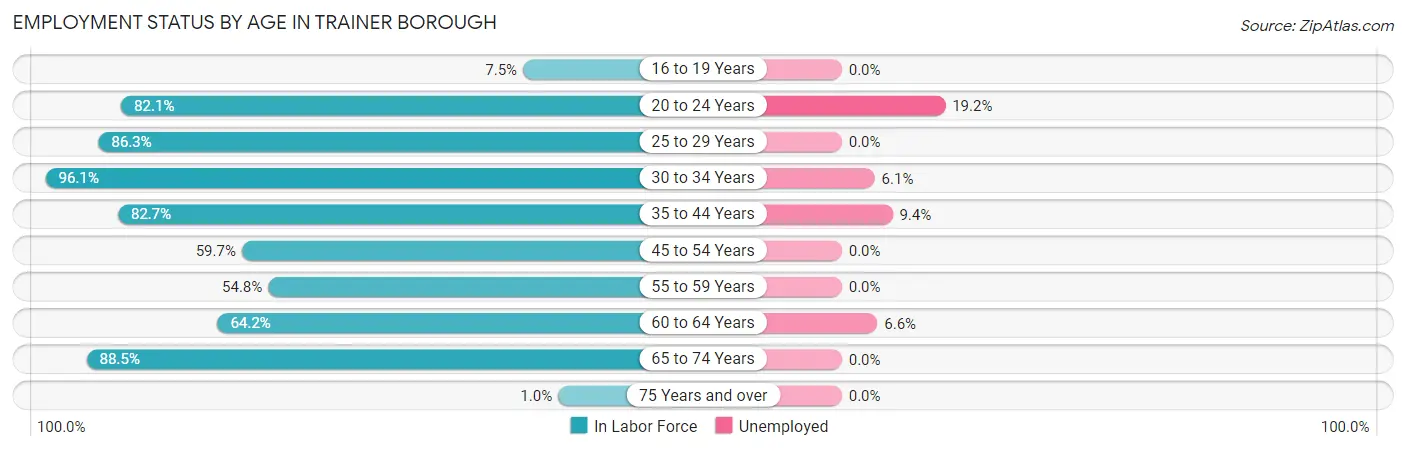
| Age Bracket | In Labor Force | Unemployed |
| 16 to 19 Years | 8 (7.5%) | 0 (0.0%) |
| 20 to 24 Years | 78 (82.1%) | 15 (19.2%) |
| 25 to 29 Years | 82 (86.3%) | 0 (0.0%) |
| 30 to 34 Years | 99 (96.1%) | 6 (6.1%) |
| 35 to 44 Years | 139 (82.7%) | 13 (9.4%) |
| 45 to 54 Years | 83 (59.7%) | 0 (0.0%) |
| 55 to 59 Years | 40 (54.8%) | 0 (0.0%) |
| 60 to 64 Years | 61 (64.2%) | 4 (6.6%) |
| 65 to 74 Years | 269 (88.5%) | 0 (0.0%) |
| 75 Years and over | 1 (1.0%) | 0 (0.0%) |
| Total | 860 (67.1%) | 38 (4.4%) |
Employment Status by Educational Attainment in Trainer borough
According to labor force statistics for Trainer borough, 74.9% of individuals (504) out of the total population between 25 and 64 years of age (673) are in the labor force, with 4.6% or 23 of them being unemployed. The group with the highest labor force participation rate are those with the educational attainment of less than high school, with 96.7% or 29 individuals in the labor force. Within the labor force, individuals with high school diploma education have the highest percentage of unemployment, with 11.7% or 20 of them being unemployed.
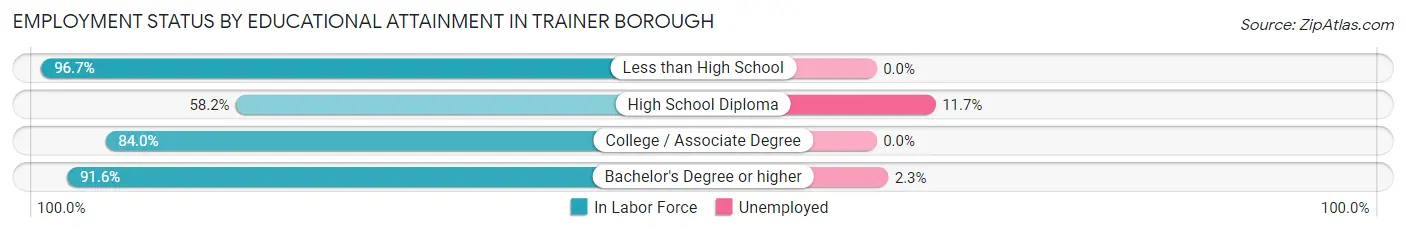
| Educational Attainment | In Labor Force | Unemployed |
| Less than High School | 29 (96.7%) | 0 (0.0%) |
| High School Diploma | 171 (58.2%) | 34 (11.7%) |
| College / Associate Degree | 173 (84.0%) | 0 (0.0%) |
| Bachelor's Degree or higher | 131 (91.6%) | 3 (2.3%) |
| Total | 504 (74.9%) | 31 (4.6%) |
Employment Occupations by Sex in Trainer borough
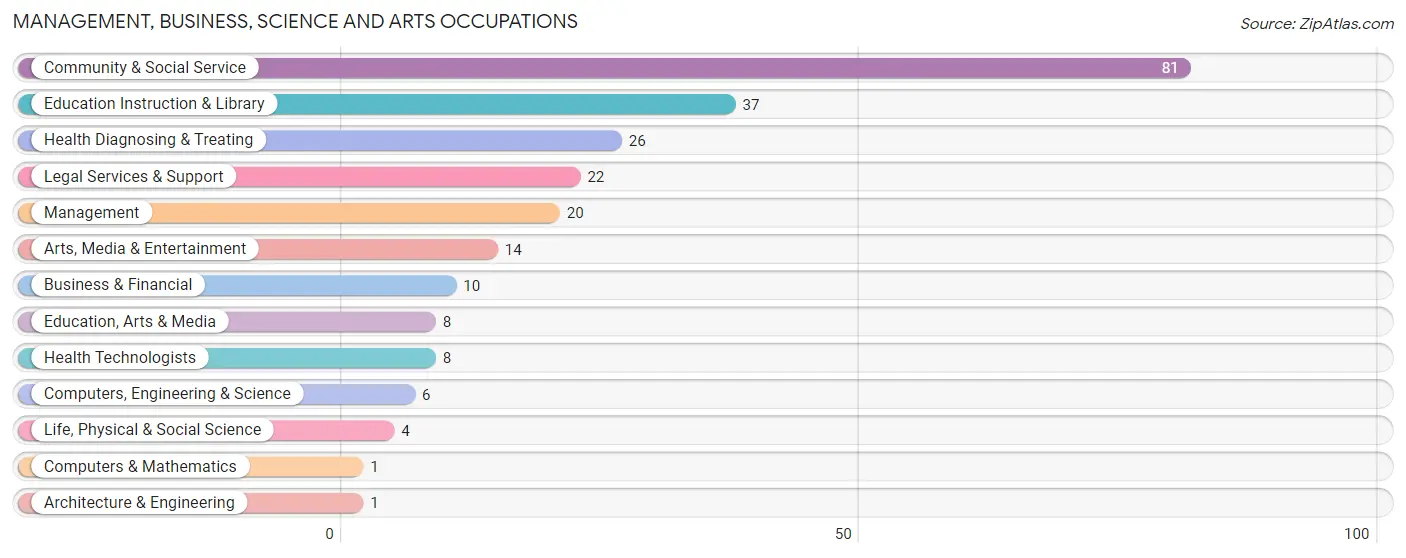
Management, Business, Science and Arts Occupations
The most common Management, Business, Science and Arts occupations in Trainer borough are Community & Social Service (81 | 9.9%), Education Instruction & Library (37 | 4.5%), Health Diagnosing & Treating (26 | 3.2%), Legal Services & Support (22 | 2.7%), and Management (20 | 2.4%).
Management, Business, Science and Arts Occupations by Sex
Within the Management, Business, Science and Arts occupations in Trainer borough, the most male-oriented occupations are Computers & Mathematics (100.0%), Arts, Media & Entertainment (100.0%), and Health Technologists (100.0%), while the most female-oriented occupations are Business & Financial (100.0%), Architecture & Engineering (100.0%), and Life, Physical & Social Science (100.0%).
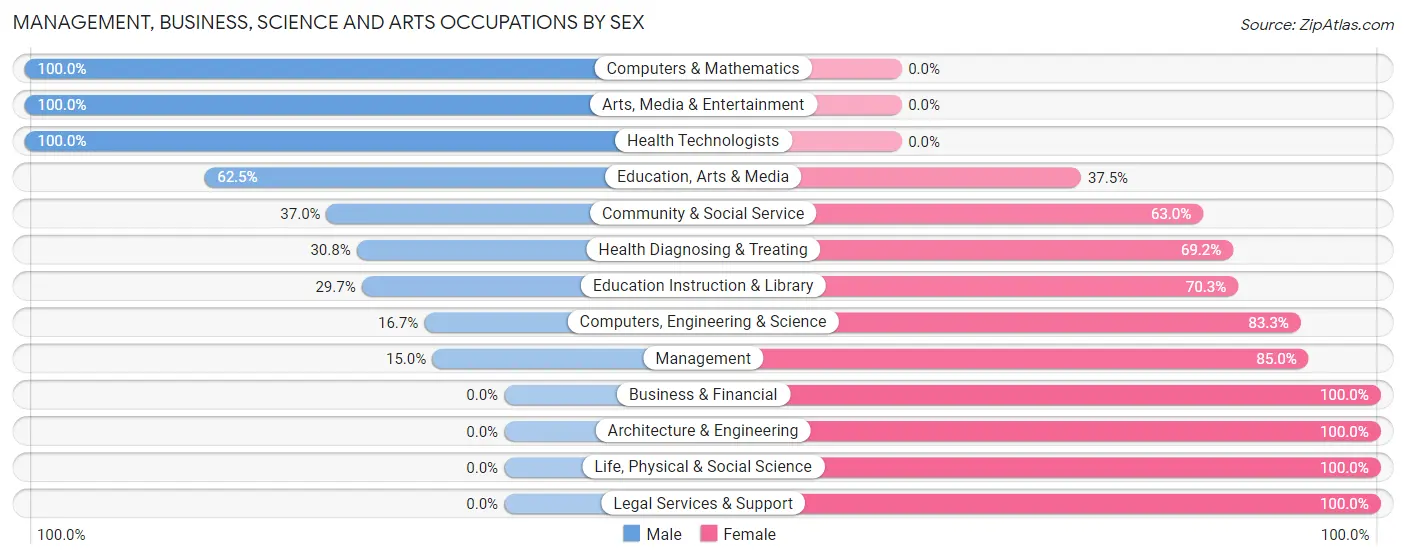
| Occupation | Male | Female |
| Management | 3 (15.0%) | 17 (85.0%) |
| Business & Financial | 0 (0.0%) | 10 (100.0%) |
| Computers, Engineering & Science | 1 (16.7%) | 5 (83.3%) |
| Computers & Mathematics | 1 (100.0%) | 0 (0.0%) |
| Architecture & Engineering | 0 (0.0%) | 1 (100.0%) |
| Life, Physical & Social Science | 0 (0.0%) | 4 (100.0%) |
| Community & Social Service | 30 (37.0%) | 51 (63.0%) |
| Education, Arts & Media | 5 (62.5%) | 3 (37.5%) |
| Legal Services & Support | 0 (0.0%) | 22 (100.0%) |
| Education Instruction & Library | 11 (29.7%) | 26 (70.3%) |
| Arts, Media & Entertainment | 14 (100.0%) | 0 (0.0%) |
| Health Diagnosing & Treating | 8 (30.8%) | 18 (69.2%) |
| Health Technologists | 8 (100.0%) | 0 (0.0%) |
| Total (Category) | 42 (29.4%) | 101 (70.6%) |
| Total (Overall) | 518 (63.0%) | 304 (37.0%) |
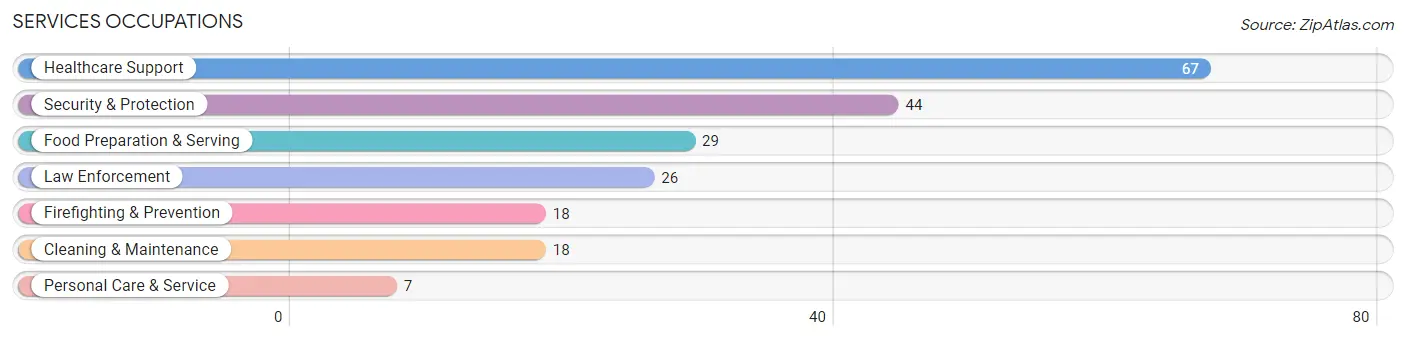
Services Occupations
The most common Services occupations in Trainer borough are Healthcare Support (67 | 8.2%), Security & Protection (44 | 5.3%), Food Preparation & Serving (29 | 3.5%), Law Enforcement (26 | 3.2%), and Firefighting & Prevention (18 | 2.2%).
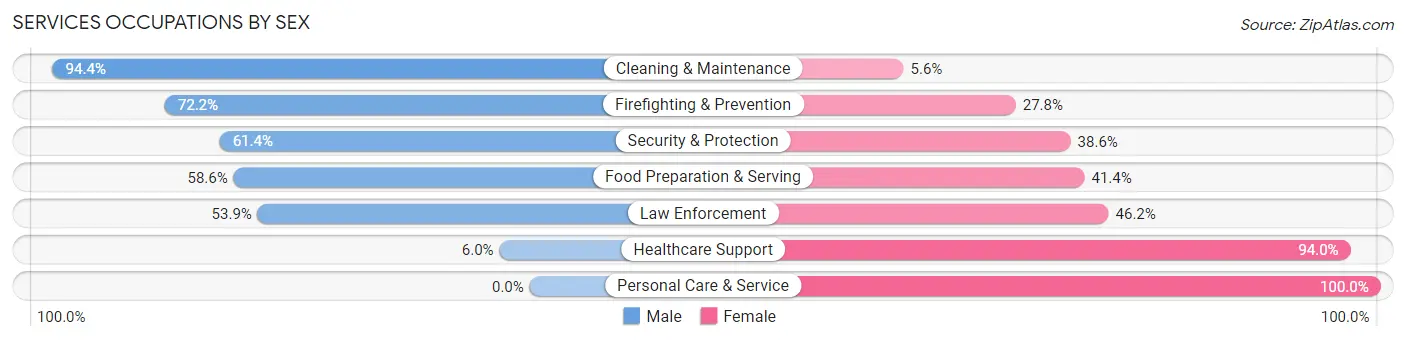
Services Occupations by Sex
Within the Services occupations in Trainer borough, the most male-oriented occupations are Cleaning & Maintenance (94.4%), Firefighting & Prevention (72.2%), and Security & Protection (61.4%), while the most female-oriented occupations are Personal Care & Service (100.0%), Healthcare Support (94.0%), and Law Enforcement (46.2%).
| Occupation | Male | Female |
| Healthcare Support | 4 (6.0%) | 63 (94.0%) |
| Security & Protection | 27 (61.4%) | 17 (38.6%) |
| Firefighting & Prevention | 13 (72.2%) | 5 (27.8%) |
| Law Enforcement | 14 (53.8%) | 12 (46.2%) |
| Food Preparation & Serving | 17 (58.6%) | 12 (41.4%) |
| Cleaning & Maintenance | 17 (94.4%) | 1 (5.6%) |
| Personal Care & Service | 0 (0.0%) | 7 (100.0%) |
| Total (Category) | 65 (39.4%) | 100 (60.6%) |
| Total (Overall) | 518 (63.0%) | 304 (37.0%) |
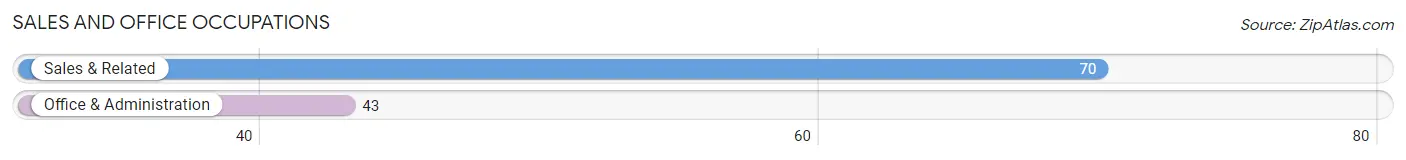
Sales and Office Occupations
The most common Sales and Office occupations in Trainer borough are Sales & Related (70 | 8.5%), and Office & Administration (43 | 5.2%).
Sales and Office Occupations by Sex
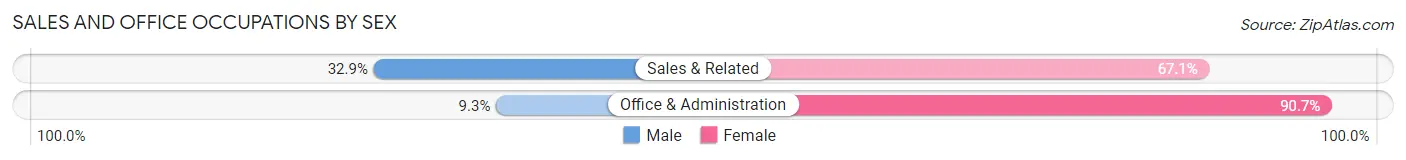
| Occupation | Male | Female |
| Sales & Related | 23 (32.9%) | 47 (67.1%) |
| Office & Administration | 4 (9.3%) | 39 (90.7%) |
| Total (Category) | 27 (23.9%) | 86 (76.1%) |
| Total (Overall) | 518 (63.0%) | 304 (37.0%) |
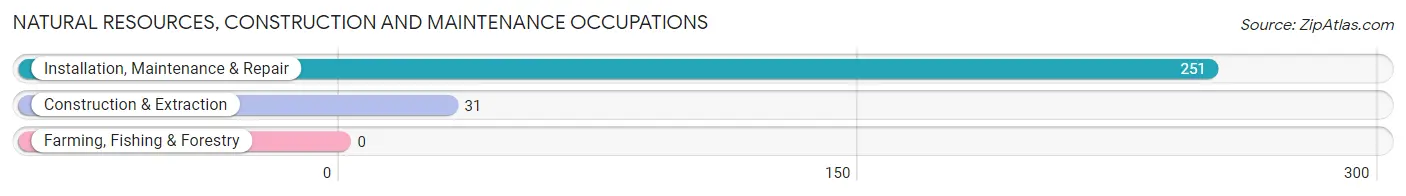
Natural Resources, Construction and Maintenance Occupations
The most common Natural Resources, Construction and Maintenance occupations in Trainer borough are Installation, Maintenance & Repair (251 | 30.5%), and Construction & Extraction (31 | 3.8%).
Natural Resources, Construction and Maintenance Occupations by Sex
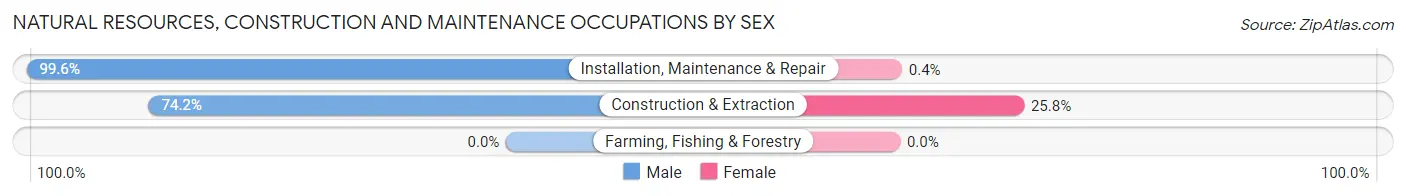
| Occupation | Male | Female |
| Farming, Fishing & Forestry | 0 (0.0%) | 0 (0.0%) |
| Construction & Extraction | 23 (74.2%) | 8 (25.8%) |
| Installation, Maintenance & Repair | 250 (99.6%) | 1 (0.4%) |
| Total (Category) | 273 (96.8%) | 9 (3.2%) |
| Total (Overall) | 518 (63.0%) | 304 (37.0%) |
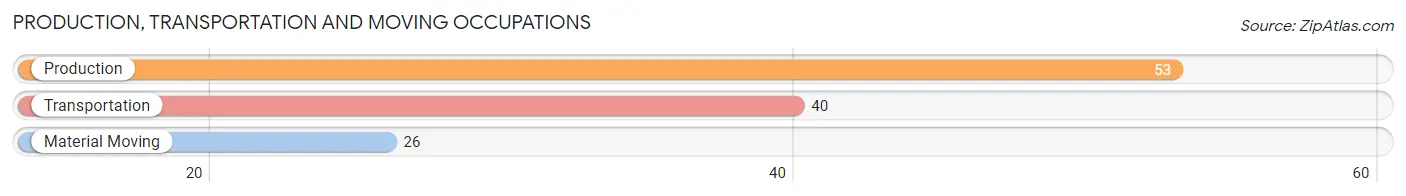
Production, Transportation and Moving Occupations
The most common Production, Transportation and Moving occupations in Trainer borough are Production (53 | 6.5%), Transportation (40 | 4.9%), and Material Moving (26 | 3.2%).
Production, Transportation and Moving Occupations by Sex
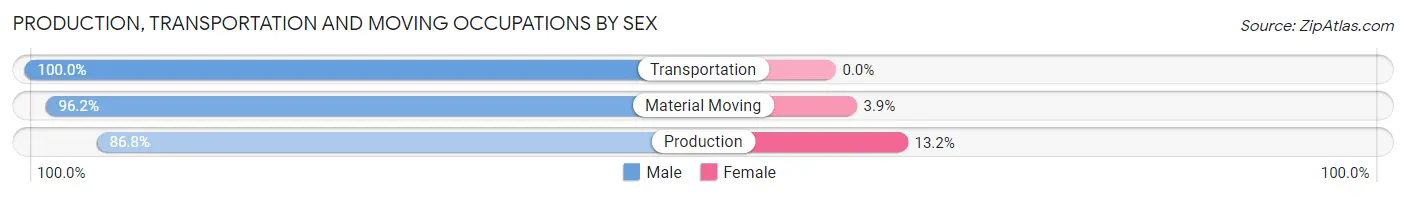
| Occupation | Male | Female |
| Production | 46 (86.8%) | 7 (13.2%) |
| Transportation | 40 (100.0%) | 0 (0.0%) |
| Material Moving | 25 (96.2%) | 1 (3.8%) |
| Total (Category) | 111 (93.3%) | 8 (6.7%) |
| Total (Overall) | 518 (63.0%) | 304 (37.0%) |
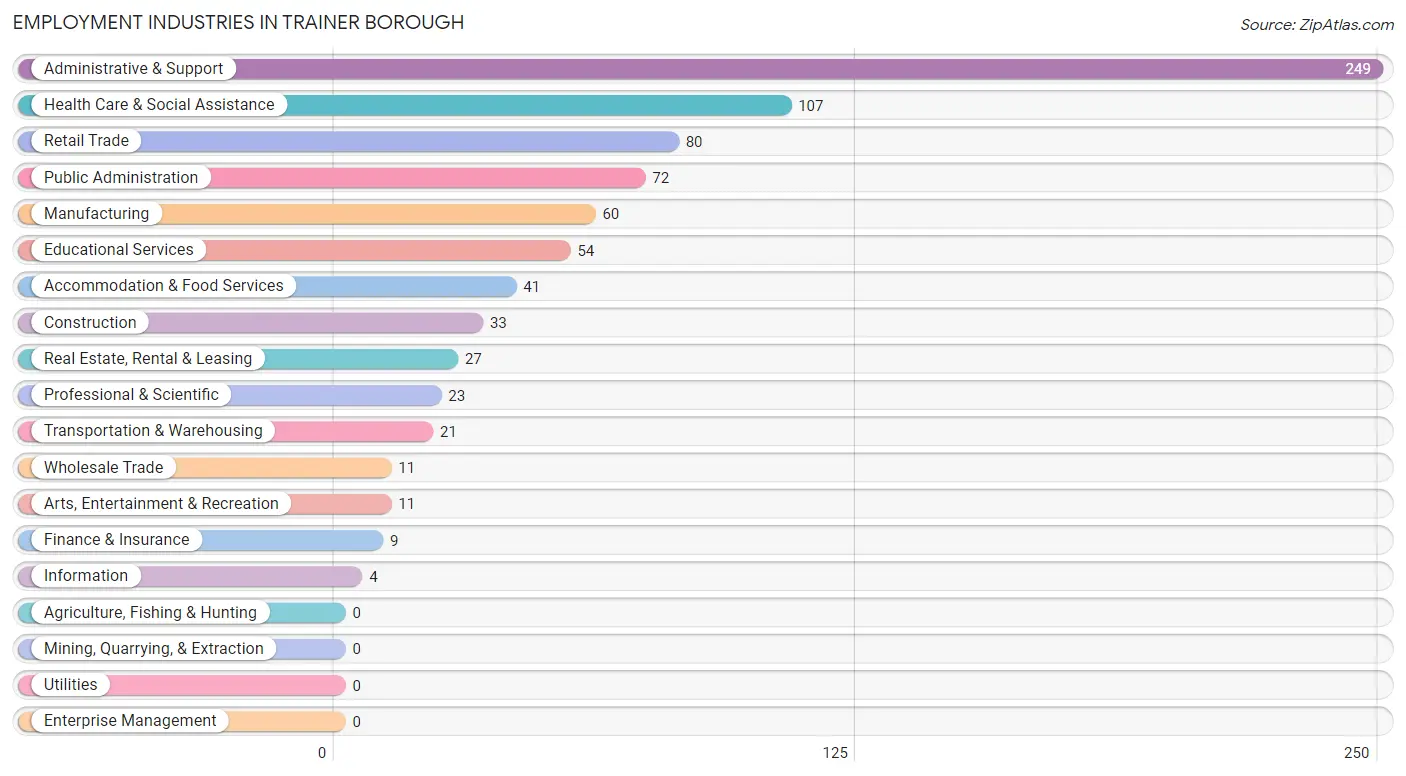
Employment Industries by Sex in Trainer borough
Employment Industries in Trainer borough
The major employment industries in Trainer borough include Administrative & Support (249 | 30.3%), Health Care & Social Assistance (107 | 13.0%), Retail Trade (80 | 9.7%), Public Administration (72 | 8.8%), and Manufacturing (60 | 7.3%).
Employment Industries by Sex in Trainer borough
The Trainer borough industries that see more men than women are Information (100.0%), Manufacturing (93.3%), and Administrative & Support (92.0%), whereas the industries that tend to have a higher number of women are Health Care & Social Assistance (89.7%), Public Administration (75.0%), and Finance & Insurance (66.7%).
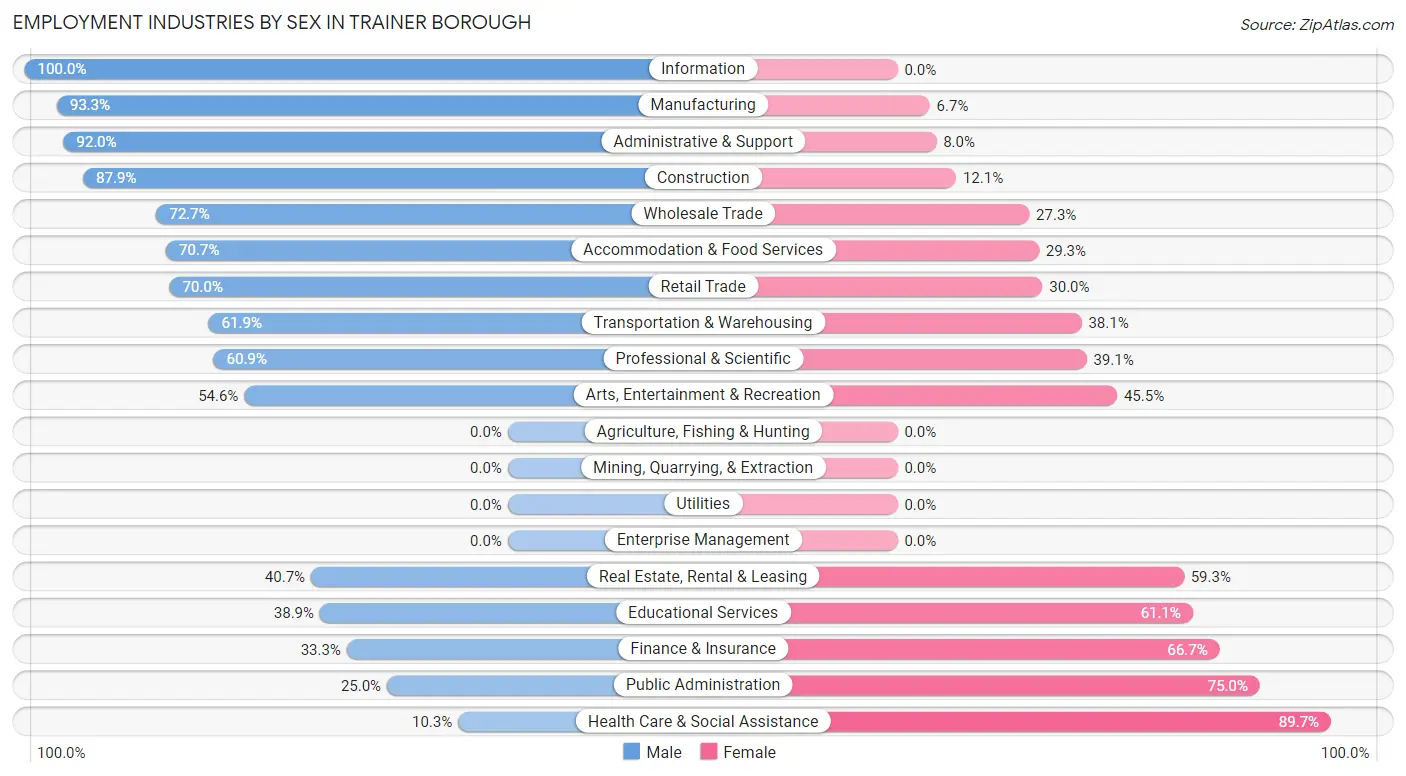
| Industry | Male | Female |
| Agriculture, Fishing & Hunting | 0 (0.0%) | 0 (0.0%) |
| Mining, Quarrying, & Extraction | 0 (0.0%) | 0 (0.0%) |
| Construction | 29 (87.9%) | 4 (12.1%) |
| Manufacturing | 56 (93.3%) | 4 (6.7%) |
| Wholesale Trade | 8 (72.7%) | 3 (27.3%) |
| Retail Trade | 56 (70.0%) | 24 (30.0%) |
| Transportation & Warehousing | 13 (61.9%) | 8 (38.1%) |
| Utilities | 0 (0.0%) | 0 (0.0%) |
| Information | 4 (100.0%) | 0 (0.0%) |
| Finance & Insurance | 3 (33.3%) | 6 (66.7%) |
| Real Estate, Rental & Leasing | 11 (40.7%) | 16 (59.3%) |
| Professional & Scientific | 14 (60.9%) | 9 (39.1%) |
| Enterprise Management | 0 (0.0%) | 0 (0.0%) |
| Administrative & Support | 229 (92.0%) | 20 (8.0%) |
| Educational Services | 21 (38.9%) | 33 (61.1%) |
| Health Care & Social Assistance | 11 (10.3%) | 96 (89.7%) |
| Arts, Entertainment & Recreation | 6 (54.5%) | 5 (45.5%) |
| Accommodation & Food Services | 29 (70.7%) | 12 (29.3%) |
| Public Administration | 18 (25.0%) | 54 (75.0%) |
| Total | 518 (63.0%) | 304 (37.0%) |
Education in Trainer borough
School Enrollment in Trainer borough
The most common levels of schooling among the 482 students in Trainer borough are high school (130 | 27.0%), middle school (121 | 25.1%), and elementary school (75 | 15.6%).
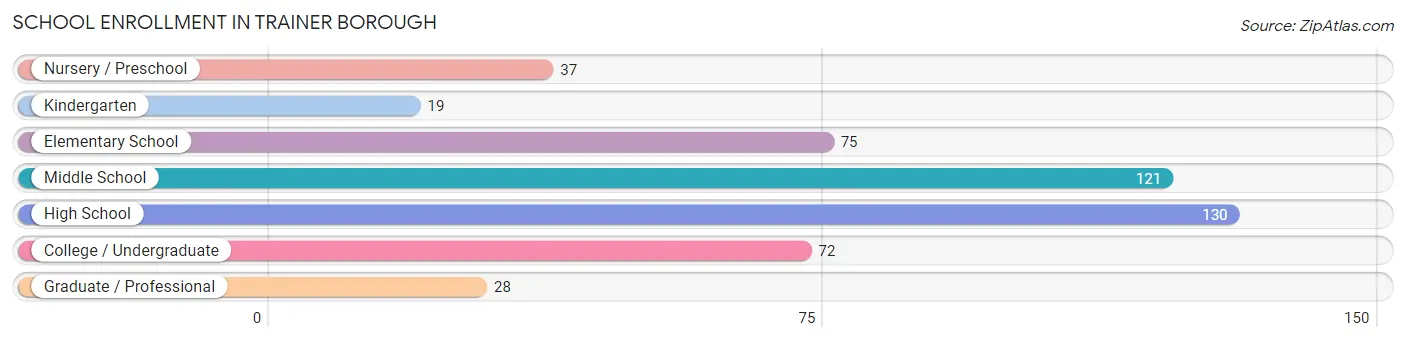
| School Level | # Students | % Students |
| Nursery / Preschool | 37 | 7.7% |
| Kindergarten | 19 | 3.9% |
| Elementary School | 75 | 15.6% |
| Middle School | 121 | 25.1% |
| High School | 130 | 27.0% |
| College / Undergraduate | 72 | 14.9% |
| Graduate / Professional | 28 | 5.8% |
| Total | 482 | 100.0% |
School Enrollment by Age by Funding Source in Trainer borough
Out of a total of 482 students who are enrolled in schools in Trainer borough, 49 (10.2%) attend a private institution, while the remaining 433 (89.8%) are enrolled in public schools. The age group of 35 years and over has the highest likelihood of being enrolled in private schools, with 15 (68.2% in the age bracket) enrolled. Conversely, the age group of 3 to 4 year olds has the lowest likelihood of being enrolled in a private school, with 34 (100.0% in the age bracket) attending a public institution.
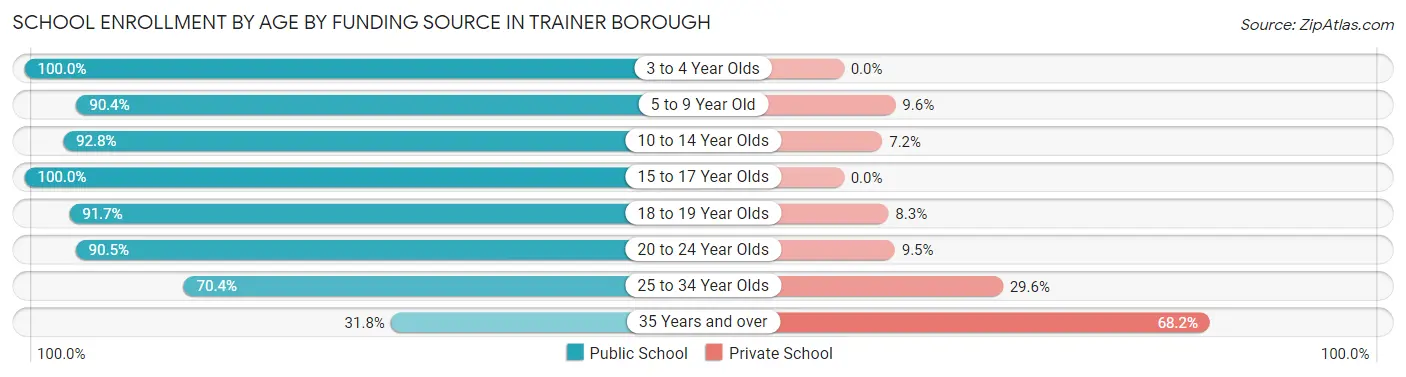
| Age Bracket | Public School | Private School |
| 3 to 4 Year Olds | 34 (100.0%) | 0 (0.0%) |
| 5 to 9 Year Old | 75 (90.4%) | 8 (9.6%) |
| 10 to 14 Year Olds | 142 (92.8%) | 11 (7.2%) |
| 15 to 17 Year Olds | 85 (100.0%) | 0 (0.0%) |
| 18 to 19 Year Olds | 33 (91.7%) | 3 (8.3%) |
| 20 to 24 Year Olds | 38 (90.5%) | 4 (9.5%) |
| 25 to 34 Year Olds | 19 (70.4%) | 8 (29.6%) |
| 35 Years and over | 7 (31.8%) | 15 (68.2%) |
| Total | 433 (89.8%) | 49 (10.2%) |
Educational Attainment by Field of Study in Trainer borough
Education (36 | 20.8%), business (29 | 16.8%), psychology (24 | 13.9%), science & technology (21 | 12.1%), and liberal arts & history (21 | 12.1%) are the most common fields of study among 173 individuals in Trainer borough who have obtained a bachelor's degree or higher.
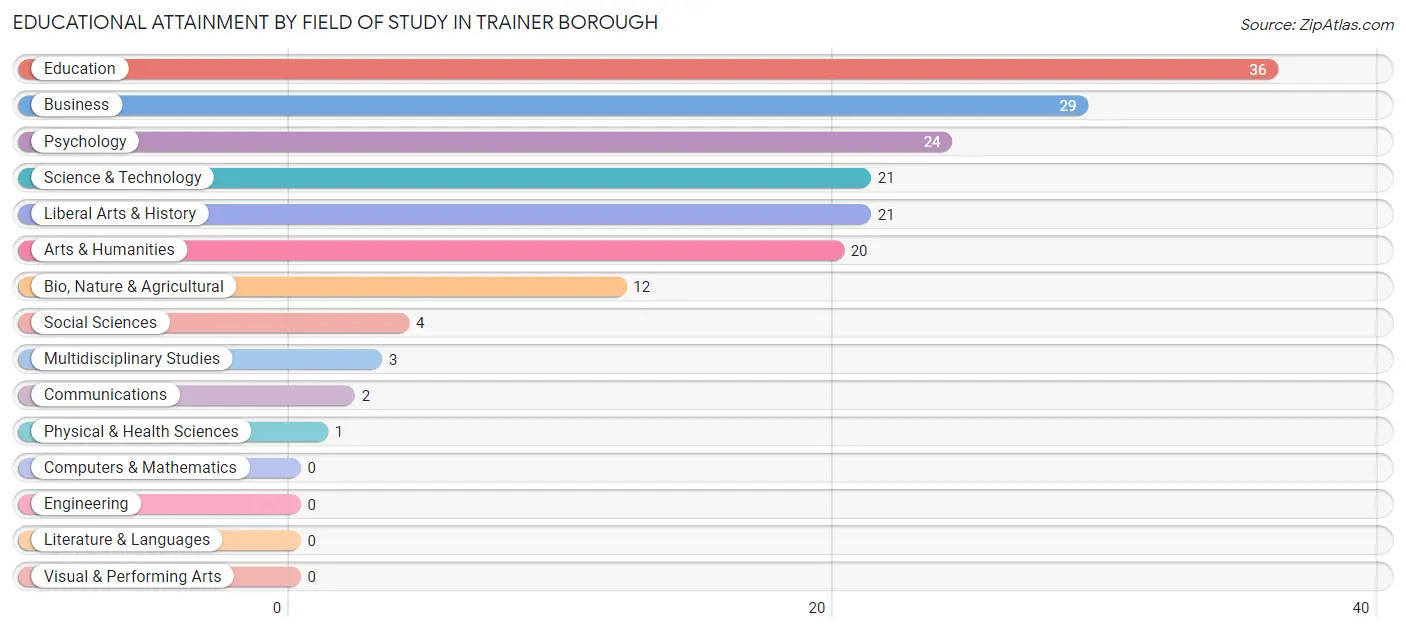
| Field of Study | # Graduates | % Graduates |
| Computers & Mathematics | 0 | 0.0% |
| Bio, Nature & Agricultural | 12 | 6.9% |
| Physical & Health Sciences | 1 | 0.6% |
| Psychology | 24 | 13.9% |
| Social Sciences | 4 | 2.3% |
| Engineering | 0 | 0.0% |
| Multidisciplinary Studies | 3 | 1.7% |
| Science & Technology | 21 | 12.1% |
| Business | 29 | 16.8% |
| Education | 36 | 20.8% |
| Literature & Languages | 0 | 0.0% |
| Liberal Arts & History | 21 | 12.1% |
| Visual & Performing Arts | 0 | 0.0% |
| Communications | 2 | 1.2% |
| Arts & Humanities | 20 | 11.6% |
| Total | 173 | 100.0% |
Transportation & Commute in Trainer borough
Vehicle Availability by Sex in Trainer borough
The most prevalent vehicle ownership categories in Trainer borough are males with 3 vehicles (281, accounting for 55.7%) and females with 3 vehicles (63, making up 93.4%).
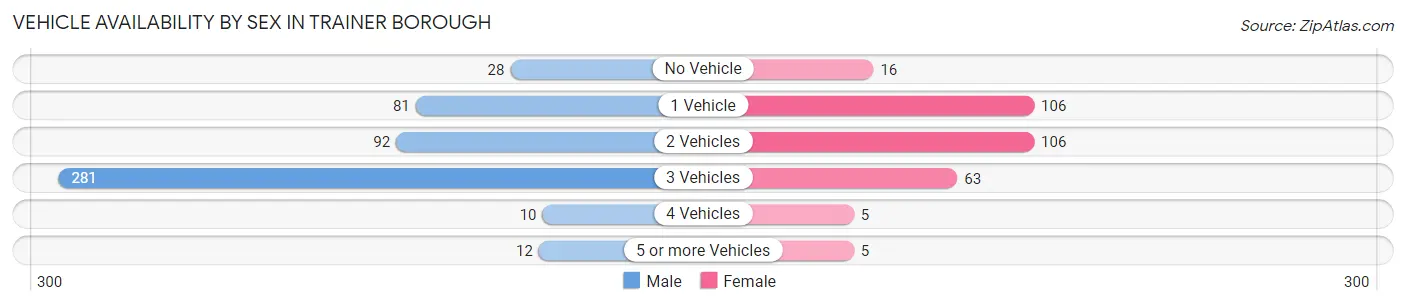
| Vehicles Available | Male | Female |
| No Vehicle | 28 (5.6%) | 16 (5.3%) |
| 1 Vehicle | 81 (16.1%) | 106 (35.2%) |
| 2 Vehicles | 92 (18.2%) | 106 (35.2%) |
| 3 Vehicles | 281 (55.7%) | 63 (20.9%) |
| 4 Vehicles | 10 (2.0%) | 5 (1.7%) |
| 5 or more Vehicles | 12 (2.4%) | 5 (1.7%) |
| Total | 504 (100.0%) | 301 (100.0%) |
Commute Time in Trainer borough
The most frequently occuring commute durations in Trainer borough are 45 to 59 minutes (261 commuters, 34.0%), 15 to 19 minutes (96 commuters, 12.5%), and 20 to 24 minutes (82 commuters, 10.7%).
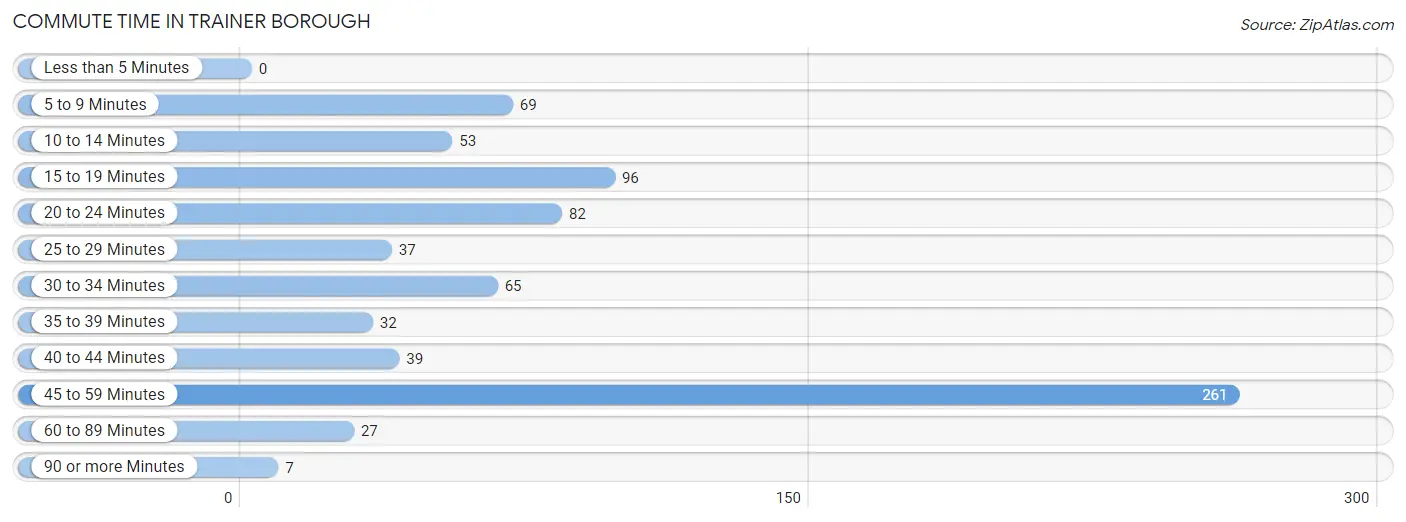
| Commute Time | # Commuters | % Commuters |
| Less than 5 Minutes | 0 | 0.0% |
| 5 to 9 Minutes | 69 | 9.0% |
| 10 to 14 Minutes | 53 | 6.9% |
| 15 to 19 Minutes | 96 | 12.5% |
| 20 to 24 Minutes | 82 | 10.7% |
| 25 to 29 Minutes | 37 | 4.8% |
| 30 to 34 Minutes | 65 | 8.5% |
| 35 to 39 Minutes | 32 | 4.2% |
| 40 to 44 Minutes | 39 | 5.1% |
| 45 to 59 Minutes | 261 | 34.0% |
| 60 to 89 Minutes | 27 | 3.5% |
| 90 or more Minutes | 7 | 0.9% |
Commute Time by Sex in Trainer borough
The most common commute times in Trainer borough are 45 to 59 minutes (249 commuters, 50.9%) for males and 20 to 24 minutes (57 commuters, 20.4%) for females.
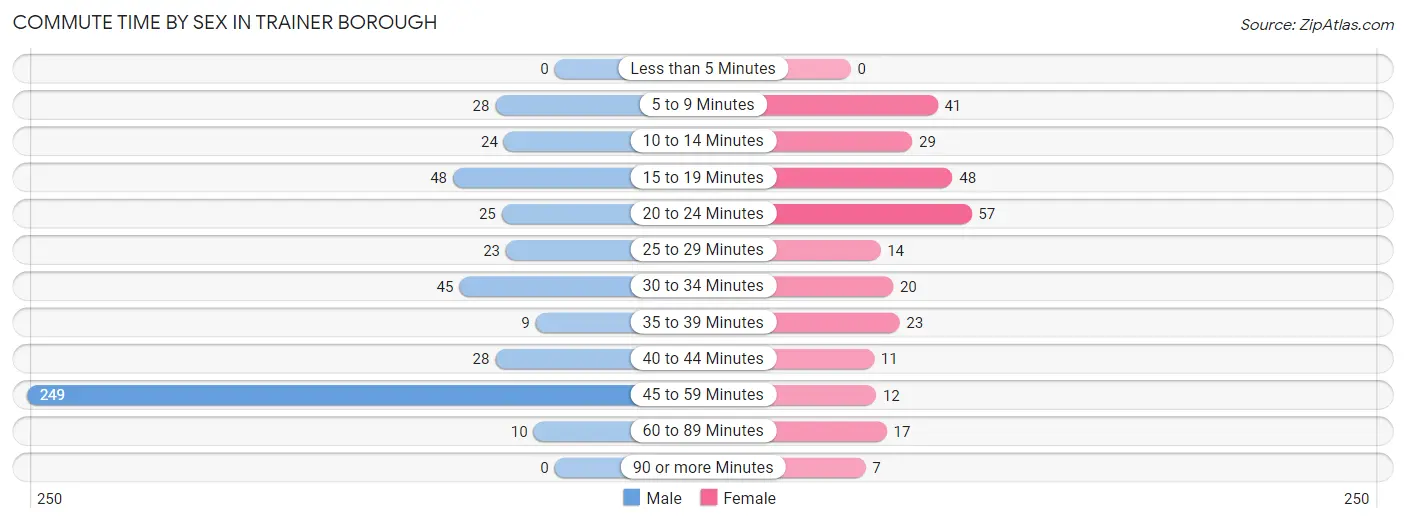
| Commute Time | Male | Female |
| Less than 5 Minutes | 0 (0.0%) | 0 (0.0%) |
| 5 to 9 Minutes | 28 (5.7%) | 41 (14.7%) |
| 10 to 14 Minutes | 24 (4.9%) | 29 (10.4%) |
| 15 to 19 Minutes | 48 (9.8%) | 48 (17.2%) |
| 20 to 24 Minutes | 25 (5.1%) | 57 (20.4%) |
| 25 to 29 Minutes | 23 (4.7%) | 14 (5.0%) |
| 30 to 34 Minutes | 45 (9.2%) | 20 (7.2%) |
| 35 to 39 Minutes | 9 (1.8%) | 23 (8.2%) |
| 40 to 44 Minutes | 28 (5.7%) | 11 (3.9%) |
| 45 to 59 Minutes | 249 (50.9%) | 12 (4.3%) |
| 60 to 89 Minutes | 10 (2.0%) | 17 (6.1%) |
| 90 or more Minutes | 0 (0.0%) | 7 (2.5%) |
Time of Departure to Work by Sex in Trainer borough
The most frequent times of departure to work in Trainer borough are 7:00 AM to 7:29 AM (260, 53.2%) for males and 7:00 AM to 7:29 AM (45, 16.1%) for females.
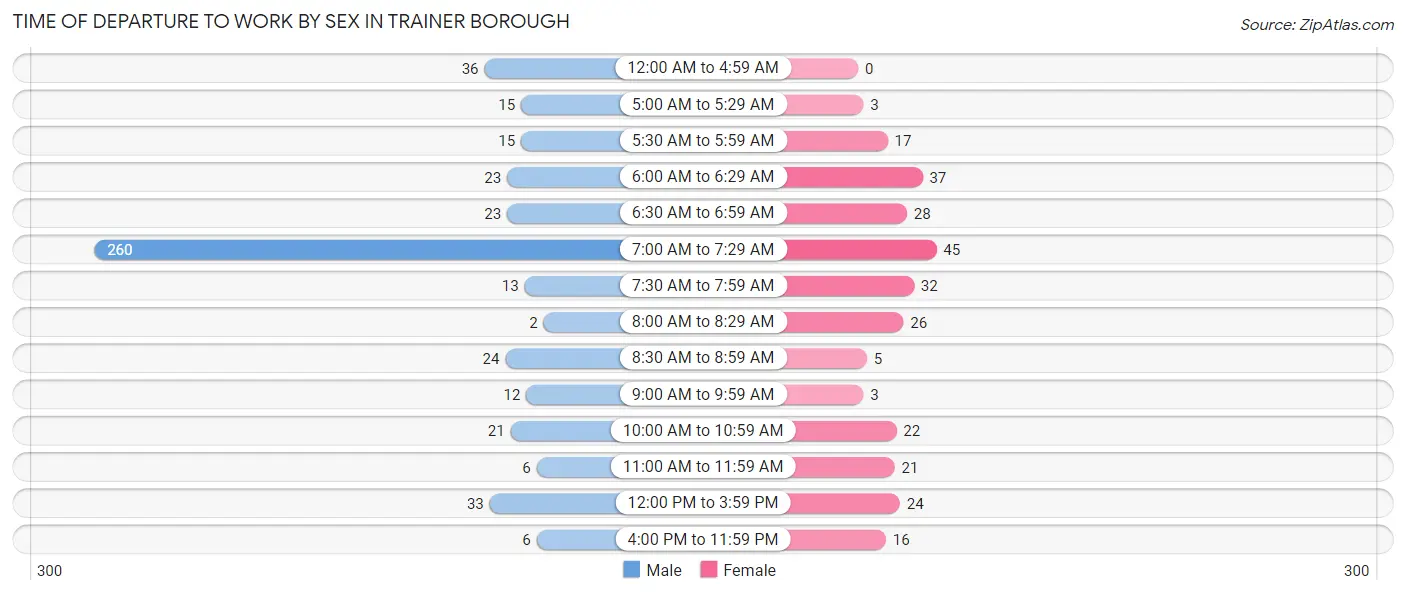
| Time of Departure | Male | Female |
| 12:00 AM to 4:59 AM | 36 (7.4%) | 0 (0.0%) |
| 5:00 AM to 5:29 AM | 15 (3.1%) | 3 (1.1%) |
| 5:30 AM to 5:59 AM | 15 (3.1%) | 17 (6.1%) |
| 6:00 AM to 6:29 AM | 23 (4.7%) | 37 (13.3%) |
| 6:30 AM to 6:59 AM | 23 (4.7%) | 28 (10.0%) |
| 7:00 AM to 7:29 AM | 260 (53.2%) | 45 (16.1%) |
| 7:30 AM to 7:59 AM | 13 (2.7%) | 32 (11.5%) |
| 8:00 AM to 8:29 AM | 2 (0.4%) | 26 (9.3%) |
| 8:30 AM to 8:59 AM | 24 (4.9%) | 5 (1.8%) |
| 9:00 AM to 9:59 AM | 12 (2.5%) | 3 (1.1%) |
| 10:00 AM to 10:59 AM | 21 (4.3%) | 22 (7.9%) |
| 11:00 AM to 11:59 AM | 6 (1.2%) | 21 (7.5%) |
| 12:00 PM to 3:59 PM | 33 (6.8%) | 24 (8.6%) |
| 4:00 PM to 11:59 PM | 6 (1.2%) | 16 (5.7%) |
| Total | 489 (100.0%) | 279 (100.0%) |
Housing Occupancy in Trainer borough
Occupancy by Ownership in Trainer borough
Of the total 724 dwellings in Trainer borough, owner-occupied units account for 558 (77.1%), while renter-occupied units make up 166 (22.9%).
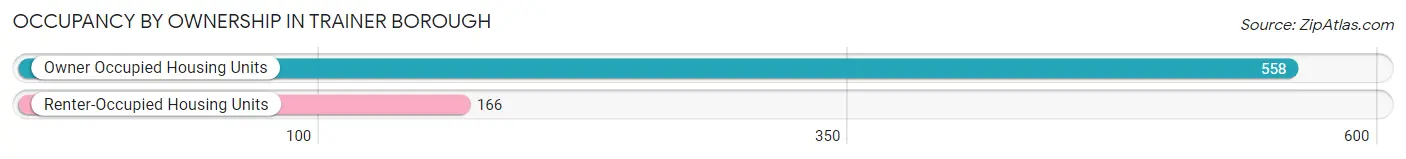
| Occupancy | # Housing Units | % Housing Units |
| Owner Occupied Housing Units | 558 | 77.1% |
| Renter-Occupied Housing Units | 166 | 22.9% |
| Total Occupied Housing Units | 724 | 100.0% |
Occupancy by Household Size in Trainer borough
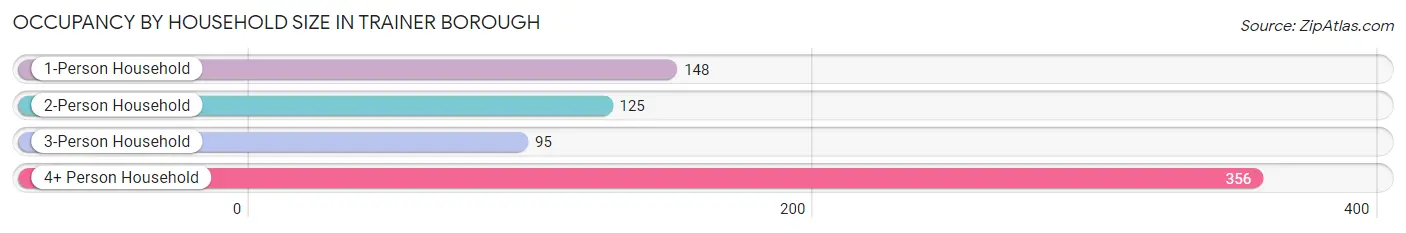
| Household Size | # Housing Units | % Housing Units |
| 1-Person Household | 148 | 20.4% |
| 2-Person Household | 125 | 17.3% |
| 3-Person Household | 95 | 13.1% |
| 4+ Person Household | 356 | 49.2% |
| Total Housing Units | 724 | 100.0% |
Occupancy by Ownership by Household Size in Trainer borough
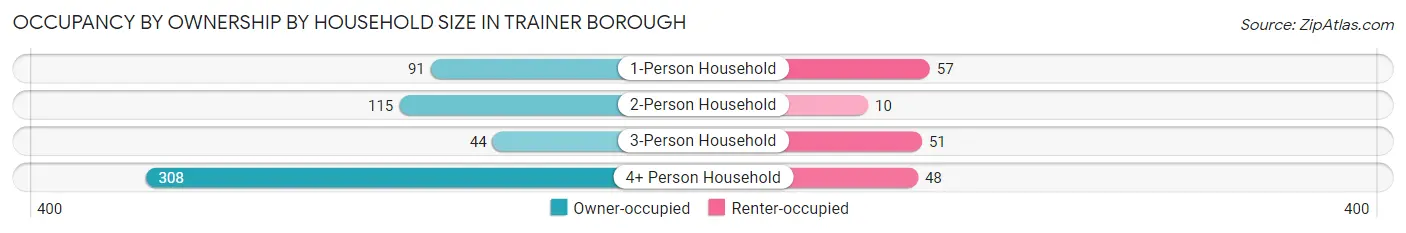
| Household Size | Owner-occupied | Renter-occupied |
| 1-Person Household | 91 (61.5%) | 57 (38.5%) |
| 2-Person Household | 115 (92.0%) | 10 (8.0%) |
| 3-Person Household | 44 (46.3%) | 51 (53.7%) |
| 4+ Person Household | 308 (86.5%) | 48 (13.5%) |
| Total Housing Units | 558 (77.1%) | 166 (22.9%) |
Occupancy by Educational Attainment in Trainer borough
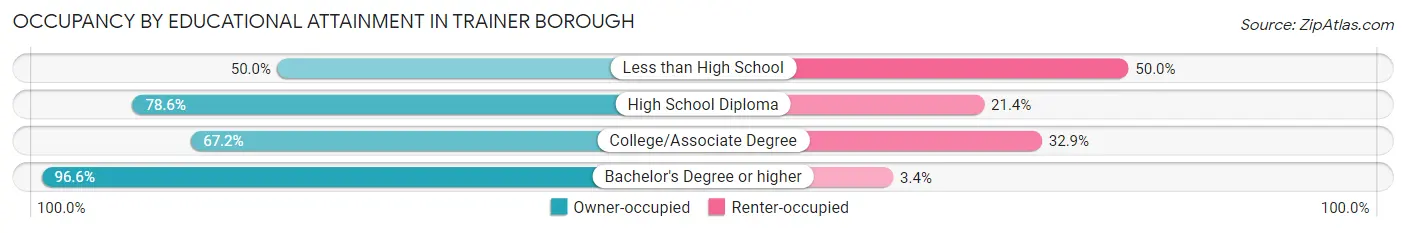
| Household Size | Owner-occupied | Renter-occupied |
| Less than High School | 20 (50.0%) | 20 (50.0%) |
| High School Diploma | 360 (78.6%) | 98 (21.4%) |
| College/Associate Degree | 92 (67.1%) | 45 (32.9%) |
| Bachelor's Degree or higher | 86 (96.6%) | 3 (3.4%) |
Occupancy by Age of Householder in Trainer borough
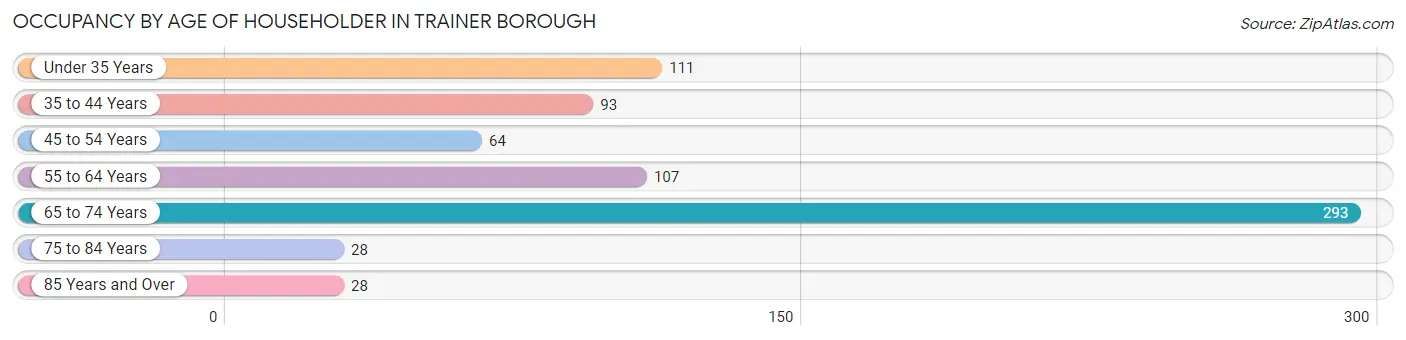
| Age Bracket | # Households | % Households |
| Under 35 Years | 111 | 15.3% |
| 35 to 44 Years | 93 | 12.9% |
| 45 to 54 Years | 64 | 8.8% |
| 55 to 64 Years | 107 | 14.8% |
| 65 to 74 Years | 293 | 40.5% |
| 75 to 84 Years | 28 | 3.9% |
| 85 Years and Over | 28 | 3.9% |
| Total | 724 | 100.0% |
Housing Finances in Trainer borough
Median Income by Occupancy in Trainer borough
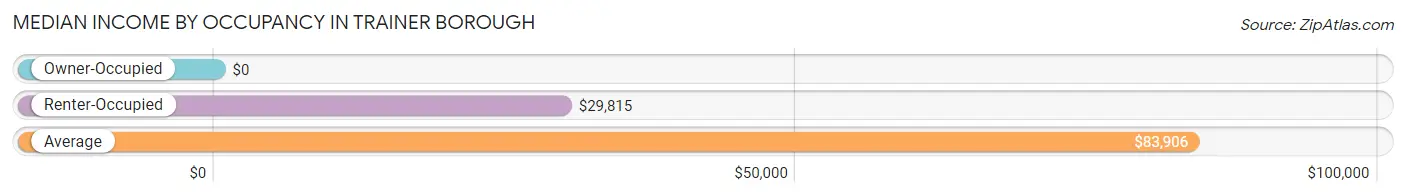
| Occupancy Type | # Households | Median Income |
| Owner-Occupied | 558 (77.1%) | $0 |
| Renter-Occupied | 166 (22.9%) | $29,815 |
| Average | 724 (100.0%) | $83,906 |
Occupancy by Householder Income Bracket in Trainer borough
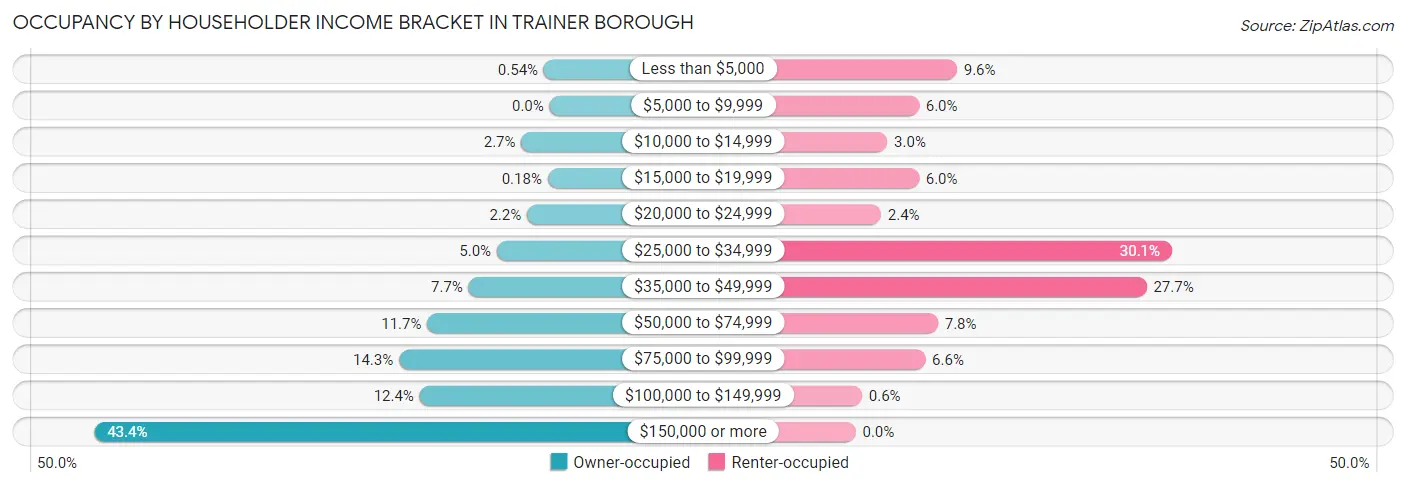
| Income Bracket | Owner-occupied | Renter-occupied |
| Less than $5,000 | 3 (0.5%) | 16 (9.6%) |
| $5,000 to $9,999 | 0 (0.0%) | 10 (6.0%) |
| $10,000 to $14,999 | 15 (2.7%) | 5 (3.0%) |
| $15,000 to $19,999 | 1 (0.2%) | 10 (6.0%) |
| $20,000 to $24,999 | 12 (2.1%) | 4 (2.4%) |
| $25,000 to $34,999 | 28 (5.0%) | 50 (30.1%) |
| $35,000 to $49,999 | 43 (7.7%) | 46 (27.7%) |
| $50,000 to $74,999 | 65 (11.7%) | 13 (7.8%) |
| $75,000 to $99,999 | 80 (14.3%) | 11 (6.6%) |
| $100,000 to $149,999 | 69 (12.4%) | 1 (0.6%) |
| $150,000 or more | 242 (43.4%) | 0 (0.0%) |
| Total | 558 (100.0%) | 166 (100.0%) |
Monthly Housing Cost Tiers in Trainer borough
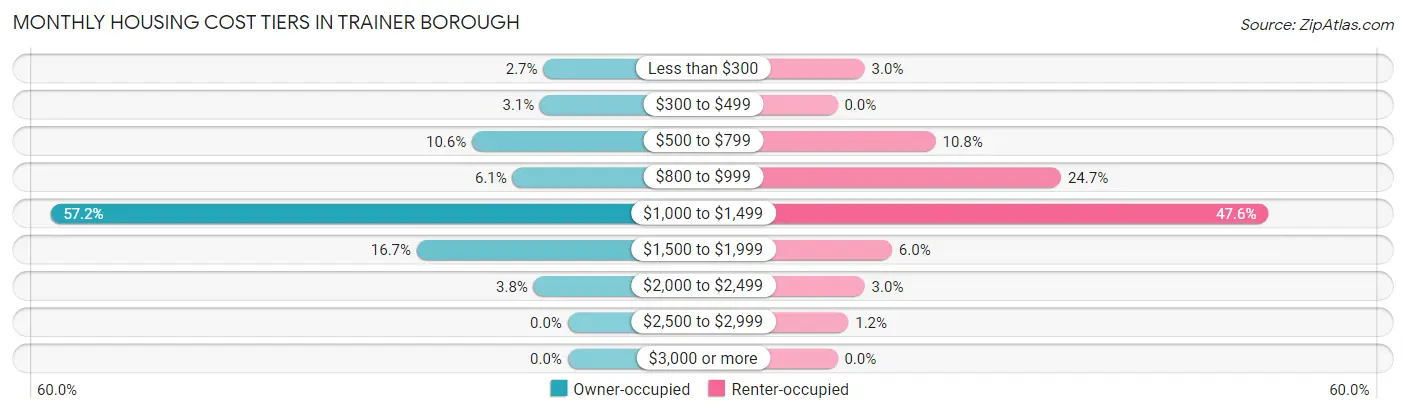
| Monthly Cost | Owner-occupied | Renter-occupied |
| Less than $300 | 15 (2.7%) | 5 (3.0%) |
| $300 to $499 | 17 (3.0%) | 0 (0.0%) |
| $500 to $799 | 59 (10.6%) | 18 (10.8%) |
| $800 to $999 | 34 (6.1%) | 41 (24.7%) |
| $1,000 to $1,499 | 319 (57.2%) | 79 (47.6%) |
| $1,500 to $1,999 | 93 (16.7%) | 10 (6.0%) |
| $2,000 to $2,499 | 21 (3.8%) | 5 (3.0%) |
| $2,500 to $2,999 | 0 (0.0%) | 2 (1.2%) |
| $3,000 or more | 0 (0.0%) | 0 (0.0%) |
| Total | 558 (100.0%) | 166 (100.0%) |
Physical Housing Characteristics in Trainer borough
Housing Structures in Trainer borough
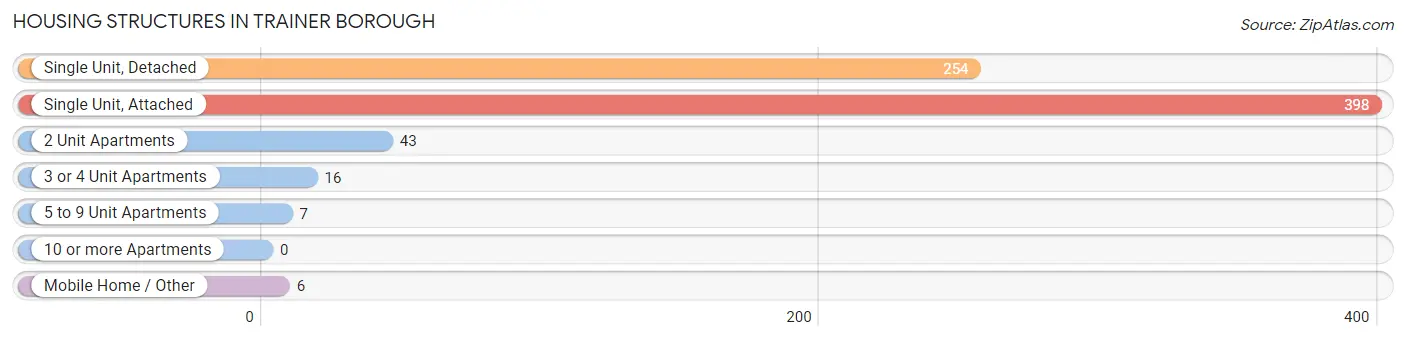
| Structure Type | # Housing Units | % Housing Units |
| Single Unit, Detached | 254 | 35.1% |
| Single Unit, Attached | 398 | 55.0% |
| 2 Unit Apartments | 43 | 5.9% |
| 3 or 4 Unit Apartments | 16 | 2.2% |
| 5 to 9 Unit Apartments | 7 | 1.0% |
| 10 or more Apartments | 0 | 0.0% |
| Mobile Home / Other | 6 | 0.8% |
| Total | 724 | 100.0% |
Housing Structures by Occupancy in Trainer borough
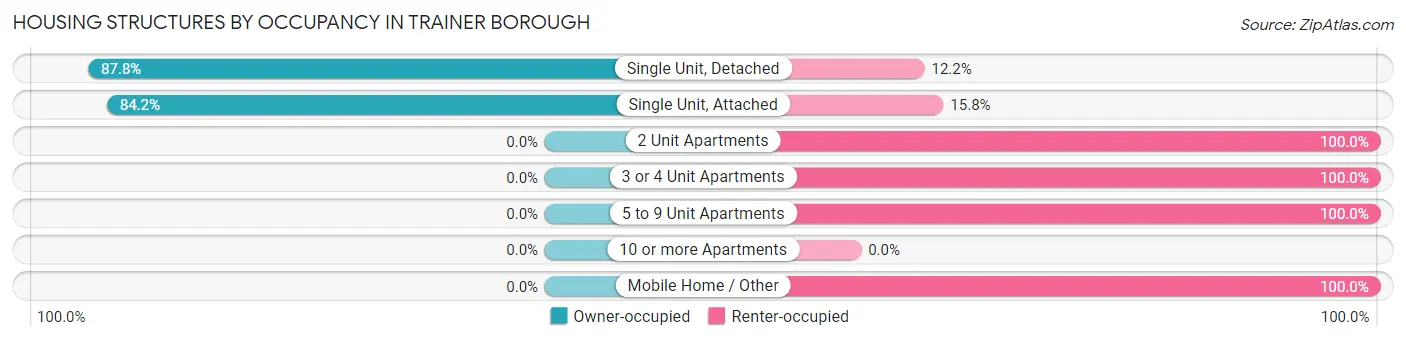
| Structure Type | Owner-occupied | Renter-occupied |
| Single Unit, Detached | 223 (87.8%) | 31 (12.2%) |
| Single Unit, Attached | 335 (84.2%) | 63 (15.8%) |
| 2 Unit Apartments | 0 (0.0%) | 43 (100.0%) |
| 3 or 4 Unit Apartments | 0 (0.0%) | 16 (100.0%) |
| 5 to 9 Unit Apartments | 0 (0.0%) | 7 (100.0%) |
| 10 or more Apartments | 0 (0.0%) | 0 (0.0%) |
| Mobile Home / Other | 0 (0.0%) | 6 (100.0%) |
| Total | 558 (77.1%) | 166 (22.9%) |
Housing Structures by Number of Rooms in Trainer borough
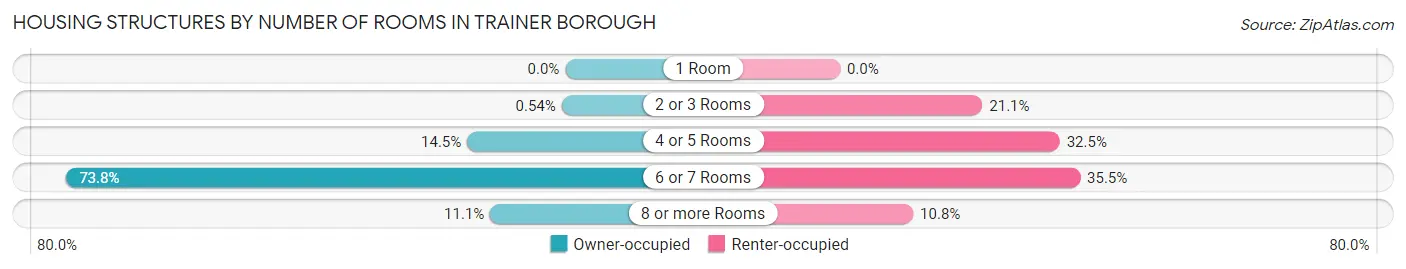
| Number of Rooms | Owner-occupied | Renter-occupied |
| 1 Room | 0 (0.0%) | 0 (0.0%) |
| 2 or 3 Rooms | 3 (0.5%) | 35 (21.1%) |
| 4 or 5 Rooms | 81 (14.5%) | 54 (32.5%) |
| 6 or 7 Rooms | 412 (73.8%) | 59 (35.5%) |
| 8 or more Rooms | 62 (11.1%) | 18 (10.8%) |
| Total | 558 (100.0%) | 166 (100.0%) |
Housing Structure by Heating Type in Trainer borough
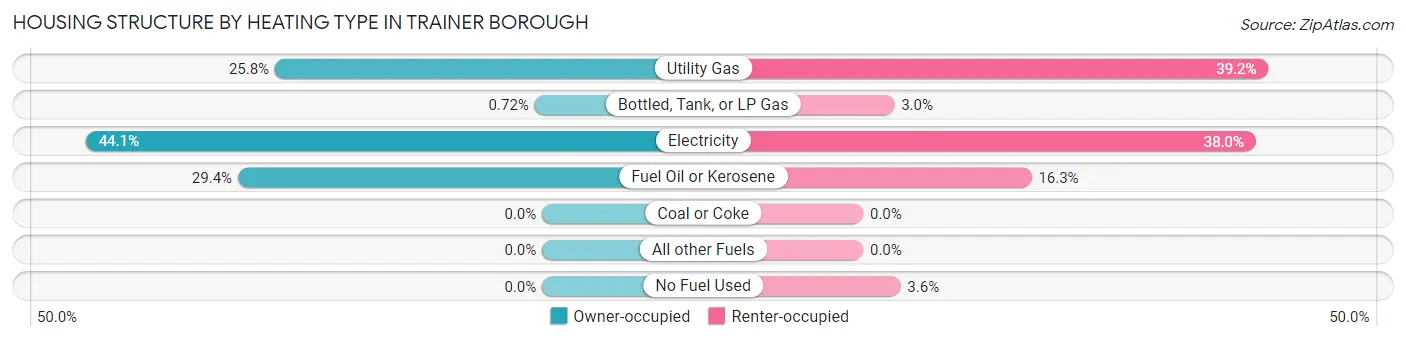
| Heating Type | Owner-occupied | Renter-occupied |
| Utility Gas | 144 (25.8%) | 65 (39.2%) |
| Bottled, Tank, or LP Gas | 4 (0.7%) | 5 (3.0%) |
| Electricity | 246 (44.1%) | 63 (38.0%) |
| Fuel Oil or Kerosene | 164 (29.4%) | 27 (16.3%) |
| Coal or Coke | 0 (0.0%) | 0 (0.0%) |
| All other Fuels | 0 (0.0%) | 0 (0.0%) |
| No Fuel Used | 0 (0.0%) | 6 (3.6%) |
| Total | 558 (100.0%) | 166 (100.0%) |
Household Vehicle Usage in Trainer borough
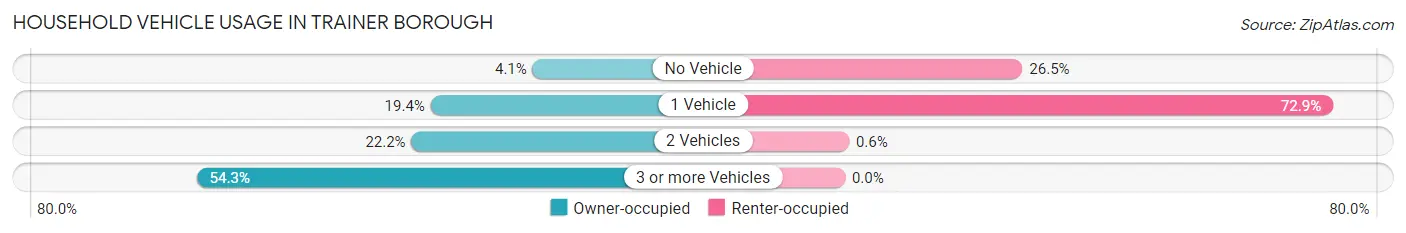
| Vehicles per Household | Owner-occupied | Renter-occupied |
| No Vehicle | 23 (4.1%) | 44 (26.5%) |
| 1 Vehicle | 108 (19.4%) | 121 (72.9%) |
| 2 Vehicles | 124 (22.2%) | 1 (0.6%) |
| 3 or more Vehicles | 303 (54.3%) | 0 (0.0%) |
| Total | 558 (100.0%) | 166 (100.0%) |
Real Estate & Mortgages in Trainer borough
Real Estate and Mortgage Overview in Trainer borough
| Characteristic | Without Mortgage | With Mortgage |
| Housing Units | 115 | 443 |
| Median Property Value | $138,500 | $118,600 |
| Median Household Income | $50,313 | $239 |
| Monthly Housing Costs | $653 | $0 |
| Real Estate Taxes | $3,794 | $11 |
Property Value by Mortgage Status in Trainer borough
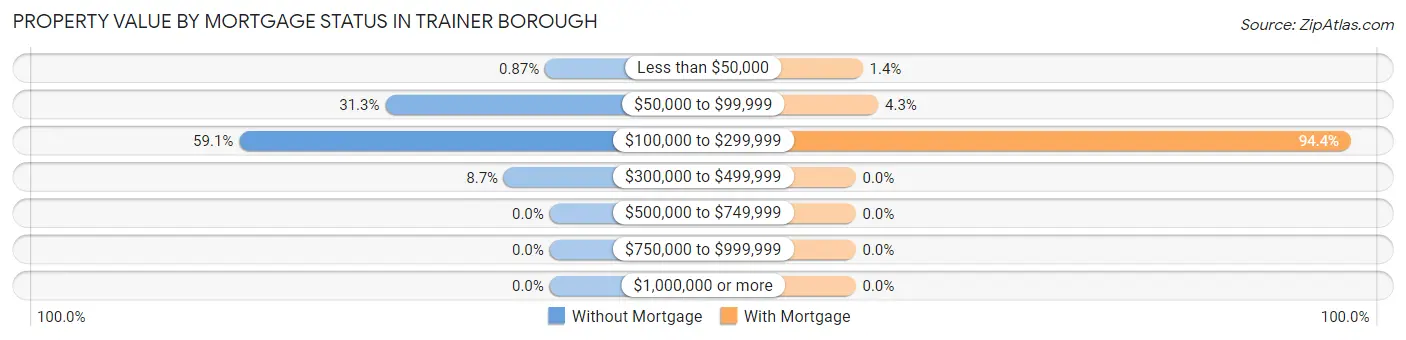
| Property Value | Without Mortgage | With Mortgage |
| Less than $50,000 | 1 (0.9%) | 6 (1.3%) |
| $50,000 to $99,999 | 36 (31.3%) | 19 (4.3%) |
| $100,000 to $299,999 | 68 (59.1%) | 418 (94.4%) |
| $300,000 to $499,999 | 10 (8.7%) | 0 (0.0%) |
| $500,000 to $749,999 | 0 (0.0%) | 0 (0.0%) |
| $750,000 to $999,999 | 0 (0.0%) | 0 (0.0%) |
| $1,000,000 or more | 0 (0.0%) | 0 (0.0%) |
| Total | 115 (100.0%) | 443 (100.0%) |
Household Income by Mortgage Status in Trainer borough
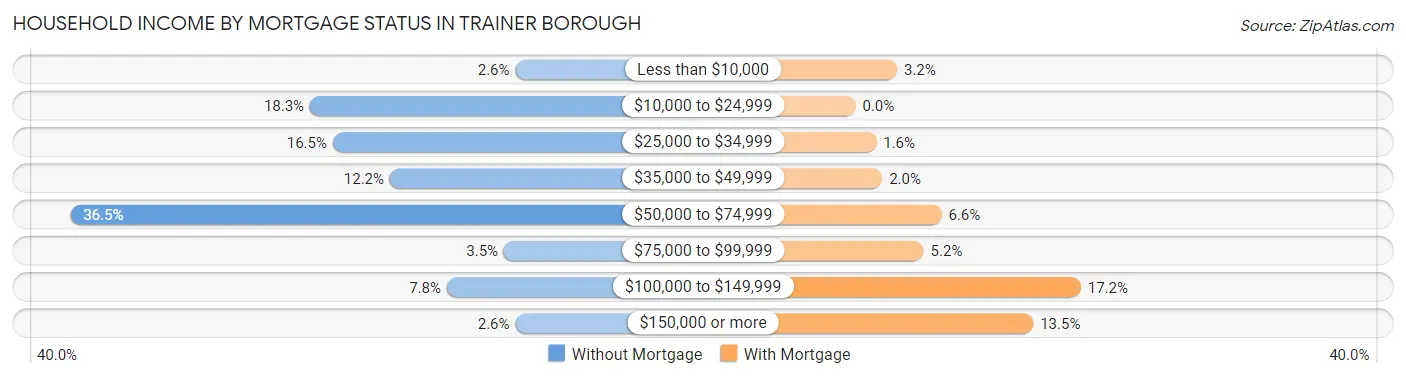
| Household Income | Without Mortgage | With Mortgage |
| Less than $10,000 | 3 (2.6%) | 14 (3.2%) |
| $10,000 to $24,999 | 21 (18.3%) | 0 (0.0%) |
| $25,000 to $34,999 | 19 (16.5%) | 7 (1.6%) |
| $35,000 to $49,999 | 14 (12.2%) | 9 (2.0%) |
| $50,000 to $74,999 | 42 (36.5%) | 29 (6.6%) |
| $75,000 to $99,999 | 4 (3.5%) | 23 (5.2%) |
| $100,000 to $149,999 | 9 (7.8%) | 76 (17.2%) |
| $150,000 or more | 3 (2.6%) | 60 (13.5%) |
| Total | 115 (100.0%) | 443 (100.0%) |
Property Value to Household Income Ratio in Trainer borough
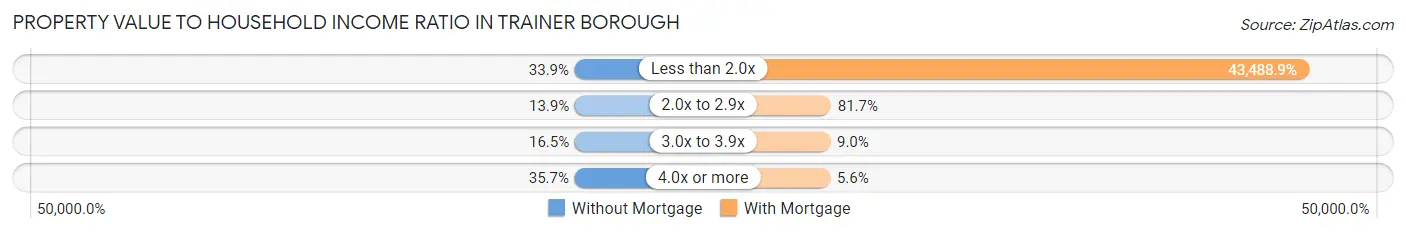
| Value-to-Income Ratio | Without Mortgage | With Mortgage |
| Less than 2.0x | 39 (33.9%) | 192,656 (43,488.9%) |
| 2.0x to 2.9x | 16 (13.9%) | 362 (81.7%) |
| 3.0x to 3.9x | 19 (16.5%) | 40 (9.0%) |
| 4.0x or more | 41 (35.6%) | 25 (5.6%) |
| Total | 115 (100.0%) | 443 (100.0%) |
Real Estate Taxes by Mortgage Status in Trainer borough
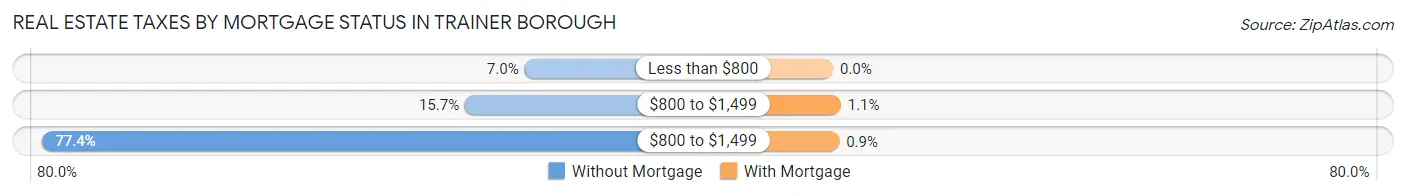
| Property Taxes | Without Mortgage | With Mortgage |
| Less than $800 | 8 (7.0%) | 0 (0.0%) |
| $800 to $1,499 | 18 (15.7%) | 5 (1.1%) |
| $800 to $1,499 | 89 (77.4%) | 4 (0.9%) |
| Total | 115 (100.0%) | 443 (100.0%) |
Health & Disability in Trainer borough
Health Insurance Coverage by Age in Trainer borough
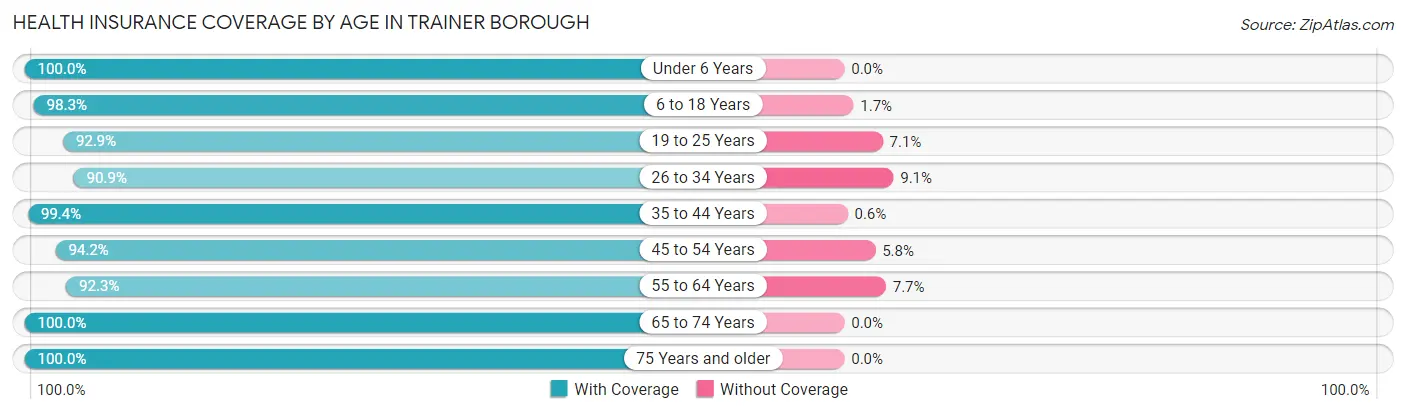
| Age Bracket | With Coverage | Without Coverage |
| Under 6 Years | 98 (100.0%) | 0 (0.0%) |
| 6 to 18 Years | 349 (98.3%) | 6 (1.7%) |
| 19 to 25 Years | 117 (92.9%) | 9 (7.1%) |
| 26 to 34 Years | 159 (90.9%) | 16 (9.1%) |
| 35 to 44 Years | 167 (99.4%) | 1 (0.6%) |
| 45 to 54 Years | 131 (94.2%) | 8 (5.8%) |
| 55 to 64 Years | 155 (92.3%) | 13 (7.7%) |
| 65 to 74 Years | 304 (100.0%) | 0 (0.0%) |
| 75 Years and older | 104 (100.0%) | 0 (0.0%) |
| Total | 1,584 (96.8%) | 53 (3.2%) |
Health Insurance Coverage by Citizenship Status in Trainer borough
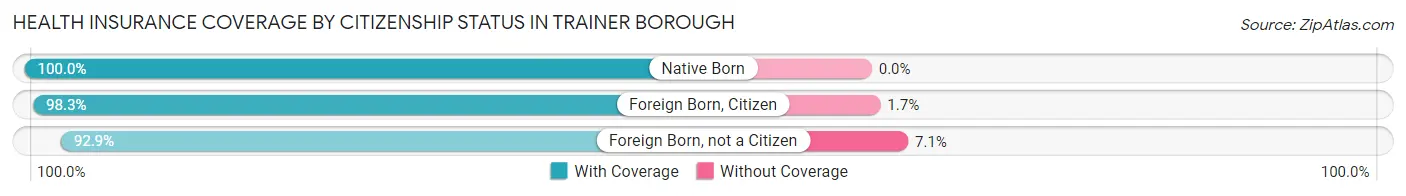
| Citizenship Status | With Coverage | Without Coverage |
| Native Born | 98 (100.0%) | 0 (0.0%) |
| Foreign Born, Citizen | 349 (98.3%) | 6 (1.7%) |
| Foreign Born, not a Citizen | 117 (92.9%) | 9 (7.1%) |
Health Insurance Coverage by Household Income in Trainer borough
| Household Income | With Coverage | Without Coverage |
| Under $25,000 | 157 (100.0%) | 0 (0.0%) |
| $25,000 to $49,999 | 454 (97.2%) | 13 (2.8%) |
| $50,000 to $74,999 | 165 (94.3%) | 10 (5.7%) |
| $75,000 to $99,999 | 279 (93.9%) | 18 (6.1%) |
| $100,000 and over | 529 (97.8%) | 12 (2.2%) |
Public vs Private Health Insurance Coverage by Age in Trainer borough
| Age Bracket | Public Insurance | Private Insurance |
| Under 6 | 56 (57.1%) | 43 (43.9%) |
| 6 to 18 Years | 204 (57.5%) | 148 (41.7%) |
| 19 to 25 Years | 85 (67.5%) | 32 (25.4%) |
| 25 to 34 Years | 41 (23.4%) | 123 (70.3%) |
| 35 to 44 Years | 53 (31.6%) | 114 (67.9%) |
| 45 to 54 Years | 47 (33.8%) | 96 (69.1%) |
| 55 to 64 Years | 39 (23.2%) | 126 (75.0%) |
| 65 to 74 Years | 288 (94.7%) | 273 (89.8%) |
| 75 Years and over | 104 (100.0%) | 52 (50.0%) |
| Total | 917 (56.0%) | 1,007 (61.5%) |
Disability Status by Sex by Age in Trainer borough
| Age Bracket | Male | Female |
| Under 5 Years | 0 (0.0%) | 0 (0.0%) |
| 5 to 17 Years | 21 (16.8%) | 3 (1.4%) |
| 18 to 34 Years | 19 (14.8%) | 38 (18.2%) |
| 35 to 64 Years | 27 (12.1%) | 57 (22.6%) |
| 65 to 74 Years | 17 (6.4%) | 3 (7.7%) |
| 75 Years and over | 12 (42.9%) | 61 (80.3%) |
Disability Class by Sex by Age in Trainer borough
Disability Class: Hearing Difficulty
| Age Bracket | Male | Female |
| Under 5 Years | 0 (0.0%) | 0 (0.0%) |
| 5 to 17 Years | 0 (0.0%) | 0 (0.0%) |
| 18 to 34 Years | 5 (3.9%) | 6 (2.9%) |
| 35 to 64 Years | 0 (0.0%) | 5 (2.0%) |
| 65 to 74 Years | 10 (3.8%) | 0 (0.0%) |
| 75 Years and over | 9 (32.1%) | 20 (26.3%) |
Disability Class: Vision Difficulty
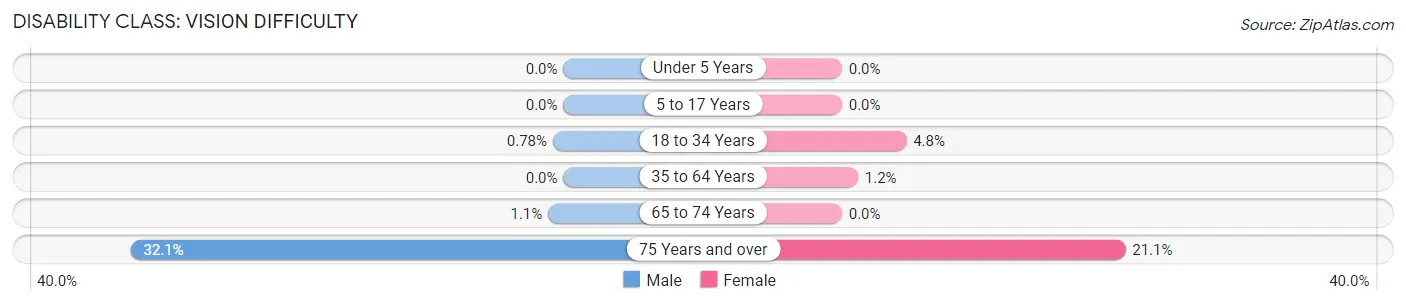
| Age Bracket | Male | Female |
| Under 5 Years | 0 (0.0%) | 0 (0.0%) |
| 5 to 17 Years | 0 (0.0%) | 0 (0.0%) |
| 18 to 34 Years | 1 (0.8%) | 10 (4.8%) |
| 35 to 64 Years | 0 (0.0%) | 3 (1.2%) |
| 65 to 74 Years | 3 (1.1%) | 0 (0.0%) |
| 75 Years and over | 9 (32.1%) | 16 (21.0%) |
Disability Class: Cognitive Difficulty
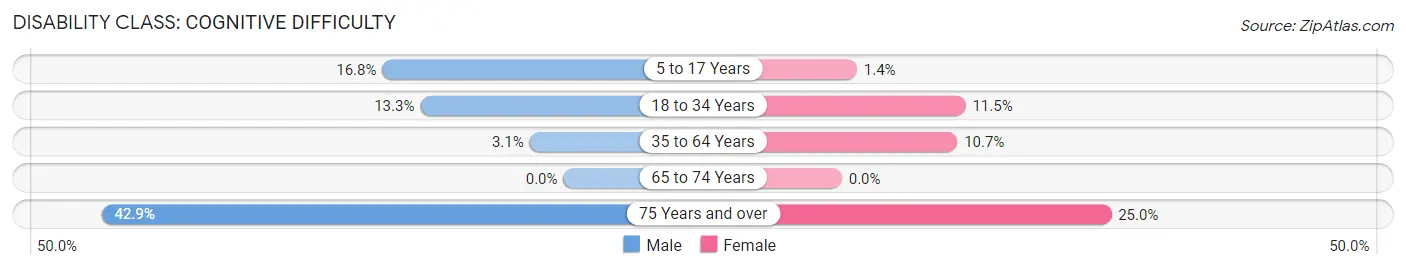
| Age Bracket | Male | Female |
| 5 to 17 Years | 21 (16.8%) | 3 (1.4%) |
| 18 to 34 Years | 17 (13.3%) | 24 (11.5%) |
| 35 to 64 Years | 7 (3.1%) | 27 (10.7%) |
| 65 to 74 Years | 0 (0.0%) | 0 (0.0%) |
| 75 Years and over | 12 (42.9%) | 19 (25.0%) |
Disability Class: Ambulatory Difficulty
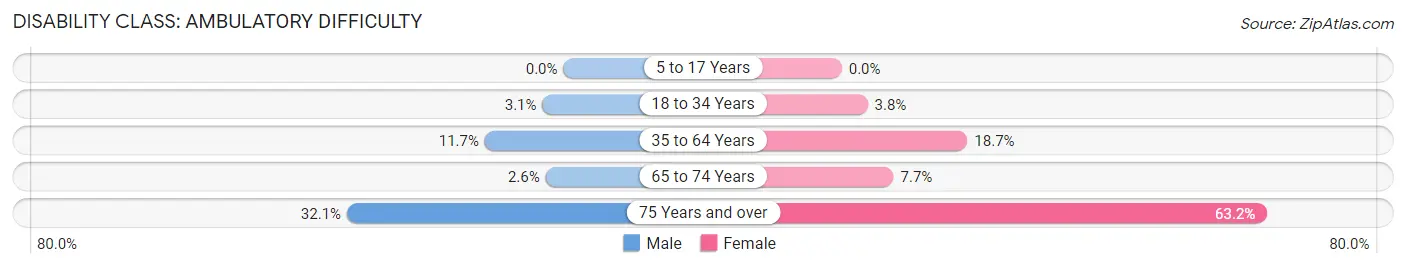
| Age Bracket | Male | Female |
| 5 to 17 Years | 0 (0.0%) | 0 (0.0%) |
| 18 to 34 Years | 4 (3.1%) | 8 (3.8%) |
| 35 to 64 Years | 26 (11.7%) | 47 (18.6%) |
| 65 to 74 Years | 7 (2.6%) | 3 (7.7%) |
| 75 Years and over | 9 (32.1%) | 48 (63.2%) |
Disability Class: Self-Care Difficulty
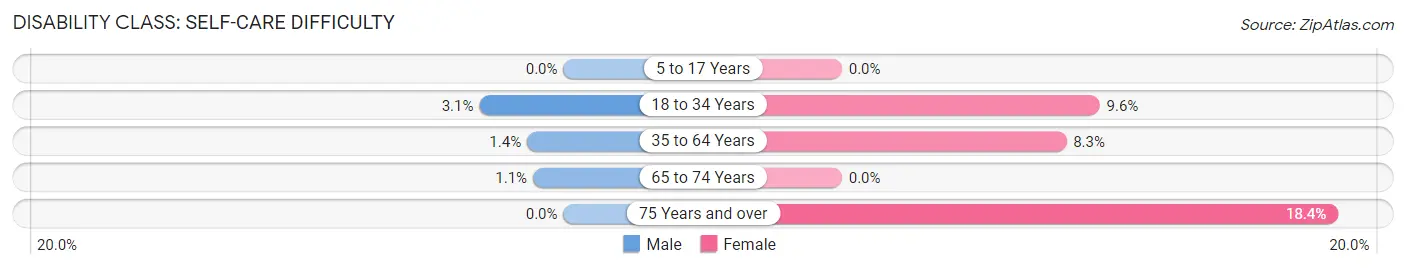
| Age Bracket | Male | Female |
| 5 to 17 Years | 0 (0.0%) | 0 (0.0%) |
| 18 to 34 Years | 4 (3.1%) | 20 (9.6%) |
| 35 to 64 Years | 3 (1.3%) | 21 (8.3%) |
| 65 to 74 Years | 3 (1.1%) | 0 (0.0%) |
| 75 Years and over | 0 (0.0%) | 14 (18.4%) |
Technology Access in Trainer borough
Computing Device Access in Trainer borough
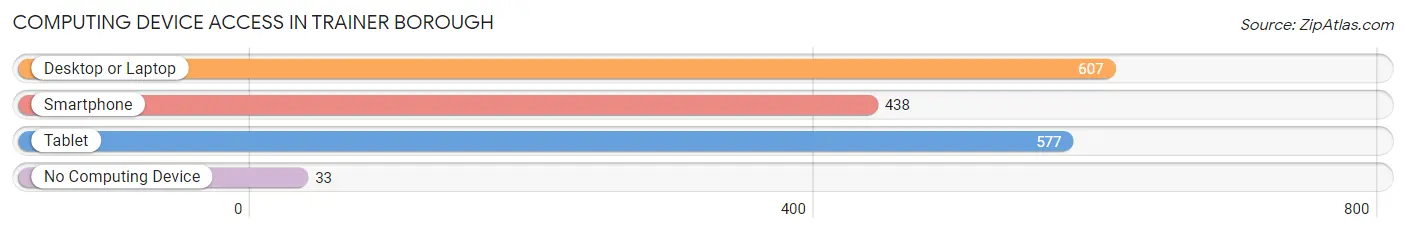
| Device Type | # Households | % Households |
| Desktop or Laptop | 607 | 83.8% |
| Smartphone | 438 | 60.5% |
| Tablet | 577 | 79.7% |
| No Computing Device | 33 | 4.6% |
| Total | 724 | 100.0% |
Internet Access in Trainer borough
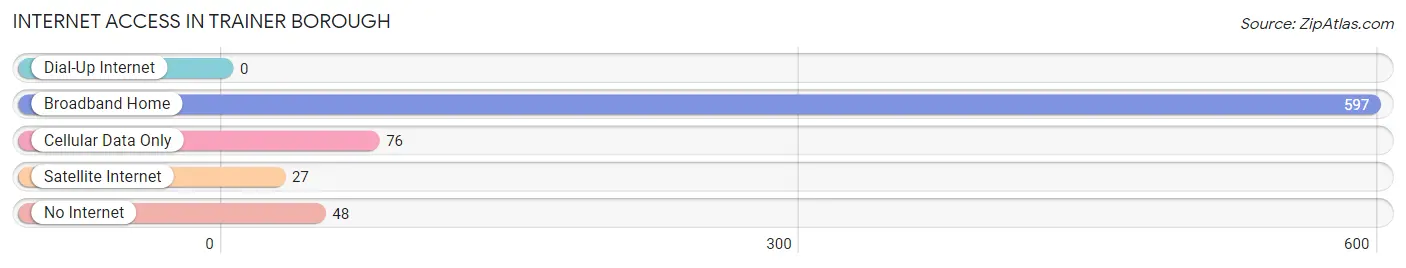
| Internet Type | # Households | % Households |
| Dial-Up Internet | 0 | 0.0% |
| Broadband Home | 597 | 82.5% |
| Cellular Data Only | 76 | 10.5% |
| Satellite Internet | 27 | 3.7% |
| No Internet | 48 | 6.6% |
| Total | 724 | 100.0% |
Trainer borough Summary
Borough of Borough Pennsylvania
The Borough of Borough, Pennsylvania is a small borough located in the southeastern corner of the state. It is situated in the heart of the Susquehanna Valley, and is bordered by the Susquehanna River to the east and the Juniata River to the west. The borough is part of the Harrisburg-Carlisle Metropolitan Statistical Area, and is home to a population of approximately 2,500 people.
History
The Borough of Borough was first settled in 1750 by a group of German immigrants. The town was originally known as “Borough of German”, and was later changed to its current name in 1820. The town was officially incorporated in 1845, and has since grown to become a thriving community.
The borough has a rich history of industry and commerce. In the late 19th century, the borough was home to several factories, including a paper mill, a tannery, and a brickyard. The borough also had a thriving agricultural industry, with many farms producing a variety of crops.
Geography
The Borough of Borough is located in the southeastern corner of Pennsylvania, and is bordered by the Susquehanna River to the east and the Juniata River to the west. The borough is situated in the heart of the Susquehanna Valley, and is surrounded by rolling hills and lush farmland. The borough is located approximately 25 miles from Harrisburg, the state capital, and is within easy driving distance of several major cities, including Philadelphia, Baltimore, and Washington, D.C.
Economy
The Borough of Borough has a diverse economy, with a variety of industries and businesses. The borough is home to several manufacturing companies, including a paper mill, a tannery, and a brickyard. The borough also has a thriving agricultural industry, with many farms producing a variety of crops. In addition, the borough is home to several retail stores, restaurants, and other businesses.
Demographics
As of the 2010 census, the Borough of Borough had a population of 2,500 people. The population is primarily white (90.2%), with a small percentage of African Americans (4.2%), Hispanics (2.2%), and Asians (1.2%). The median household income is $45,000, and the median age is 40. The borough has a low unemployment rate of 4.2%, and a high rate of homeownership (77.2%).
Conclusion
The Borough of Borough is a small borough located in the southeastern corner of Pennsylvania. It is situated in the heart of the Susquehanna Valley, and is bordered by the Susquehanna River to the east and the Juniata River to the west. The borough has a rich history of industry and commerce, and is home to a diverse economy. The population is primarily white, with a median household income of $45,000 and a median age of 40. The borough has a low unemployment rate and a high rate of homeownership.
Common Questions
What is Per Capita Income in Trainer borough?
Per Capita income in Trainer borough is $28,848.
What is the Median Household income in Trainer borough?
Median Household Income in Trainer borough is $83,906.
What is Income or Wage Gap in Trainer borough?
Income or Wage Gap in Trainer borough is 21.5%.
Women in Trainer borough earn 78.5 cents for every dollar earned by a man.
What is Inequality or Gini Index in Trainer borough?
Inequality or Gini Index in Trainer borough is 0.38.
What is the Total Population of Trainer borough?
Total Population of Trainer borough is 1,637.
What is the Total Male Population of Trainer borough?
Total Male Population of Trainer borough is 803.
What is the Total Female Population of Trainer borough?
Total Female Population of Trainer borough is 834.
What is the Ratio of Males per 100 Females in Trainer borough?
There are 96.28 Males per 100 Females in Trainer borough.
What is the Ratio of Females per 100 Males in Trainer borough?
There are 103.86 Females per 100 Males in Trainer borough.
What is the Median Population Age in Trainer borough?
Median Population Age in Trainer borough is 38.4 Years.
What is the Average Family Size in Trainer borough
Average Family Size in Trainer borough is 2.5 People.
What is the Average Household Size in Trainer borough
Average Household Size in Trainer borough is 2.3 People.
How Large is the Labor Force in Trainer borough?
There are 860 People in the Labor Forcein in Trainer borough.
What is the Percentage of People in the Labor Force in Trainer borough?
67.1% of People are in the Labor Force in Trainer borough.
What is the Unemployment Rate in Trainer borough?
Unemployment Rate in Trainer borough is 4.4%.