Zip Codes with the Highest Percentage of Population Employed in Administrative & Support Services in Pennsylvania
RELATED REPORTS & OPTIONS
Administrative & Support Services
Pennsylvania
Compare Zip Codes
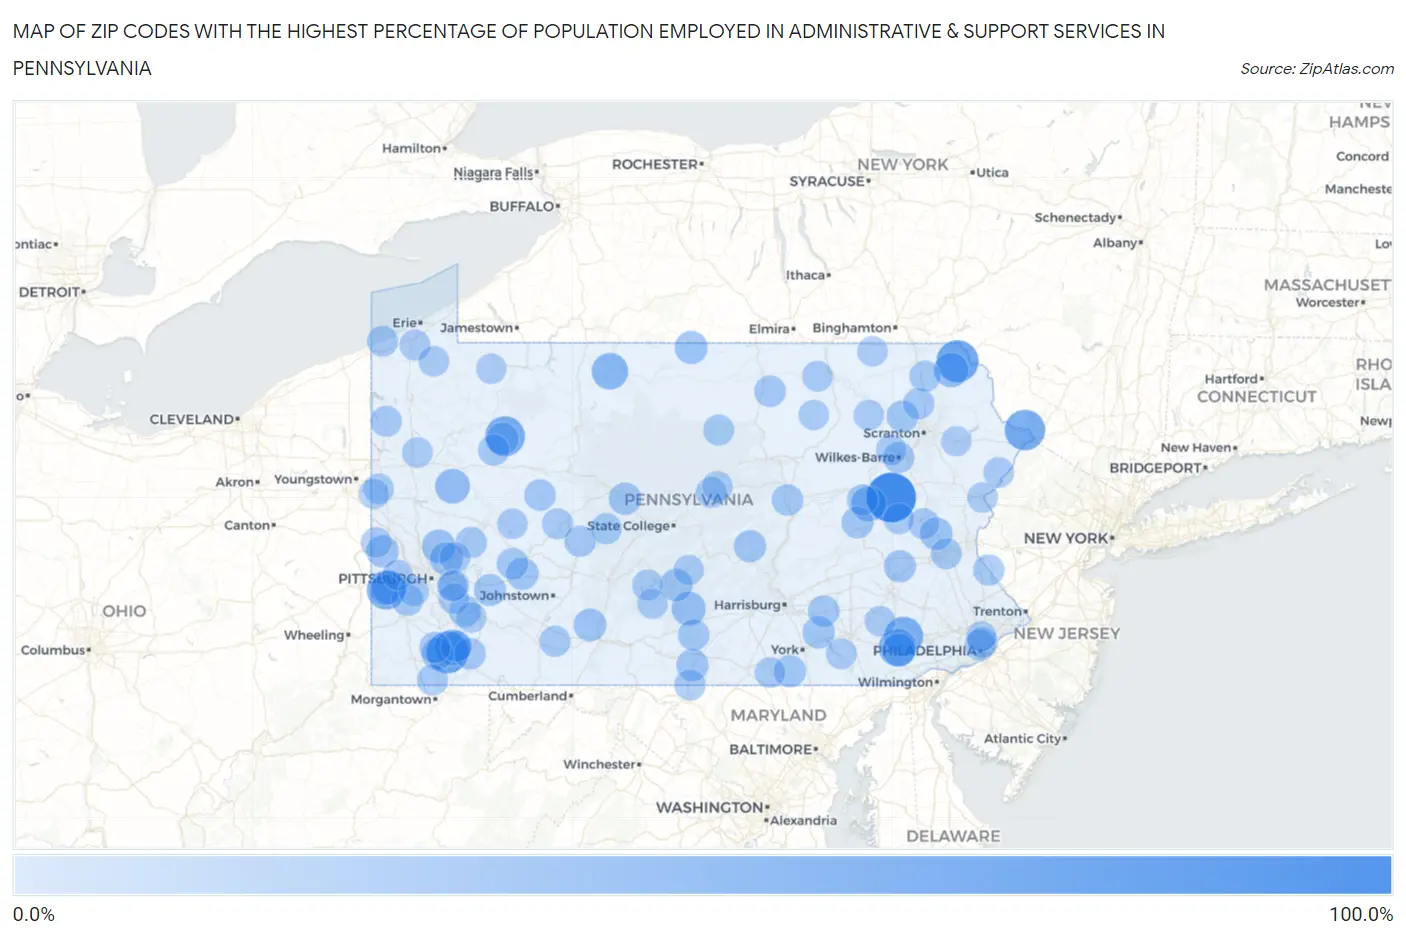
Map of Zip Codes with the Highest Percentage of Population Employed in Administrative & Support Services in Pennsylvania
0.0%
100.0%
Zip Codes with the Highest Percentage of Population Employed in Administrative & Support Services in Pennsylvania
| Zip Code | % Employed | vs State | vs National | |
| 1. | 18223 | 100.0% | 3.6%(+96.4)#1 | 4.1%(+95.9)#7 |
| 2. | 18455 | 63.6% | 3.6%(+60.1)#2 | 4.1%(+59.5)#28 |
| 3. | 15435 | 62.5% | 3.6%(+58.9)#3 | 4.1%(+58.4)#31 |
| 4. | 18340 | 55.6% | 3.6%(+52.0)#4 | 4.1%(+51.4)#38 |
| 5. | 16361 | 52.9% | 3.6%(+49.4)#5 | 4.1%(+48.8)#44 |
| 6. | 15078 | 48.1% | 3.6%(+44.6)#6 | 4.1%(+44.0)#53 |
| 7. | 19316 | 47.9% | 3.6%(+44.3)#7 | 4.1%(+43.7)#57 |
| 8. | 19369 | 42.4% | 3.6%(+38.8)#8 | 4.1%(+38.3)#72 |
| 9. | 16730 | 36.8% | 3.6%(+33.3)#9 | 4.1%(+32.7)#96 |
| 10. | 15422 | 34.2% | 3.6%(+30.6)#10 | 4.1%(+30.0)#114 |
| 11. | 18256 | 30.5% | 3.6%(+26.9)#11 | 4.1%(+26.4)#136 |
| 12. | 16048 | 29.3% | 3.6%(+25.7)#12 | 4.1%(+25.1)#144 |
| 13. | 18454 | 28.6% | 3.6%(+25.0)#13 | 4.1%(+24.4)#153 |
| 14. | 17217 | 25.0% | 3.6%(+21.4)#14 | 4.1%(+20.9)#192 |
| 15. | 15053 | 24.4% | 3.6%(+20.9)#15 | 4.1%(+20.3)#200 |
| 16. | 15007 | 22.9% | 3.6%(+19.3)#16 | 4.1%(+18.8)#218 |
| 17. | 19367 | 22.2% | 3.6%(+18.6)#17 | 4.1%(+18.1)#233 |
| 18. | 15051 | 21.9% | 3.6%(+18.3)#18 | 4.1%(+17.7)#245 |
| 19. | 16937 | 20.6% | 3.6%(+17.0)#19 | 4.1%(+16.4)#273 |
| 20. | 15539 | 19.4% | 3.6%(+15.8)#20 | 4.1%(+15.3)#310 |
| 21. | 17075 | 19.0% | 3.6%(+15.5)#21 | 4.1%(+14.9)#320 |
| 22. | 18086 | 18.7% | 3.6%(+15.1)#22 | 4.1%(+14.6)#331 |
| 23. | 15077 | 17.9% | 3.6%(+14.3)#23 | 4.1%(+13.7)#355 |
| 24. | 16332 | 17.9% | 3.6%(+14.3)#24 | 4.1%(+13.7)#360 |
| 25. | 16876 | 17.8% | 3.6%(+14.2)#25 | 4.1%(+13.6)#361 |
| 26. | 15716 | 17.6% | 3.6%(+14.0)#26 | 4.1%(+13.5)#369 |
| 27. | 17550 | 17.6% | 3.6%(+14.0)#27 | 4.1%(+13.4)#371 |
| 28. | 17235 | 17.2% | 3.6%(+13.6)#28 | 4.1%(+13.0)#390 |
| 29. | 17014 | 17.1% | 3.6%(+13.5)#29 | 4.1%(+12.9)#395 |
| 30. | 19564 | 16.8% | 3.6%(+13.2)#30 | 4.1%(+12.7)#412 |
| 31. | 15624 | 16.2% | 3.6%(+12.6)#31 | 4.1%(+12.0)#454 |
| 32. | 17311 | 16.0% | 3.6%(+12.4)#32 | 4.1%(+11.9)#462 |
| 33. | 17946 | 15.4% | 3.6%(+11.9)#33 | 4.1%(+11.3)#496 |
| 34. | 15447 | 15.2% | 3.6%(+11.6)#34 | 4.1%(+11.0)#516 |
| 35. | 18625 | 15.1% | 3.6%(+11.5)#35 | 4.1%(+10.9)#532 |
| 36. | 17041 | 14.5% | 3.6%(+10.9)#36 | 4.1%(+10.4)#572 |
| 37. | 15350 | 14.4% | 3.6%(+10.8)#37 | 4.1%(+10.2)#585 |
| 38. | 15456 | 14.3% | 3.6%(+10.8)#38 | 4.1%(+10.2)#588 |
| 39. | 15764 | 14.3% | 3.6%(+10.7)#39 | 4.1%(+10.1)#601 |
| 40. | 15752 | 14.3% | 3.6%(+10.7)#40 | 4.1%(+10.1)#608 |
| 41. | 15698 | 14.2% | 3.6%(+10.6)#41 | 4.1%(+10.1)#611 |
| 42. | 17850 | 14.0% | 3.6%(+10.5)#42 | 4.1%(+9.89)#625 |
| 43. | 16939 | 14.0% | 3.6%(+10.4)#43 | 4.1%(+9.89)#626 |
| 44. | 17246 | 14.0% | 3.6%(+10.4)#44 | 4.1%(+9.84)#629 |
| 45. | 16675 | 13.0% | 3.6%(+9.46)#45 | 4.1%(+8.89)#717 |
| 46. | 18420 | 13.0% | 3.6%(+9.38)#46 | 4.1%(+8.81)#726 |
| 47. | 15682 | 12.7% | 3.6%(+9.16)#47 | 4.1%(+8.60)#753 |
| 48. | 18701 | 12.7% | 3.6%(+9.15)#48 | 4.1%(+8.59)#755 |
| 49. | 15480 | 12.5% | 3.6%(+8.89)#49 | 4.1%(+8.33)#785 |
| 50. | 18920 | 12.4% | 3.6%(+8.81)#50 | 4.1%(+8.25)#790 |
| 51. | 16334 | 12.4% | 3.6%(+8.79)#51 | 4.1%(+8.22)#797 |
| 52. | 15433 | 12.2% | 3.6%(+8.65)#52 | 4.1%(+8.08)#818 |
| 53. | 15560 | 12.0% | 3.6%(+8.41)#53 | 4.1%(+7.85)#848 |
| 54. | 16110 | 11.8% | 3.6%(+8.21)#54 | 4.1%(+7.64)#871 |
| 55. | 16616 | 11.8% | 3.6%(+8.18)#55 | 4.1%(+7.61)#876 |
| 56. | 15741 | 11.8% | 3.6%(+8.18)#56 | 4.1%(+7.61)#877 |
| 57. | 18820 | 11.8% | 3.6%(+8.18)#57 | 4.1%(+7.61)#878 |
| 58. | 17263 | 11.7% | 3.6%(+8.13)#58 | 4.1%(+7.57)#885 |
| 59. | 18101 | 11.6% | 3.6%(+7.97)#59 | 4.1%(+7.40)#916 |
| 60. | 16430 | 11.4% | 3.6%(+7.78)#60 | 4.1%(+7.21)#945 |
| 61. | 18246 | 11.3% | 3.6%(+7.69)#61 | 4.1%(+7.13)#964 |
| 62. | 15315 | 11.1% | 3.6%(+7.53)#62 | 4.1%(+6.96)#990 |
| 63. | 17723 | 11.1% | 3.6%(+7.53)#63 | 4.1%(+6.96)#997 |
| 64. | 18030 | 11.1% | 3.6%(+7.49)#64 | 4.1%(+6.92)#1,007 |
| 65. | 16426 | 10.8% | 3.6%(+7.20)#65 | 4.1%(+6.63)#1,071 |
| 66. | 16647 | 10.7% | 3.6%(+7.07)#66 | 4.1%(+6.51)#1,108 |
| 67. | 16848 | 10.6% | 3.6%(+7.03)#67 | 4.1%(+6.47)#1,117 |
| 68. | 19132 | 10.3% | 3.6%(+6.74)#68 | 4.1%(+6.18)#1,190 |
| 69. | 15059 | 10.3% | 3.6%(+6.74)#69 | 4.1%(+6.18)#1,191 |
| 70. | 18232 | 10.2% | 3.6%(+6.61)#70 | 4.1%(+6.04)#1,229 |
| 71. | 18814 | 10.1% | 3.6%(+6.56)#71 | 4.1%(+6.00)#1,239 |
| 72. | 17344 | 10.1% | 3.6%(+6.53)#72 | 4.1%(+5.97)#1,249 |
| 73. | 17581 | 10.1% | 3.6%(+6.53)#73 | 4.1%(+5.96)#1,258 |
| 74. | 17516 | 9.8% | 3.6%(+6.26)#74 | 4.1%(+5.69)#1,343 |
| 75. | 15054 | 9.8% | 3.6%(+6.24)#75 | 4.1%(+5.67)#1,357 |
| 76. | 15030 | 9.8% | 3.6%(+6.18)#76 | 4.1%(+5.62)#1,369 |
| 77. | 18324 | 9.8% | 3.6%(+6.18)#77 | 4.1%(+5.61)#1,371 |
| 78. | 16427 | 9.7% | 3.6%(+6.09)#78 | 4.1%(+5.53)#1,405 |
| 79. | 19140 | 9.7% | 3.6%(+6.08)#79 | 4.1%(+5.52)#1,410 |
| 80. | 15148 | 9.6% | 3.6%(+6.04)#80 | 4.1%(+5.48)#1,424 |
| 81. | 15028 | 9.5% | 3.6%(+5.87)#81 | 4.1%(+5.31)#1,488 |
| 82. | 16133 | 9.4% | 3.6%(+5.77)#82 | 4.1%(+5.20)#1,528 |
| 83. | 18708 | 9.3% | 3.6%(+5.75)#83 | 4.1%(+5.19)#1,534 |
| 84. | 16244 | 9.3% | 3.6%(+5.70)#84 | 4.1%(+5.14)#1,553 |
| 85. | 16116 | 9.3% | 3.6%(+5.68)#85 | 4.1%(+5.12)#1,562 |
| 86. | 15126 | 9.2% | 3.6%(+5.64)#86 | 4.1%(+5.08)#1,577 |
| 87. | 16416 | 9.1% | 3.6%(+5.51)#87 | 4.1%(+4.94)#1,647 |
| 88. | 15035 | 9.0% | 3.6%(+5.41)#88 | 4.1%(+4.85)#1,688 |
| 89. | 15679 | 8.9% | 3.6%(+5.34)#89 | 4.1%(+4.78)#1,727 |
| 90. | 18629 | 8.9% | 3.6%(+5.34)#90 | 4.1%(+4.77)#1,731 |
| 91. | 18830 | 8.9% | 3.6%(+5.31)#91 | 4.1%(+4.75)#1,742 |
| 92. | 16132 | 8.7% | 3.6%(+5.11)#92 | 4.1%(+4.55)#1,845 |
| 93. | 15064 | 8.7% | 3.6%(+5.11)#93 | 4.1%(+4.55)#1,848 |
| 94. | 18327 | 8.7% | 3.6%(+5.09)#94 | 4.1%(+4.52)#1,865 |
| 95. | 17750 | 8.6% | 3.6%(+5.04)#95 | 4.1%(+4.47)#1,901 |
| 96. | 18616 | 8.6% | 3.6%(+5.02)#96 | 4.1%(+4.46)#1,905 |
| 97. | 19138 | 8.5% | 3.6%(+4.87)#97 | 4.1%(+4.30)#1,991 |
| 98. | 17054 | 8.3% | 3.6%(+4.75)#98 | 4.1%(+4.18)#2,064 |
| 99. | 16623 | 8.3% | 3.6%(+4.71)#99 | 4.1%(+4.14)#2,090 |
| 100. | 18463 | 8.3% | 3.6%(+4.69)#100 | 4.1%(+4.12)#2,105 |
Common Questions
What are the Top 10 Zip Codes with the Highest Percentage of Population Employed in Administrative & Support Services in Pennsylvania?
Top 10 Zip Codes with the Highest Percentage of Population Employed in Administrative & Support Services in Pennsylvania are:
What zip code has the Highest Percentage of Population Employed in Administrative & Support Services in Pennsylvania?
18223 has the Highest Percentage of Population Employed in Administrative & Support Services in Pennsylvania with 100.0%.
What is the Percentage of Population Employed in Administrative & Support Services in the State of Pennsylvania?
Percentage of Population Employed in Administrative & Support Services in Pennsylvania is 3.6%.
What is the Percentage of Population Employed in Administrative & Support Services in the United States?
Percentage of Population Employed in Administrative & Support Services in the United States is 4.1%.