Mammoth, PA Map & Demographics
Mammoth Map
Mammoth Overview
$45,126
PER CAPITA INCOME
$49,716
AVG FAMILY INCOME
$49,545
AVG HOUSEHOLD INCOME
34.0%
WAGE / INCOME GAP [ % ]
66.0¢/ $1
WAGE / INCOME GAP [ $ ]
0.50
INEQUALITY / GINI INDEX
391
TOTAL POPULATION
167
MALE POPULATION
224
FEMALE POPULATION
74.55
MALES / 100 FEMALES
134.13
FEMALES / 100 MALES
57.8
MEDIAN AGE
2.5
AVG FAMILY SIZE
1.8
AVG HOUSEHOLD SIZE
201
LABOR FORCE [ PEOPLE ]
54.0%
PERCENT IN LABOR FORCE
Mammoth Area Codes
Income in Mammoth
Income Overview in Mammoth
Per Capita Income in Mammoth is $45,126, while median incomes of families and households are $49,716 and $49,545 respectively.
| Characteristic | Number | Measure |
| Per Capita Income | 391 | $45,126 |
| Median Family Income | 105 | $49,716 |
| Mean Family Income | 105 | $68,029 |
| Median Household Income | 212 | $49,545 |
| Mean Household Income | 212 | $81,063 |
| Income Deficit | 105 | $0 |
| Wage / Income Gap (%) | 391 | 34.02% |
| Wage / Income Gap ($) | 391 | 65.98¢ per $1 |
| Gini / Inequality Index | 391 | 0.50 |
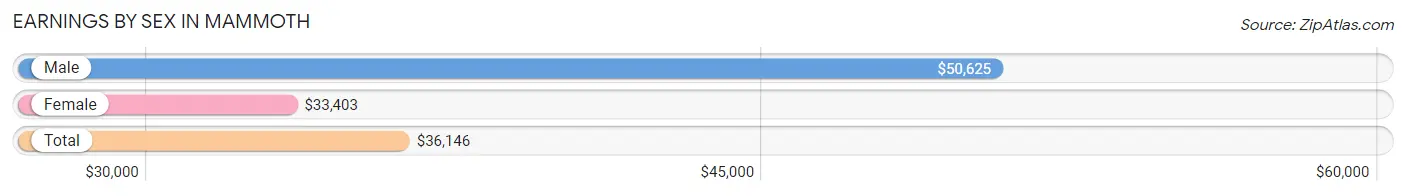
Earnings by Sex in Mammoth
Average Earnings in Mammoth are $36,146, $50,625 for men and $33,403 for women, a difference of 34.0%.
| Sex | Number | Average Earnings |
| Male | 80 (39.8%) | $50,625 |
| Female | 121 (60.2%) | $33,403 |
| Total | 201 (100.0%) | $36,146 |
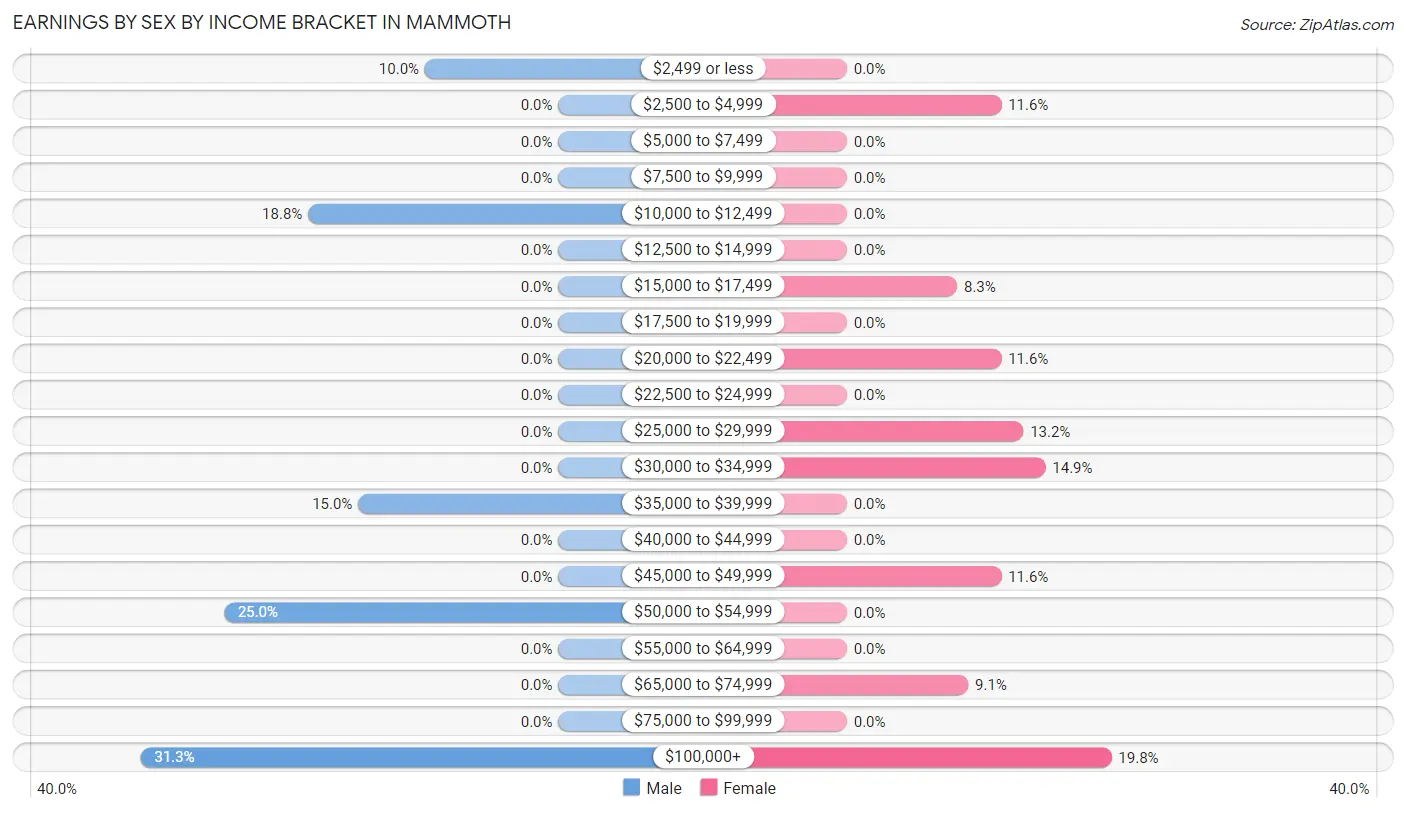
Earnings by Sex by Income Bracket in Mammoth
The most common earnings brackets in Mammoth are $100,000+ for men (25 | 31.2%) and $100,000+ for women (24 | 19.8%).
| Income | Male | Female |
| $2,499 or less | 8 (10.0%) | 0 (0.0%) |
| $2,500 to $4,999 | 0 (0.0%) | 14 (11.6%) |
| $5,000 to $7,499 | 0 (0.0%) | 0 (0.0%) |
| $7,500 to $9,999 | 0 (0.0%) | 0 (0.0%) |
| $10,000 to $12,499 | 15 (18.8%) | 0 (0.0%) |
| $12,500 to $14,999 | 0 (0.0%) | 0 (0.0%) |
| $15,000 to $17,499 | 0 (0.0%) | 10 (8.3%) |
| $17,500 to $19,999 | 0 (0.0%) | 0 (0.0%) |
| $20,000 to $22,499 | 0 (0.0%) | 14 (11.6%) |
| $22,500 to $24,999 | 0 (0.0%) | 0 (0.0%) |
| $25,000 to $29,999 | 0 (0.0%) | 16 (13.2%) |
| $30,000 to $34,999 | 0 (0.0%) | 18 (14.9%) |
| $35,000 to $39,999 | 12 (15.0%) | 0 (0.0%) |
| $40,000 to $44,999 | 0 (0.0%) | 0 (0.0%) |
| $45,000 to $49,999 | 0 (0.0%) | 14 (11.6%) |
| $50,000 to $54,999 | 20 (25.0%) | 0 (0.0%) |
| $55,000 to $64,999 | 0 (0.0%) | 0 (0.0%) |
| $65,000 to $74,999 | 0 (0.0%) | 11 (9.1%) |
| $75,000 to $99,999 | 0 (0.0%) | 0 (0.0%) |
| $100,000+ | 25 (31.2%) | 24 (19.8%) |
| Total | 80 (100.0%) | 121 (100.0%) |
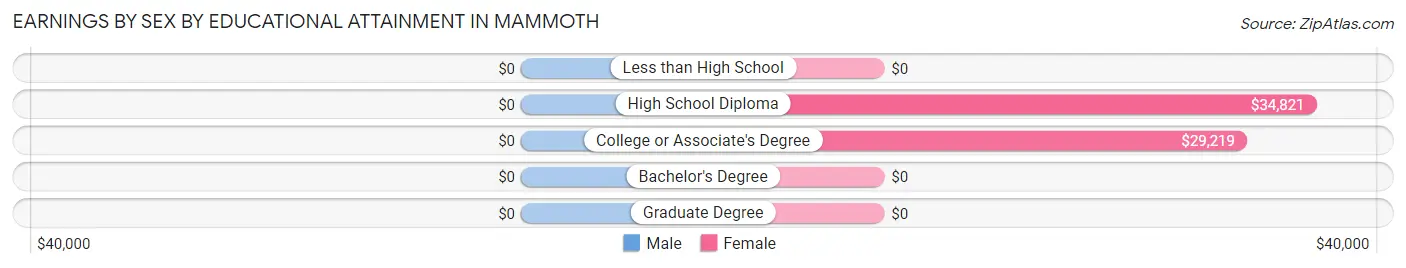
Earnings by Sex by Educational Attainment in Mammoth
| Educational Attainment | Male Income | Female Income |
| Less than High School | - | - |
| High School Diploma | - | - |
| College or Associate's Degree | - | - |
| Bachelor's Degree | - | - |
| Graduate Degree | - | - |
| Total | - | - |
Family Income in Mammoth
Family Income Brackets in Mammoth
According to the Mammoth family income data, there are 34 families falling into the $35,000 to $49,999 income range, which is the most common income bracket and makes up 32.4% of all families.
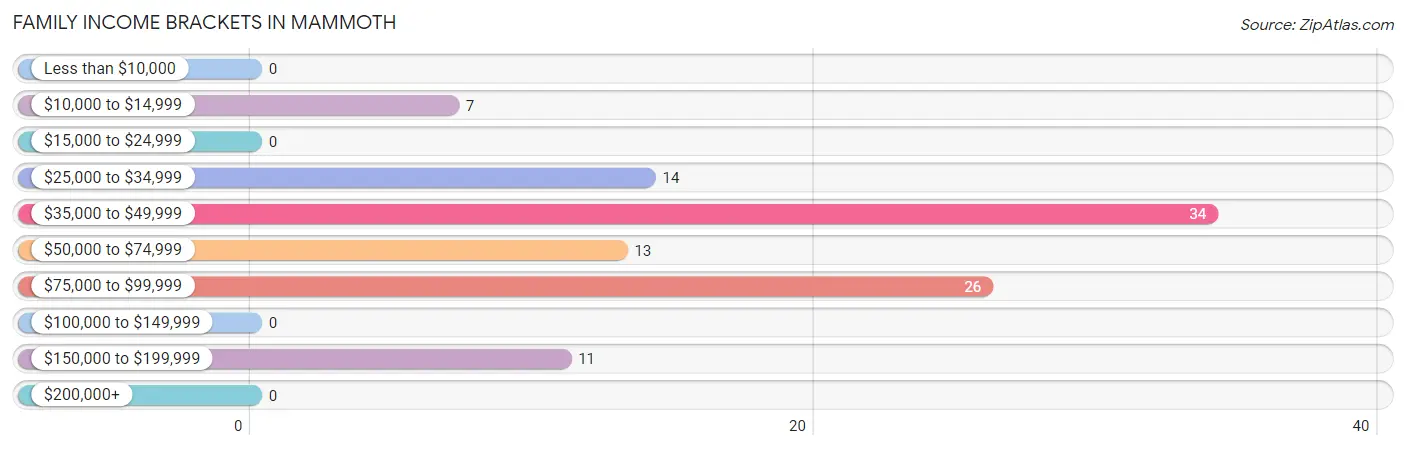
| Income Bracket | # Families | % Families |
| Less than $10,000 | 0 | 0.0% |
| $10,000 to $14,999 | 7 | 6.7% |
| $15,000 to $24,999 | 0 | 0.0% |
| $25,000 to $34,999 | 14 | 13.3% |
| $35,000 to $49,999 | 34 | 32.4% |
| $50,000 to $74,999 | 13 | 12.4% |
| $75,000 to $99,999 | 26 | 24.8% |
| $100,000 to $149,999 | 0 | 0.0% |
| $150,000 to $199,999 | 11 | 10.5% |
| $200,000+ | 0 | 0.0% |
Family Income by Famaliy Size in Mammoth
2-person families (89 | 84.8%) account for the highest median family income in Mammoth with $49,375 per family, while 2-person families (89 | 84.8%) have the highest median income of $24,688 per family member.
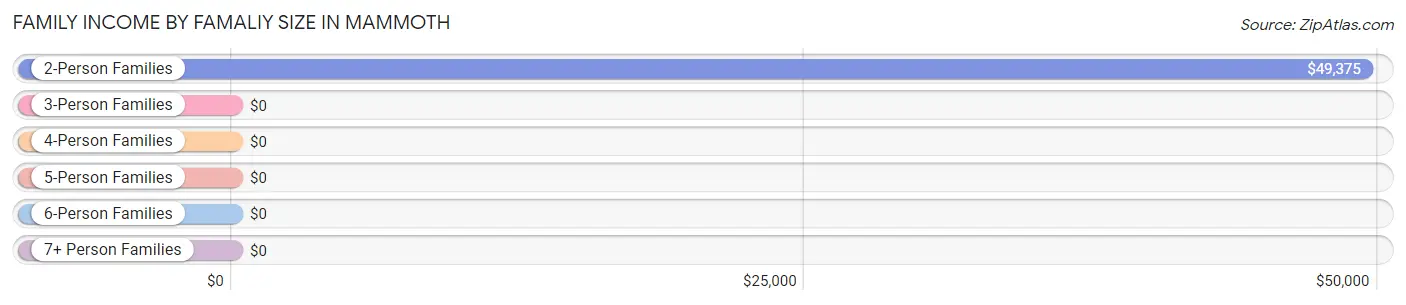
| Income Bracket | # Families | Median Income |
| 2-Person Families | 89 (84.8%) | $49,375 |
| 3-Person Families | 0 (0.0%) | $0 |
| 4-Person Families | 16 (15.2%) | $0 |
| 5-Person Families | 0 (0.0%) | $0 |
| 6-Person Families | 0 (0.0%) | $0 |
| 7+ Person Families | 0 (0.0%) | $0 |
| Total | 105 (100.0%) | $49,716 |
Family Income by Number of Earners in Mammoth
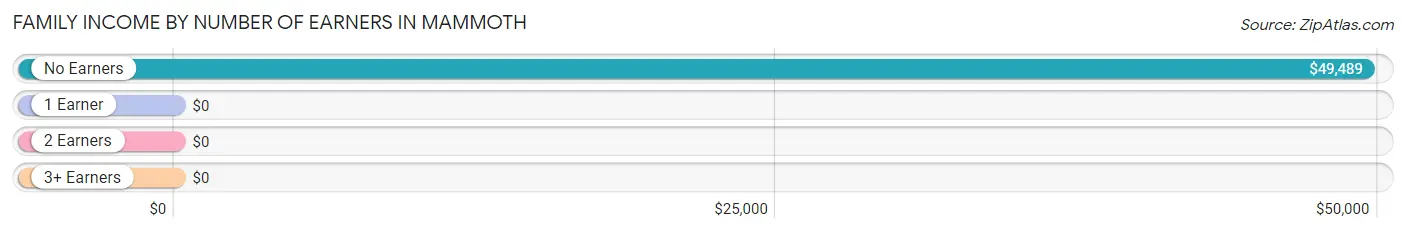
| Number of Earners | # Families | Median Income |
| No Earners | 49 (46.7%) | $49,489 |
| 1 Earner | 27 (25.7%) | $0 |
| 2 Earners | 18 (17.1%) | $0 |
| 3+ Earners | 11 (10.5%) | $0 |
| Total | 105 (100.0%) | $49,716 |
Household Income in Mammoth
Household Income Brackets in Mammoth
With 43 households falling in the category, the $35,000 to $49,999 income range is the most frequent in Mammoth, accounting for 20.3% of all households.
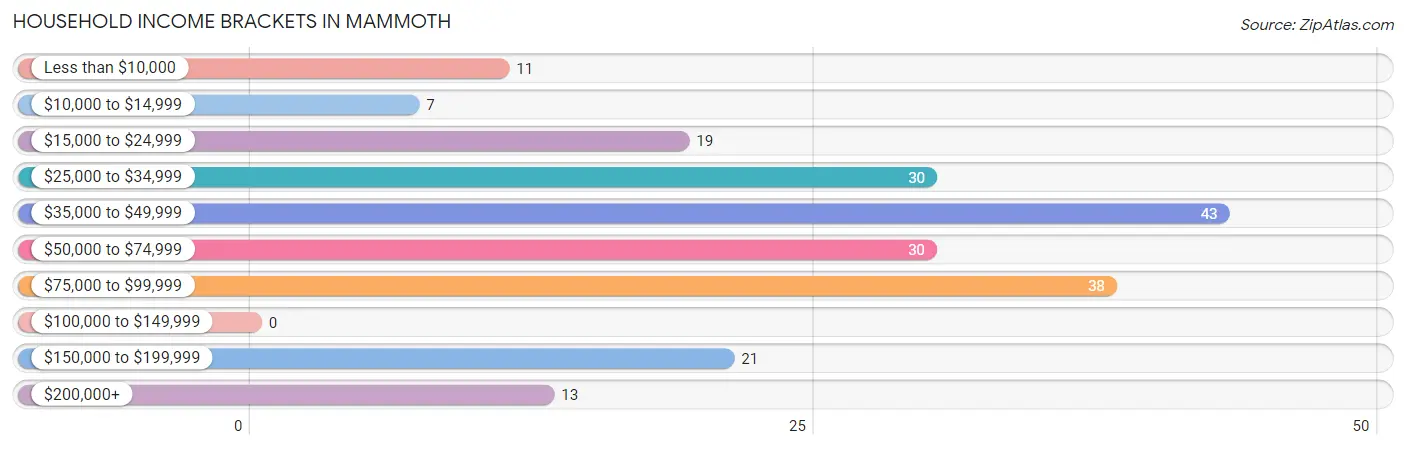
| Income Bracket | # Households | % Households |
| Less than $10,000 | 11 | 5.2% |
| $10,000 to $14,999 | 7 | 3.3% |
| $15,000 to $24,999 | 19 | 9.0% |
| $25,000 to $34,999 | 30 | 14.2% |
| $35,000 to $49,999 | 43 | 20.3% |
| $50,000 to $74,999 | 30 | 14.2% |
| $75,000 to $99,999 | 38 | 17.9% |
| $100,000 to $149,999 | 0 | 0.0% |
| $150,000 to $199,999 | 21 | 9.9% |
| $200,000+ | 13 | 6.1% |
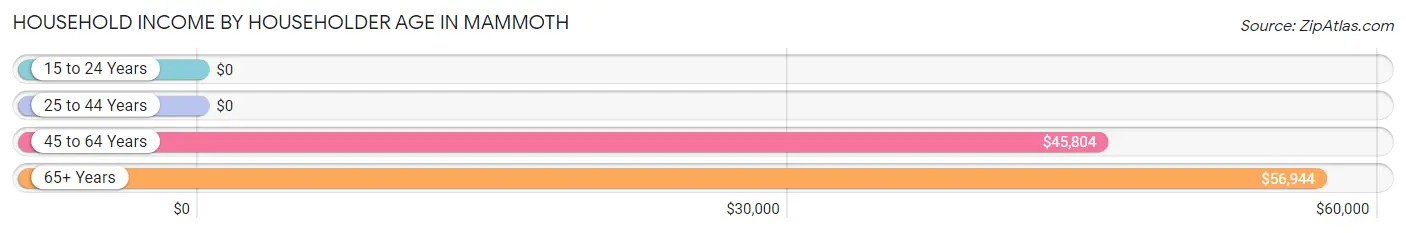
Household Income by Householder Age in Mammoth
The median household income in Mammoth is $49,545, with the highest median household income of $56,944 found in the 65+ years age bracket for the primary householder. A total of 104 households (49.1%) fall into this category.
| Income Bracket | # Households | Median Income |
| 15 to 24 Years | 0 (0.0%) | $0 |
| 25 to 44 Years | 29 (13.7%) | $0 |
| 45 to 64 Years | 79 (37.3%) | $45,804 |
| 65+ Years | 104 (49.1%) | $56,944 |
| Total | 212 (100.0%) | $49,545 |
Poverty in Mammoth
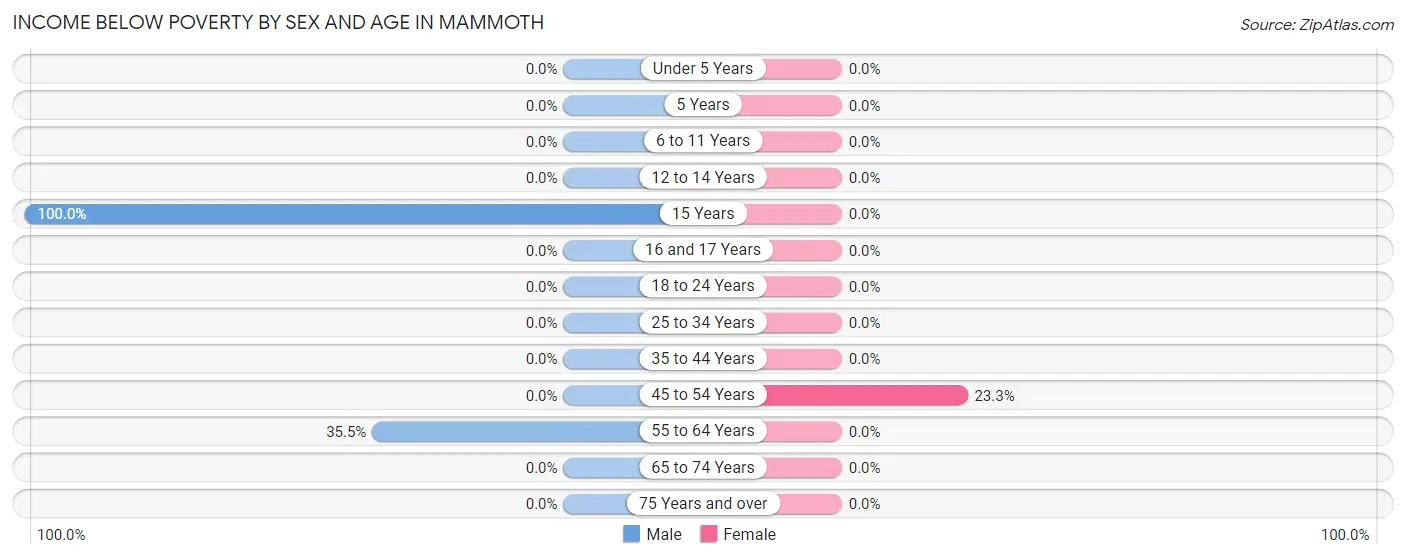
Income Below Poverty by Sex and Age in Mammoth
With 10.8% poverty level for males and 3.1% for females among the residents of Mammoth, 15 year old males and 45 to 54 year old females are the most vulnerable to poverty, with 7 males (100.0%) and 7 females (23.3%) in their respective age groups living below the poverty level.
| Age Bracket | Male | Female |
| Under 5 Years | 0 (0.0%) | 0 (0.0%) |
| 5 Years | 0 (0.0%) | 0 (0.0%) |
| 6 to 11 Years | 0 (0.0%) | 0 (0.0%) |
| 12 to 14 Years | 0 (0.0%) | 0 (0.0%) |
| 15 Years | 7 (100.0%) | 0 (0.0%) |
| 16 and 17 Years | 0 (0.0%) | 0 (0.0%) |
| 18 to 24 Years | 0 (0.0%) | 0 (0.0%) |
| 25 to 34 Years | 0 (0.0%) | 0 (0.0%) |
| 35 to 44 Years | 0 (0.0%) | 0 (0.0%) |
| 45 to 54 Years | 0 (0.0%) | 7 (23.3%) |
| 55 to 64 Years | 11 (35.5%) | 0 (0.0%) |
| 65 to 74 Years | 0 (0.0%) | 0 (0.0%) |
| 75 Years and over | 0 (0.0%) | 0 (0.0%) |
| Total | 18 (10.8%) | 7 (3.1%) |
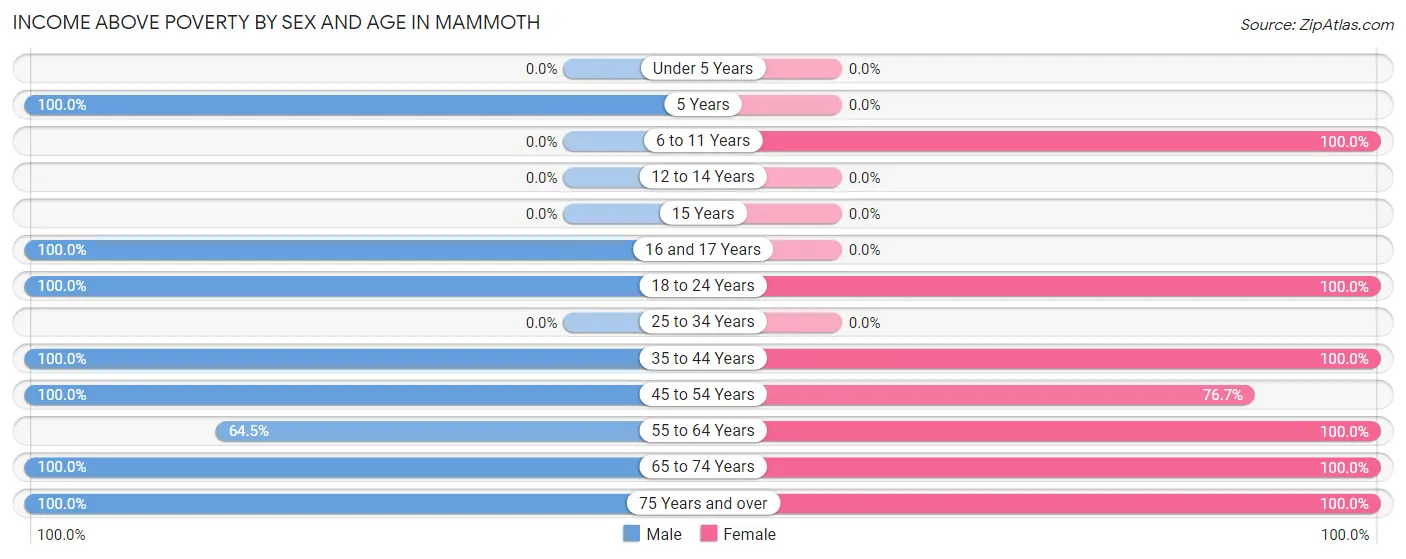
Income Above Poverty by Sex and Age in Mammoth
According to the poverty statistics in Mammoth, males aged 5 years and females aged 6 to 11 years are the age groups that are most secure financially, with 100.0% of males and 100.0% of females in these age groups living above the poverty line.
| Age Bracket | Male | Female |
| Under 5 Years | 0 (0.0%) | 0 (0.0%) |
| 5 Years | 6 (100.0%) | 0 (0.0%) |
| 6 to 11 Years | 0 (0.0%) | 6 (100.0%) |
| 12 to 14 Years | 0 (0.0%) | 0 (0.0%) |
| 15 Years | 0 (0.0%) | 0 (0.0%) |
| 16 and 17 Years | 14 (100.0%) | 0 (0.0%) |
| 18 to 24 Years | 15 (100.0%) | 14 (100.0%) |
| 25 to 34 Years | 0 (0.0%) | 0 (0.0%) |
| 35 to 44 Years | 13 (100.0%) | 29 (100.0%) |
| 45 to 54 Years | 24 (100.0%) | 23 (76.7%) |
| 55 to 64 Years | 20 (64.5%) | 30 (100.0%) |
| 65 to 74 Years | 34 (100.0%) | 76 (100.0%) |
| 75 Years and over | 23 (100.0%) | 39 (100.0%) |
| Total | 149 (89.2%) | 217 (96.9%) |
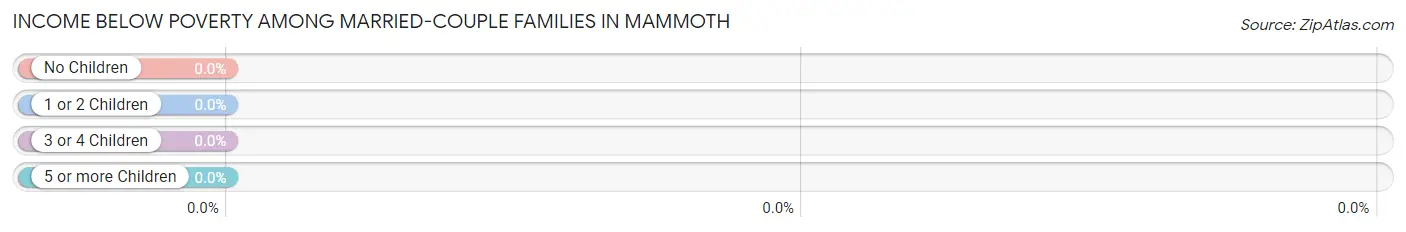
Income Below Poverty Among Married-Couple Families in Mammoth
| Children | Above Poverty | Below Poverty |
| No Children | 78 (100.0%) | 0 (0.0%) |
| 1 or 2 Children | 0 (0.0%) | 0 (0.0%) |
| 3 or 4 Children | 0 (0.0%) | 0 (0.0%) |
| 5 or more Children | 0 (0.0%) | 0 (0.0%) |
| Total | 78 (100.0%) | 0 (0.0%) |
Income Below Poverty Among Single-Parent Households in Mammoth
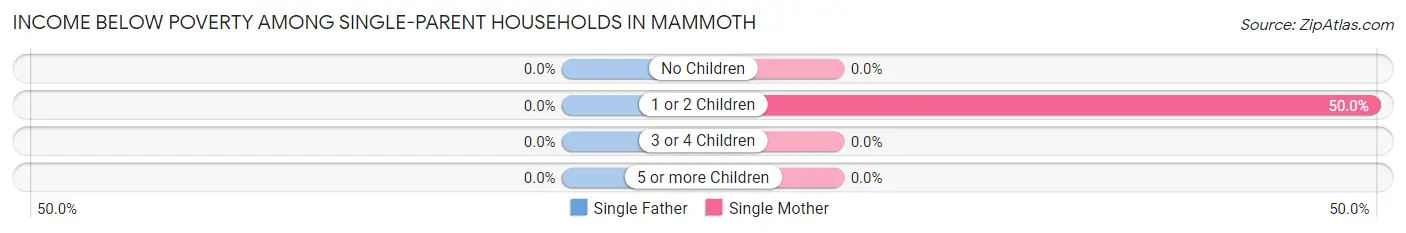
| Children | Single Father | Single Mother |
| No Children | 0 (0.0%) | 0 (0.0%) |
| 1 or 2 Children | 0 (0.0%) | 7 (50.0%) |
| 3 or 4 Children | 0 (0.0%) | 0 (0.0%) |
| 5 or more Children | 0 (0.0%) | 0 (0.0%) |
| Total | 0 (0.0%) | 7 (25.9%) |
Income Below Poverty Among Married-Couple vs Single-Parent Households in Mammoth
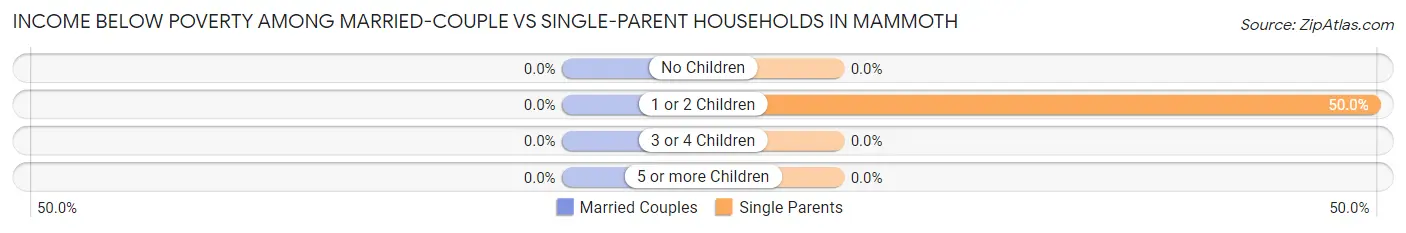
| Children | Married-Couple Families | Single-Parent Households |
| No Children | 0 (0.0%) | 0 (0.0%) |
| 1 or 2 Children | 0 (0.0%) | 7 (50.0%) |
| 3 or 4 Children | 0 (0.0%) | 0 (0.0%) |
| 5 or more Children | 0 (0.0%) | 0 (0.0%) |
| Total | 0 (0.0%) | 7 (25.9%) |
Race in Mammoth
The most populous races in Mammoth are , and White / Caucasian (391 | 100.0%).
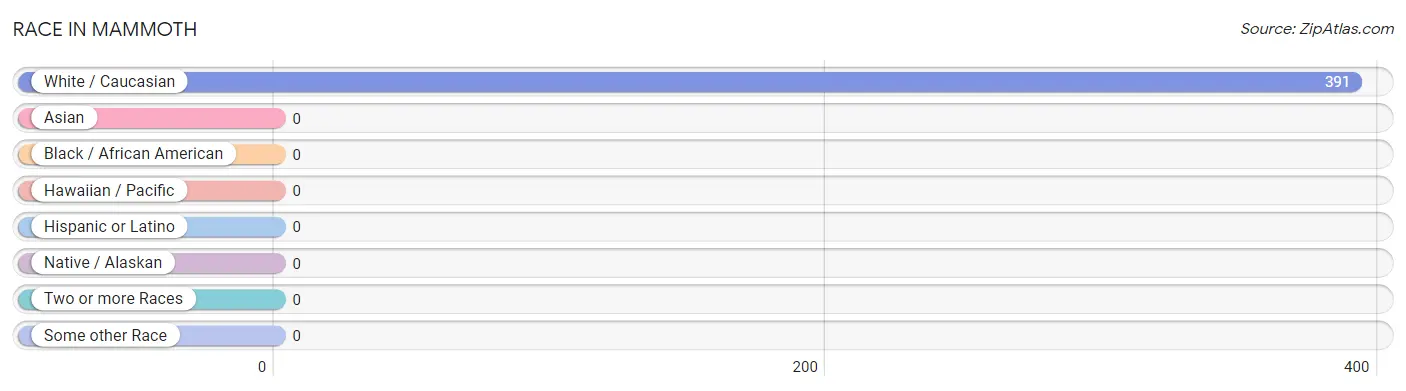
| Race | # Population | % Population |
| Asian | 0 | 0.0% |
| Black / African American | 0 | 0.0% |
| Hawaiian / Pacific | 0 | 0.0% |
| Hispanic or Latino | 0 | 0.0% |
| Native / Alaskan | 0 | 0.0% |
| White / Caucasian | 391 | 100.0% |
| Two or more Races | 0 | 0.0% |
| Some other Race | 0 | 0.0% |
| Total | 391 | 100.0% |
Ancestry in Mammoth
The most populous ancestries reported in Mammoth are German (166 | 42.5%), Irish (118 | 30.2%), Slovak (54 | 13.8%), Italian (46 | 11.8%), and English (35 | 8.9%), together accounting for 107.2% of all Mammoth residents.
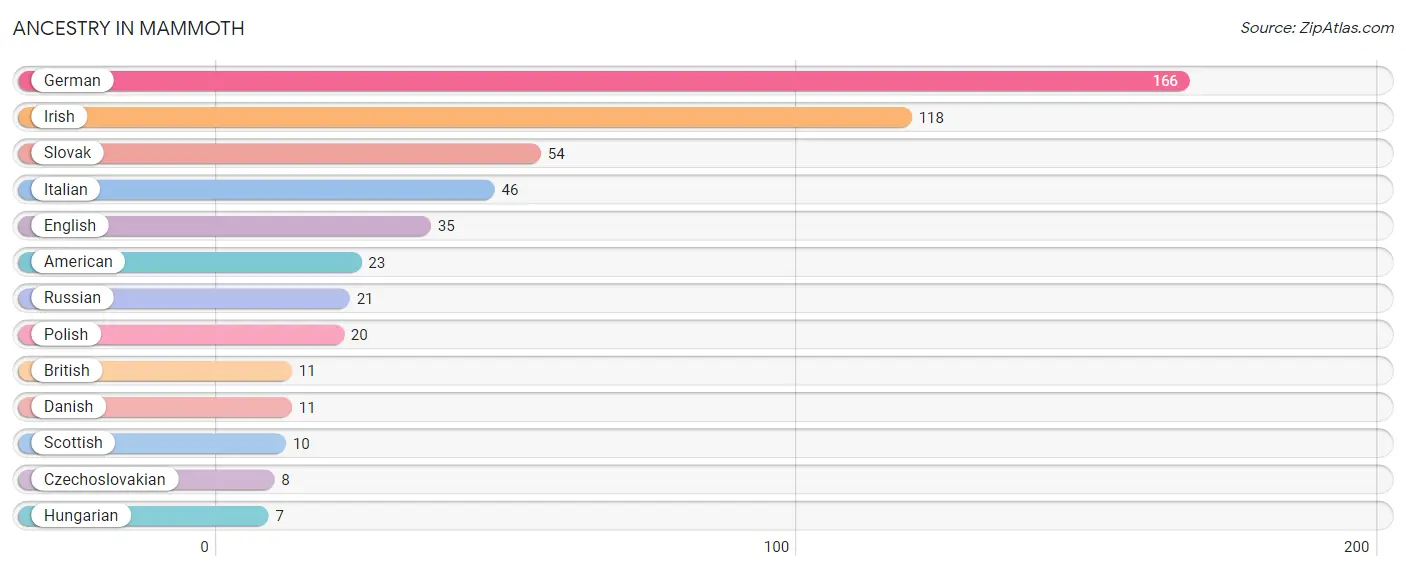
| Ancestry | # Population | % Population |
| American | 23 | 5.9% |
| British | 11 | 2.8% |
| Czechoslovakian | 8 | 2.1% |
| Danish | 11 | 2.8% |
| English | 35 | 8.9% |
| German | 166 | 42.5% |
| Hungarian | 7 | 1.8% |
| Irish | 118 | 30.2% |
| Italian | 46 | 11.8% |
| Polish | 20 | 5.1% |
| Russian | 21 | 5.4% |
| Scottish | 10 | 2.6% |
| Slovak | 54 | 13.8% | View All 13 Rows |
Immigrants in Mammoth

| Immigration Origin | # Population | % Population | View All 0 Rows |
Sex and Age in Mammoth
Sex and Age in Mammoth
The most populous age groups in Mammoth are 85 Years and over (23 | 13.8%) for men and 65 to 69 Years (42 | 18.8%) for women.
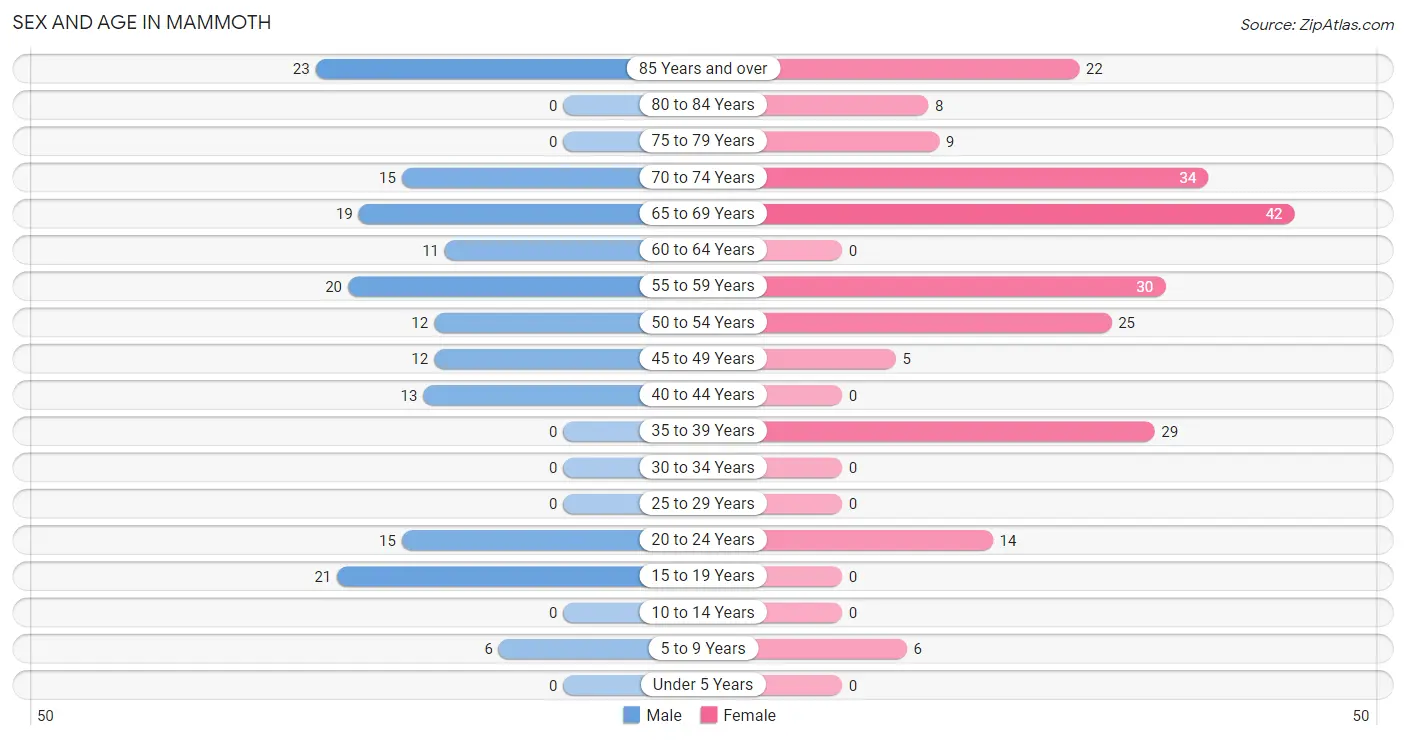
| Age Bracket | Male | Female |
| Under 5 Years | 0 (0.0%) | 0 (0.0%) |
| 5 to 9 Years | 6 (3.6%) | 6 (2.7%) |
| 10 to 14 Years | 0 (0.0%) | 0 (0.0%) |
| 15 to 19 Years | 21 (12.6%) | 0 (0.0%) |
| 20 to 24 Years | 15 (9.0%) | 14 (6.2%) |
| 25 to 29 Years | 0 (0.0%) | 0 (0.0%) |
| 30 to 34 Years | 0 (0.0%) | 0 (0.0%) |
| 35 to 39 Years | 0 (0.0%) | 29 (13.0%) |
| 40 to 44 Years | 13 (7.8%) | 0 (0.0%) |
| 45 to 49 Years | 12 (7.2%) | 5 (2.2%) |
| 50 to 54 Years | 12 (7.2%) | 25 (11.2%) |
| 55 to 59 Years | 20 (12.0%) | 30 (13.4%) |
| 60 to 64 Years | 11 (6.6%) | 0 (0.0%) |
| 65 to 69 Years | 19 (11.4%) | 42 (18.8%) |
| 70 to 74 Years | 15 (9.0%) | 34 (15.2%) |
| 75 to 79 Years | 0 (0.0%) | 9 (4.0%) |
| 80 to 84 Years | 0 (0.0%) | 8 (3.6%) |
| 85 Years and over | 23 (13.8%) | 22 (9.8%) |
| Total | 167 (100.0%) | 224 (100.0%) |
Families and Households in Mammoth
Median Family Size in Mammoth
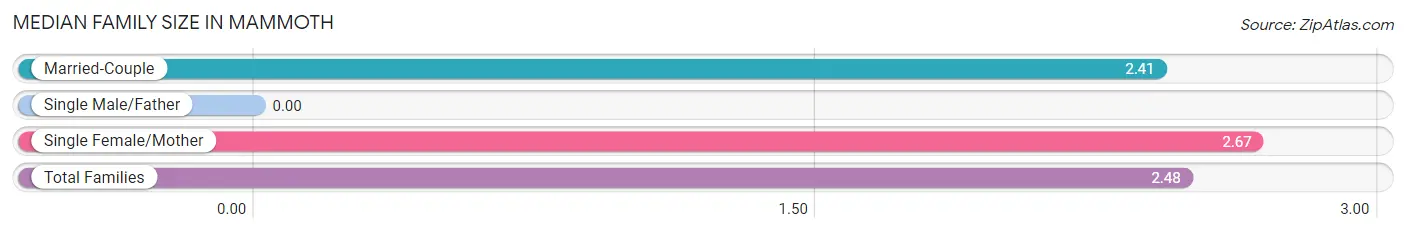
| Family Type | # Families | Family Size |
| Married-Couple | 78 (74.3%) | 2.41 |
| Single Male/Father | 0 (0.0%) | - |
| Single Female/Mother | 27 (25.7%) | 2.67 |
| Total Families | 105 (100.0%) | 2.48 |
Median Household Size in Mammoth
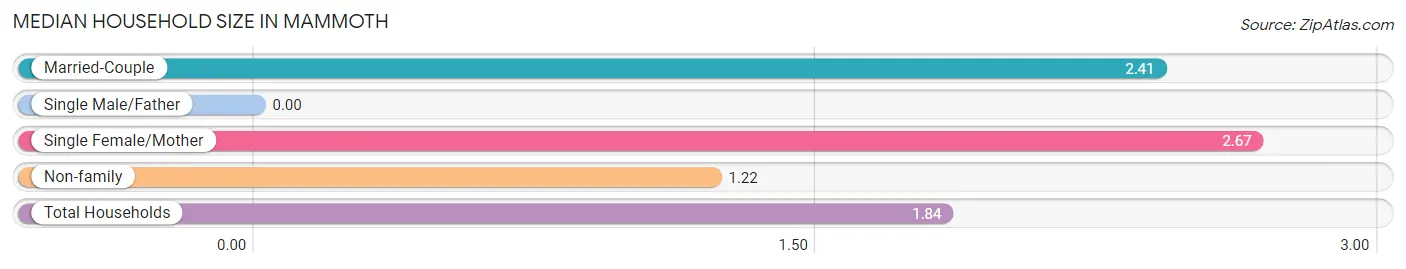
| Household Type | # Households | Household Size |
| Married-Couple | 78 (36.8%) | 2.41 |
| Single Male/Father | 0 (0.0%) | - |
| Single Female/Mother | 27 (12.7%) | 2.67 |
| Non-family | 107 (50.5%) | 1.22 |
| Total Households | 212 (100.0%) | 1.84 |
Household Size by Marriage Status in Mammoth
Out of a total of 212 households in Mammoth, 105 (49.5%) are family households, while 107 (50.5%) are nonfamily households. The most numerous type of family households are 2-person households, comprising 89, and the most common type of nonfamily households are 1-person households, comprising 84.
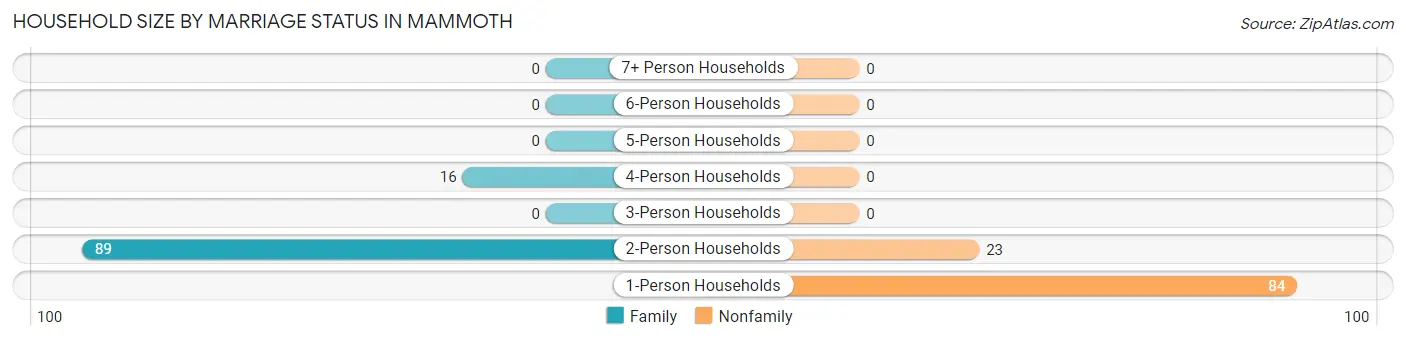
| Household Size | Family Households | Nonfamily Households |
| 1-Person Households | - | 84 (39.6%) |
| 2-Person Households | 89 (42.0%) | 23 (10.8%) |
| 3-Person Households | 0 (0.0%) | 0 (0.0%) |
| 4-Person Households | 16 (7.5%) | 0 (0.0%) |
| 5-Person Households | 0 (0.0%) | 0 (0.0%) |
| 6-Person Households | 0 (0.0%) | 0 (0.0%) |
| 7+ Person Households | 0 (0.0%) | 0 (0.0%) |
| Total | 105 (49.5%) | 107 (50.5%) |
Female Fertility in Mammoth
Fertility by Age in Mammoth
| Age Bracket | Women with Births | Births / 1,000 Women |
| 15 to 19 years | 0 (0.0%) | 0.0 |
| 20 to 34 years | 0 (0.0%) | 0.0 |
| 35 to 50 years | 0 (0.0%) | 0.0 |
| Total | 0 (0.0%) | 0.0 |
Fertility by Age by Marriage Status in Mammoth
| Age Bracket | Married | Unmarried |
| 15 to 19 years | 0 (0.0%) | 0 (0.0%) |
| 20 to 34 years | 0 (0.0%) | 0 (0.0%) |
| 35 to 50 years | 0 (0.0%) | 0 (0.0%) |
| Total | 0 (0.0%) | 0 (0.0%) |
Fertility by Education in Mammoth
| Educational Attainment | Women with Births | Births / 1,000 Women |
| Less than High School | 0 (0.0%) | 0.0 |
| High School Diploma | 0 (0.0%) | 0.0 |
| College or Associate's Degree | 0 (0.0%) | 0.0 |
| Bachelor's Degree | 0 (0.0%) | 0.0 |
| Graduate Degree | 0 (0.0%) | 0.0 |
| Total | 0 (0.0%) | 0.0 |
Fertility by Education by Marriage Status in Mammoth
| Educational Attainment | Married | Unmarried |
| Less than High School | 0 (0.0%) | 0 (0.0%) |
| High School Diploma | 0 (0.0%) | 0 (0.0%) |
| College or Associate's Degree | 0 (0.0%) | 0 (0.0%) |
| Bachelor's Degree | 0 (0.0%) | 0 (0.0%) |
| Graduate Degree | 0 (0.0%) | 0 (0.0%) |
| Total | 0 (0.0%) | 0 (0.0%) |
Employment Characteristics in Mammoth
Employment by Class of Employer in Mammoth
Among the 201 employed individuals in Mammoth, private company employees (162 | 80.6%), self-employed (not incorporated) (25 | 12.4%), and local government employees (9 | 4.5%) make up the most common classes of employment.
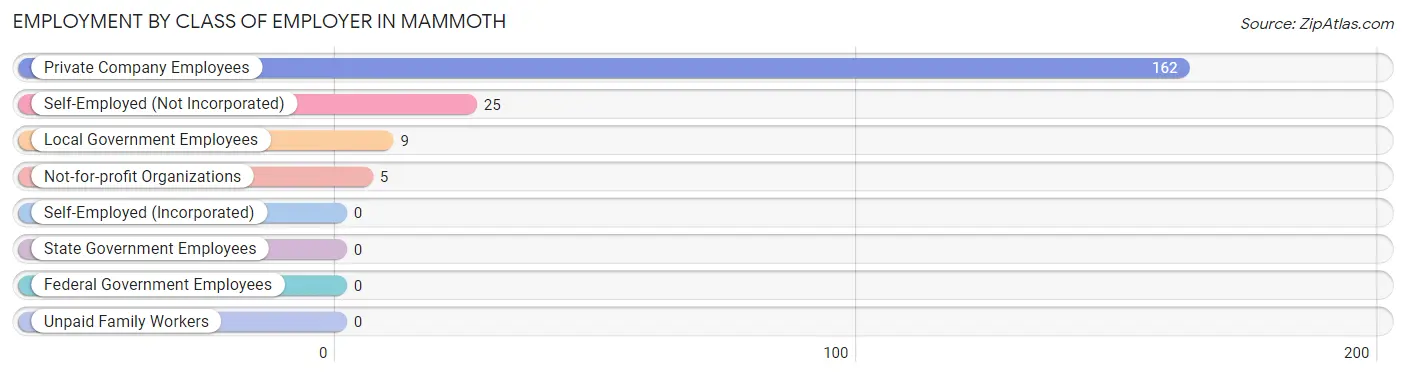
| Employer Class | # Employees | % Employees |
| Private Company Employees | 162 | 80.6% |
| Self-Employed (Incorporated) | 0 | 0.0% |
| Self-Employed (Not Incorporated) | 25 | 12.4% |
| Not-for-profit Organizations | 5 | 2.5% |
| Local Government Employees | 9 | 4.5% |
| State Government Employees | 0 | 0.0% |
| Federal Government Employees | 0 | 0.0% |
| Unpaid Family Workers | 0 | 0.0% |
| Total | 201 | 100.0% |
Employment Status by Age in Mammoth
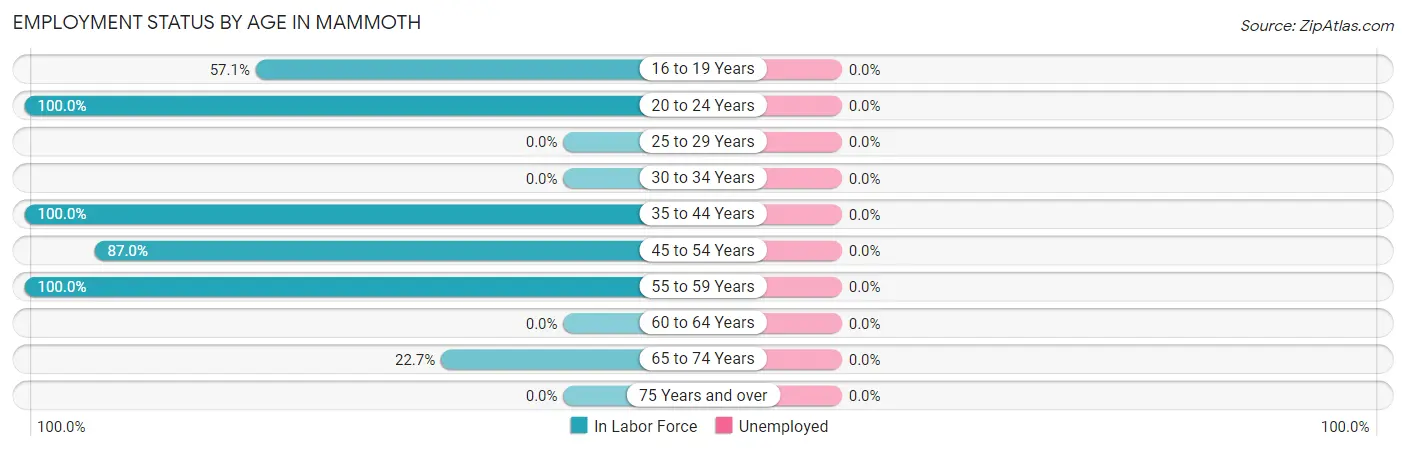
| Age Bracket | In Labor Force | Unemployed |
| 16 to 19 Years | 8 (57.1%) | 0 (0.0%) |
| 20 to 24 Years | 29 (100.0%) | 0 (0.0%) |
| 25 to 29 Years | 0 (0.0%) | 0 (0.0%) |
| 30 to 34 Years | 0 (0.0%) | 0 (0.0%) |
| 35 to 44 Years | 42 (100.0%) | 0 (0.0%) |
| 45 to 54 Years | 47 (87.0%) | 0 (0.0%) |
| 55 to 59 Years | 50 (100.0%) | 0 (0.0%) |
| 60 to 64 Years | 0 (0.0%) | 0 (0.0%) |
| 65 to 74 Years | 25 (22.7%) | 0 (0.0%) |
| 75 Years and over | 0 (0.0%) | 0 (0.0%) |
| Total | 201 (54.0%) | 0 (0.0%) |
Employment Status by Educational Attainment in Mammoth
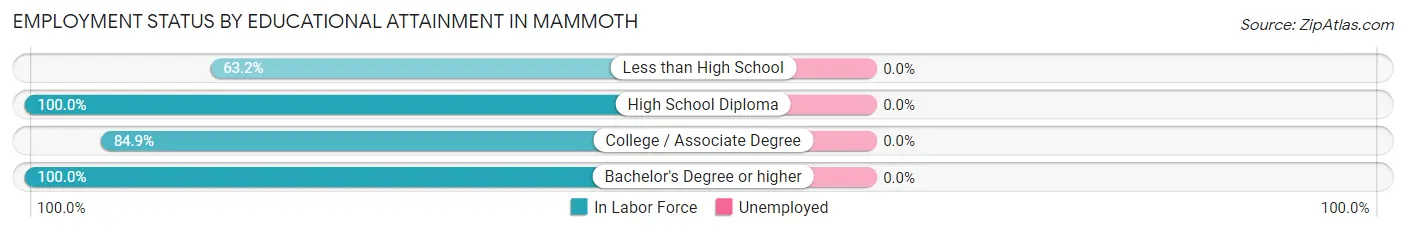
| Educational Attainment | In Labor Force | Unemployed |
| Less than High School | 12 (63.2%) | 0 (0.0%) |
| High School Diploma | 52 (100.0%) | 0 (0.0%) |
| College / Associate Degree | 62 (84.9%) | 0 (0.0%) |
| Bachelor's Degree or higher | 13 (100.0%) | 0 (0.0%) |
| Total | 139 (88.5%) | 0 (0.0%) |
Employment Occupations by Sex in Mammoth
Management, Business, Science and Arts Occupations
The most common Management, Business, Science and Arts occupations in Mammoth are Business & Financial (11 | 5.5%), and Management (5 | 2.5%).
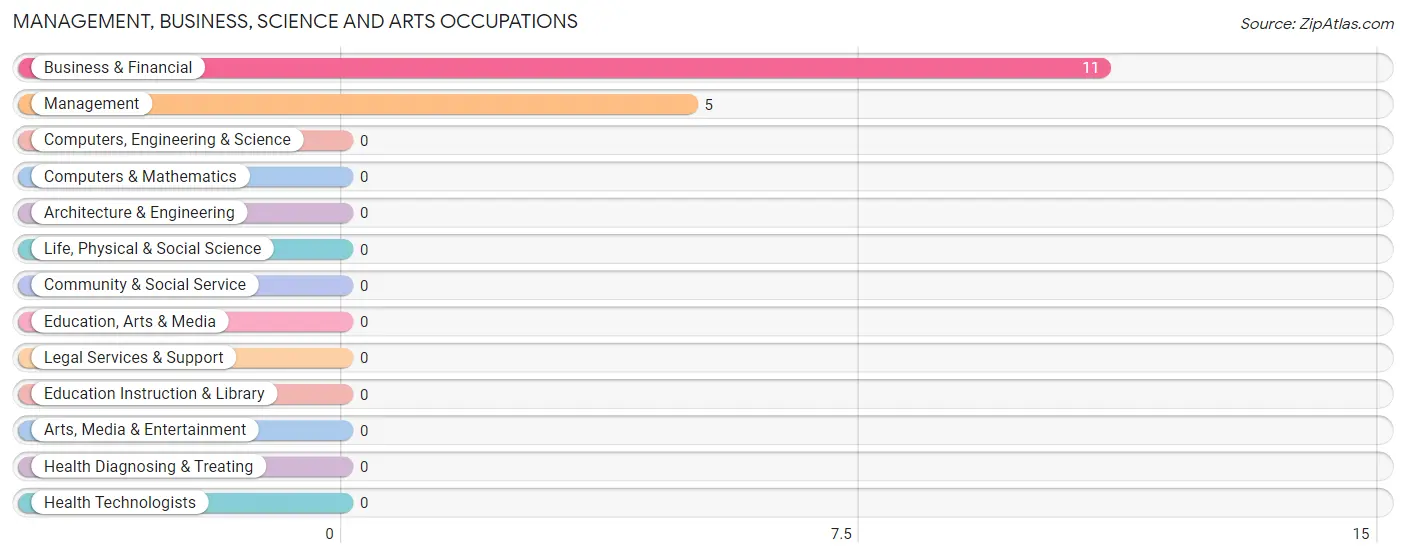
Management, Business, Science and Arts Occupations by Sex
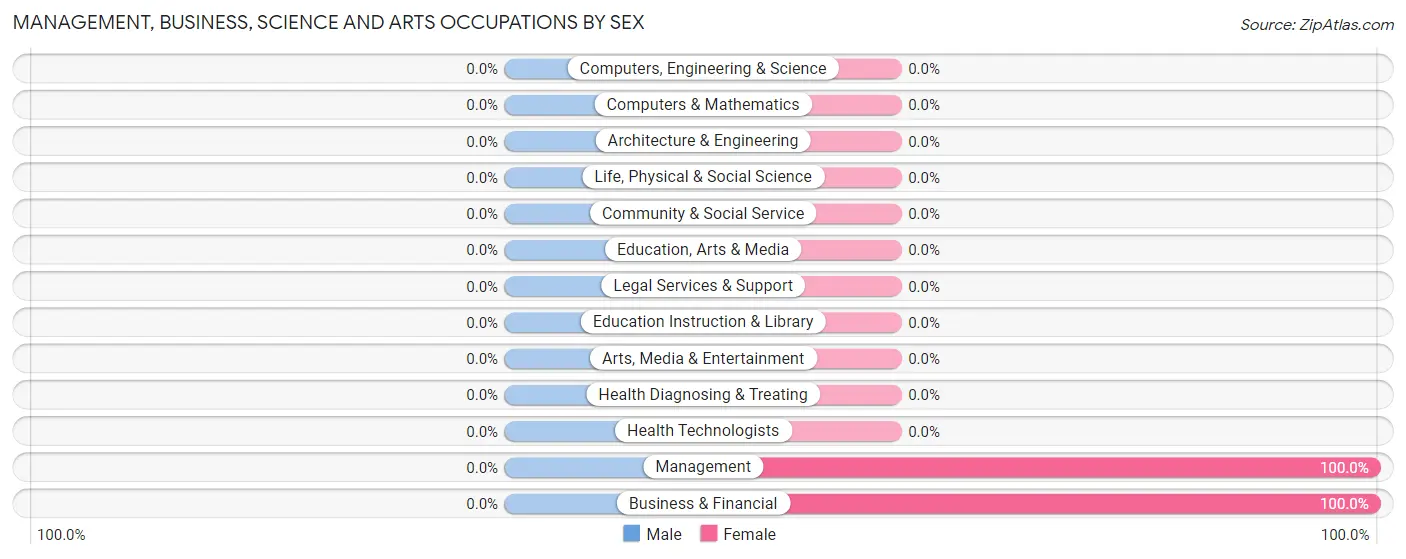
| Occupation | Male | Female |
| Management | 0 (0.0%) | 5 (100.0%) |
| Business & Financial | 0 (0.0%) | 11 (100.0%) |
| Computers, Engineering & Science | 0 (0.0%) | 0 (0.0%) |
| Computers & Mathematics | 0 (0.0%) | 0 (0.0%) |
| Architecture & Engineering | 0 (0.0%) | 0 (0.0%) |
| Life, Physical & Social Science | 0 (0.0%) | 0 (0.0%) |
| Community & Social Service | 0 (0.0%) | 0 (0.0%) |
| Education, Arts & Media | 0 (0.0%) | 0 (0.0%) |
| Legal Services & Support | 0 (0.0%) | 0 (0.0%) |
| Education Instruction & Library | 0 (0.0%) | 0 (0.0%) |
| Arts, Media & Entertainment | 0 (0.0%) | 0 (0.0%) |
| Health Diagnosing & Treating | 0 (0.0%) | 0 (0.0%) |
| Health Technologists | 0 (0.0%) | 0 (0.0%) |
| Total (Category) | 0 (0.0%) | 16 (100.0%) |
| Total (Overall) | 80 (39.8%) | 121 (60.2%) |
Services Occupations
The most common Services occupations in Mammoth are Cleaning & Maintenance (29 | 14.4%), and Healthcare Support (10 | 5.0%).
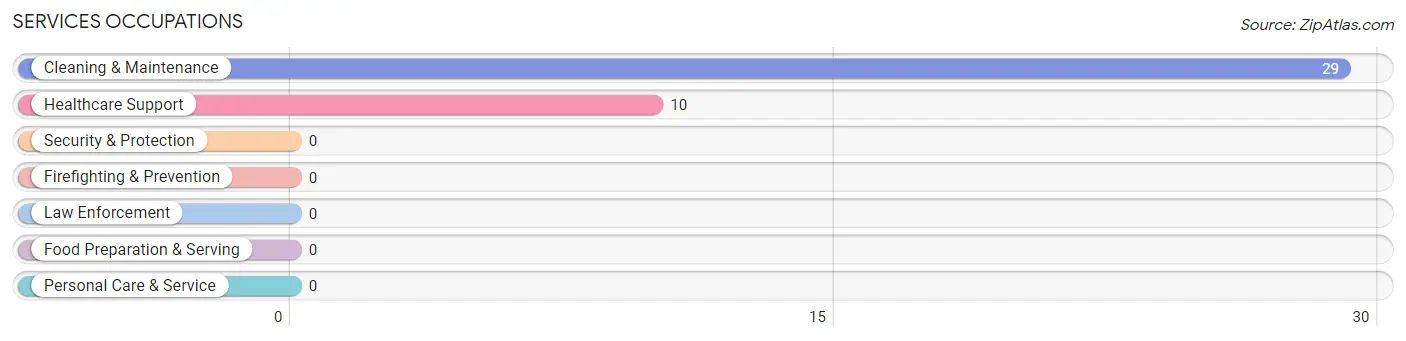
Services Occupations by Sex
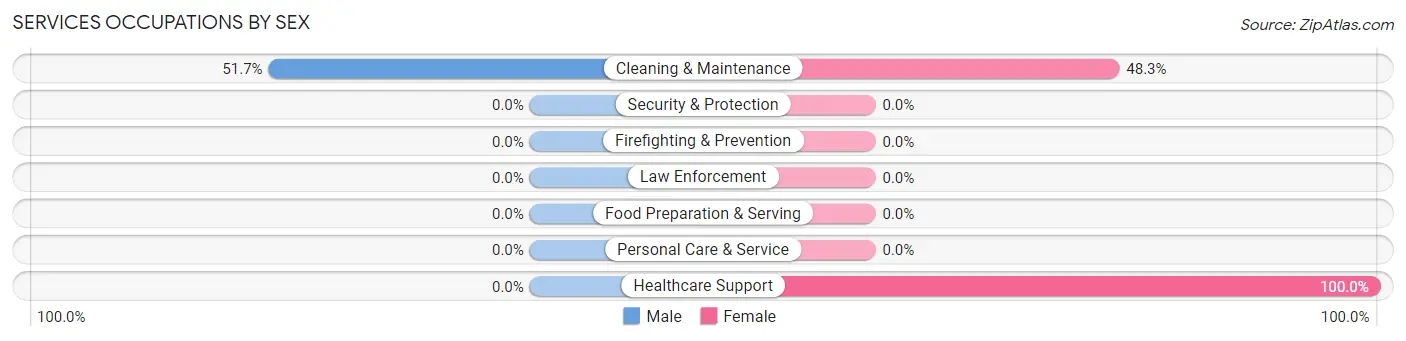
| Occupation | Male | Female |
| Healthcare Support | 0 (0.0%) | 10 (100.0%) |
| Security & Protection | 0 (0.0%) | 0 (0.0%) |
| Firefighting & Prevention | 0 (0.0%) | 0 (0.0%) |
| Law Enforcement | 0 (0.0%) | 0 (0.0%) |
| Food Preparation & Serving | 0 (0.0%) | 0 (0.0%) |
| Cleaning & Maintenance | 15 (51.7%) | 14 (48.3%) |
| Personal Care & Service | 0 (0.0%) | 0 (0.0%) |
| Total (Category) | 15 (38.5%) | 24 (61.5%) |
| Total (Overall) | 80 (39.8%) | 121 (60.2%) |
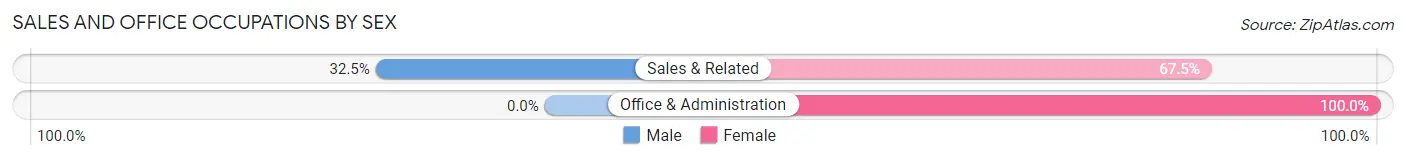
Sales and Office Occupations
The most common Sales and Office occupations in Mammoth are Sales & Related (40 | 19.9%), and Office & Administration (36 | 17.9%).
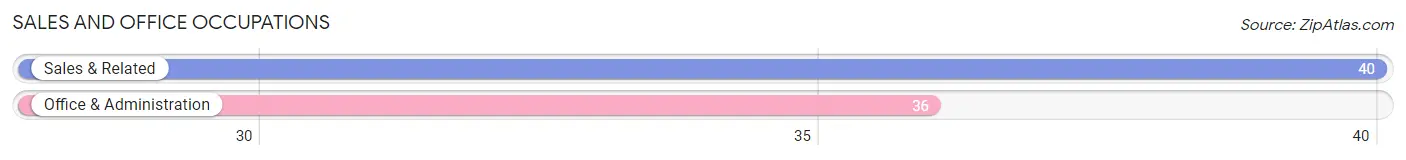
Sales and Office Occupations by Sex
| Occupation | Male | Female |
| Sales & Related | 13 (32.5%) | 27 (67.5%) |
| Office & Administration | 0 (0.0%) | 36 (100.0%) |
| Total (Category) | 13 (17.1%) | 63 (82.9%) |
| Total (Overall) | 80 (39.8%) | 121 (60.2%) |
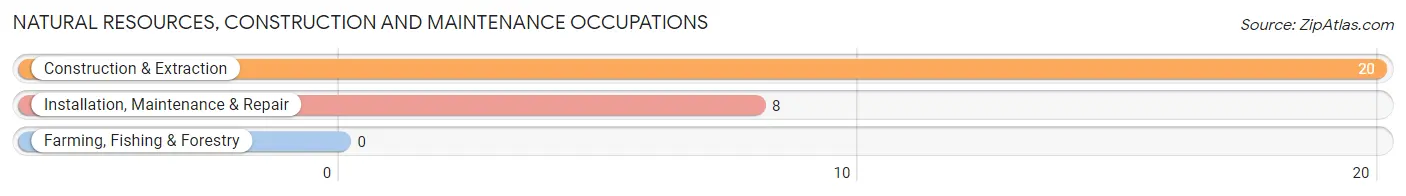
Natural Resources, Construction and Maintenance Occupations
The most common Natural Resources, Construction and Maintenance occupations in Mammoth are Construction & Extraction (20 | 10.0%), and Installation, Maintenance & Repair (8 | 4.0%).
Natural Resources, Construction and Maintenance Occupations by Sex
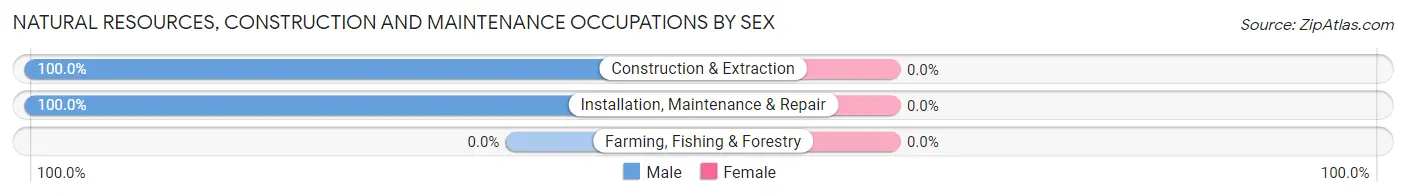
| Occupation | Male | Female |
| Farming, Fishing & Forestry | 0 (0.0%) | 0 (0.0%) |
| Construction & Extraction | 20 (100.0%) | 0 (0.0%) |
| Installation, Maintenance & Repair | 8 (100.0%) | 0 (0.0%) |
| Total (Category) | 28 (100.0%) | 0 (0.0%) |
| Total (Overall) | 80 (39.8%) | 121 (60.2%) |
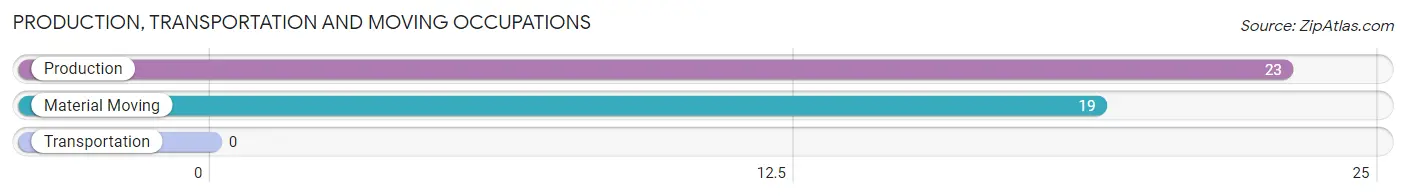
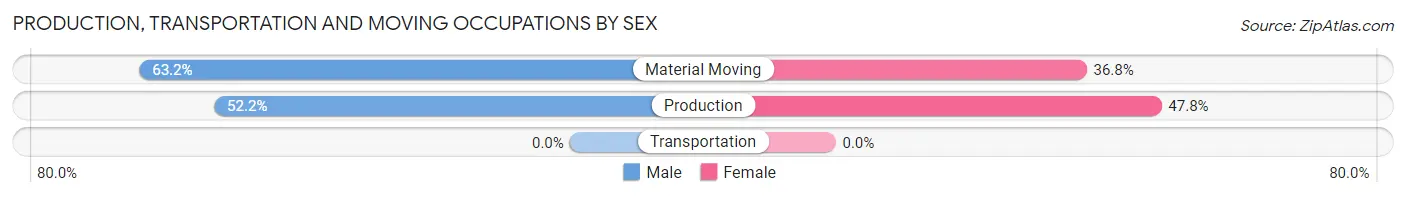
Production, Transportation and Moving Occupations
The most common Production, Transportation and Moving occupations in Mammoth are Production (23 | 11.4%), and Material Moving (19 | 9.5%).
Production, Transportation and Moving Occupations by Sex
| Occupation | Male | Female |
| Production | 12 (52.2%) | 11 (47.8%) |
| Transportation | 0 (0.0%) | 0 (0.0%) |
| Material Moving | 12 (63.2%) | 7 (36.8%) |
| Total (Category) | 24 (57.1%) | 18 (42.9%) |
| Total (Overall) | 80 (39.8%) | 121 (60.2%) |
Employment Industries by Sex in Mammoth
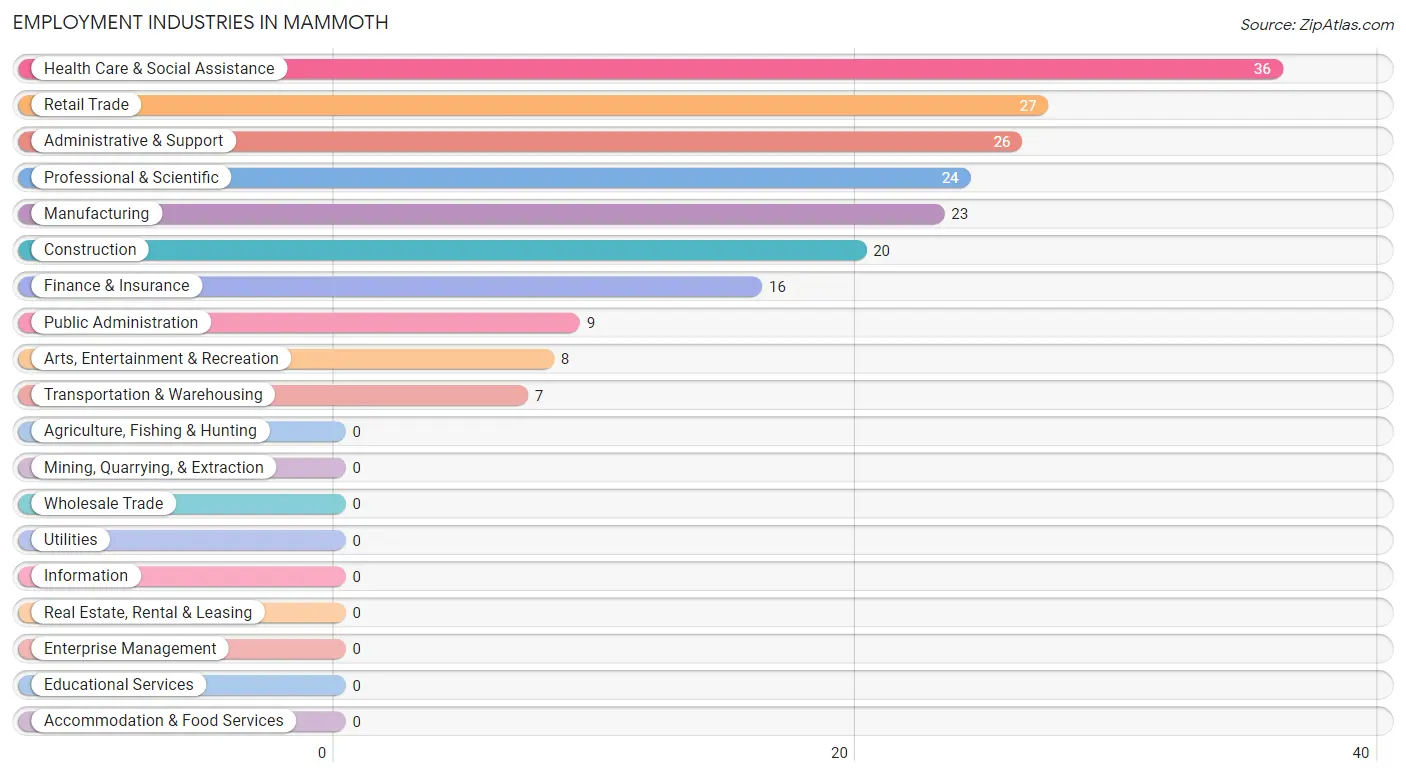
Employment Industries in Mammoth
The major employment industries in Mammoth include Health Care & Social Assistance (36 | 17.9%), Retail Trade (27 | 13.4%), Administrative & Support (26 | 12.9%), Professional & Scientific (24 | 11.9%), and Manufacturing (23 | 11.4%).
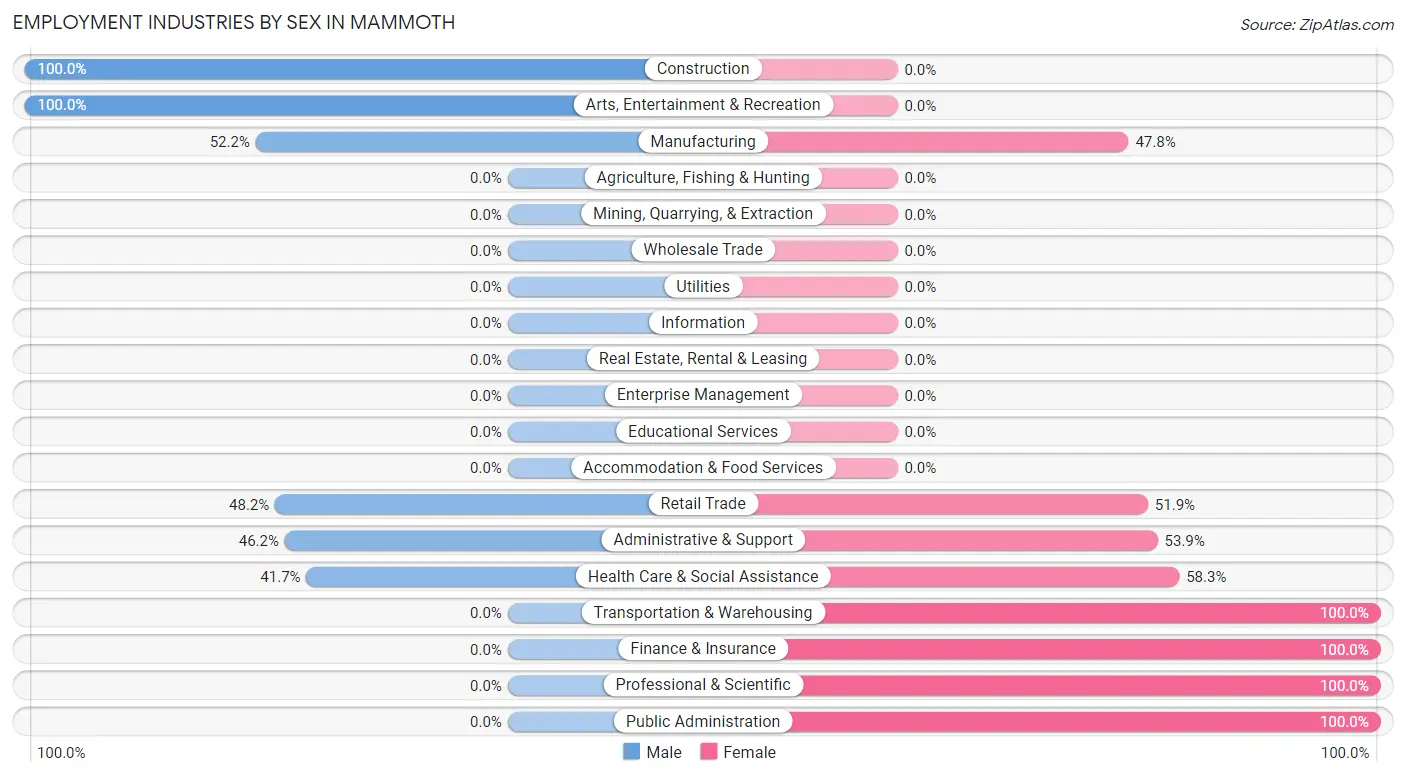
Employment Industries by Sex in Mammoth
The Mammoth industries that see more men than women are Construction (100.0%), Arts, Entertainment & Recreation (100.0%), and Manufacturing (52.2%), whereas the industries that tend to have a higher number of women are Transportation & Warehousing (100.0%), Finance & Insurance (100.0%), and Professional & Scientific (100.0%).
| Industry | Male | Female |
| Agriculture, Fishing & Hunting | 0 (0.0%) | 0 (0.0%) |
| Mining, Quarrying, & Extraction | 0 (0.0%) | 0 (0.0%) |
| Construction | 20 (100.0%) | 0 (0.0%) |
| Manufacturing | 12 (52.2%) | 11 (47.8%) |
| Wholesale Trade | 0 (0.0%) | 0 (0.0%) |
| Retail Trade | 13 (48.1%) | 14 (51.8%) |
| Transportation & Warehousing | 0 (0.0%) | 7 (100.0%) |
| Utilities | 0 (0.0%) | 0 (0.0%) |
| Information | 0 (0.0%) | 0 (0.0%) |
| Finance & Insurance | 0 (0.0%) | 16 (100.0%) |
| Real Estate, Rental & Leasing | 0 (0.0%) | 0 (0.0%) |
| Professional & Scientific | 0 (0.0%) | 24 (100.0%) |
| Enterprise Management | 0 (0.0%) | 0 (0.0%) |
| Administrative & Support | 12 (46.2%) | 14 (53.8%) |
| Educational Services | 0 (0.0%) | 0 (0.0%) |
| Health Care & Social Assistance | 15 (41.7%) | 21 (58.3%) |
| Arts, Entertainment & Recreation | 8 (100.0%) | 0 (0.0%) |
| Accommodation & Food Services | 0 (0.0%) | 0 (0.0%) |
| Public Administration | 0 (0.0%) | 9 (100.0%) |
| Total | 80 (39.8%) | 121 (60.2%) |
Education in Mammoth
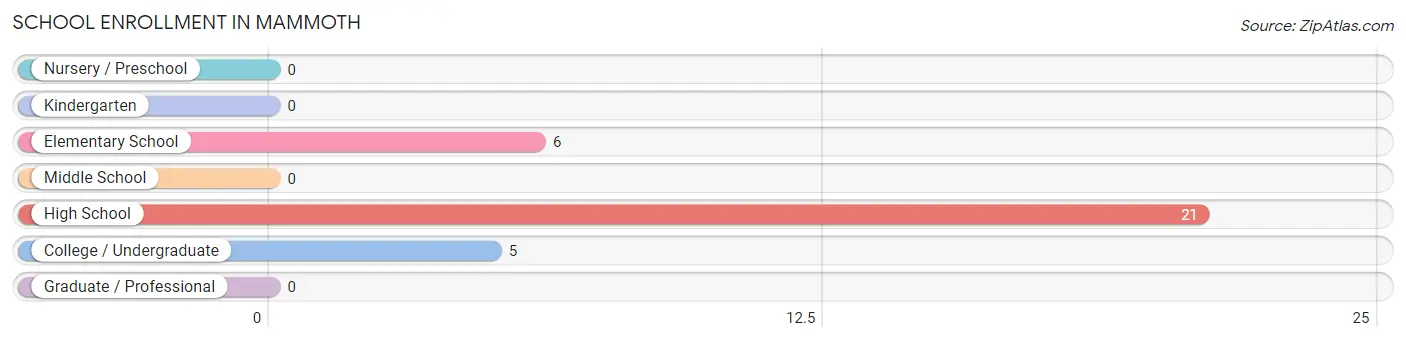
School Enrollment in Mammoth
The most common levels of schooling among the 32 students in Mammoth are high school (21 | 65.6%), elementary school (6 | 18.8%), and college / undergraduate (5 | 15.6%).
| School Level | # Students | % Students |
| Nursery / Preschool | 0 | 0.0% |
| Kindergarten | 0 | 0.0% |
| Elementary School | 6 | 18.8% |
| Middle School | 0 | 0.0% |
| High School | 21 | 65.6% |
| College / Undergraduate | 5 | 15.6% |
| Graduate / Professional | 0 | 0.0% |
| Total | 32 | 100.0% |
School Enrollment by Age by Funding Source in Mammoth
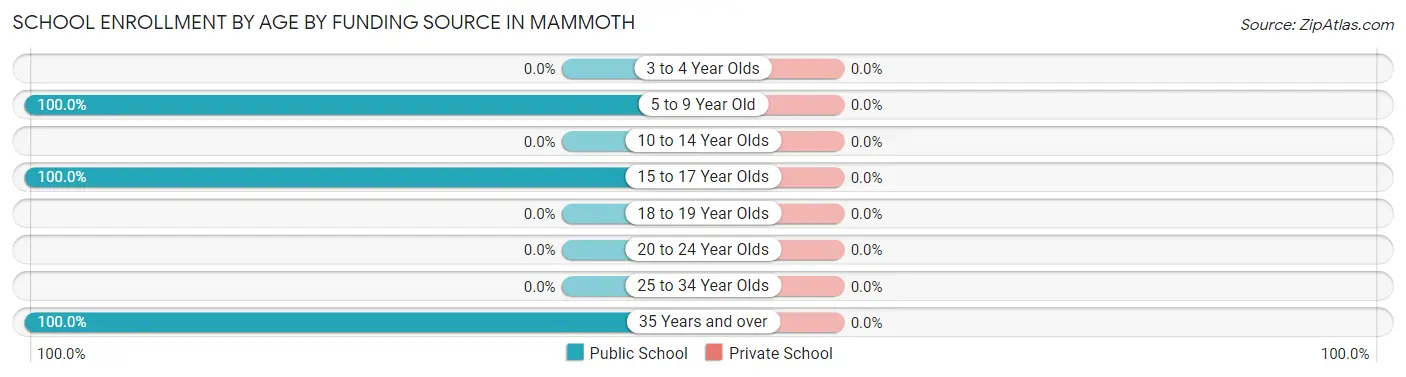
| Age Bracket | Public School | Private School |
| 3 to 4 Year Olds | 0 (0.0%) | 0 (0.0%) |
| 5 to 9 Year Old | 6 (100.0%) | 0 (0.0%) |
| 10 to 14 Year Olds | 0 (0.0%) | 0 (0.0%) |
| 15 to 17 Year Olds | 21 (100.0%) | 0 (0.0%) |
| 18 to 19 Year Olds | 0 (0.0%) | 0 (0.0%) |
| 20 to 24 Year Olds | 0 (0.0%) | 0 (0.0%) |
| 25 to 34 Year Olds | 0 (0.0%) | 0 (0.0%) |
| 35 Years and over | 5 (100.0%) | 0 (0.0%) |
| Total | 32 (100.0%) | 0 (0.0%) |
Educational Attainment by Field of Study in Mammoth
Business (21 | 33.3%), bio, nature & agricultural (13 | 20.6%), physical & health sciences (11 | 17.5%), social sciences (10 | 15.9%), and education (8 | 12.7%) are the most common fields of study among 63 individuals in Mammoth who have obtained a bachelor's degree or higher.
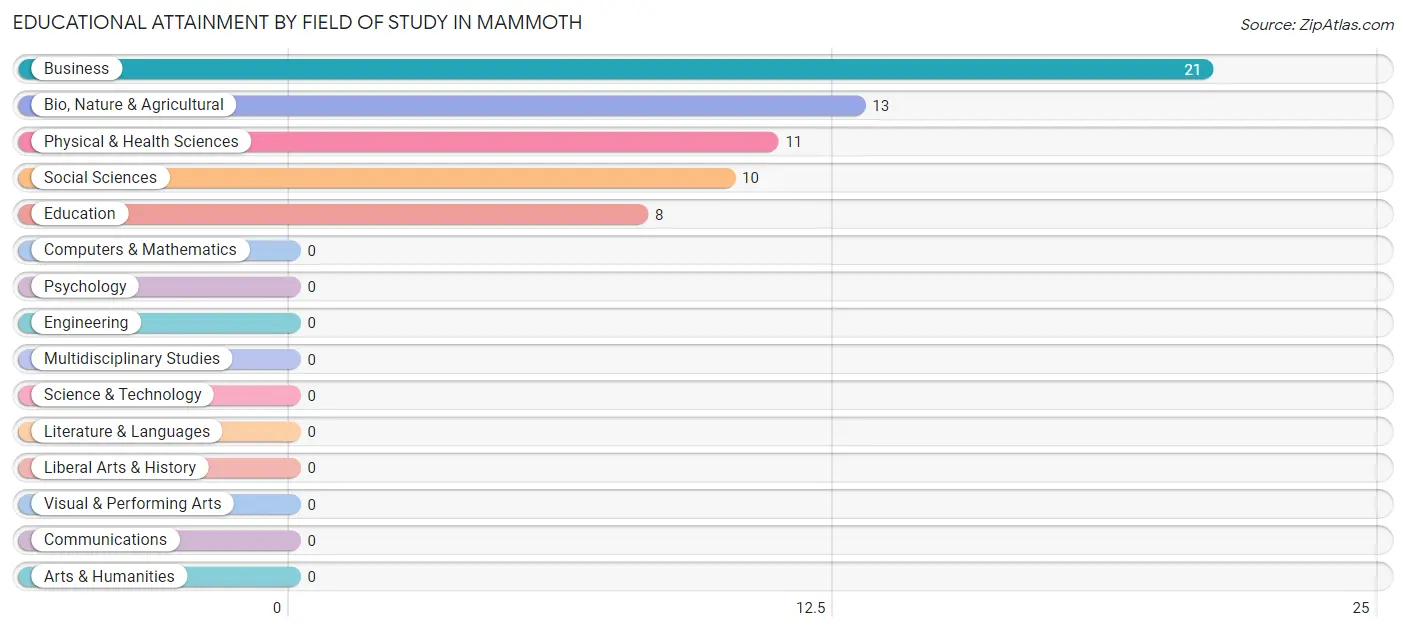
| Field of Study | # Graduates | % Graduates |
| Computers & Mathematics | 0 | 0.0% |
| Bio, Nature & Agricultural | 13 | 20.6% |
| Physical & Health Sciences | 11 | 17.5% |
| Psychology | 0 | 0.0% |
| Social Sciences | 10 | 15.9% |
| Engineering | 0 | 0.0% |
| Multidisciplinary Studies | 0 | 0.0% |
| Science & Technology | 0 | 0.0% |
| Business | 21 | 33.3% |
| Education | 8 | 12.7% |
| Literature & Languages | 0 | 0.0% |
| Liberal Arts & History | 0 | 0.0% |
| Visual & Performing Arts | 0 | 0.0% |
| Communications | 0 | 0.0% |
| Arts & Humanities | 0 | 0.0% |
| Total | 63 | 100.0% |
Transportation & Commute in Mammoth
Vehicle Availability by Sex in Mammoth
The most prevalent vehicle ownership categories in Mammoth are males with 5 or more vehicles (27, accounting for 33.8%) and females with 5 or more vehicles (25, making up 22.3%).
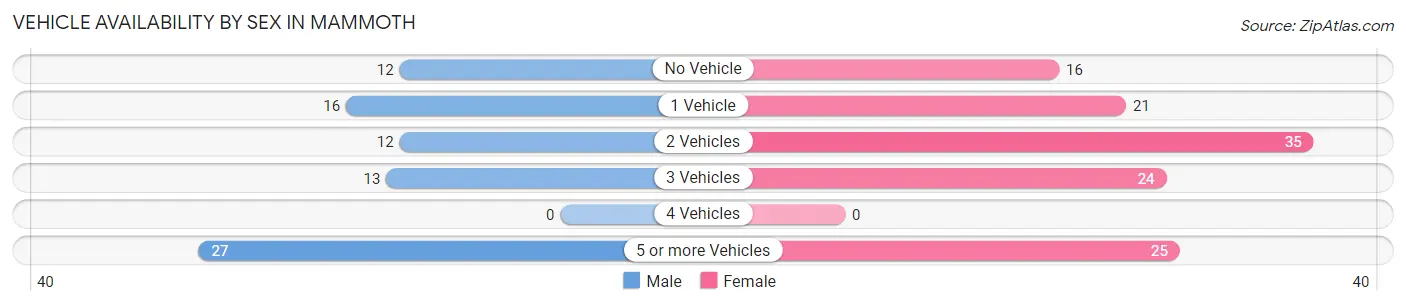
| Vehicles Available | Male | Female |
| No Vehicle | 12 (15.0%) | 16 (13.2%) |
| 1 Vehicle | 16 (20.0%) | 21 (17.4%) |
| 2 Vehicles | 12 (15.0%) | 35 (28.9%) |
| 3 Vehicles | 13 (16.3%) | 24 (19.8%) |
| 4 Vehicles | 0 (0.0%) | 0 (0.0%) |
| 5 or more Vehicles | 27 (33.8%) | 25 (20.7%) |
| Total | 80 (100.0%) | 121 (100.0%) |
Commute Time in Mammoth
The most frequently occuring commute durations in Mammoth are 20 to 24 minutes (55 commuters, 29.3%), 10 to 14 minutes (37 commuters, 19.7%), and 25 to 29 minutes (30 commuters, 16.0%).
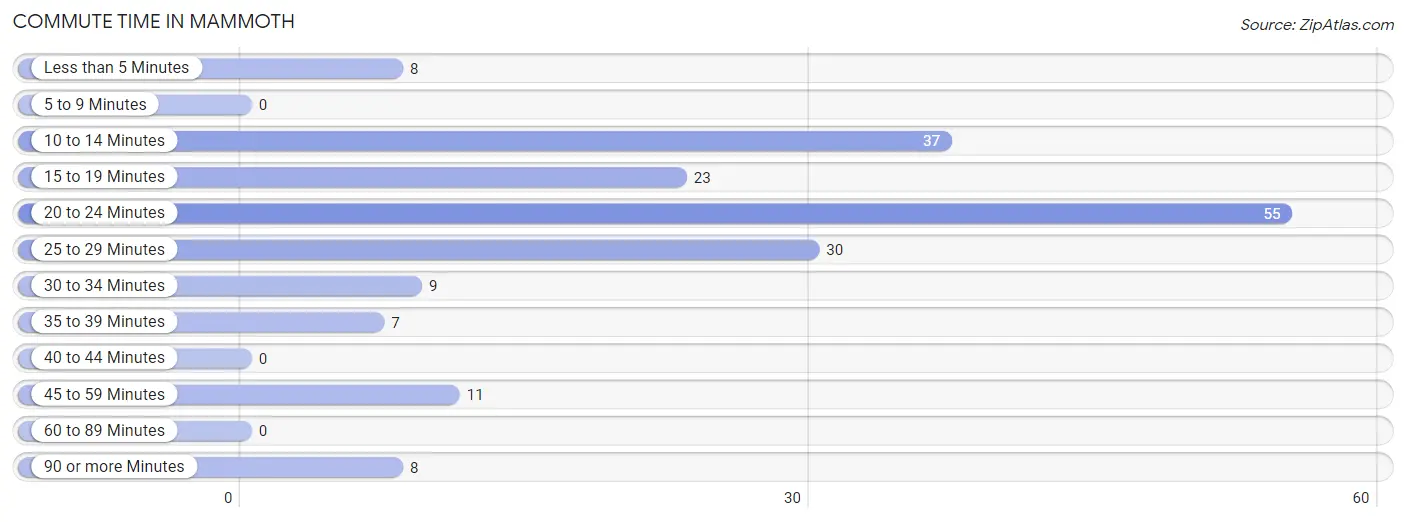
| Commute Time | # Commuters | % Commuters |
| Less than 5 Minutes | 8 | 4.3% |
| 5 to 9 Minutes | 0 | 0.0% |
| 10 to 14 Minutes | 37 | 19.7% |
| 15 to 19 Minutes | 23 | 12.2% |
| 20 to 24 Minutes | 55 | 29.3% |
| 25 to 29 Minutes | 30 | 16.0% |
| 30 to 34 Minutes | 9 | 4.8% |
| 35 to 39 Minutes | 7 | 3.7% |
| 40 to 44 Minutes | 0 | 0.0% |
| 45 to 59 Minutes | 11 | 5.9% |
| 60 to 89 Minutes | 0 | 0.0% |
| 90 or more Minutes | 8 | 4.3% |
Commute Time by Sex in Mammoth
The most common commute times in Mammoth are 20 to 24 minutes (40 commuters, 50.0%) for males and 25 to 29 minutes (30 commuters, 27.8%) for females.
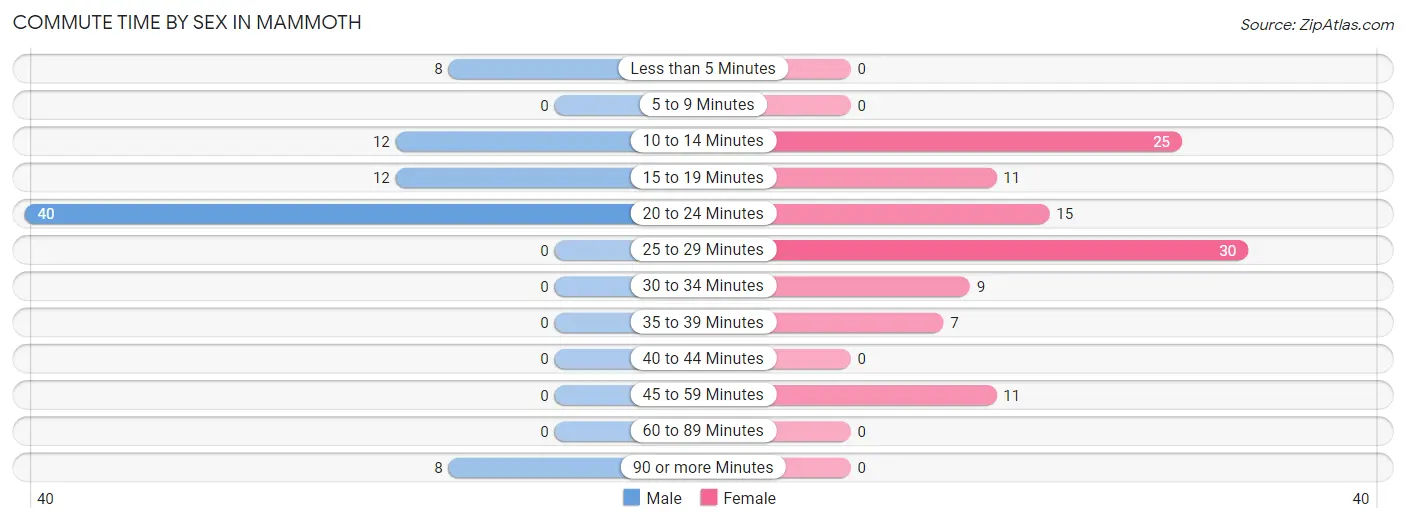
| Commute Time | Male | Female |
| Less than 5 Minutes | 8 (10.0%) | 0 (0.0%) |
| 5 to 9 Minutes | 0 (0.0%) | 0 (0.0%) |
| 10 to 14 Minutes | 12 (15.0%) | 25 (23.2%) |
| 15 to 19 Minutes | 12 (15.0%) | 11 (10.2%) |
| 20 to 24 Minutes | 40 (50.0%) | 15 (13.9%) |
| 25 to 29 Minutes | 0 (0.0%) | 30 (27.8%) |
| 30 to 34 Minutes | 0 (0.0%) | 9 (8.3%) |
| 35 to 39 Minutes | 0 (0.0%) | 7 (6.5%) |
| 40 to 44 Minutes | 0 (0.0%) | 0 (0.0%) |
| 45 to 59 Minutes | 0 (0.0%) | 11 (10.2%) |
| 60 to 89 Minutes | 0 (0.0%) | 0 (0.0%) |
| 90 or more Minutes | 8 (10.0%) | 0 (0.0%) |
Time of Departure to Work by Sex in Mammoth
The most frequent times of departure to work in Mammoth are 7:30 AM to 7:59 AM (15, 18.8%) for males and 12:00 PM to 3:59 PM (30, 27.8%) for females.
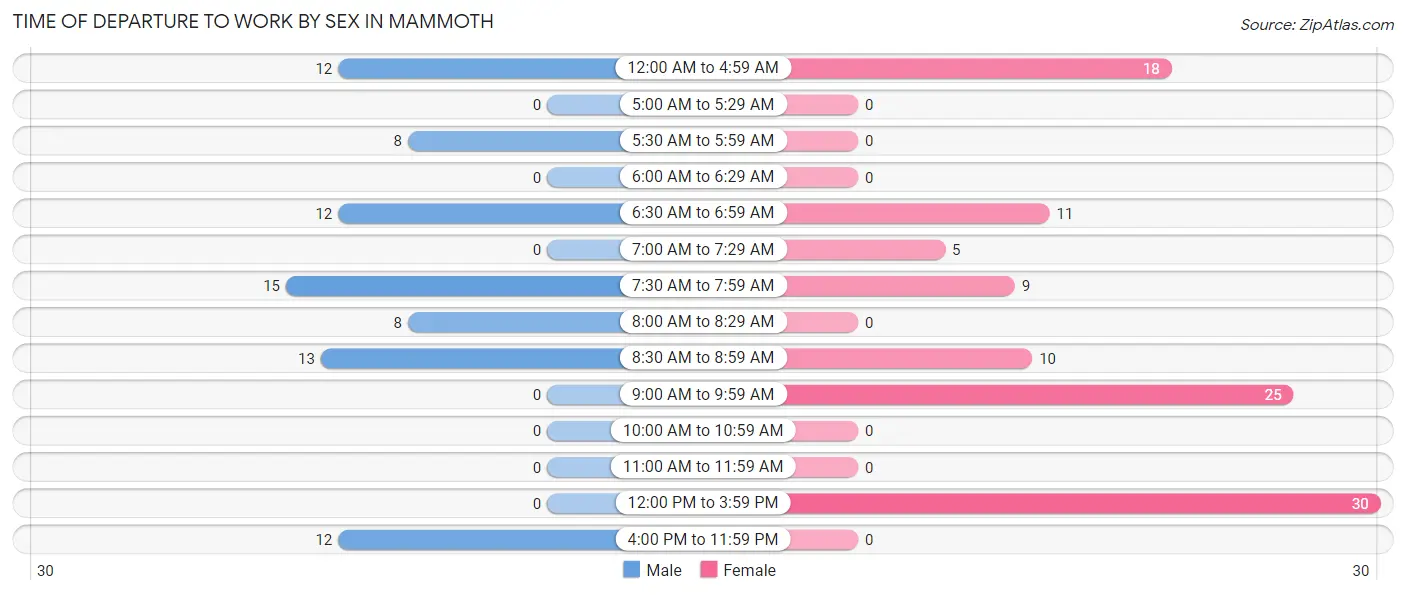
| Time of Departure | Male | Female |
| 12:00 AM to 4:59 AM | 12 (15.0%) | 18 (16.7%) |
| 5:00 AM to 5:29 AM | 0 (0.0%) | 0 (0.0%) |
| 5:30 AM to 5:59 AM | 8 (10.0%) | 0 (0.0%) |
| 6:00 AM to 6:29 AM | 0 (0.0%) | 0 (0.0%) |
| 6:30 AM to 6:59 AM | 12 (15.0%) | 11 (10.2%) |
| 7:00 AM to 7:29 AM | 0 (0.0%) | 5 (4.6%) |
| 7:30 AM to 7:59 AM | 15 (18.8%) | 9 (8.3%) |
| 8:00 AM to 8:29 AM | 8 (10.0%) | 0 (0.0%) |
| 8:30 AM to 8:59 AM | 13 (16.3%) | 10 (9.3%) |
| 9:00 AM to 9:59 AM | 0 (0.0%) | 25 (23.2%) |
| 10:00 AM to 10:59 AM | 0 (0.0%) | 0 (0.0%) |
| 11:00 AM to 11:59 AM | 0 (0.0%) | 0 (0.0%) |
| 12:00 PM to 3:59 PM | 0 (0.0%) | 30 (27.8%) |
| 4:00 PM to 11:59 PM | 12 (15.0%) | 0 (0.0%) |
| Total | 80 (100.0%) | 108 (100.0%) |
Housing Occupancy in Mammoth
Occupancy by Ownership in Mammoth
Of the total 212 dwellings in Mammoth, owner-occupied units account for 160 (75.5%), while renter-occupied units make up 52 (24.5%).
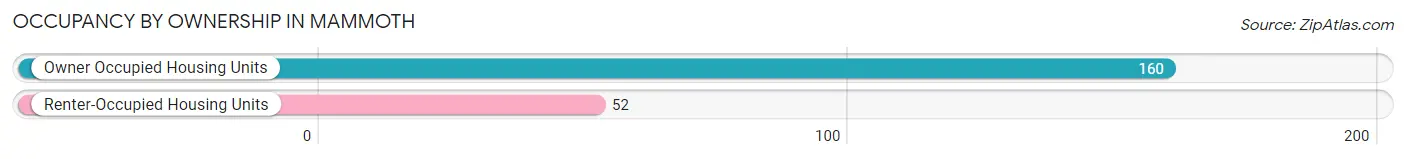
| Occupancy | # Housing Units | % Housing Units |
| Owner Occupied Housing Units | 160 | 75.5% |
| Renter-Occupied Housing Units | 52 | 24.5% |
| Total Occupied Housing Units | 212 | 100.0% |
Occupancy by Household Size in Mammoth
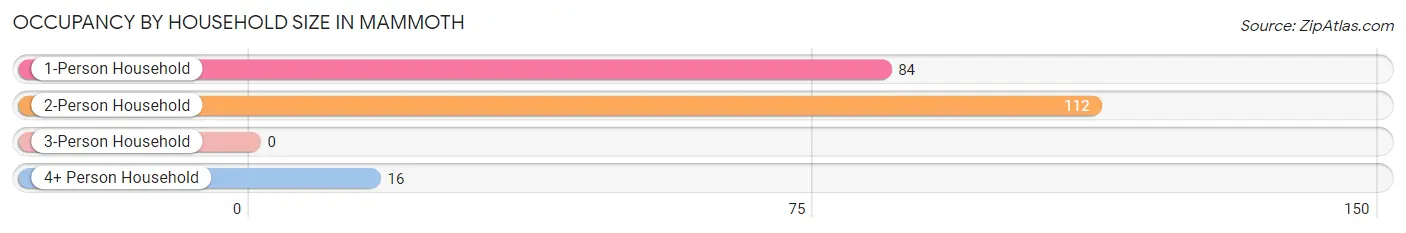
| Household Size | # Housing Units | % Housing Units |
| 1-Person Household | 84 | 39.6% |
| 2-Person Household | 112 | 52.8% |
| 3-Person Household | 0 | 0.0% |
| 4+ Person Household | 16 | 7.5% |
| Total Housing Units | 212 | 100.0% |
Occupancy by Ownership by Household Size in Mammoth
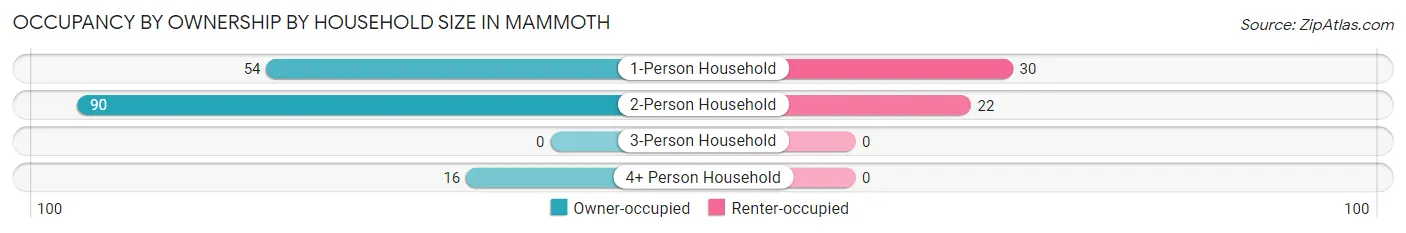
| Household Size | Owner-occupied | Renter-occupied |
| 1-Person Household | 54 (64.3%) | 30 (35.7%) |
| 2-Person Household | 90 (80.4%) | 22 (19.6%) |
| 3-Person Household | 0 (0.0%) | 0 (0.0%) |
| 4+ Person Household | 16 (100.0%) | 0 (0.0%) |
| Total Housing Units | 160 (75.5%) | 52 (24.5%) |
Occupancy by Educational Attainment in Mammoth
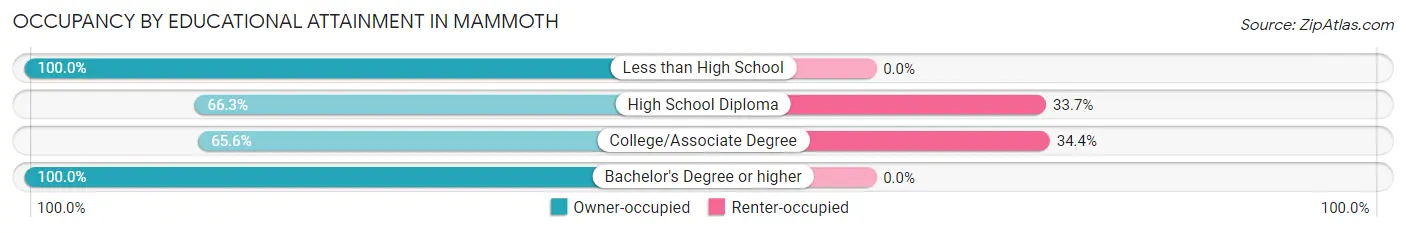
| Household Size | Owner-occupied | Renter-occupied |
| Less than High School | 7 (100.0%) | 0 (0.0%) |
| High School Diploma | 61 (66.3%) | 31 (33.7%) |
| College/Associate Degree | 40 (65.6%) | 21 (34.4%) |
| Bachelor's Degree or higher | 52 (100.0%) | 0 (0.0%) |
Occupancy by Age of Householder in Mammoth
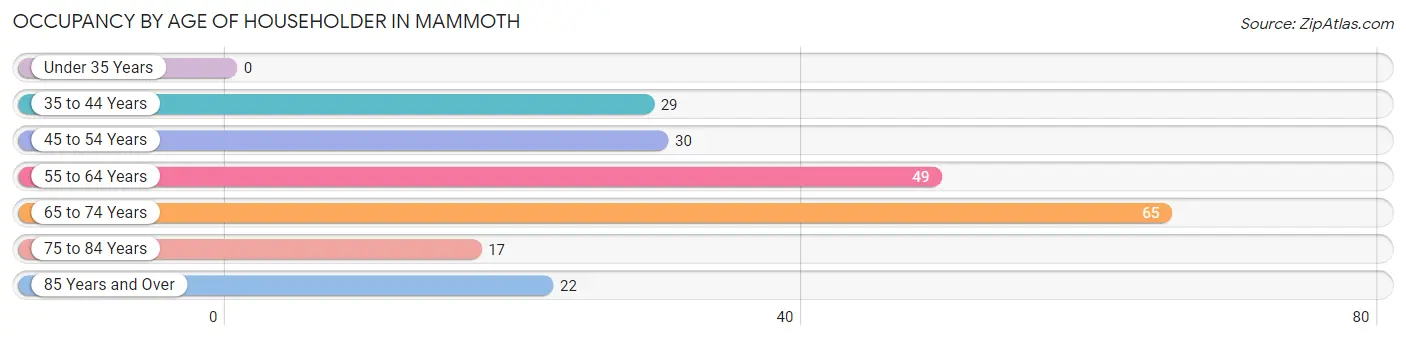
| Age Bracket | # Households | % Households |
| Under 35 Years | 0 | 0.0% |
| 35 to 44 Years | 29 | 13.7% |
| 45 to 54 Years | 30 | 14.1% |
| 55 to 64 Years | 49 | 23.1% |
| 65 to 74 Years | 65 | 30.7% |
| 75 to 84 Years | 17 | 8.0% |
| 85 Years and Over | 22 | 10.4% |
| Total | 212 | 100.0% |
Housing Finances in Mammoth
Median Income by Occupancy in Mammoth
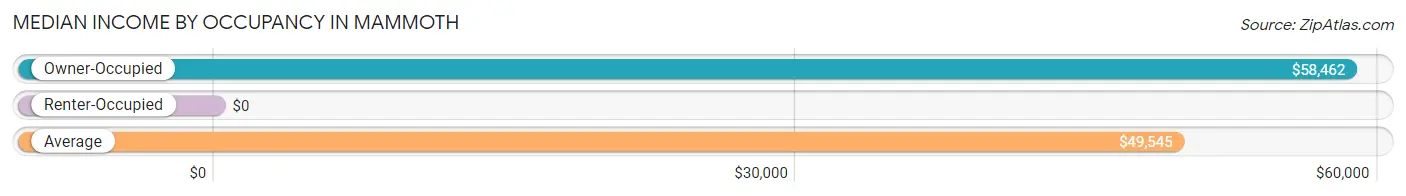
| Occupancy Type | # Households | Median Income |
| Owner-Occupied | 160 (75.5%) | $58,462 |
| Renter-Occupied | 52 (24.5%) | $0 |
| Average | 212 (100.0%) | $49,545 |
Occupancy by Householder Income Bracket in Mammoth
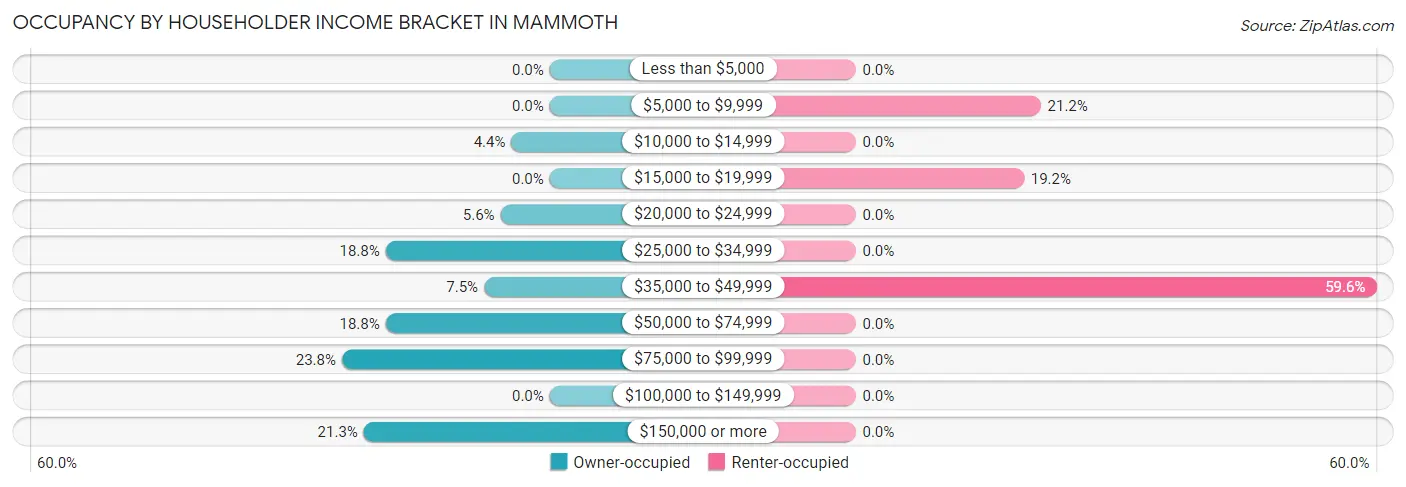
| Income Bracket | Owner-occupied | Renter-occupied |
| Less than $5,000 | 0 (0.0%) | 0 (0.0%) |
| $5,000 to $9,999 | 0 (0.0%) | 11 (21.1%) |
| $10,000 to $14,999 | 7 (4.4%) | 0 (0.0%) |
| $15,000 to $19,999 | 0 (0.0%) | 10 (19.2%) |
| $20,000 to $24,999 | 9 (5.6%) | 0 (0.0%) |
| $25,000 to $34,999 | 30 (18.8%) | 0 (0.0%) |
| $35,000 to $49,999 | 12 (7.5%) | 31 (59.6%) |
| $50,000 to $74,999 | 30 (18.8%) | 0 (0.0%) |
| $75,000 to $99,999 | 38 (23.7%) | 0 (0.0%) |
| $100,000 to $149,999 | 0 (0.0%) | 0 (0.0%) |
| $150,000 or more | 34 (21.2%) | 0 (0.0%) |
| Total | 160 (100.0%) | 52 (100.0%) |
Monthly Housing Cost Tiers in Mammoth
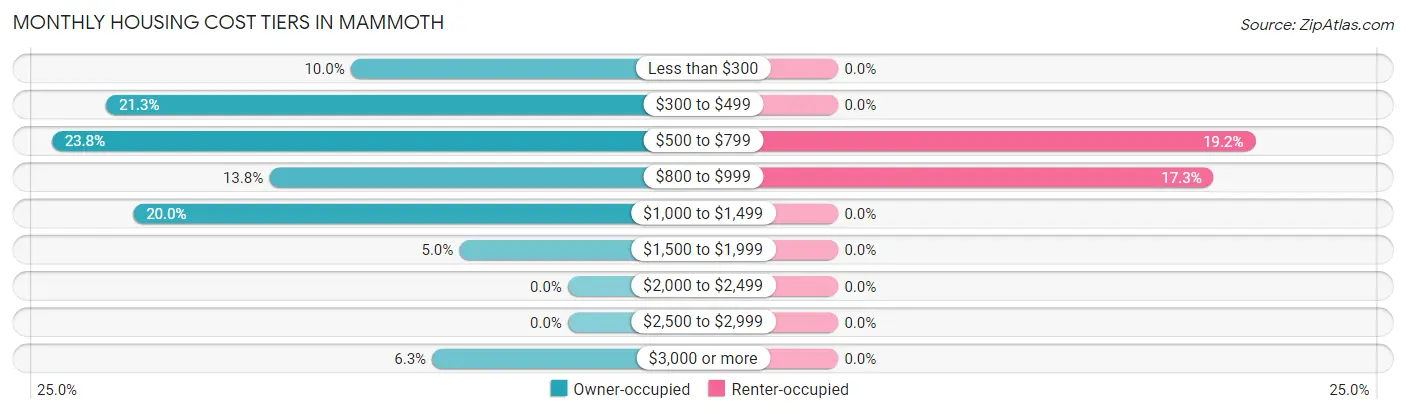
| Monthly Cost | Owner-occupied | Renter-occupied |
| Less than $300 | 16 (10.0%) | 0 (0.0%) |
| $300 to $499 | 34 (21.2%) | 0 (0.0%) |
| $500 to $799 | 38 (23.7%) | 10 (19.2%) |
| $800 to $999 | 22 (13.8%) | 9 (17.3%) |
| $1,000 to $1,499 | 32 (20.0%) | 0 (0.0%) |
| $1,500 to $1,999 | 8 (5.0%) | 0 (0.0%) |
| $2,000 to $2,499 | 0 (0.0%) | 0 (0.0%) |
| $2,500 to $2,999 | 0 (0.0%) | 0 (0.0%) |
| $3,000 or more | 10 (6.2%) | 0 (0.0%) |
| Total | 160 (100.0%) | 52 (100.0%) |
Physical Housing Characteristics in Mammoth
Housing Structures in Mammoth
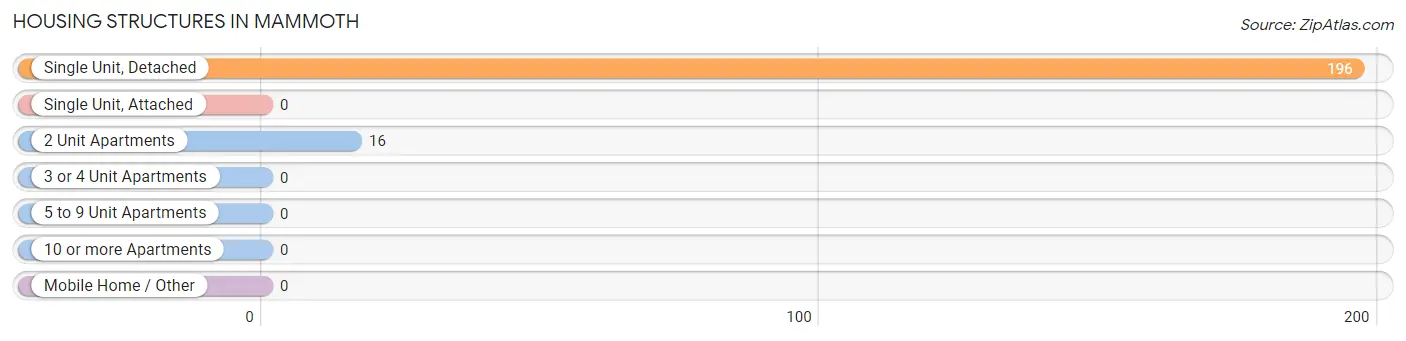
| Structure Type | # Housing Units | % Housing Units |
| Single Unit, Detached | 196 | 92.4% |
| Single Unit, Attached | 0 | 0.0% |
| 2 Unit Apartments | 16 | 7.5% |
| 3 or 4 Unit Apartments | 0 | 0.0% |
| 5 to 9 Unit Apartments | 0 | 0.0% |
| 10 or more Apartments | 0 | 0.0% |
| Mobile Home / Other | 0 | 0.0% |
| Total | 212 | 100.0% |
Housing Structures by Occupancy in Mammoth
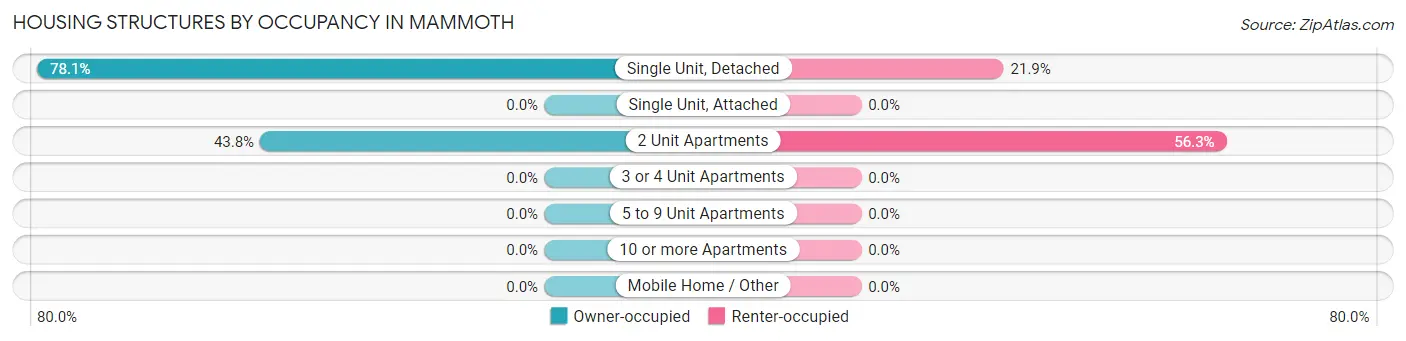
| Structure Type | Owner-occupied | Renter-occupied |
| Single Unit, Detached | 153 (78.1%) | 43 (21.9%) |
| Single Unit, Attached | 0 (0.0%) | 0 (0.0%) |
| 2 Unit Apartments | 7 (43.8%) | 9 (56.2%) |
| 3 or 4 Unit Apartments | 0 (0.0%) | 0 (0.0%) |
| 5 to 9 Unit Apartments | 0 (0.0%) | 0 (0.0%) |
| 10 or more Apartments | 0 (0.0%) | 0 (0.0%) |
| Mobile Home / Other | 0 (0.0%) | 0 (0.0%) |
| Total | 160 (75.5%) | 52 (24.5%) |
Housing Structures by Number of Rooms in Mammoth
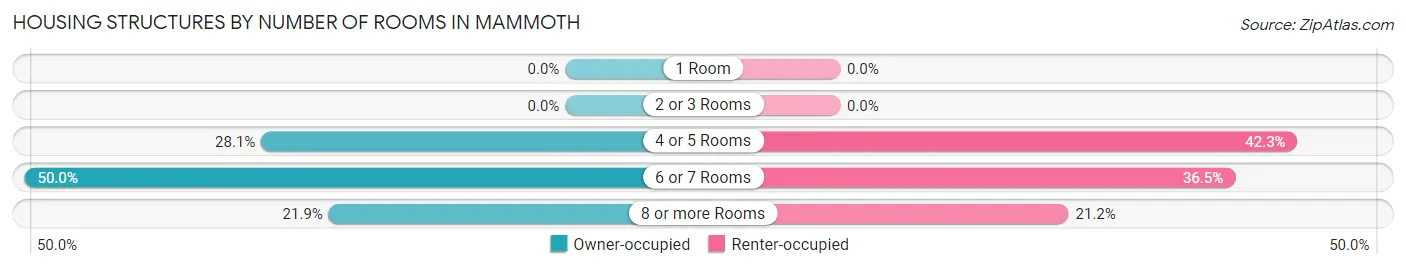
| Number of Rooms | Owner-occupied | Renter-occupied |
| 1 Room | 0 (0.0%) | 0 (0.0%) |
| 2 or 3 Rooms | 0 (0.0%) | 0 (0.0%) |
| 4 or 5 Rooms | 45 (28.1%) | 22 (42.3%) |
| 6 or 7 Rooms | 80 (50.0%) | 19 (36.5%) |
| 8 or more Rooms | 35 (21.9%) | 11 (21.1%) |
| Total | 160 (100.0%) | 52 (100.0%) |
Housing Structure by Heating Type in Mammoth
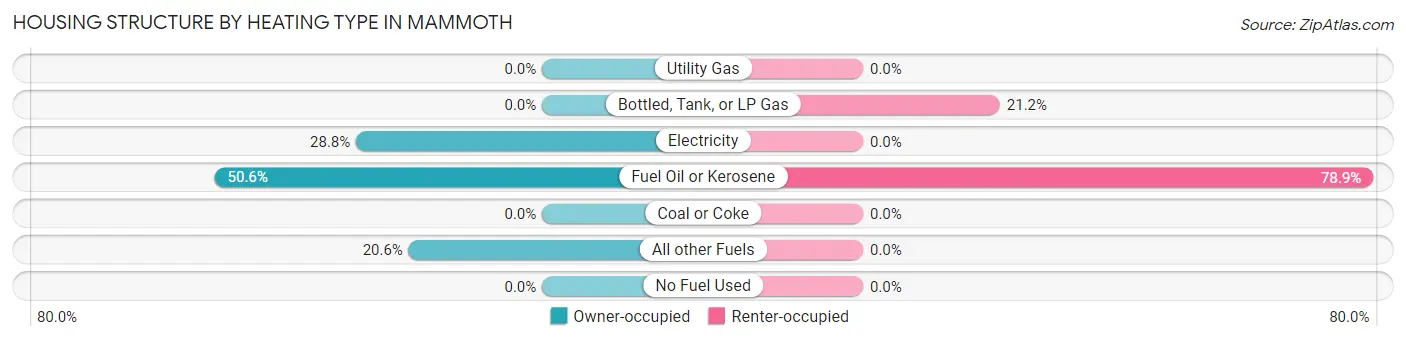
| Heating Type | Owner-occupied | Renter-occupied |
| Utility Gas | 0 (0.0%) | 0 (0.0%) |
| Bottled, Tank, or LP Gas | 0 (0.0%) | 11 (21.1%) |
| Electricity | 46 (28.7%) | 0 (0.0%) |
| Fuel Oil or Kerosene | 81 (50.6%) | 41 (78.8%) |
| Coal or Coke | 0 (0.0%) | 0 (0.0%) |
| All other Fuels | 33 (20.6%) | 0 (0.0%) |
| No Fuel Used | 0 (0.0%) | 0 (0.0%) |
| Total | 160 (100.0%) | 52 (100.0%) |
Household Vehicle Usage in Mammoth
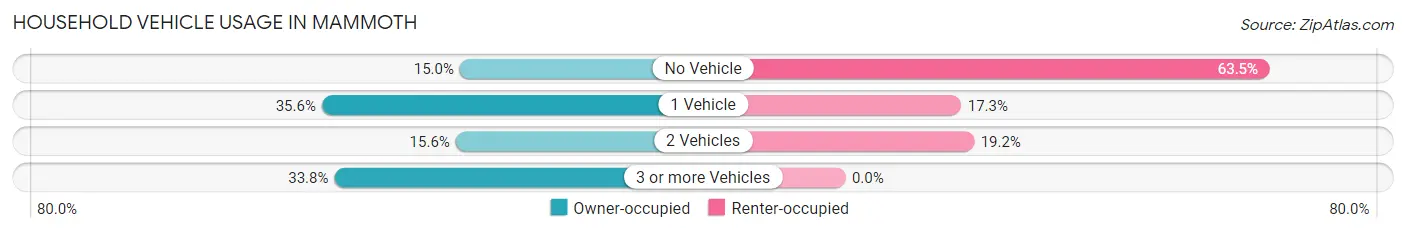
| Vehicles per Household | Owner-occupied | Renter-occupied |
| No Vehicle | 24 (15.0%) | 33 (63.5%) |
| 1 Vehicle | 57 (35.6%) | 9 (17.3%) |
| 2 Vehicles | 25 (15.6%) | 10 (19.2%) |
| 3 or more Vehicles | 54 (33.8%) | 0 (0.0%) |
| Total | 160 (100.0%) | 52 (100.0%) |
Real Estate & Mortgages in Mammoth
Real Estate and Mortgage Overview in Mammoth
| Characteristic | Without Mortgage | With Mortgage |
| Housing Units | 88 | 72 |
| Median Property Value | $190,900 | $223,800 |
| Median Household Income | $52,500 | $10 |
| Monthly Housing Costs | $479 | $10 |
| Real Estate Taxes | $2,700 | $0 |
Property Value by Mortgage Status in Mammoth
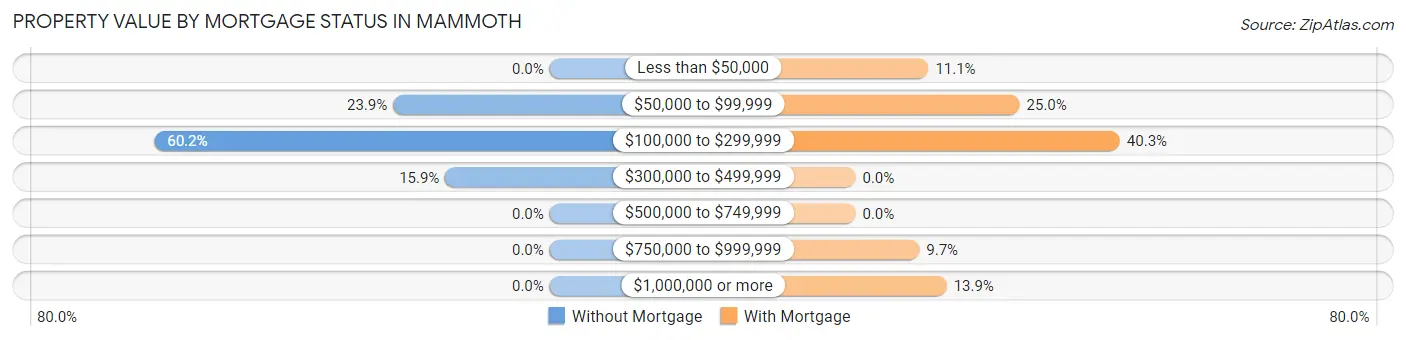
| Property Value | Without Mortgage | With Mortgage |
| Less than $50,000 | 0 (0.0%) | 8 (11.1%) |
| $50,000 to $99,999 | 21 (23.9%) | 18 (25.0%) |
| $100,000 to $299,999 | 53 (60.2%) | 29 (40.3%) |
| $300,000 to $499,999 | 14 (15.9%) | 0 (0.0%) |
| $500,000 to $749,999 | 0 (0.0%) | 0 (0.0%) |
| $750,000 to $999,999 | 0 (0.0%) | 7 (9.7%) |
| $1,000,000 or more | 0 (0.0%) | 10 (13.9%) |
| Total | 88 (100.0%) | 72 (100.0%) |
Household Income by Mortgage Status in Mammoth
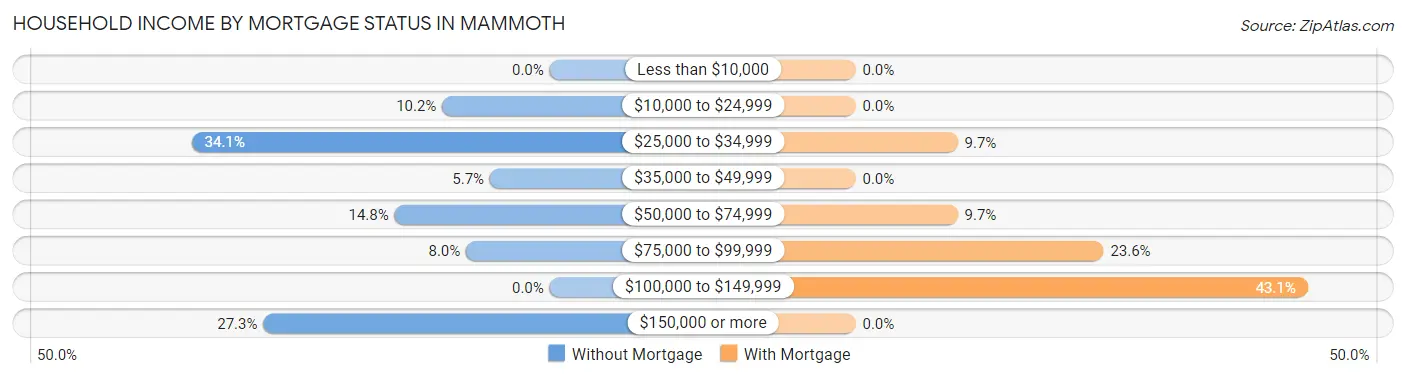
| Household Income | Without Mortgage | With Mortgage |
| Less than $10,000 | 0 (0.0%) | 0 (0.0%) |
| $10,000 to $24,999 | 9 (10.2%) | 0 (0.0%) |
| $25,000 to $34,999 | 30 (34.1%) | 7 (9.7%) |
| $35,000 to $49,999 | 5 (5.7%) | 0 (0.0%) |
| $50,000 to $74,999 | 13 (14.8%) | 7 (9.7%) |
| $75,000 to $99,999 | 7 (8.0%) | 17 (23.6%) |
| $100,000 to $149,999 | 0 (0.0%) | 31 (43.1%) |
| $150,000 or more | 24 (27.3%) | 0 (0.0%) |
| Total | 88 (100.0%) | 72 (100.0%) |
Property Value to Household Income Ratio in Mammoth
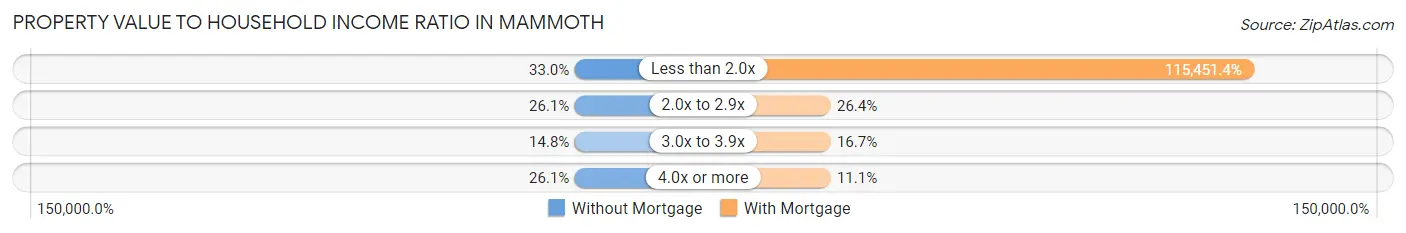
| Value-to-Income Ratio | Without Mortgage | With Mortgage |
| Less than 2.0x | 29 (33.0%) | 83,125 (115,451.4%) |
| 2.0x to 2.9x | 23 (26.1%) | 19 (26.4%) |
| 3.0x to 3.9x | 13 (14.8%) | 12 (16.7%) |
| 4.0x or more | 23 (26.1%) | 8 (11.1%) |
| Total | 88 (100.0%) | 72 (100.0%) |
Real Estate Taxes by Mortgage Status in Mammoth
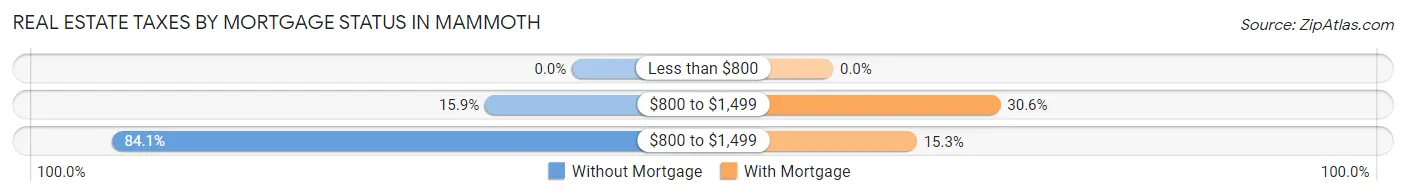
| Property Taxes | Without Mortgage | With Mortgage |
| Less than $800 | 0 (0.0%) | 0 (0.0%) |
| $800 to $1,499 | 14 (15.9%) | 22 (30.6%) |
| $800 to $1,499 | 74 (84.1%) | 11 (15.3%) |
| Total | 88 (100.0%) | 72 (100.0%) |
Health & Disability in Mammoth
Health Insurance Coverage by Age in Mammoth
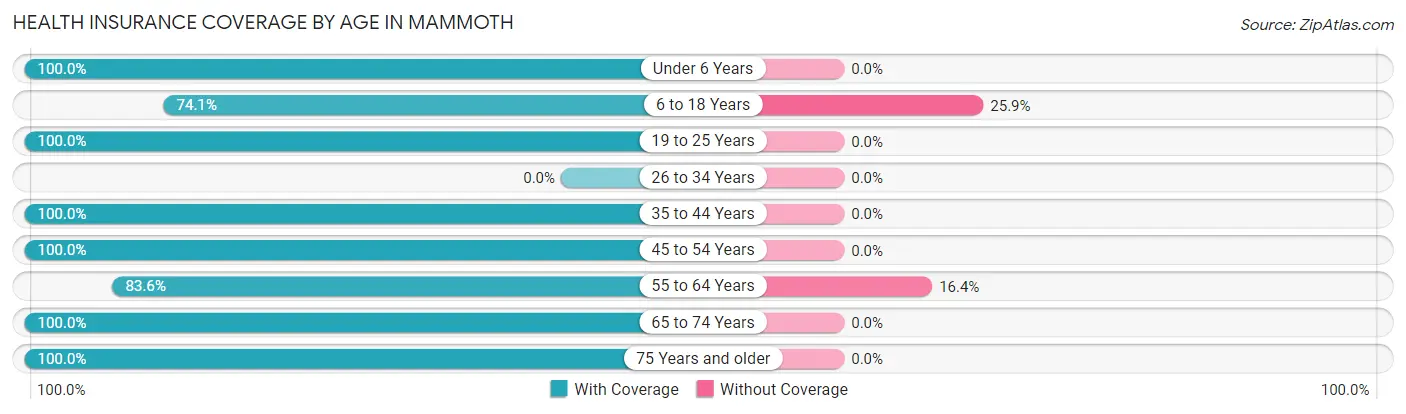
| Age Bracket | With Coverage | Without Coverage |
| Under 6 Years | 6 (100.0%) | 0 (0.0%) |
| 6 to 18 Years | 20 (74.1%) | 7 (25.9%) |
| 19 to 25 Years | 29 (100.0%) | 0 (0.0%) |
| 26 to 34 Years | 0 (0.0%) | 0 (0.0%) |
| 35 to 44 Years | 42 (100.0%) | 0 (0.0%) |
| 45 to 54 Years | 54 (100.0%) | 0 (0.0%) |
| 55 to 64 Years | 51 (83.6%) | 10 (16.4%) |
| 65 to 74 Years | 110 (100.0%) | 0 (0.0%) |
| 75 Years and older | 62 (100.0%) | 0 (0.0%) |
| Total | 374 (95.7%) | 17 (4.3%) |
Health Insurance Coverage by Citizenship Status in Mammoth
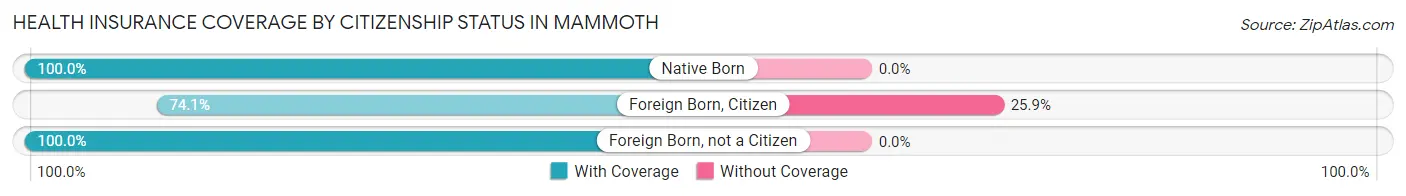
| Citizenship Status | With Coverage | Without Coverage |
| Native Born | 6 (100.0%) | 0 (0.0%) |
| Foreign Born, Citizen | 20 (74.1%) | 7 (25.9%) |
| Foreign Born, not a Citizen | 29 (100.0%) | 0 (0.0%) |
Health Insurance Coverage by Household Income in Mammoth
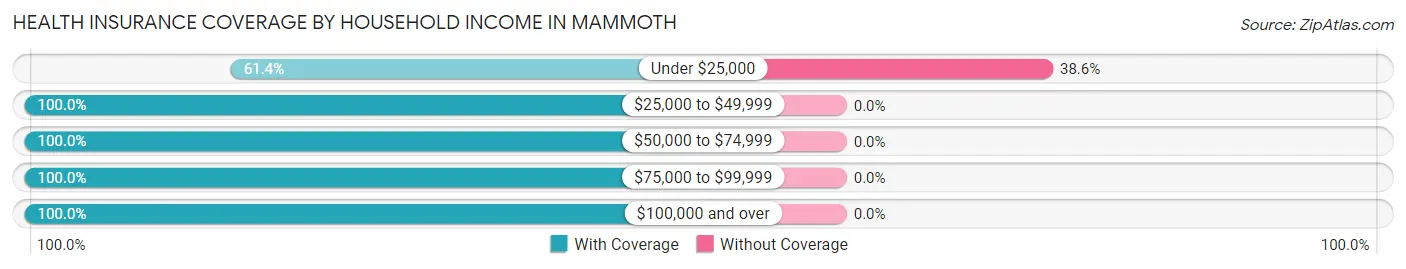
| Household Income | With Coverage | Without Coverage |
| Under $25,000 | 27 (61.4%) | 17 (38.6%) |
| $25,000 to $49,999 | 137 (100.0%) | 0 (0.0%) |
| $50,000 to $74,999 | 43 (100.0%) | 0 (0.0%) |
| $75,000 to $99,999 | 68 (100.0%) | 0 (0.0%) |
| $100,000 and over | 99 (100.0%) | 0 (0.0%) |
Public vs Private Health Insurance Coverage by Age in Mammoth
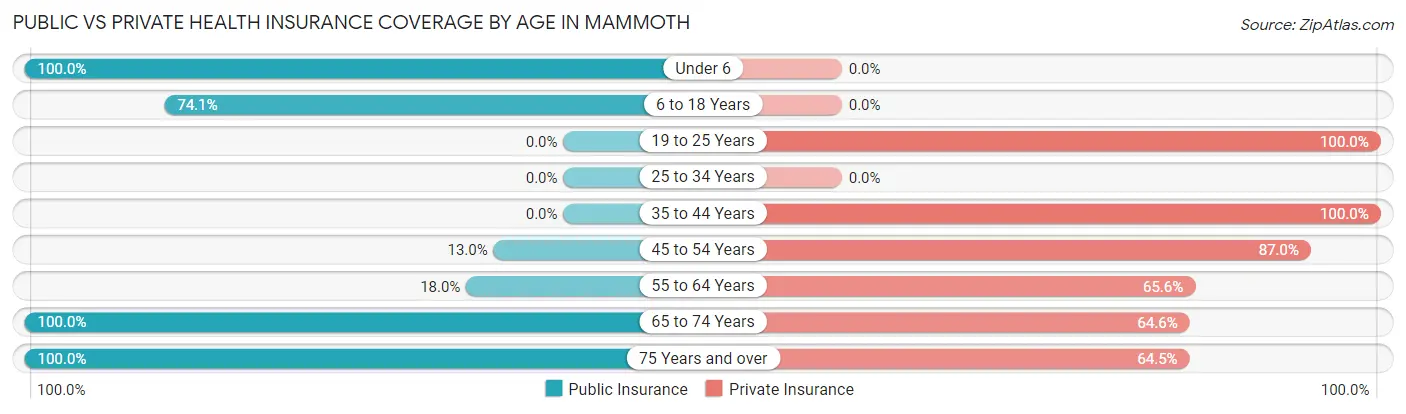
| Age Bracket | Public Insurance | Private Insurance |
| Under 6 | 6 (100.0%) | 0 (0.0%) |
| 6 to 18 Years | 20 (74.1%) | 0 (0.0%) |
| 19 to 25 Years | 0 (0.0%) | 29 (100.0%) |
| 25 to 34 Years | 0 (0.0%) | 0 (0.0%) |
| 35 to 44 Years | 0 (0.0%) | 42 (100.0%) |
| 45 to 54 Years | 7 (13.0%) | 47 (87.0%) |
| 55 to 64 Years | 11 (18.0%) | 40 (65.6%) |
| 65 to 74 Years | 110 (100.0%) | 71 (64.5%) |
| 75 Years and over | 62 (100.0%) | 40 (64.5%) |
| Total | 216 (55.2%) | 269 (68.8%) |
Disability Status by Sex by Age in Mammoth
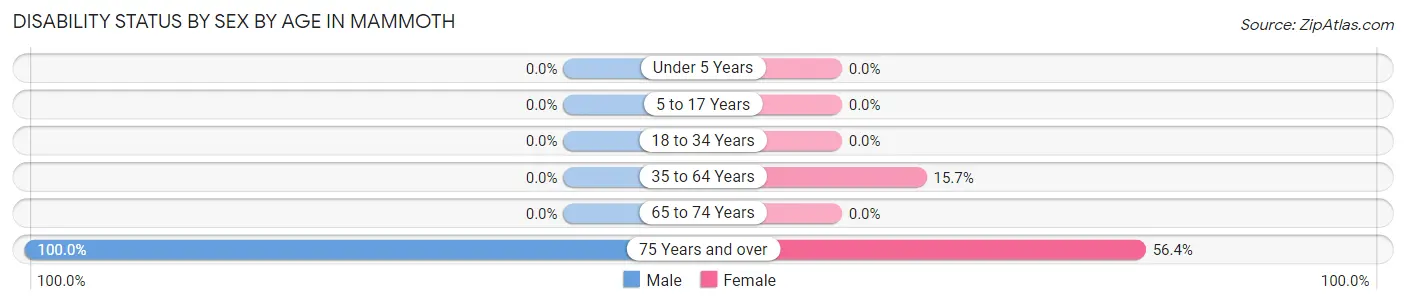
| Age Bracket | Male | Female |
| Under 5 Years | 0 (0.0%) | 0 (0.0%) |
| 5 to 17 Years | 0 (0.0%) | 0 (0.0%) |
| 18 to 34 Years | 0 (0.0%) | 0 (0.0%) |
| 35 to 64 Years | 0 (0.0%) | 14 (15.7%) |
| 65 to 74 Years | 0 (0.0%) | 0 (0.0%) |
| 75 Years and over | 23 (100.0%) | 22 (56.4%) |
Disability Class by Sex by Age in Mammoth
Disability Class: Hearing Difficulty
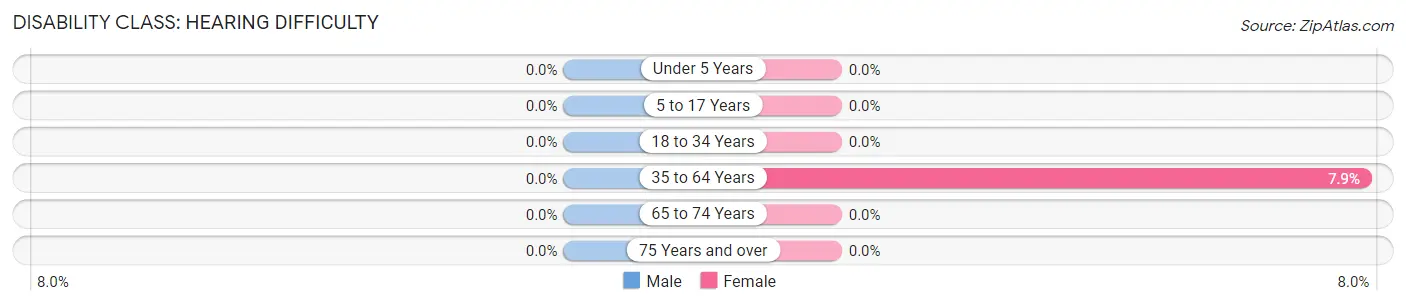
| Age Bracket | Male | Female |
| Under 5 Years | 0 (0.0%) | 0 (0.0%) |
| 5 to 17 Years | 0 (0.0%) | 0 (0.0%) |
| 18 to 34 Years | 0 (0.0%) | 0 (0.0%) |
| 35 to 64 Years | 0 (0.0%) | 7 (7.9%) |
| 65 to 74 Years | 0 (0.0%) | 0 (0.0%) |
| 75 Years and over | 0 (0.0%) | 0 (0.0%) |
Disability Class: Vision Difficulty
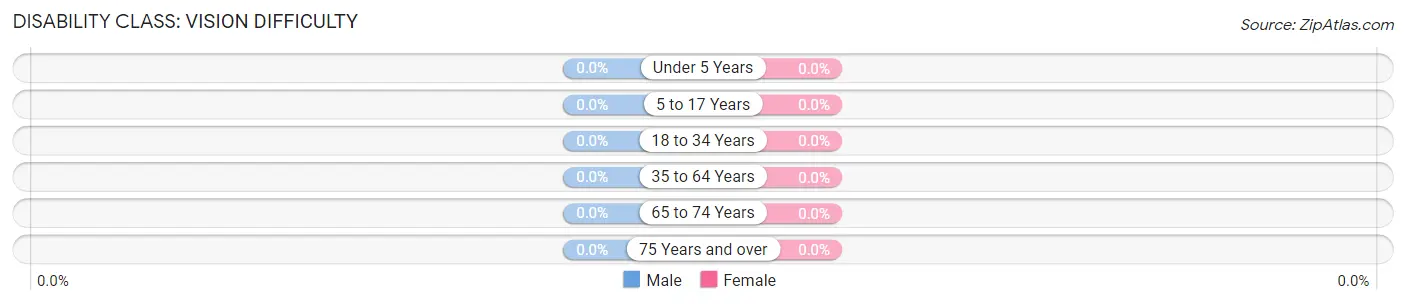
| Age Bracket | Male | Female |
| Under 5 Years | 0 (0.0%) | 0 (0.0%) |
| 5 to 17 Years | 0 (0.0%) | 0 (0.0%) |
| 18 to 34 Years | 0 (0.0%) | 0 (0.0%) |
| 35 to 64 Years | 0 (0.0%) | 0 (0.0%) |
| 65 to 74 Years | 0 (0.0%) | 0 (0.0%) |
| 75 Years and over | 0 (0.0%) | 0 (0.0%) |
Disability Class: Cognitive Difficulty
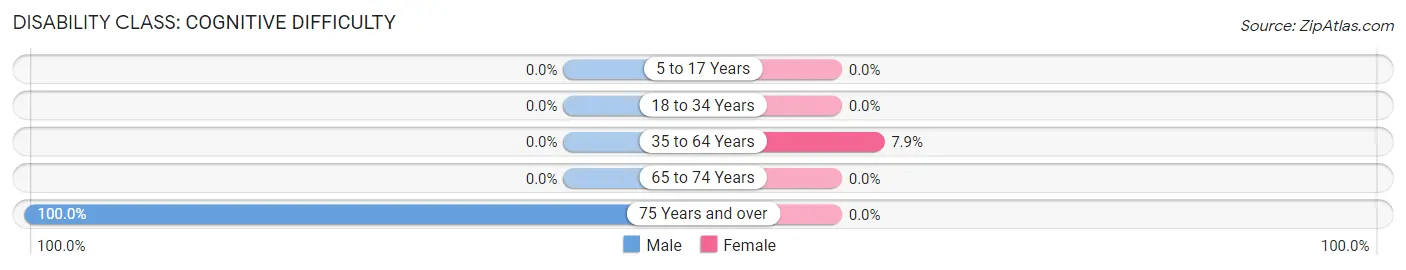
| Age Bracket | Male | Female |
| 5 to 17 Years | 0 (0.0%) | 0 (0.0%) |
| 18 to 34 Years | 0 (0.0%) | 0 (0.0%) |
| 35 to 64 Years | 0 (0.0%) | 7 (7.9%) |
| 65 to 74 Years | 0 (0.0%) | 0 (0.0%) |
| 75 Years and over | 23 (100.0%) | 0 (0.0%) |
Disability Class: Ambulatory Difficulty
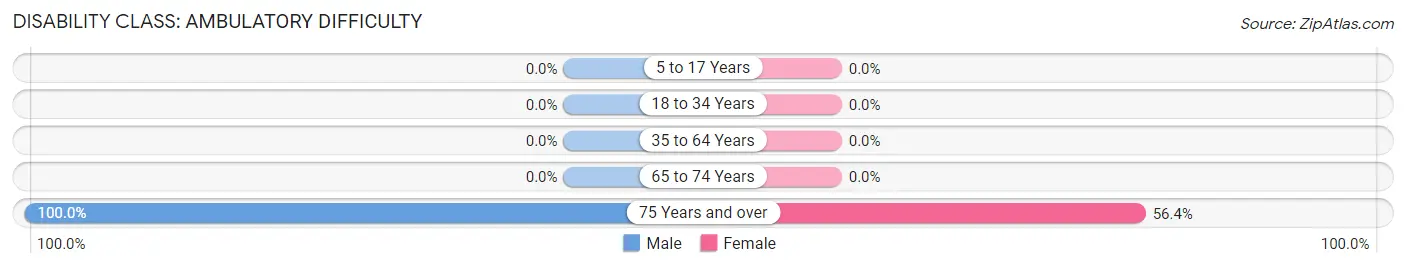
| Age Bracket | Male | Female |
| 5 to 17 Years | 0 (0.0%) | 0 (0.0%) |
| 18 to 34 Years | 0 (0.0%) | 0 (0.0%) |
| 35 to 64 Years | 0 (0.0%) | 0 (0.0%) |
| 65 to 74 Years | 0 (0.0%) | 0 (0.0%) |
| 75 Years and over | 23 (100.0%) | 22 (56.4%) |
Disability Class: Self-Care Difficulty
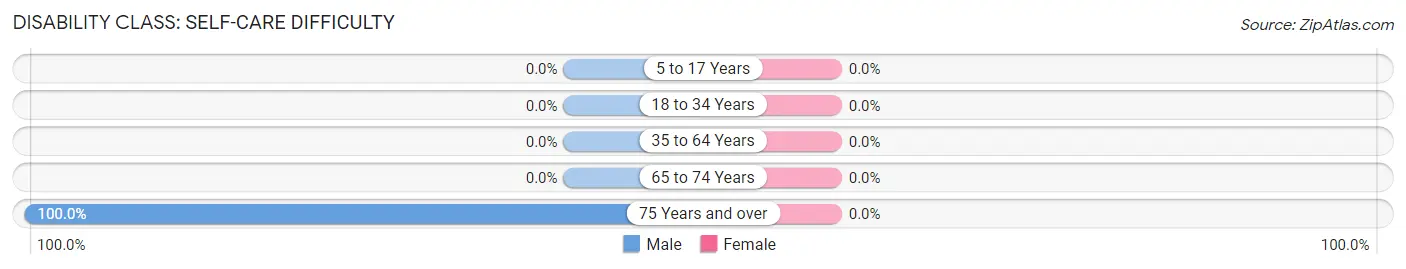
| Age Bracket | Male | Female |
| 5 to 17 Years | 0 (0.0%) | 0 (0.0%) |
| 18 to 34 Years | 0 (0.0%) | 0 (0.0%) |
| 35 to 64 Years | 0 (0.0%) | 0 (0.0%) |
| 65 to 74 Years | 0 (0.0%) | 0 (0.0%) |
| 75 Years and over | 23 (100.0%) | 0 (0.0%) |
Technology Access in Mammoth
Computing Device Access in Mammoth
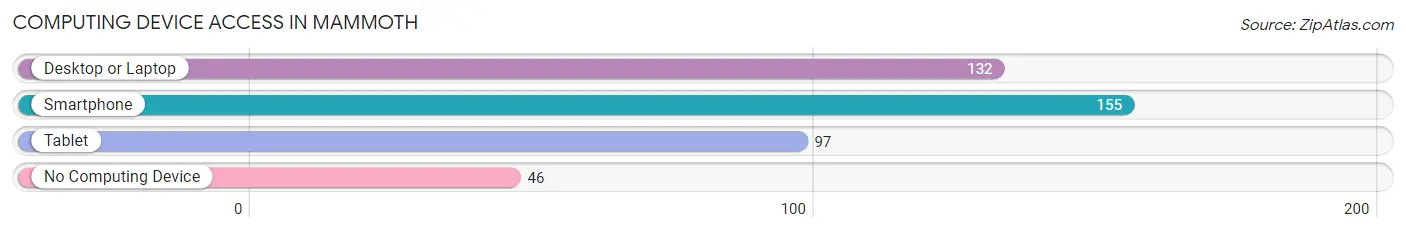
| Device Type | # Households | % Households |
| Desktop or Laptop | 132 | 62.3% |
| Smartphone | 155 | 73.1% |
| Tablet | 97 | 45.8% |
| No Computing Device | 46 | 21.7% |
| Total | 212 | 100.0% |
Internet Access in Mammoth
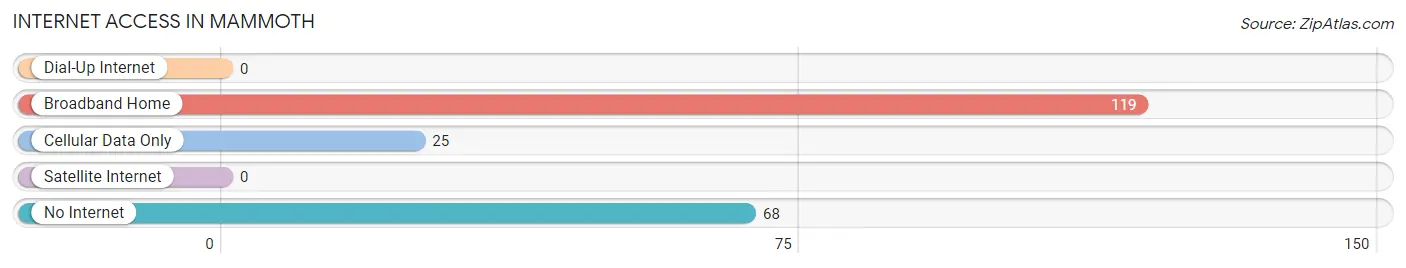
| Internet Type | # Households | % Households |
| Dial-Up Internet | 0 | 0.0% |
| Broadband Home | 119 | 56.1% |
| Cellular Data Only | 25 | 11.8% |
| Satellite Internet | 0 | 0.0% |
| No Internet | 68 | 32.1% |
| Total | 212 | 100.0% |
Mammoth Summary
Mammoth, Pennsylvania is a small borough located in the heart of the Allegheny Mountains in the southwestern corner of the state. It is situated in the Laurel Highlands region of Pennsylvania, and is part of Somerset County. The borough is located approximately 70 miles southeast of Pittsburgh and is bordered by the towns of Jennerstown, Stoystown, and Boswell.
History
Mammoth was first settled in the late 1700s by German and Swiss immigrants. The town was originally known as “Mammoth Springs” due to the large number of natural springs in the area. The town was officially incorporated in 1872 and was named after the nearby Mammoth Cave, which was discovered in the early 1800s.
The town was a popular destination for tourists in the late 1800s and early 1900s, as it was home to several resorts and spas. The resorts were popular for their natural hot springs, which were believed to have healing properties. The resorts also offered a variety of recreational activities, such as fishing, hunting, and horseback riding.
In the early 1900s, the town began to decline in popularity as a tourist destination. This was due to the increasing popularity of nearby resorts in the Laurel Highlands region, such as Seven Springs and Hidden Valley. The decline in tourism led to a decrease in the town’s population, and by the 1950s, the population had dropped to just over 500 people.
Geography
Mammoth is located in the southwestern corner of Pennsylvania, in the Laurel Highlands region. The borough is situated in the Allegheny Mountains, and is surrounded by the towns of Jennerstown, Stoystown, and Boswell. The town is located approximately 70 miles southeast of Pittsburgh.
The borough is situated in a valley, and is surrounded by mountains on all sides. The highest point in the borough is 2,845 feet above sea level, and the lowest point is 1,845 feet above sea level. The borough is home to several creeks and streams, including the Stonycreek River, which flows through the town.
Economy
Mammoth’s economy is largely based on tourism. The town is home to several resorts and spas, which attract visitors from all over the region. The resorts offer a variety of recreational activities, such as fishing, hunting, and horseback riding. The town is also home to several restaurants, shops, and other businesses that cater to tourists.
In addition to tourism, the town is also home to several small businesses, such as auto repair shops, hardware stores, and grocery stores. The town is also home to several manufacturing companies, which produce a variety of products, such as furniture, clothing, and electronics.
Demographics
As of the 2010 census, the population of Mammoth was 1,093. The racial makeup of the borough was 97.3% White, 0.7% African American, 0.2% Native American, 0.2% Asian, 0.2% from other races, and 1.4% from two or more races. Hispanic or Latino of any race were 0.7% of the population.
The median household income in Mammoth was $37,500, and the median family income was $45,000. The per capita income for the borough was $19,000. About 11.3% of families and 14.2% of the population were below the poverty line, including 18.2% of those under age 18 and 8.3% of those age 65 or over.
Common Questions
What is Per Capita Income in Mammoth?
Per Capita income in Mammoth is $45,126.
What is the Median Family Income in Mammoth?
Median Family Income in Mammoth is $49,716.
What is the Median Household income in Mammoth?
Median Household Income in Mammoth is $49,545.
What is Income or Wage Gap in Mammoth?
Income or Wage Gap in Mammoth is 34.0%.
Women in Mammoth earn 66.0 cents for every dollar earned by a man.
What is Inequality or Gini Index in Mammoth?
Inequality or Gini Index in Mammoth is 0.50.
What is the Total Population of Mammoth?
Total Population of Mammoth is 391.
What is the Total Male Population of Mammoth?
Total Male Population of Mammoth is 167.
What is the Total Female Population of Mammoth?
Total Female Population of Mammoth is 224.
What is the Ratio of Males per 100 Females in Mammoth?
There are 74.55 Males per 100 Females in Mammoth.
What is the Ratio of Females per 100 Males in Mammoth?
There are 134.13 Females per 100 Males in Mammoth.
What is the Median Population Age in Mammoth?
Median Population Age in Mammoth is 57.8 Years.
What is the Average Family Size in Mammoth
Average Family Size in Mammoth is 2.5 People.
What is the Average Household Size in Mammoth
Average Household Size in Mammoth is 1.8 People.
How Large is the Labor Force in Mammoth?
There are 201 People in the Labor Forcein in Mammoth.
What is the Percentage of People in the Labor Force in Mammoth?
54.0% of People are in the Labor Force in Mammoth.