Zip Codes with the Highest Percentage of Population Employed in Administrative & Support Services in Levittown, PA
RELATED REPORTS & OPTIONS
Administrative & Support Services
Levittown
Compare Zip Codes
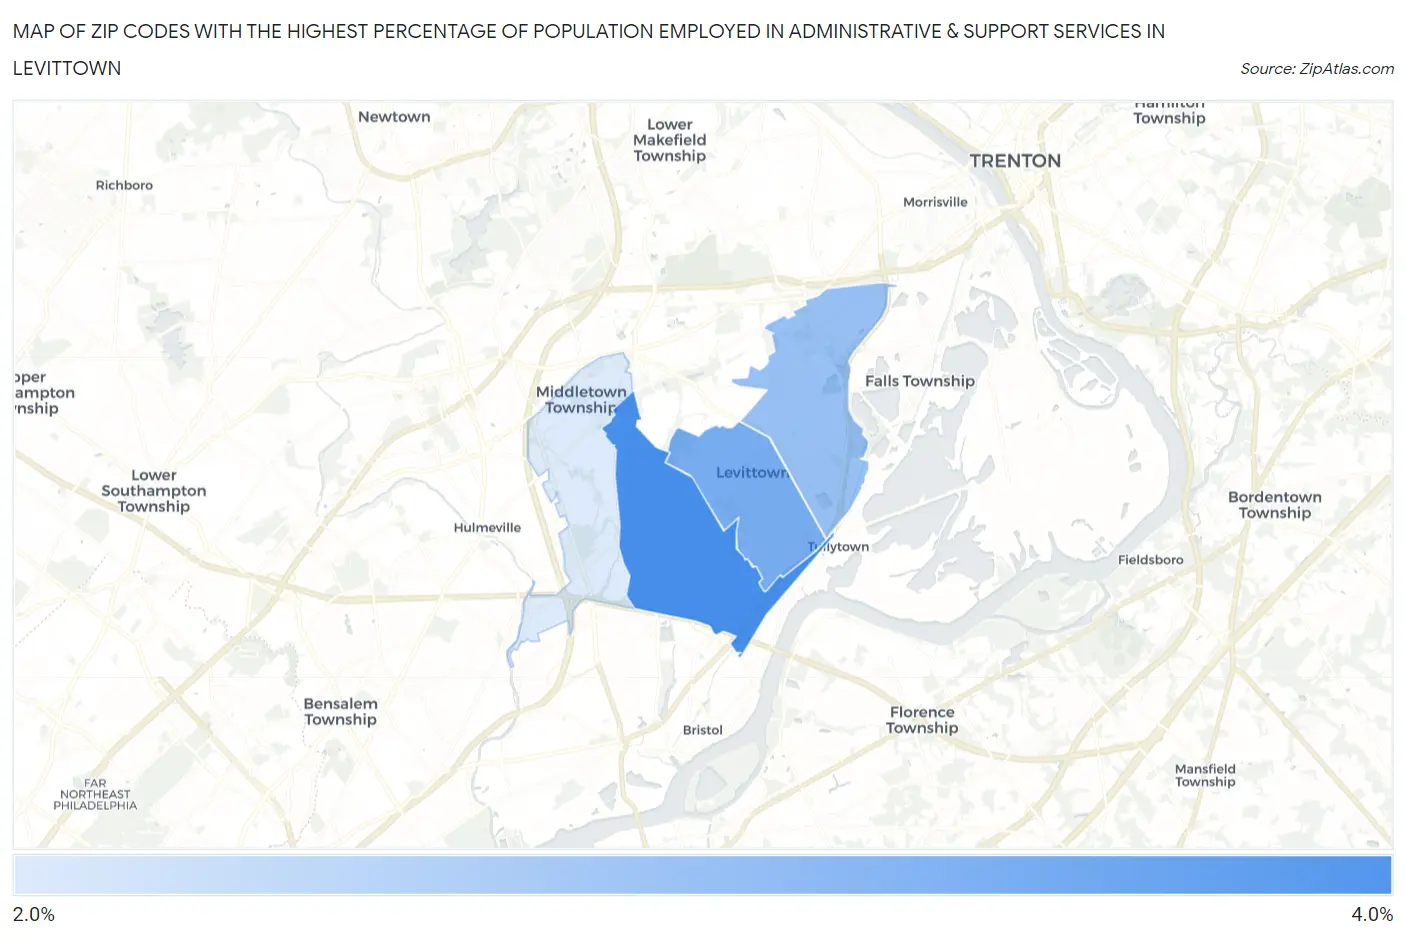
Map of Zip Codes with the Highest Percentage of Population Employed in Administrative & Support Services in Levittown
2.7%
4.0%
Zip Codes with the Highest Percentage of Population Employed in Administrative & Support Services in Levittown, PA
| Zip Code | % Employed | vs State | vs National | |
| 1. | 19057 | 4.0% | 3.6%(+0.398)#509 | 4.1%(-0.167)#10,775 |
| 2. | 19055 | 3.6% | 3.6%(-0.001)#619 | 4.1%(-0.565)#12,546 |
| 3. | 19054 | 3.3% | 3.6%(-0.266)#702 | 4.1%(-0.830)#13,851 |
| 4. | 19056 | 2.7% | 3.6%(-0.842)#906 | 4.1%(-1.41)#16,871 |
1
Common Questions
What are the Top 3 Zip Codes with the Highest Percentage of Population Employed in Administrative & Support Services in Levittown, PA?
Top 3 Zip Codes with the Highest Percentage of Population Employed in Administrative & Support Services in Levittown, PA are:
What zip code has the Highest Percentage of Population Employed in Administrative & Support Services in Levittown, PA?
19057 has the Highest Percentage of Population Employed in Administrative & Support Services in Levittown, PA with 4.0%.
What is the Percentage of Population Employed in Administrative & Support Services in Levittown, PA?
Percentage of Population Employed in Administrative & Support Services in Levittown is 3.4%.
What is the Percentage of Population Employed in Administrative & Support Services in Pennsylvania?
Percentage of Population Employed in Administrative & Support Services in Pennsylvania is 3.6%.
What is the Percentage of Population Employed in Administrative & Support Services in the United States?
Percentage of Population Employed in Administrative & Support Services in the United States is 4.1%.