Heidlersburg, PA Map & Demographics
Heidlersburg Map
Heidlersburg Overview
$34,582
PER CAPITA INCOME
$90,481
AVG FAMILY INCOME
$41,875
AVG HOUSEHOLD INCOME
13.0%
WAGE / INCOME GAP [ % ]
87.0¢/ $1
WAGE / INCOME GAP [ $ ]
0.44
INEQUALITY / GINI INDEX
450
TOTAL POPULATION
209
MALE POPULATION
241
FEMALE POPULATION
86.72
MALES / 100 FEMALES
115.31
FEMALES / 100 MALES
62.4
MEDIAN AGE
2.8
AVG FAMILY SIZE
1.8
AVG HOUSEHOLD SIZE
230
LABOR FORCE [ PEOPLE ]
56.8%
PERCENT IN LABOR FORCE
7.7%
UNEMPLOYMENT RATE
Income in Heidlersburg
Income Overview in Heidlersburg
Per Capita Income in Heidlersburg is $34,582, while median incomes of families and households are $90,481 and $41,875 respectively.
| Characteristic | Number | Measure |
| Per Capita Income | 450 | $34,582 |
| Median Family Income | 103 | $90,481 |
| Mean Family Income | 103 | $93,867 |
| Median Household Income | 257 | $41,875 |
| Mean Household Income | 257 | $58,542 |
| Income Deficit | 103 | $0 |
| Wage / Income Gap (%) | 450 | 12.96% |
| Wage / Income Gap ($) | 450 | 87.04¢ per $1 |
| Gini / Inequality Index | 450 | 0.44 |
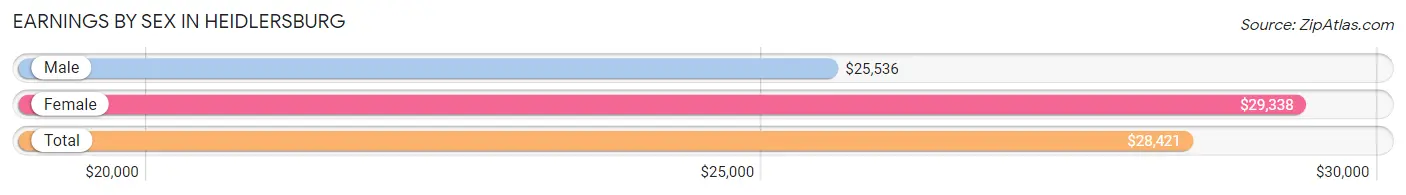
Earnings by Sex in Heidlersburg
Average Earnings in Heidlersburg are $28,421, $25,536 for men and $29,338 for women, a difference of 13.0%.
| Sex | Number | Average Earnings |
| Male | 125 (57.3%) | $25,536 |
| Female | 93 (42.7%) | $29,338 |
| Total | 218 (100.0%) | $28,421 |
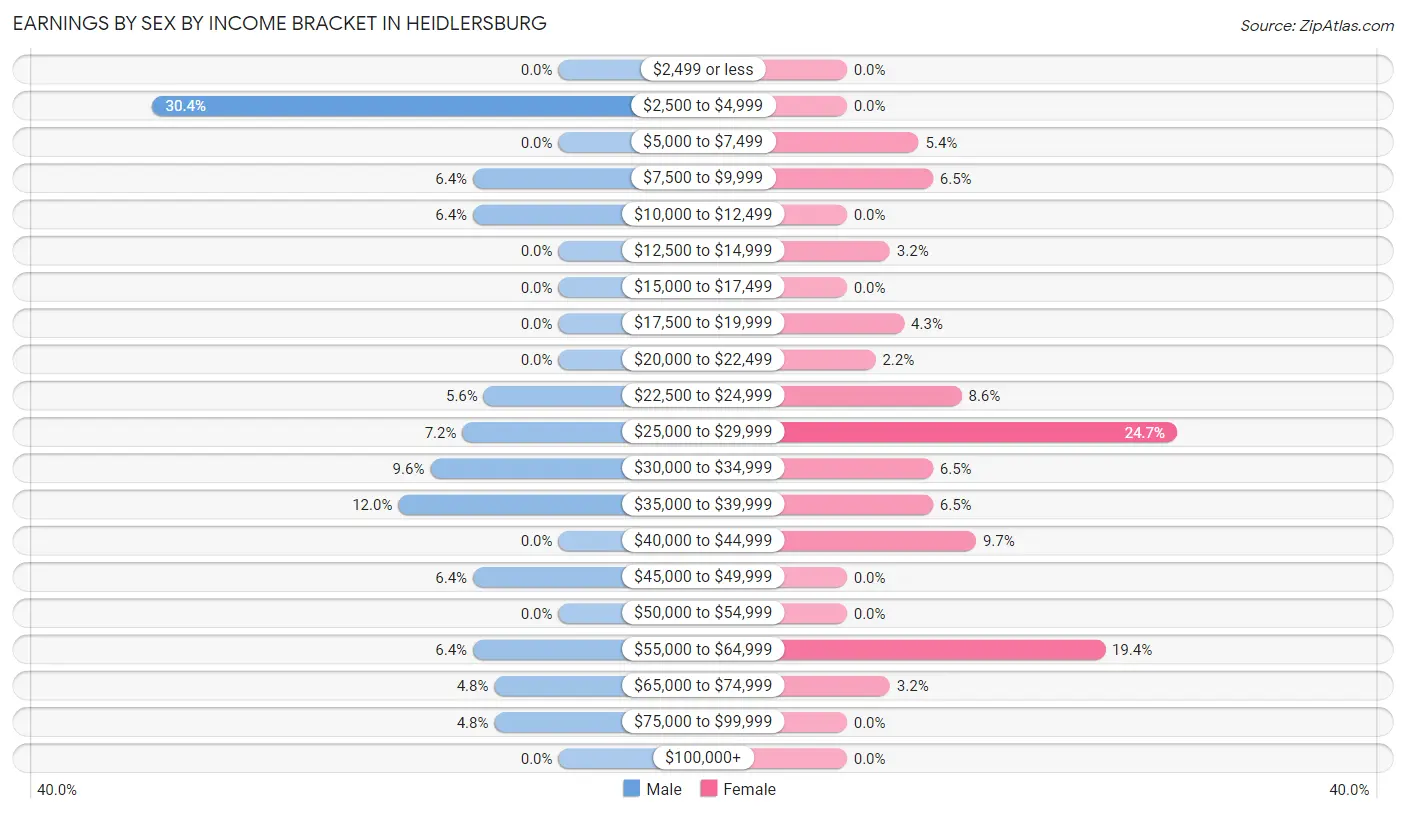
Earnings by Sex by Income Bracket in Heidlersburg
The most common earnings brackets in Heidlersburg are $2,500 to $4,999 for men (38 | 30.4%) and $25,000 to $29,999 for women (23 | 24.7%).
| Income | Male | Female |
| $2,499 or less | 0 (0.0%) | 0 (0.0%) |
| $2,500 to $4,999 | 38 (30.4%) | 0 (0.0%) |
| $5,000 to $7,499 | 0 (0.0%) | 5 (5.4%) |
| $7,500 to $9,999 | 8 (6.4%) | 6 (6.5%) |
| $10,000 to $12,499 | 8 (6.4%) | 0 (0.0%) |
| $12,500 to $14,999 | 0 (0.0%) | 3 (3.2%) |
| $15,000 to $17,499 | 0 (0.0%) | 0 (0.0%) |
| $17,500 to $19,999 | 0 (0.0%) | 4 (4.3%) |
| $20,000 to $22,499 | 0 (0.0%) | 2 (2.1%) |
| $22,500 to $24,999 | 7 (5.6%) | 8 (8.6%) |
| $25,000 to $29,999 | 9 (7.2%) | 23 (24.7%) |
| $30,000 to $34,999 | 12 (9.6%) | 6 (6.5%) |
| $35,000 to $39,999 | 15 (12.0%) | 6 (6.5%) |
| $40,000 to $44,999 | 0 (0.0%) | 9 (9.7%) |
| $45,000 to $49,999 | 8 (6.4%) | 0 (0.0%) |
| $50,000 to $54,999 | 0 (0.0%) | 0 (0.0%) |
| $55,000 to $64,999 | 8 (6.4%) | 18 (19.4%) |
| $65,000 to $74,999 | 6 (4.8%) | 3 (3.2%) |
| $75,000 to $99,999 | 6 (4.8%) | 0 (0.0%) |
| $100,000+ | 0 (0.0%) | 0 (0.0%) |
| Total | 125 (100.0%) | 93 (100.0%) |
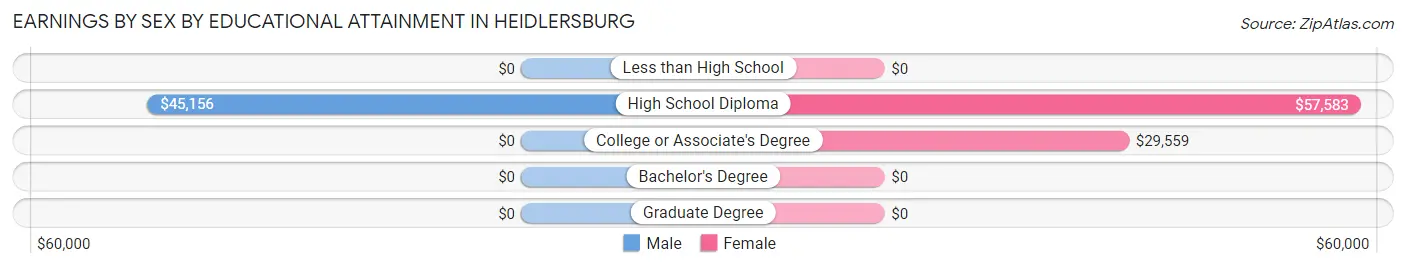
Earnings by Sex by Educational Attainment in Heidlersburg
Average earnings in Heidlersburg are $25,357 for men and $29,926 for women, a difference of 15.3%. Men with an educational attainment of high school diploma enjoy the highest average annual earnings of $45,156, while those with high school diploma education earn the least with $45,156. Women with an educational attainment of high school diploma earn the most with the average annual earnings of $57,583, while those with college or associate's degree education have the smallest earnings of $29,559.
| Educational Attainment | Male Income | Female Income |
| Less than High School | - | - |
| High School Diploma | $45,156 | $57,583 |
| College or Associate's Degree | - | - |
| Bachelor's Degree | - | - |
| Graduate Degree | - | - |
| Total | $25,357 | $29,926 |
Family Income in Heidlersburg
Family Income Brackets in Heidlersburg
According to the Heidlersburg family income data, there are 30 families falling into the $150,000 to $199,999 income range, which is the most common income bracket and makes up 29.1% of all families.
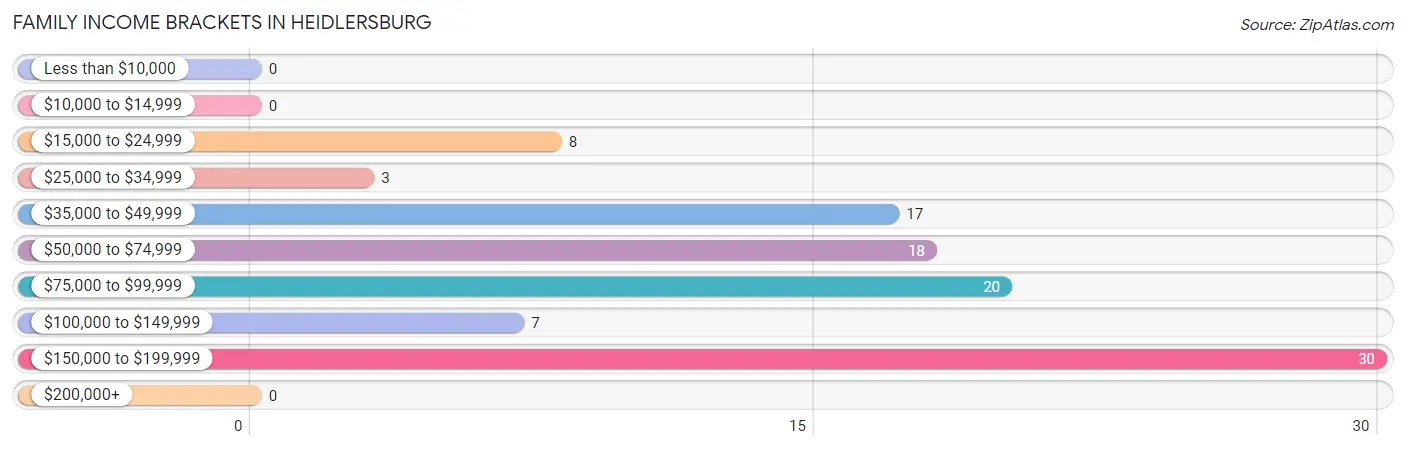
| Income Bracket | # Families | % Families |
| Less than $10,000 | 0 | 0.0% |
| $10,000 to $14,999 | 0 | 0.0% |
| $15,000 to $24,999 | 8 | 7.8% |
| $25,000 to $34,999 | 3 | 2.9% |
| $35,000 to $49,999 | 17 | 16.5% |
| $50,000 to $74,999 | 18 | 17.5% |
| $75,000 to $99,999 | 20 | 19.4% |
| $100,000 to $149,999 | 7 | 6.8% |
| $150,000 to $199,999 | 30 | 29.1% |
| $200,000+ | 0 | 0.0% |
Family Income by Famaliy Size in Heidlersburg
4-person families (16 | 15.5%) account for the highest median family income in Heidlersburg with $51,563 per family, while 4-person families (16 | 15.5%) have the highest median income of $12,891 per family member.
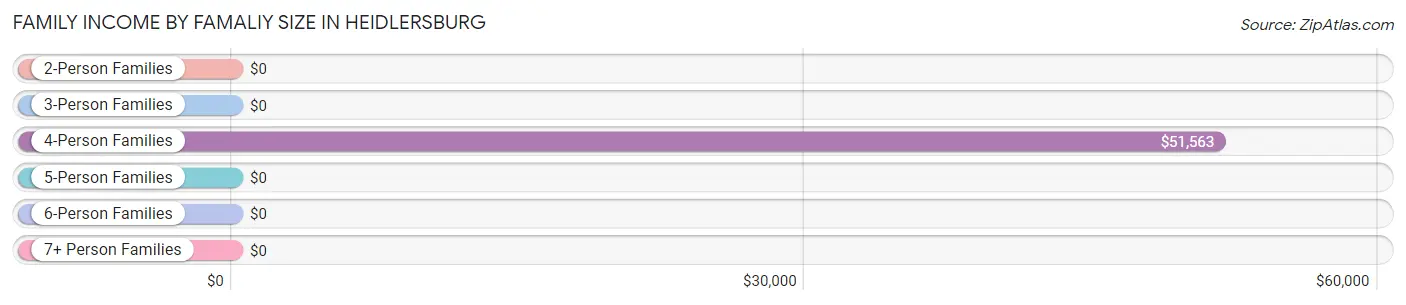
| Income Bracket | # Families | Median Income |
| 2-Person Families | 60 (58.3%) | $0 |
| 3-Person Families | 20 (19.4%) | $0 |
| 4-Person Families | 16 (15.5%) | $51,563 |
| 5-Person Families | 7 (6.8%) | $0 |
| 6-Person Families | 0 (0.0%) | $0 |
| 7+ Person Families | 0 (0.0%) | $0 |
| Total | 103 (100.0%) | $90,481 |
Family Income by Number of Earners in Heidlersburg
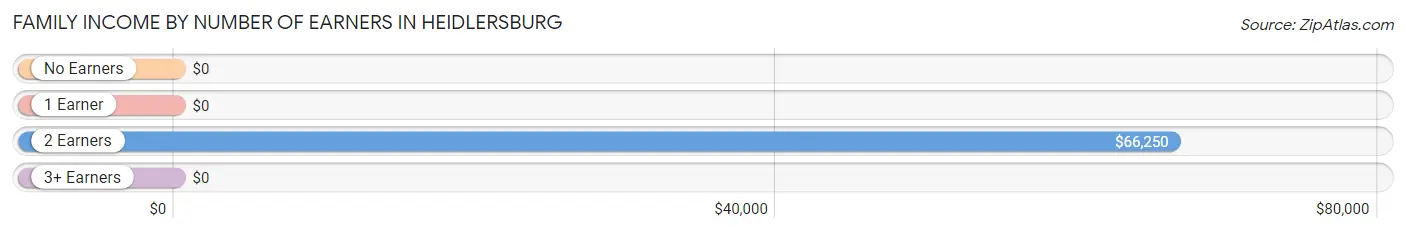
| Number of Earners | # Families | Median Income |
| No Earners | 14 (13.6%) | $0 |
| 1 Earner | 65 (63.1%) | $0 |
| 2 Earners | 12 (11.7%) | $66,250 |
| 3+ Earners | 12 (11.7%) | $0 |
| Total | 103 (100.0%) | $90,481 |
Household Income in Heidlersburg
Household Income Brackets in Heidlersburg
With 45 households falling in the category, the $50,000 to $74,999 income range is the most frequent in Heidlersburg, accounting for 17.5% of all households.
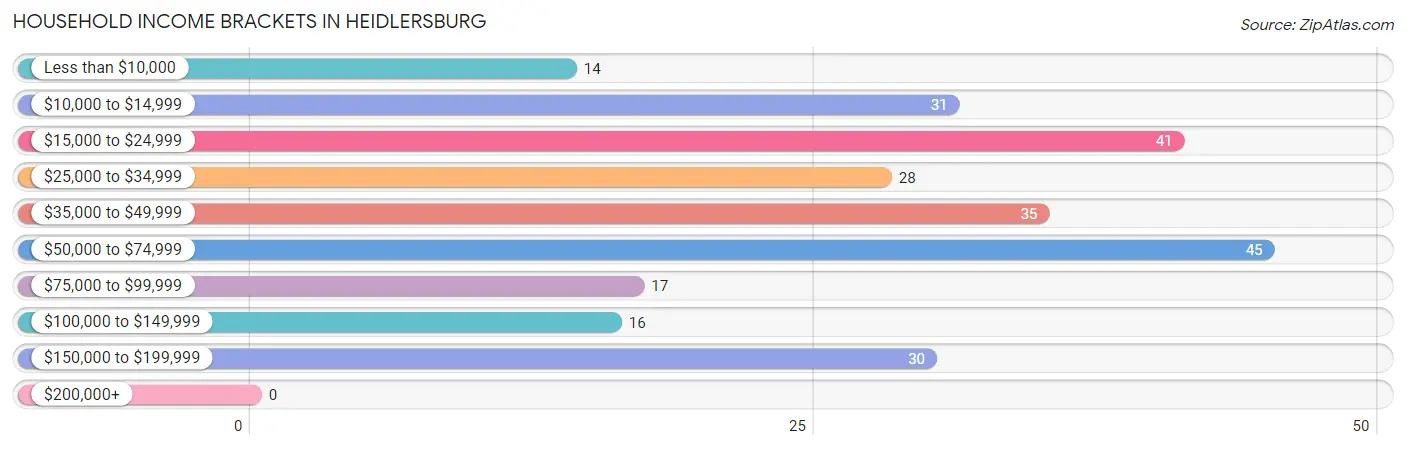
| Income Bracket | # Households | % Households |
| Less than $10,000 | 14 | 5.4% |
| $10,000 to $14,999 | 31 | 12.1% |
| $15,000 to $24,999 | 41 | 16.0% |
| $25,000 to $34,999 | 28 | 10.9% |
| $35,000 to $49,999 | 35 | 13.6% |
| $50,000 to $74,999 | 45 | 17.5% |
| $75,000 to $99,999 | 17 | 6.6% |
| $100,000 to $149,999 | 16 | 6.2% |
| $150,000 to $199,999 | 30 | 11.7% |
| $200,000+ | 0 | 0.0% |
Household Income by Householder Age in Heidlersburg
The median household income in Heidlersburg is $41,875, with the highest median household income of $66,667 found in the 45 to 64 years age bracket for the primary householder. A total of 82 households (31.9%) fall into this category.
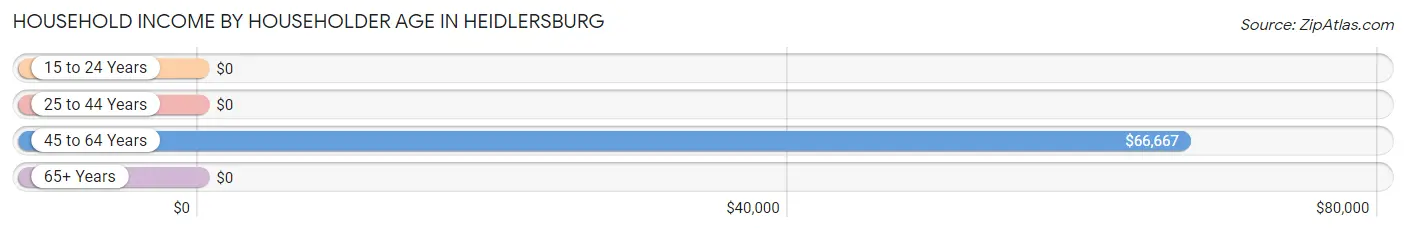
| Income Bracket | # Households | Median Income |
| 15 to 24 Years | 0 (0.0%) | $0 |
| 25 to 44 Years | 29 (11.3%) | $0 |
| 45 to 64 Years | 82 (31.9%) | $66,667 |
| 65+ Years | 146 (56.8%) | $0 |
| Total | 257 (100.0%) | $41,875 |
Poverty in Heidlersburg
Income Below Poverty by Sex and Age in Heidlersburg
With 6.7% poverty level for males and 12.9% for females among the residents of Heidlersburg, 65 to 74 year old males and 75 year old and over females are the most vulnerable to poverty, with 14 males (18.7%) and 31 females (70.5%) in their respective age groups living below the poverty level.
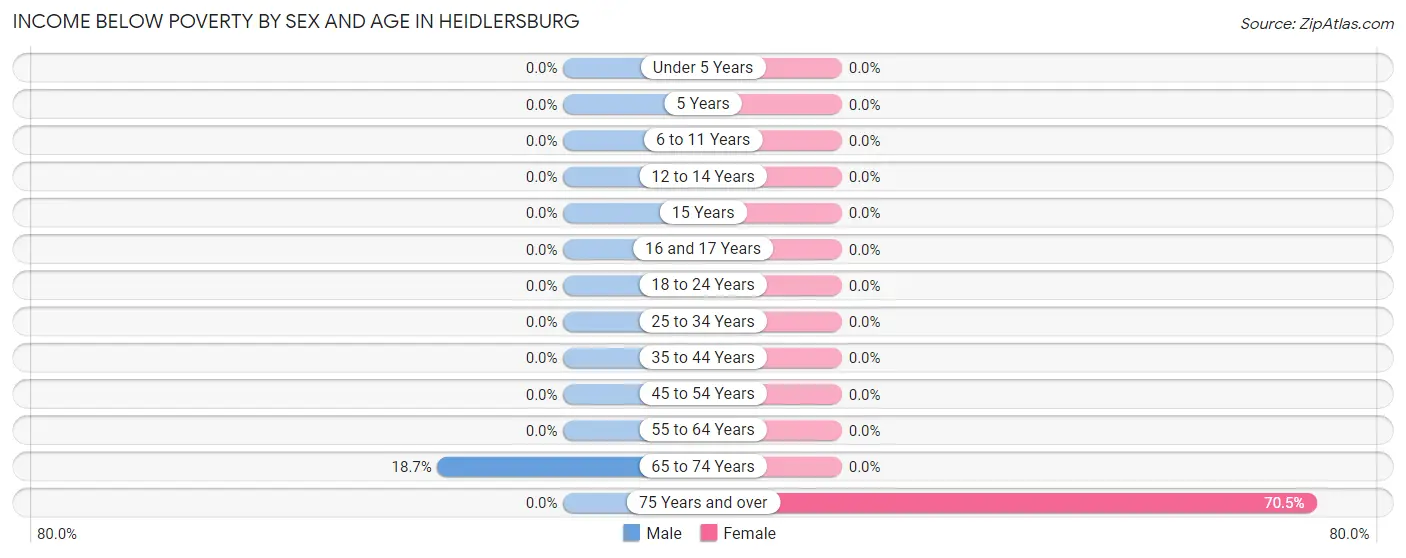
| Age Bracket | Male | Female |
| Under 5 Years | 0 (0.0%) | 0 (0.0%) |
| 5 Years | 0 (0.0%) | 0 (0.0%) |
| 6 to 11 Years | 0 (0.0%) | 0 (0.0%) |
| 12 to 14 Years | 0 (0.0%) | 0 (0.0%) |
| 15 Years | 0 (0.0%) | 0 (0.0%) |
| 16 and 17 Years | 0 (0.0%) | 0 (0.0%) |
| 18 to 24 Years | 0 (0.0%) | 0 (0.0%) |
| 25 to 34 Years | 0 (0.0%) | 0 (0.0%) |
| 35 to 44 Years | 0 (0.0%) | 0 (0.0%) |
| 45 to 54 Years | 0 (0.0%) | 0 (0.0%) |
| 55 to 64 Years | 0 (0.0%) | 0 (0.0%) |
| 65 to 74 Years | 14 (18.7%) | 0 (0.0%) |
| 75 Years and over | 0 (0.0%) | 31 (70.5%) |
| Total | 14 (6.7%) | 31 (12.9%) |
Income Above Poverty by Sex and Age in Heidlersburg
According to the poverty statistics in Heidlersburg, males aged under 5 years and females aged under 5 years are the age groups that are most secure financially, with 100.0% of males and 100.0% of females in these age groups living above the poverty line.
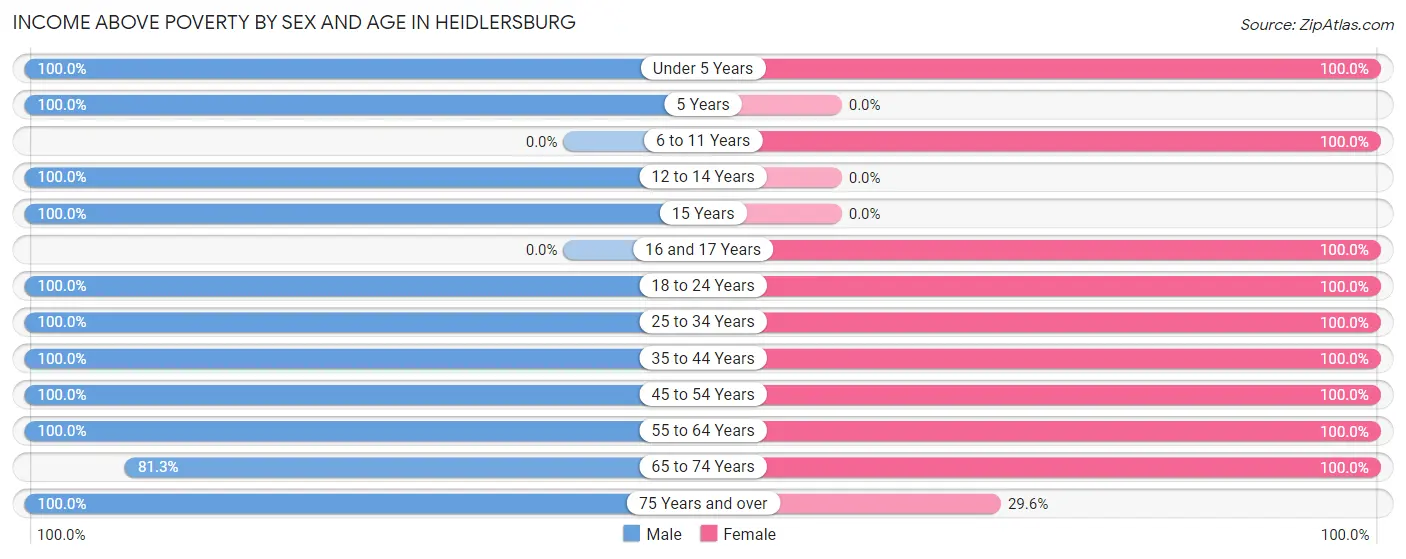
| Age Bracket | Male | Female |
| Under 5 Years | 3 (100.0%) | 7 (100.0%) |
| 5 Years | 6 (100.0%) | 0 (0.0%) |
| 6 to 11 Years | 0 (0.0%) | 12 (100.0%) |
| 12 to 14 Years | 8 (100.0%) | 0 (0.0%) |
| 15 Years | 9 (100.0%) | 0 (0.0%) |
| 16 and 17 Years | 0 (0.0%) | 12 (100.0%) |
| 18 to 24 Years | 17 (100.0%) | 2 (100.0%) |
| 25 to 34 Years | 10 (100.0%) | 15 (100.0%) |
| 35 to 44 Years | 19 (100.0%) | 3 (100.0%) |
| 45 to 54 Years | 20 (100.0%) | 57 (100.0%) |
| 55 to 64 Years | 34 (100.0%) | 19 (100.0%) |
| 65 to 74 Years | 61 (81.3%) | 70 (100.0%) |
| 75 Years and over | 8 (100.0%) | 13 (29.5%) |
| Total | 195 (93.3%) | 210 (87.1%) |
Income Below Poverty Among Married-Couple Families in Heidlersburg
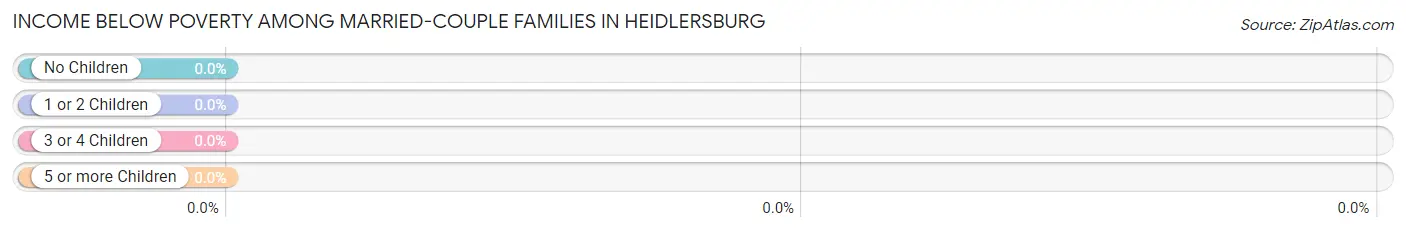
| Children | Above Poverty | Below Poverty |
| No Children | 62 (100.0%) | 0 (0.0%) |
| 1 or 2 Children | 25 (100.0%) | 0 (0.0%) |
| 3 or 4 Children | 0 (0.0%) | 0 (0.0%) |
| 5 or more Children | 0 (0.0%) | 0 (0.0%) |
| Total | 87 (100.0%) | 0 (0.0%) |
Income Below Poverty Among Single-Parent Households in Heidlersburg
| Children | Single Father | Single Mother |
| No Children | 0 (0.0%) | 0 (0.0%) |
| 1 or 2 Children | 0 (0.0%) | 0 (0.0%) |
| 3 or 4 Children | 0 (0.0%) | 0 (0.0%) |
| 5 or more Children | 0 (0.0%) | 0 (0.0%) |
| Total | 0 (0.0%) | 0 (0.0%) |
Income Below Poverty Among Married-Couple vs Single-Parent Households in Heidlersburg
| Children | Married-Couple Families | Single-Parent Households |
| No Children | 0 (0.0%) | 0 (0.0%) |
| 1 or 2 Children | 0 (0.0%) | 0 (0.0%) |
| 3 or 4 Children | 0 (0.0%) | 0 (0.0%) |
| 5 or more Children | 0 (0.0%) | 0 (0.0%) |
| Total | 0 (0.0%) | 0 (0.0%) |
Race in Heidlersburg
The most populous races in Heidlersburg are White / Caucasian (427 | 94.9%), Hispanic or Latino (35 | 7.8%), and Two or more Races (15 | 3.3%).
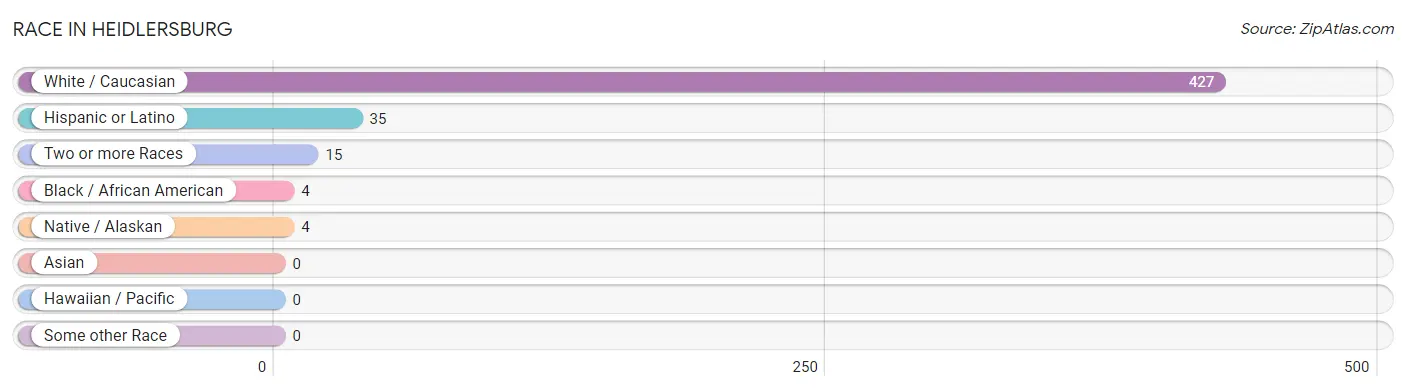
| Race | # Population | % Population |
| Asian | 0 | 0.0% |
| Black / African American | 4 | 0.9% |
| Hawaiian / Pacific | 0 | 0.0% |
| Hispanic or Latino | 35 | 7.8% |
| Native / Alaskan | 4 | 0.9% |
| White / Caucasian | 427 | 94.9% |
| Two or more Races | 15 | 3.3% |
| Some other Race | 0 | 0.0% |
| Total | 450 | 100.0% |
Ancestry in Heidlersburg
The most populous ancestries reported in Heidlersburg are German (152 | 33.8%), Irish (66 | 14.7%), Scotch-Irish (45 | 10.0%), Italian (36 | 8.0%), and Puerto Rican (31 | 6.9%), together accounting for 73.3% of all Heidlersburg residents.
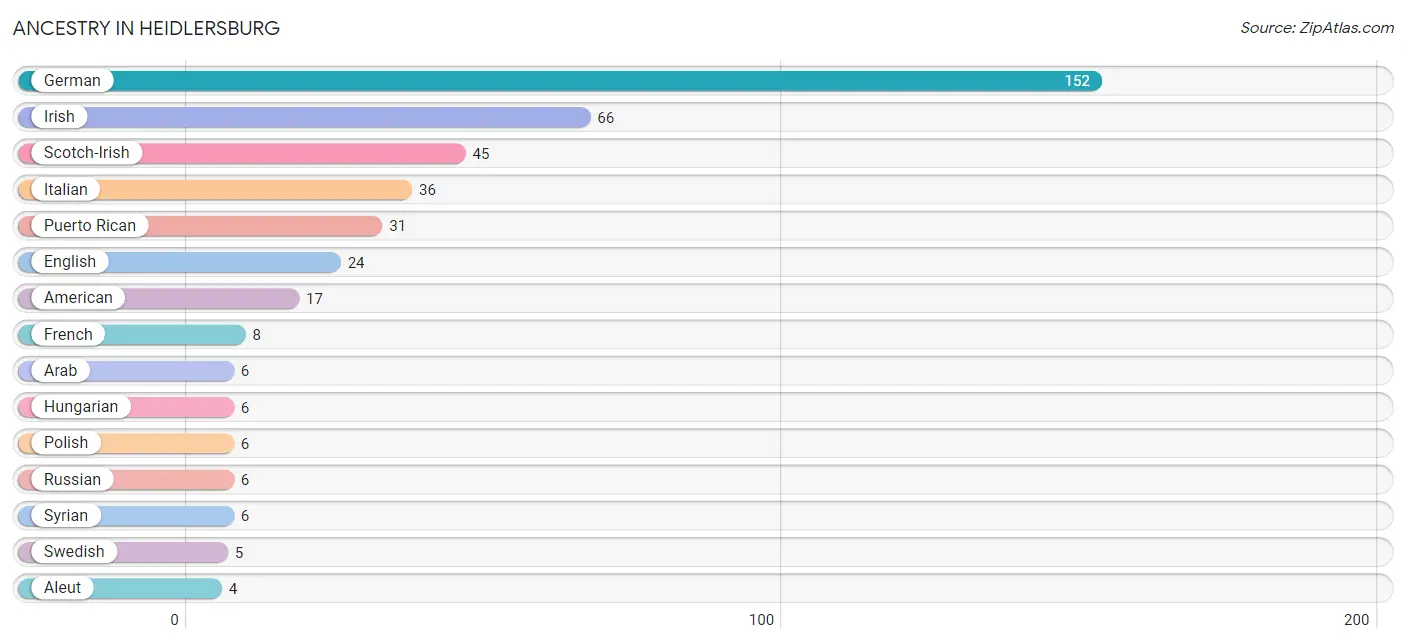
| Ancestry | # Population | % Population |
| Aleut | 4 | 0.9% |
| American | 17 | 3.8% |
| Arab | 6 | 1.3% |
| Cherokee | 3 | 0.7% |
| English | 24 | 5.3% |
| French | 8 | 1.8% |
| German | 152 | 33.8% |
| Hungarian | 6 | 1.3% |
| Irish | 66 | 14.7% |
| Italian | 36 | 8.0% |
| Mexican | 4 | 0.9% |
| Polish | 6 | 1.3% |
| Puerto Rican | 31 | 6.9% |
| Russian | 6 | 1.3% |
| Scotch-Irish | 45 | 10.0% |
| Swedish | 5 | 1.1% |
| Syrian | 6 | 1.3% | View All 17 Rows |
Immigrants in Heidlersburg
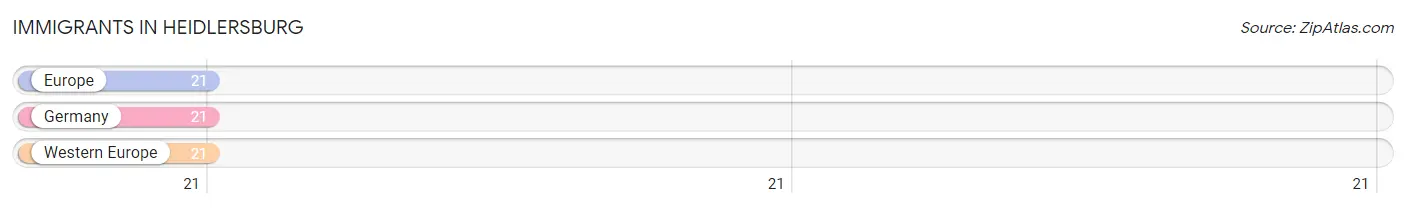
The most numerous immigrant groups reported in Heidlersburg came from Europe (21 | 4.7%), Germany (21 | 4.7%), and Western Europe (21 | 4.7%), together accounting for 14.0% of all Heidlersburg residents.
| Immigration Origin | # Population | % Population |
| Europe | 21 | 4.7% |
| Germany | 21 | 4.7% |
| Western Europe | 21 | 4.7% | View All 3 Rows |
Sex and Age in Heidlersburg
Sex and Age in Heidlersburg
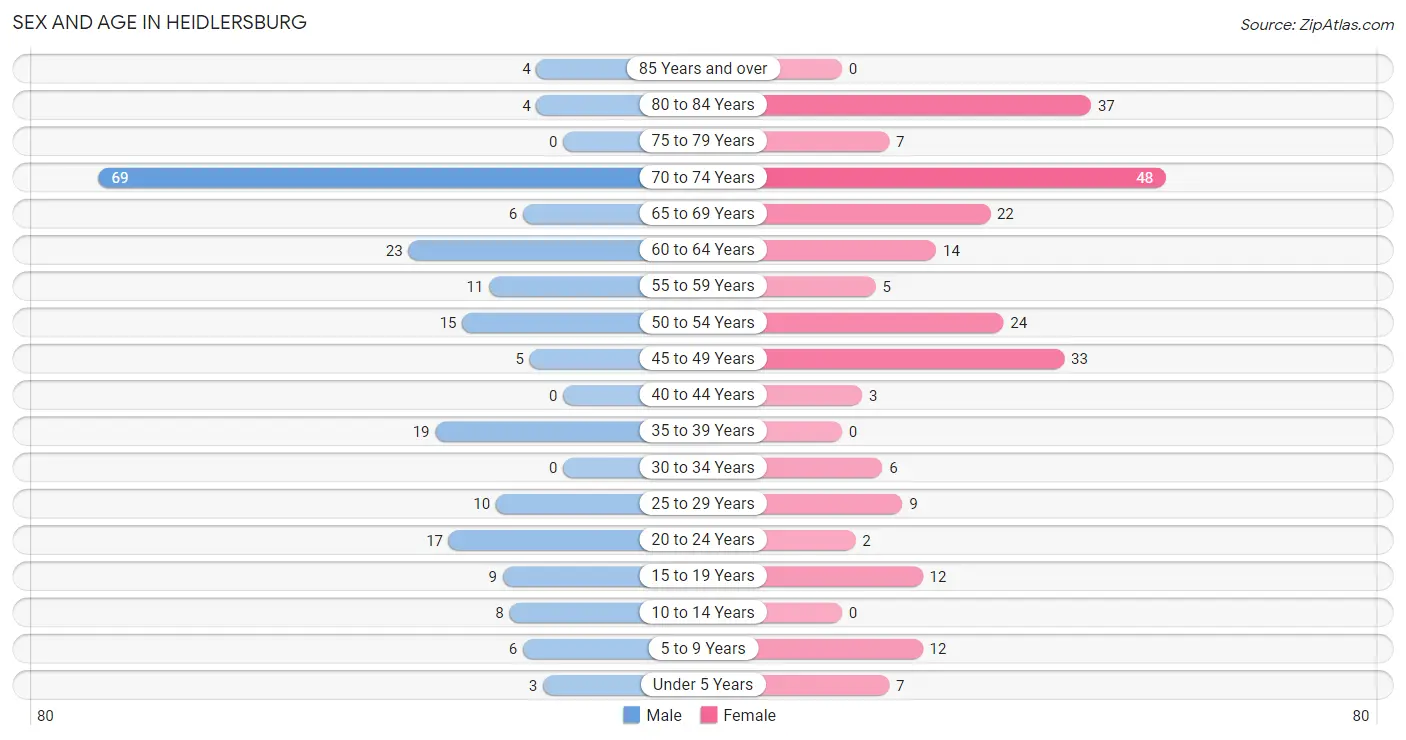
The most populous age groups in Heidlersburg are 70 to 74 Years (69 | 33.0%) for men and 70 to 74 Years (48 | 19.9%) for women.
| Age Bracket | Male | Female |
| Under 5 Years | 3 (1.4%) | 7 (2.9%) |
| 5 to 9 Years | 6 (2.9%) | 12 (5.0%) |
| 10 to 14 Years | 8 (3.8%) | 0 (0.0%) |
| 15 to 19 Years | 9 (4.3%) | 12 (5.0%) |
| 20 to 24 Years | 17 (8.1%) | 2 (0.8%) |
| 25 to 29 Years | 10 (4.8%) | 9 (3.7%) |
| 30 to 34 Years | 0 (0.0%) | 6 (2.5%) |
| 35 to 39 Years | 19 (9.1%) | 0 (0.0%) |
| 40 to 44 Years | 0 (0.0%) | 3 (1.2%) |
| 45 to 49 Years | 5 (2.4%) | 33 (13.7%) |
| 50 to 54 Years | 15 (7.2%) | 24 (10.0%) |
| 55 to 59 Years | 11 (5.3%) | 5 (2.1%) |
| 60 to 64 Years | 23 (11.0%) | 14 (5.8%) |
| 65 to 69 Years | 6 (2.9%) | 22 (9.1%) |
| 70 to 74 Years | 69 (33.0%) | 48 (19.9%) |
| 75 to 79 Years | 0 (0.0%) | 7 (2.9%) |
| 80 to 84 Years | 4 (1.9%) | 37 (15.3%) |
| 85 Years and over | 4 (1.9%) | 0 (0.0%) |
| Total | 209 (100.0%) | 241 (100.0%) |
Families and Households in Heidlersburg
Median Family Size in Heidlersburg
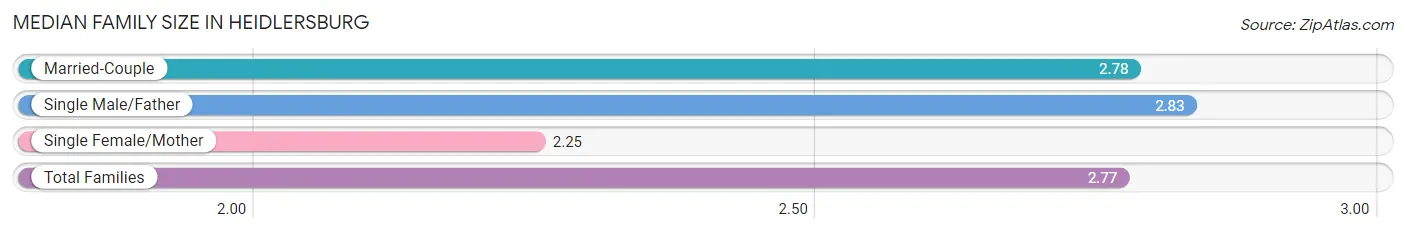
The median family size in Heidlersburg is 2.77 persons per family, with single male/father families (12 | 11.7%) accounting for the largest median family size of 2.83 persons per family. On the other hand, single female/mother families (4 | 3.9%) represent the smallest median family size with 2.25 persons per family.
| Family Type | # Families | Family Size |
| Married-Couple | 87 (84.5%) | 2.78 |
| Single Male/Father | 12 (11.7%) | 2.83 |
| Single Female/Mother | 4 (3.9%) | 2.25 |
| Total Families | 103 (100.0%) | 2.77 |
Median Household Size in Heidlersburg
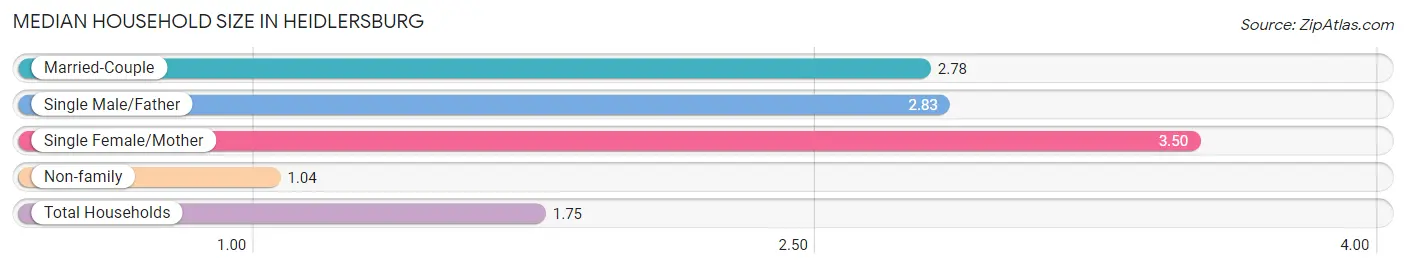
The median household size in Heidlersburg is 1.75 persons per household, with single female/mother households (4 | 1.6%) accounting for the largest median household size of 3.5 persons per household. non-family households (154 | 59.9%) represent the smallest median household size with 1.04 persons per household.
| Household Type | # Households | Household Size |
| Married-Couple | 87 (33.9%) | 2.78 |
| Single Male/Father | 12 (4.7%) | 2.83 |
| Single Female/Mother | 4 (1.6%) | 3.50 |
| Non-family | 154 (59.9%) | 1.04 |
| Total Households | 257 (100.0%) | 1.75 |
Household Size by Marriage Status in Heidlersburg
Out of a total of 257 households in Heidlersburg, 103 (40.1%) are family households, while 154 (59.9%) are nonfamily households. The most numerous type of family households are 2-person households, comprising 57, and the most common type of nonfamily households are 1-person households, comprising 148.
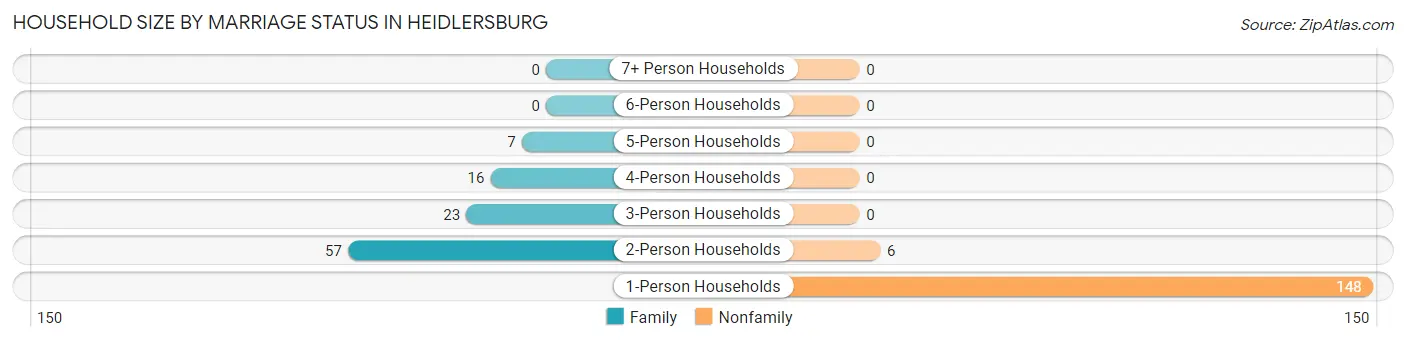
| Household Size | Family Households | Nonfamily Households |
| 1-Person Households | - | 148 (57.6%) |
| 2-Person Households | 57 (22.2%) | 6 (2.3%) |
| 3-Person Households | 23 (8.9%) | 0 (0.0%) |
| 4-Person Households | 16 (6.2%) | 0 (0.0%) |
| 5-Person Households | 7 (2.7%) | 0 (0.0%) |
| 6-Person Households | 0 (0.0%) | 0 (0.0%) |
| 7+ Person Households | 0 (0.0%) | 0 (0.0%) |
| Total | 103 (40.1%) | 154 (59.9%) |
Female Fertility in Heidlersburg
Fertility by Age in Heidlersburg
| Age Bracket | Women with Births | Births / 1,000 Women |
| 15 to 19 years | 0 (0.0%) | 0.0 |
| 20 to 34 years | 0 (0.0%) | 0.0 |
| 35 to 50 years | 0 (0.0%) | 0.0 |
| Total | 0 (0.0%) | 0.0 |
Fertility by Age by Marriage Status in Heidlersburg
| Age Bracket | Married | Unmarried |
| 15 to 19 years | 0 (0.0%) | 0 (0.0%) |
| 20 to 34 years | 0 (0.0%) | 0 (0.0%) |
| 35 to 50 years | 0 (0.0%) | 0 (0.0%) |
| Total | 0 (0.0%) | 0 (0.0%) |
Fertility by Education in Heidlersburg
| Educational Attainment | Women with Births | Births / 1,000 Women |
| Less than High School | 0 (0.0%) | 0.0 |
| High School Diploma | 0 (0.0%) | 0.0 |
| College or Associate's Degree | 0 (0.0%) | 0.0 |
| Bachelor's Degree | 0 (0.0%) | 0.0 |
| Graduate Degree | 0 (0.0%) | 0.0 |
| Total | 0 (0.0%) | 0.0 |
Fertility by Education by Marriage Status in Heidlersburg
| Educational Attainment | Married | Unmarried |
| Less than High School | 0 (0.0%) | 0 (0.0%) |
| High School Diploma | 0 (0.0%) | 0 (0.0%) |
| College or Associate's Degree | 0 (0.0%) | 0 (0.0%) |
| Bachelor's Degree | 0 (0.0%) | 0 (0.0%) |
| Graduate Degree | 0 (0.0%) | 0 (0.0%) |
| Total | 0 (0.0%) | 0 (0.0%) |
Employment Characteristics in Heidlersburg
Employment by Class of Employer in Heidlersburg
Among the 213 employed individuals in Heidlersburg, private company employees (132 | 62.0%), not-for-profit organizations (29 | 13.6%), and state government employees (17 | 8.0%) make up the most common classes of employment.
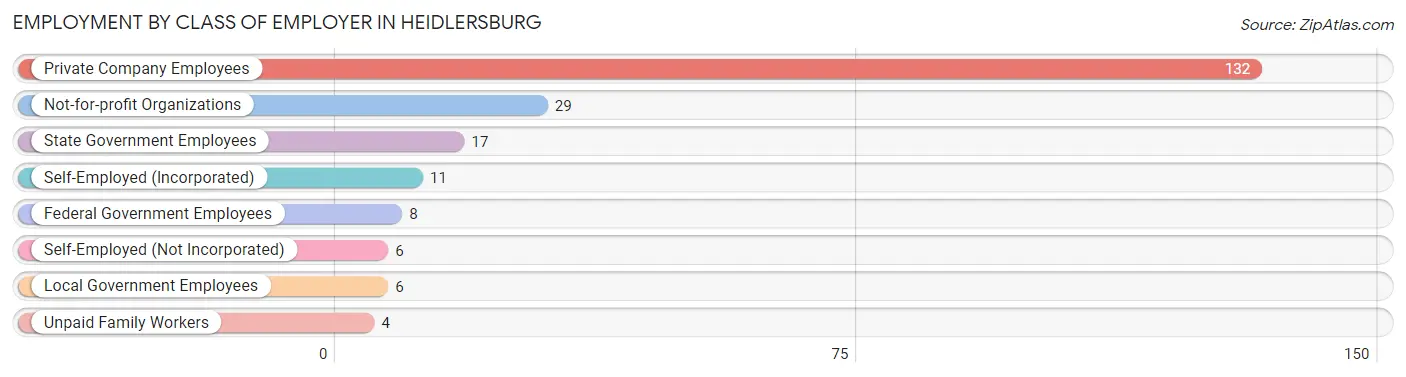
| Employer Class | # Employees | % Employees |
| Private Company Employees | 132 | 62.0% |
| Self-Employed (Incorporated) | 11 | 5.2% |
| Self-Employed (Not Incorporated) | 6 | 2.8% |
| Not-for-profit Organizations | 29 | 13.6% |
| Local Government Employees | 6 | 2.8% |
| State Government Employees | 17 | 8.0% |
| Federal Government Employees | 8 | 3.8% |
| Unpaid Family Workers | 4 | 1.9% |
| Total | 213 | 100.0% |
Employment Status by Age in Heidlersburg
According to the labor force statistics for Heidlersburg, out of the total population over 16 years of age (405), 56.8% or 230 individuals are in the labor force, with 7.7% or 18 of them unemployed. The age group with the highest labor force participation rate is 20 to 24 years, with 100.0% or 19 individuals in the labor force. Within the labor force, the 65 to 74 years age range has the highest percentage of unemployed individuals, with 18.8% or 12 of them being unemployed.
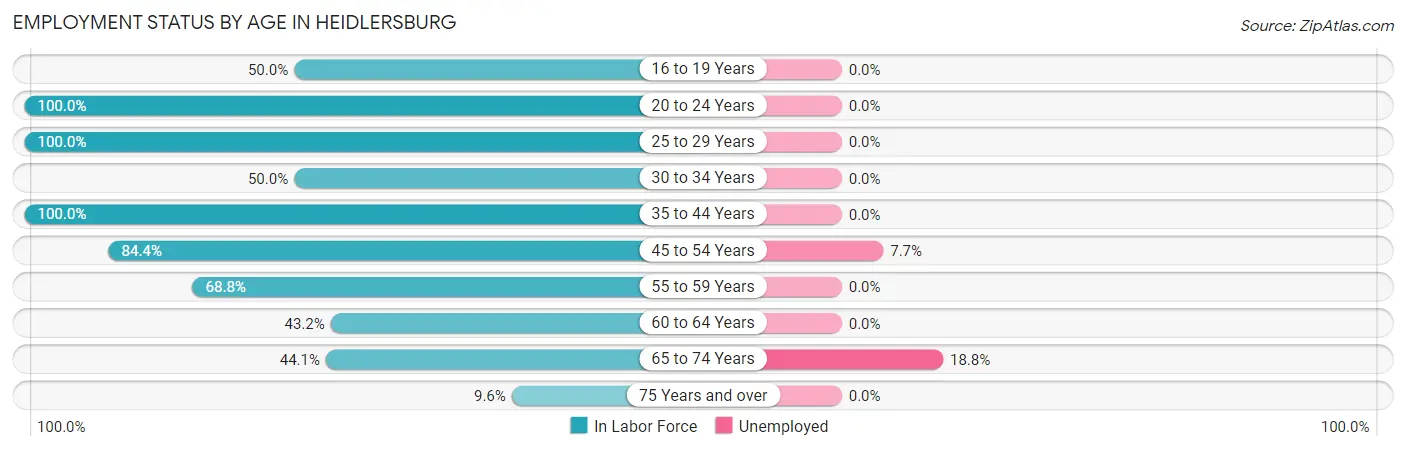
| Age Bracket | In Labor Force | Unemployed |
| 16 to 19 Years | 6 (50.0%) | 0 (0.0%) |
| 20 to 24 Years | 19 (100.0%) | 0 (0.0%) |
| 25 to 29 Years | 19 (100.0%) | 0 (0.0%) |
| 30 to 34 Years | 3 (50.0%) | 0 (0.0%) |
| 35 to 44 Years | 22 (100.0%) | 0 (0.0%) |
| 45 to 54 Years | 65 (84.4%) | 5 (7.7%) |
| 55 to 59 Years | 11 (68.8%) | 0 (0.0%) |
| 60 to 64 Years | 16 (43.2%) | 0 (0.0%) |
| 65 to 74 Years | 64 (44.1%) | 12 (18.8%) |
| 75 Years and over | 5 (9.6%) | 0 (0.0%) |
| Total | 230 (56.8%) | 18 (7.7%) |
Employment Status by Educational Attainment in Heidlersburg
According to labor force statistics for Heidlersburg, 76.8% of individuals (136) out of the total population between 25 and 64 years of age (177) are in the labor force, with 3.7% or 5 of them being unemployed. The group with the highest labor force participation rate are those with the educational attainment of college / associate degree, with 89.5% or 51 individuals in the labor force. Within the labor force, individuals with high school diploma education have the highest percentage of unemployment, with 9.6% or 5 of them being unemployed.
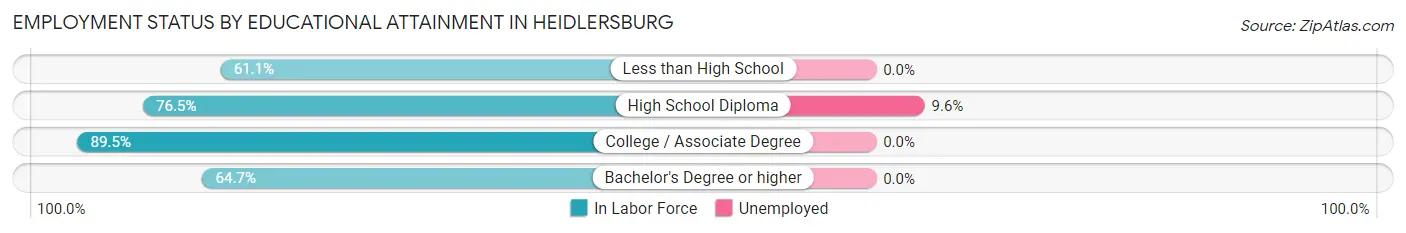
| Educational Attainment | In Labor Force | Unemployed |
| Less than High School | 11 (61.1%) | 0 (0.0%) |
| High School Diploma | 52 (76.5%) | 7 (9.6%) |
| College / Associate Degree | 51 (89.5%) | 0 (0.0%) |
| Bachelor's Degree or higher | 22 (64.7%) | 0 (0.0%) |
| Total | 136 (76.8%) | 7 (3.7%) |
Employment Occupations by Sex in Heidlersburg
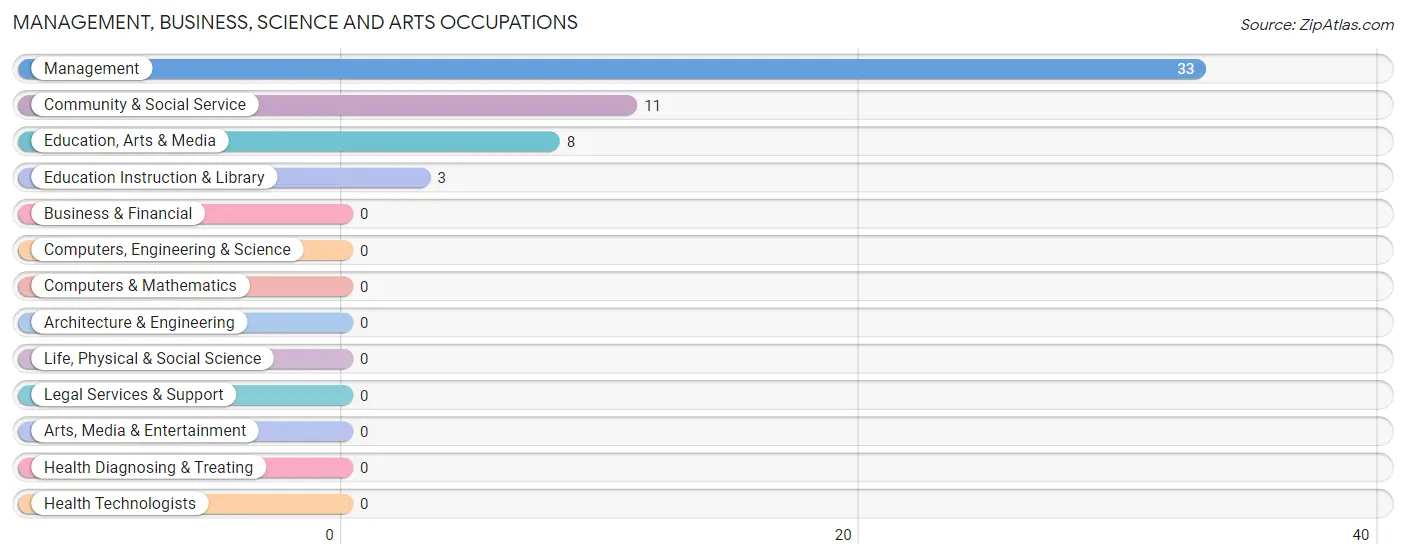
Management, Business, Science and Arts Occupations
The most common Management, Business, Science and Arts occupations in Heidlersburg are Management (33 | 16.1%), Community & Social Service (11 | 5.4%), Education, Arts & Media (8 | 3.9%), and Education Instruction & Library (3 | 1.5%).
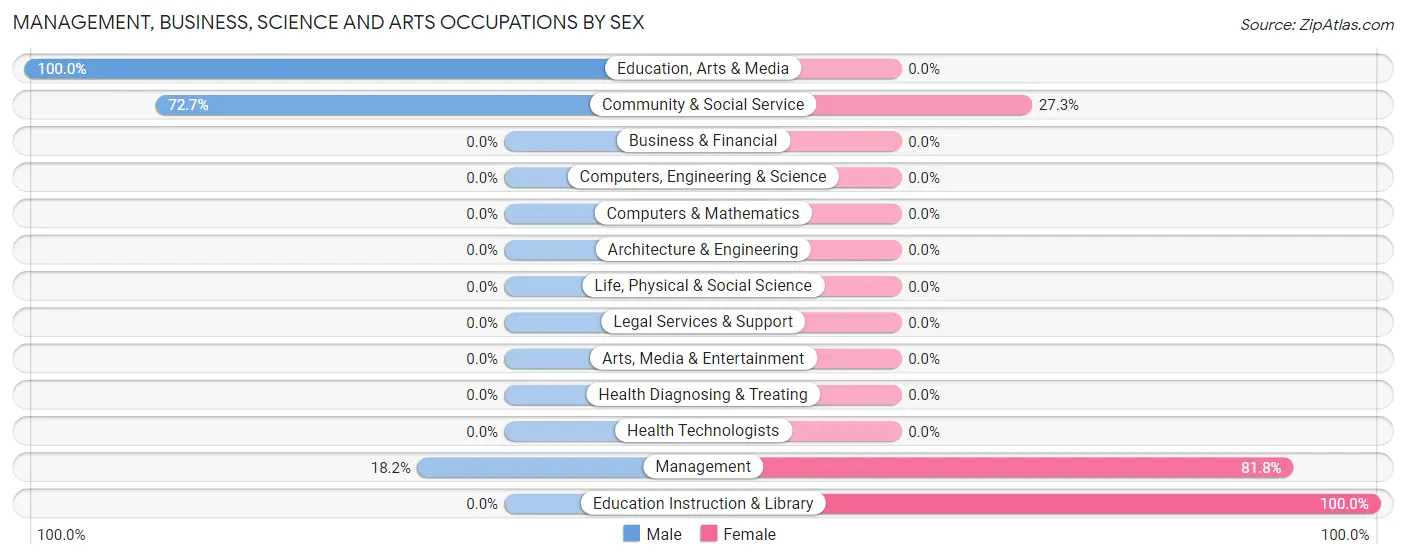
Management, Business, Science and Arts Occupations by Sex
Within the Management, Business, Science and Arts occupations in Heidlersburg, the most male-oriented occupations are Education, Arts & Media (100.0%), Community & Social Service (72.7%), and Management (18.2%), while the most female-oriented occupations are Education Instruction & Library (100.0%), Management (81.8%), and Community & Social Service (27.3%).
| Occupation | Male | Female |
| Management | 6 (18.2%) | 27 (81.8%) |
| Business & Financial | 0 (0.0%) | 0 (0.0%) |
| Computers, Engineering & Science | 0 (0.0%) | 0 (0.0%) |
| Computers & Mathematics | 0 (0.0%) | 0 (0.0%) |
| Architecture & Engineering | 0 (0.0%) | 0 (0.0%) |
| Life, Physical & Social Science | 0 (0.0%) | 0 (0.0%) |
| Community & Social Service | 8 (72.7%) | 3 (27.3%) |
| Education, Arts & Media | 8 (100.0%) | 0 (0.0%) |
| Legal Services & Support | 0 (0.0%) | 0 (0.0%) |
| Education Instruction & Library | 0 (0.0%) | 3 (100.0%) |
| Arts, Media & Entertainment | 0 (0.0%) | 0 (0.0%) |
| Health Diagnosing & Treating | 0 (0.0%) | 0 (0.0%) |
| Health Technologists | 0 (0.0%) | 0 (0.0%) |
| Total (Category) | 14 (31.8%) | 30 (68.2%) |
| Total (Overall) | 112 (54.6%) | 93 (45.4%) |
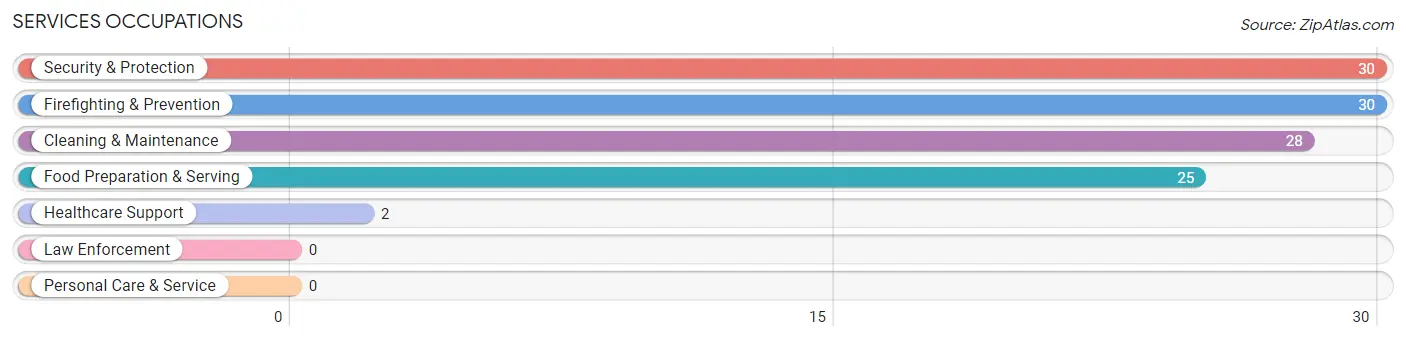
Services Occupations
The most common Services occupations in Heidlersburg are Security & Protection (30 | 14.6%), Firefighting & Prevention (30 | 14.6%), Cleaning & Maintenance (28 | 13.7%), Food Preparation & Serving (25 | 12.2%), and Healthcare Support (2 | 1.0%).
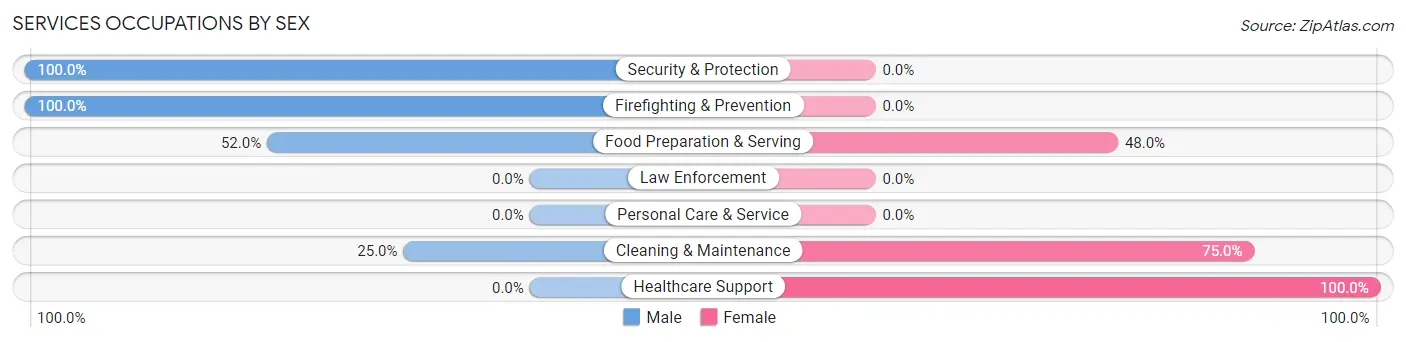
Services Occupations by Sex
Within the Services occupations in Heidlersburg, the most male-oriented occupations are Security & Protection (100.0%), Firefighting & Prevention (100.0%), and Food Preparation & Serving (52.0%), while the most female-oriented occupations are Healthcare Support (100.0%), Cleaning & Maintenance (75.0%), and Food Preparation & Serving (48.0%).
| Occupation | Male | Female |
| Healthcare Support | 0 (0.0%) | 2 (100.0%) |
| Security & Protection | 30 (100.0%) | 0 (0.0%) |
| Firefighting & Prevention | 30 (100.0%) | 0 (0.0%) |
| Law Enforcement | 0 (0.0%) | 0 (0.0%) |
| Food Preparation & Serving | 13 (52.0%) | 12 (48.0%) |
| Cleaning & Maintenance | 7 (25.0%) | 21 (75.0%) |
| Personal Care & Service | 0 (0.0%) | 0 (0.0%) |
| Total (Category) | 50 (58.8%) | 35 (41.2%) |
| Total (Overall) | 112 (54.6%) | 93 (45.4%) |
Sales and Office Occupations
The most common Sales and Office occupations in Heidlersburg are Office & Administration (13 | 6.3%), and Sales & Related (10 | 4.9%).
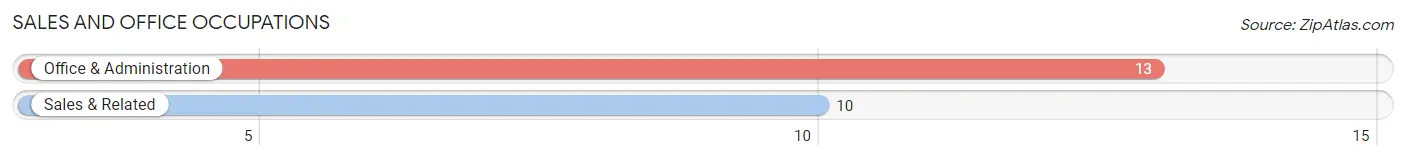
Sales and Office Occupations by Sex
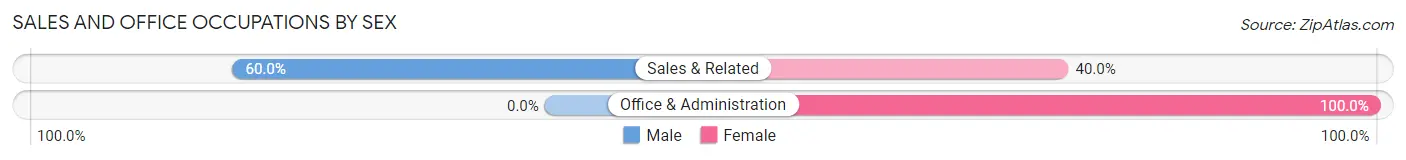
| Occupation | Male | Female |
| Sales & Related | 6 (60.0%) | 4 (40.0%) |
| Office & Administration | 0 (0.0%) | 13 (100.0%) |
| Total (Category) | 6 (26.1%) | 17 (73.9%) |
| Total (Overall) | 112 (54.6%) | 93 (45.4%) |
Natural Resources, Construction and Maintenance Occupations
The most common Natural Resources, Construction and Maintenance occupations in Heidlersburg are , and Installation, Maintenance & Repair (12 | 5.9%).
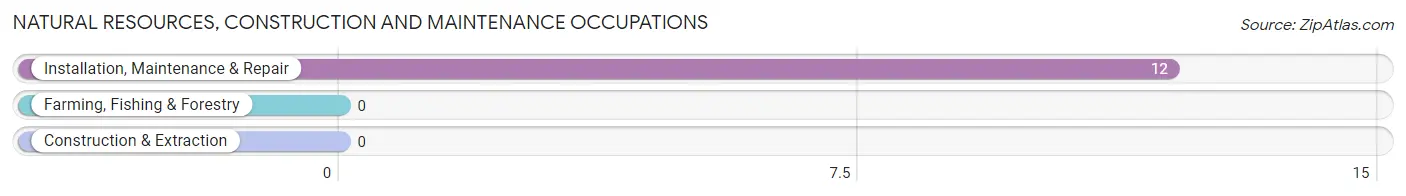
Natural Resources, Construction and Maintenance Occupations by Sex
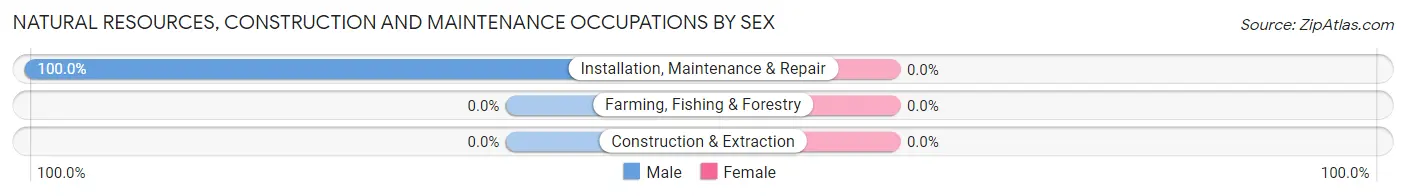
| Occupation | Male | Female |
| Farming, Fishing & Forestry | 0 (0.0%) | 0 (0.0%) |
| Construction & Extraction | 0 (0.0%) | 0 (0.0%) |
| Installation, Maintenance & Repair | 12 (100.0%) | 0 (0.0%) |
| Total (Category) | 12 (100.0%) | 0 (0.0%) |
| Total (Overall) | 112 (54.6%) | 93 (45.4%) |
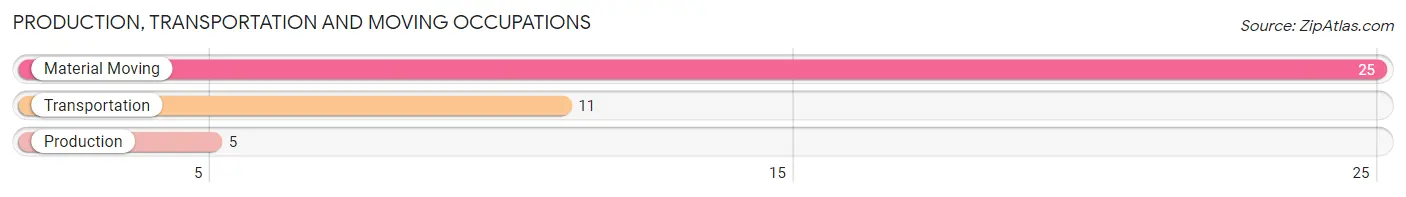
Production, Transportation and Moving Occupations
The most common Production, Transportation and Moving occupations in Heidlersburg are Material Moving (25 | 12.2%), Transportation (11 | 5.4%), and Production (5 | 2.4%).
Production, Transportation and Moving Occupations by Sex
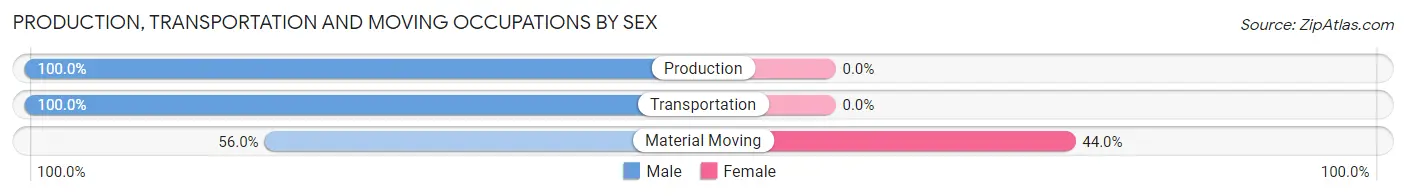
| Occupation | Male | Female |
| Production | 5 (100.0%) | 0 (0.0%) |
| Transportation | 11 (100.0%) | 0 (0.0%) |
| Material Moving | 14 (56.0%) | 11 (44.0%) |
| Total (Category) | 30 (73.2%) | 11 (26.8%) |
| Total (Overall) | 112 (54.6%) | 93 (45.4%) |
Employment Industries by Sex in Heidlersburg
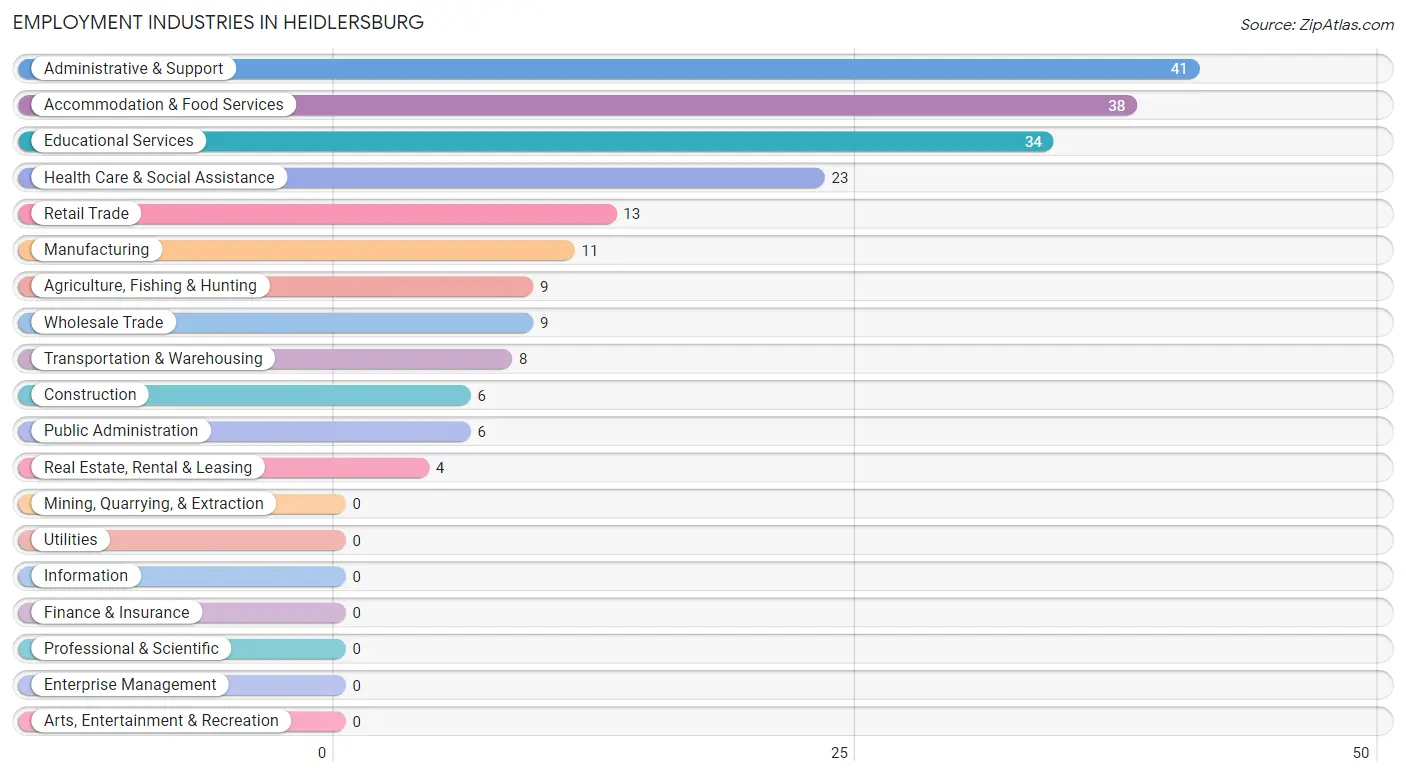
Employment Industries in Heidlersburg
The major employment industries in Heidlersburg include Administrative & Support (41 | 20.0%), Accommodation & Food Services (38 | 18.5%), Educational Services (34 | 16.6%), Health Care & Social Assistance (23 | 11.2%), and Retail Trade (13 | 6.3%).
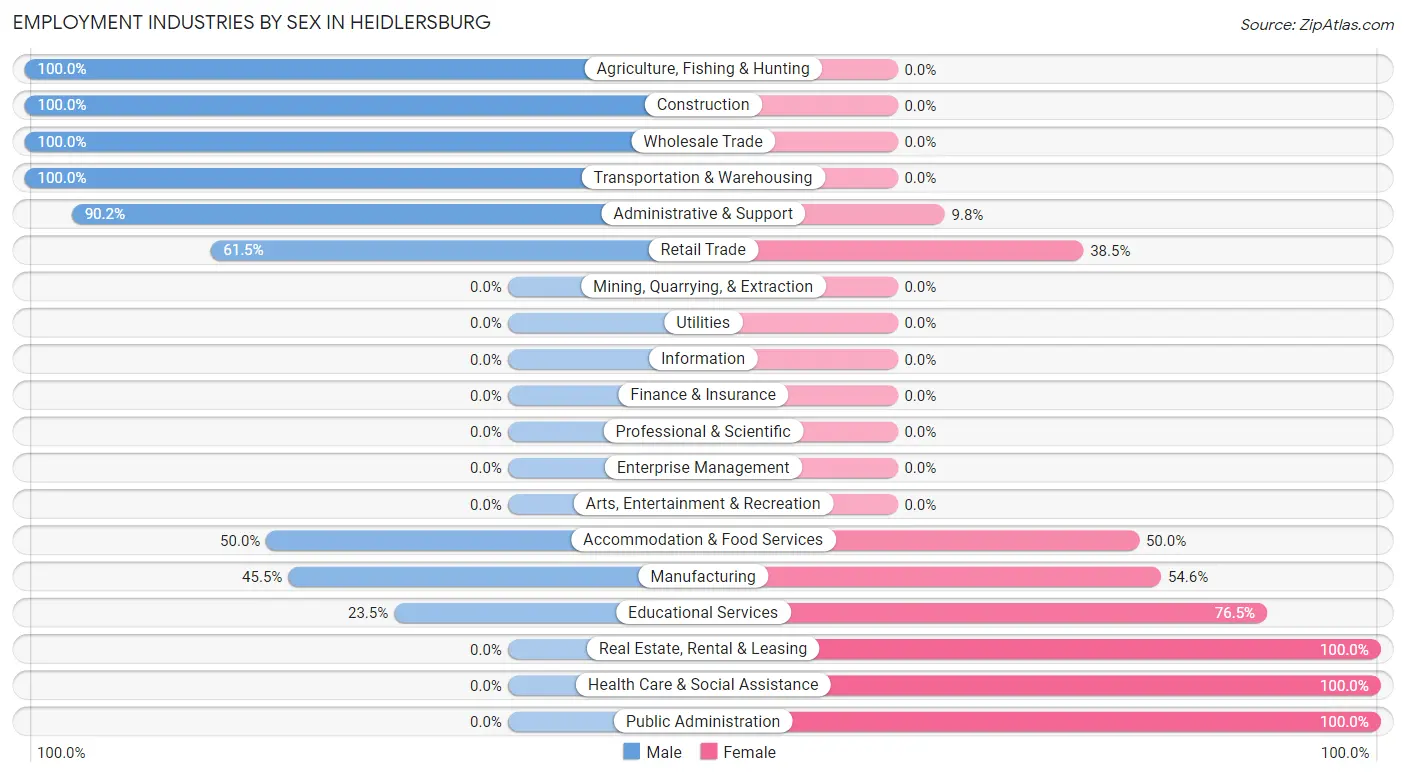
Employment Industries by Sex in Heidlersburg
The Heidlersburg industries that see more men than women are Agriculture, Fishing & Hunting (100.0%), Construction (100.0%), and Wholesale Trade (100.0%), whereas the industries that tend to have a higher number of women are Real Estate, Rental & Leasing (100.0%), Health Care & Social Assistance (100.0%), and Public Administration (100.0%).
| Industry | Male | Female |
| Agriculture, Fishing & Hunting | 9 (100.0%) | 0 (0.0%) |
| Mining, Quarrying, & Extraction | 0 (0.0%) | 0 (0.0%) |
| Construction | 6 (100.0%) | 0 (0.0%) |
| Manufacturing | 5 (45.5%) | 6 (54.5%) |
| Wholesale Trade | 9 (100.0%) | 0 (0.0%) |
| Retail Trade | 8 (61.5%) | 5 (38.5%) |
| Transportation & Warehousing | 8 (100.0%) | 0 (0.0%) |
| Utilities | 0 (0.0%) | 0 (0.0%) |
| Information | 0 (0.0%) | 0 (0.0%) |
| Finance & Insurance | 0 (0.0%) | 0 (0.0%) |
| Real Estate, Rental & Leasing | 0 (0.0%) | 4 (100.0%) |
| Professional & Scientific | 0 (0.0%) | 0 (0.0%) |
| Enterprise Management | 0 (0.0%) | 0 (0.0%) |
| Administrative & Support | 37 (90.2%) | 4 (9.8%) |
| Educational Services | 8 (23.5%) | 26 (76.5%) |
| Health Care & Social Assistance | 0 (0.0%) | 23 (100.0%) |
| Arts, Entertainment & Recreation | 0 (0.0%) | 0 (0.0%) |
| Accommodation & Food Services | 19 (50.0%) | 19 (50.0%) |
| Public Administration | 0 (0.0%) | 6 (100.0%) |
| Total | 112 (54.6%) | 93 (45.4%) |
Education in Heidlersburg
School Enrollment in Heidlersburg
The most common levels of schooling among the 56 students in Heidlersburg are high school (21 | 37.5%), elementary school (12 | 21.4%), and nursery / preschool (9 | 16.1%).
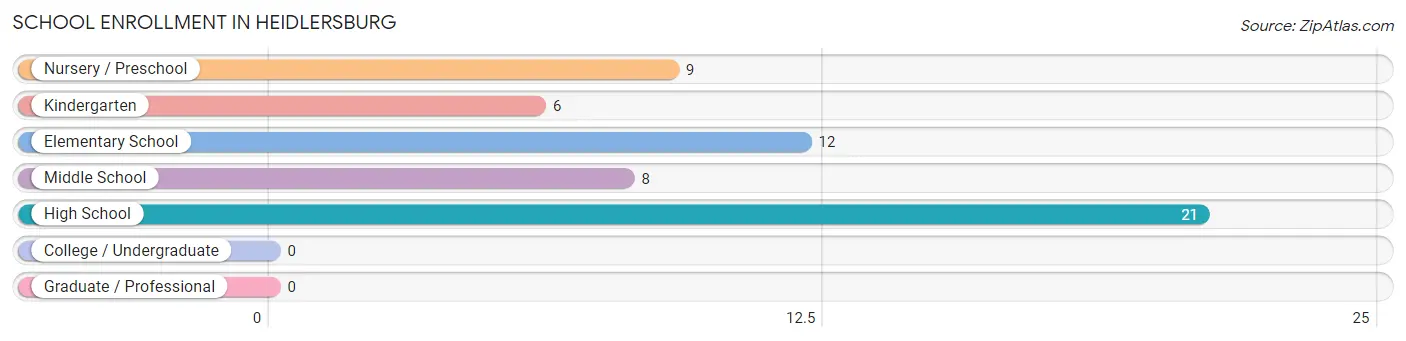
| School Level | # Students | % Students |
| Nursery / Preschool | 9 | 16.1% |
| Kindergarten | 6 | 10.7% |
| Elementary School | 12 | 21.4% |
| Middle School | 8 | 14.3% |
| High School | 21 | 37.5% |
| College / Undergraduate | 0 | 0.0% |
| Graduate / Professional | 0 | 0.0% |
| Total | 56 | 100.0% |
School Enrollment by Age by Funding Source in Heidlersburg
Out of a total of 56 students who are enrolled in schools in Heidlersburg, 14 (25.0%) attend a private institution, while the remaining 42 (75.0%) are enrolled in public schools. The age group of 3 to 4 year olds has the highest likelihood of being enrolled in private schools, with 9 (100.0% in the age bracket) enrolled. Conversely, the age group of 10 to 14 year olds has the lowest likelihood of being enrolled in a private school, with 8 (100.0% in the age bracket) attending a public institution.

| Age Bracket | Public School | Private School |
| 3 to 4 Year Olds | 0 (0.0%) | 9 (100.0%) |
| 5 to 9 Year Old | 13 (72.2%) | 5 (27.8%) |
| 10 to 14 Year Olds | 8 (100.0%) | 0 (0.0%) |
| 15 to 17 Year Olds | 21 (100.0%) | 0 (0.0%) |
| 18 to 19 Year Olds | 0 (0.0%) | 0 (0.0%) |
| 20 to 24 Year Olds | 0 (0.0%) | 0 (0.0%) |
| 25 to 34 Year Olds | 0 (0.0%) | 0 (0.0%) |
| 35 Years and over | 0 (0.0%) | 0 (0.0%) |
| Total | 42 (75.0%) | 14 (25.0%) |
Educational Attainment by Field of Study in Heidlersburg
Psychology (14 | 26.9%), science & technology (12 | 23.1%), literature & languages (8 | 15.4%), business (7 | 13.5%), and education (7 | 13.5%) are the most common fields of study among 52 individuals in Heidlersburg who have obtained a bachelor's degree or higher.
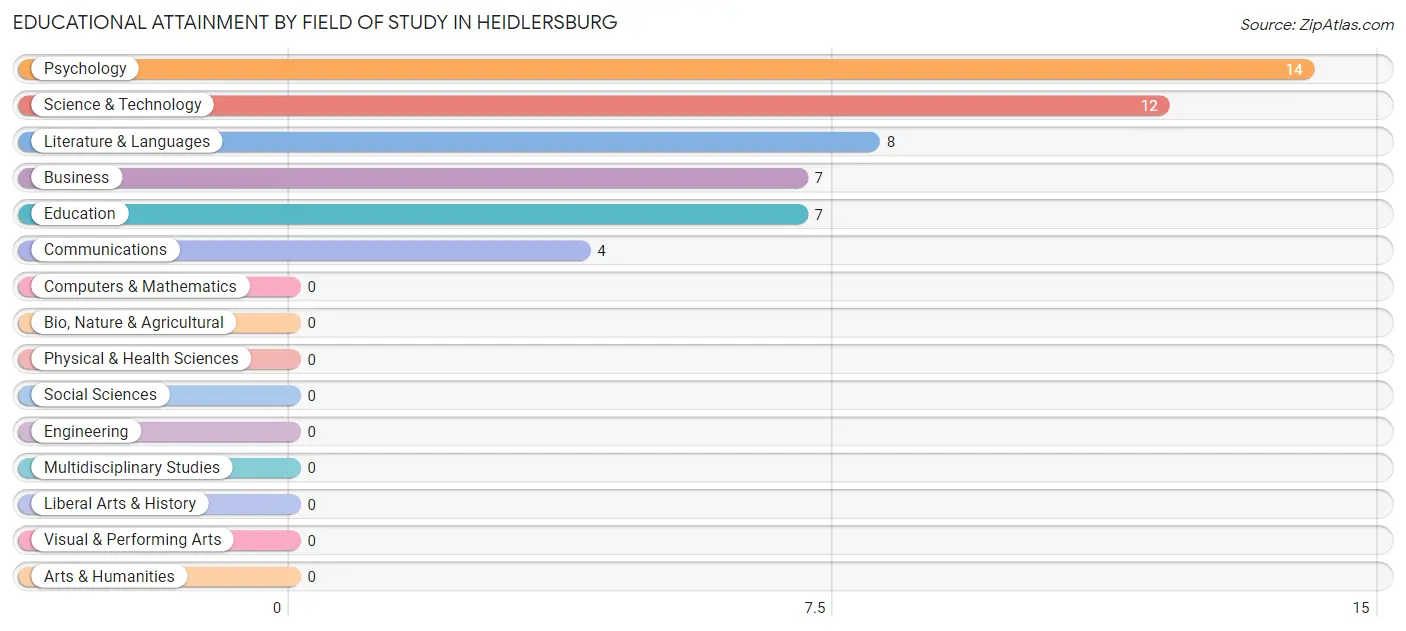
| Field of Study | # Graduates | % Graduates |
| Computers & Mathematics | 0 | 0.0% |
| Bio, Nature & Agricultural | 0 | 0.0% |
| Physical & Health Sciences | 0 | 0.0% |
| Psychology | 14 | 26.9% |
| Social Sciences | 0 | 0.0% |
| Engineering | 0 | 0.0% |
| Multidisciplinary Studies | 0 | 0.0% |
| Science & Technology | 12 | 23.1% |
| Business | 7 | 13.5% |
| Education | 7 | 13.5% |
| Literature & Languages | 8 | 15.4% |
| Liberal Arts & History | 0 | 0.0% |
| Visual & Performing Arts | 0 | 0.0% |
| Communications | 4 | 7.7% |
| Arts & Humanities | 0 | 0.0% |
| Total | 52 | 100.0% |
Transportation & Commute in Heidlersburg
Vehicle Availability by Sex in Heidlersburg
The most prevalent vehicle ownership categories in Heidlersburg are males with 2 vehicles (72, accounting for 60.0%) and females with 2 vehicles (41, making up 77.4%).
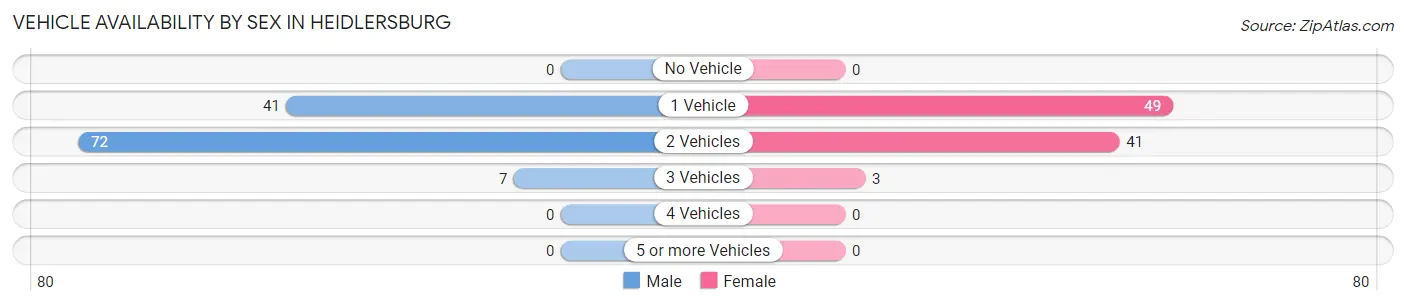
| Vehicles Available | Male | Female |
| No Vehicle | 0 (0.0%) | 0 (0.0%) |
| 1 Vehicle | 41 (34.2%) | 49 (52.7%) |
| 2 Vehicles | 72 (60.0%) | 41 (44.1%) |
| 3 Vehicles | 7 (5.8%) | 3 (3.2%) |
| 4 Vehicles | 0 (0.0%) | 0 (0.0%) |
| 5 or more Vehicles | 0 (0.0%) | 0 (0.0%) |
| Total | 120 (100.0%) | 93 (100.0%) |
Commute Time in Heidlersburg
The most frequently occuring commute durations in Heidlersburg are 30 to 34 minutes (46 commuters, 21.9%), 20 to 24 minutes (41 commuters, 19.5%), and 15 to 19 minutes (35 commuters, 16.7%).
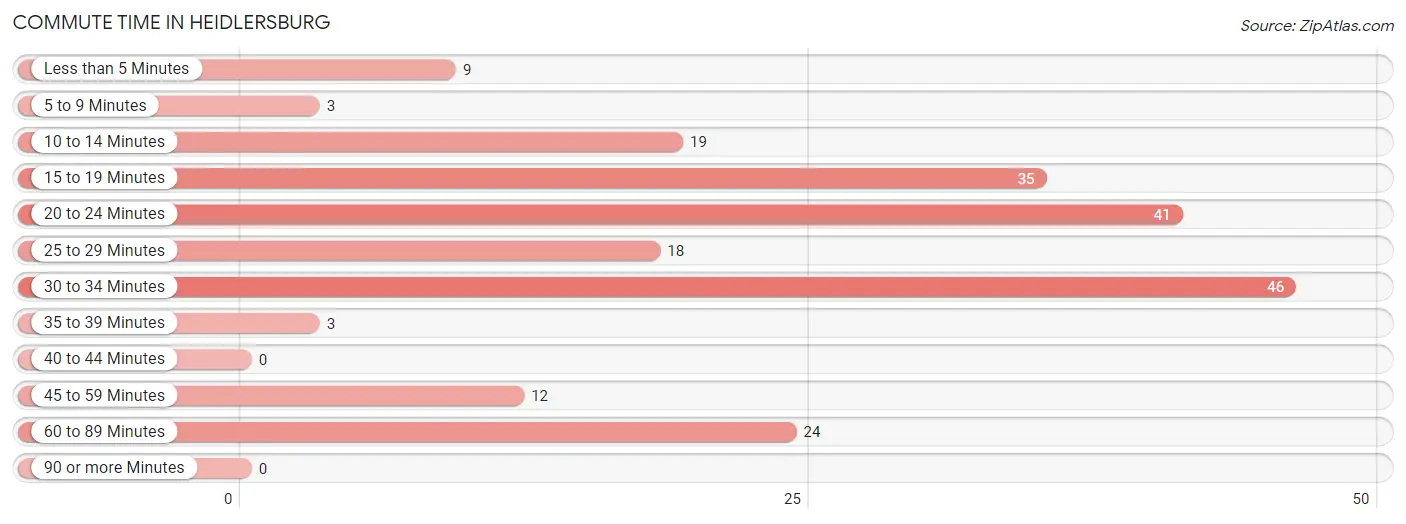
| Commute Time | # Commuters | % Commuters |
| Less than 5 Minutes | 9 | 4.3% |
| 5 to 9 Minutes | 3 | 1.4% |
| 10 to 14 Minutes | 19 | 9.0% |
| 15 to 19 Minutes | 35 | 16.7% |
| 20 to 24 Minutes | 41 | 19.5% |
| 25 to 29 Minutes | 18 | 8.6% |
| 30 to 34 Minutes | 46 | 21.9% |
| 35 to 39 Minutes | 3 | 1.4% |
| 40 to 44 Minutes | 0 | 0.0% |
| 45 to 59 Minutes | 12 | 5.7% |
| 60 to 89 Minutes | 24 | 11.4% |
| 90 or more Minutes | 0 | 0.0% |
Commute Time by Sex in Heidlersburg
The most common commute times in Heidlersburg are 20 to 24 minutes (36 commuters, 30.0%) for males and 15 to 19 minutes (27 commuters, 30.0%) for females.
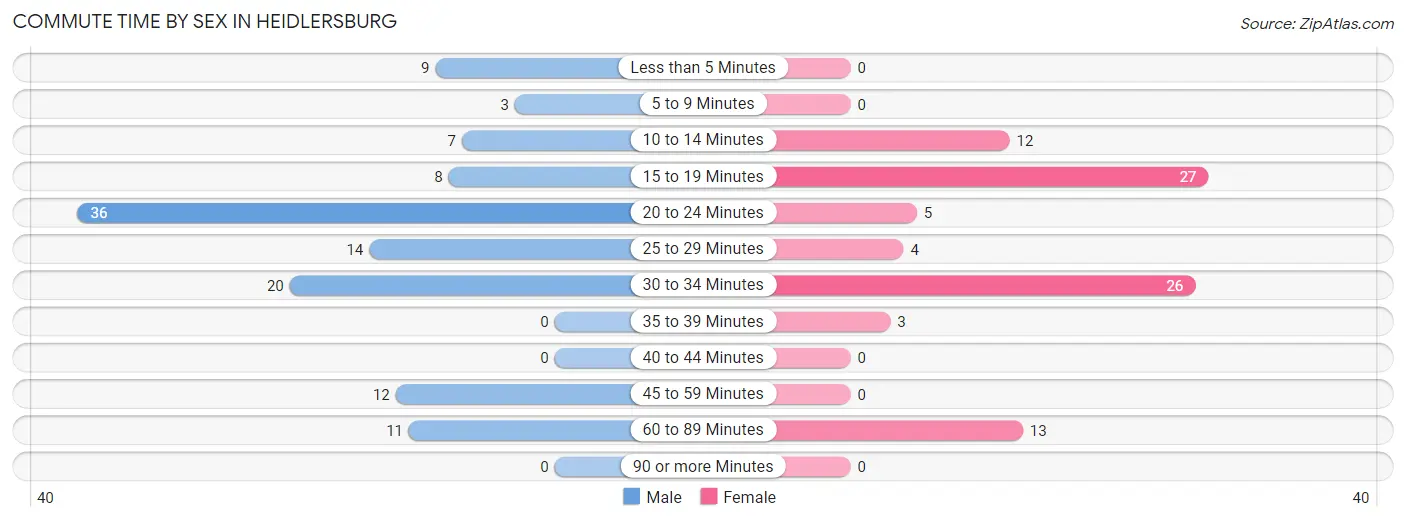
| Commute Time | Male | Female |
| Less than 5 Minutes | 9 (7.5%) | 0 (0.0%) |
| 5 to 9 Minutes | 3 (2.5%) | 0 (0.0%) |
| 10 to 14 Minutes | 7 (5.8%) | 12 (13.3%) |
| 15 to 19 Minutes | 8 (6.7%) | 27 (30.0%) |
| 20 to 24 Minutes | 36 (30.0%) | 5 (5.6%) |
| 25 to 29 Minutes | 14 (11.7%) | 4 (4.4%) |
| 30 to 34 Minutes | 20 (16.7%) | 26 (28.9%) |
| 35 to 39 Minutes | 0 (0.0%) | 3 (3.3%) |
| 40 to 44 Minutes | 0 (0.0%) | 0 (0.0%) |
| 45 to 59 Minutes | 12 (10.0%) | 0 (0.0%) |
| 60 to 89 Minutes | 11 (9.2%) | 13 (14.4%) |
| 90 or more Minutes | 0 (0.0%) | 0 (0.0%) |
Time of Departure to Work by Sex in Heidlersburg
The most frequent times of departure to work in Heidlersburg are 12:00 PM to 3:59 PM (55, 45.8%) for males and 7:00 AM to 7:29 AM (22, 24.4%) for females.
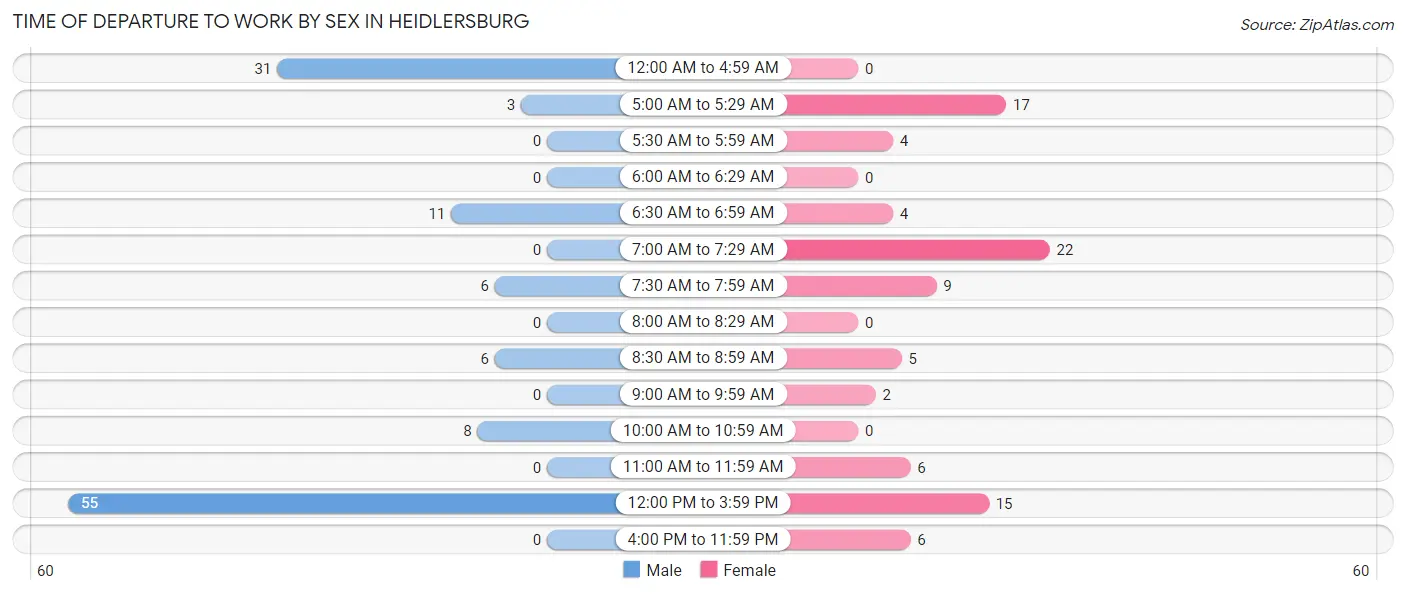
| Time of Departure | Male | Female |
| 12:00 AM to 4:59 AM | 31 (25.8%) | 0 (0.0%) |
| 5:00 AM to 5:29 AM | 3 (2.5%) | 17 (18.9%) |
| 5:30 AM to 5:59 AM | 0 (0.0%) | 4 (4.4%) |
| 6:00 AM to 6:29 AM | 0 (0.0%) | 0 (0.0%) |
| 6:30 AM to 6:59 AM | 11 (9.2%) | 4 (4.4%) |
| 7:00 AM to 7:29 AM | 0 (0.0%) | 22 (24.4%) |
| 7:30 AM to 7:59 AM | 6 (5.0%) | 9 (10.0%) |
| 8:00 AM to 8:29 AM | 0 (0.0%) | 0 (0.0%) |
| 8:30 AM to 8:59 AM | 6 (5.0%) | 5 (5.6%) |
| 9:00 AM to 9:59 AM | 0 (0.0%) | 2 (2.2%) |
| 10:00 AM to 10:59 AM | 8 (6.7%) | 0 (0.0%) |
| 11:00 AM to 11:59 AM | 0 (0.0%) | 6 (6.7%) |
| 12:00 PM to 3:59 PM | 55 (45.8%) | 15 (16.7%) |
| 4:00 PM to 11:59 PM | 0 (0.0%) | 6 (6.7%) |
| Total | 120 (100.0%) | 90 (100.0%) |
Housing Occupancy in Heidlersburg
Occupancy by Ownership in Heidlersburg
Of the total 257 dwellings in Heidlersburg, owner-occupied units account for 227 (88.3%), while renter-occupied units make up 30 (11.7%).
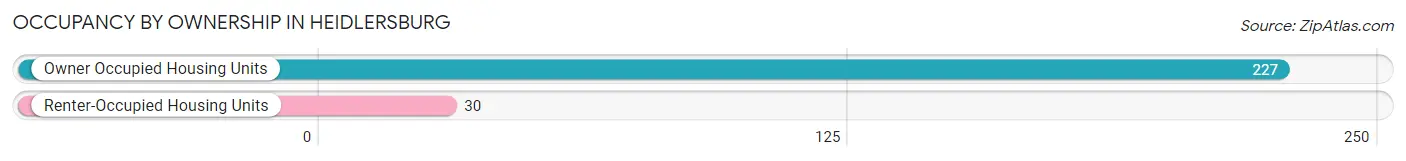
| Occupancy | # Housing Units | % Housing Units |
| Owner Occupied Housing Units | 227 | 88.3% |
| Renter-Occupied Housing Units | 30 | 11.7% |
| Total Occupied Housing Units | 257 | 100.0% |
Occupancy by Household Size in Heidlersburg
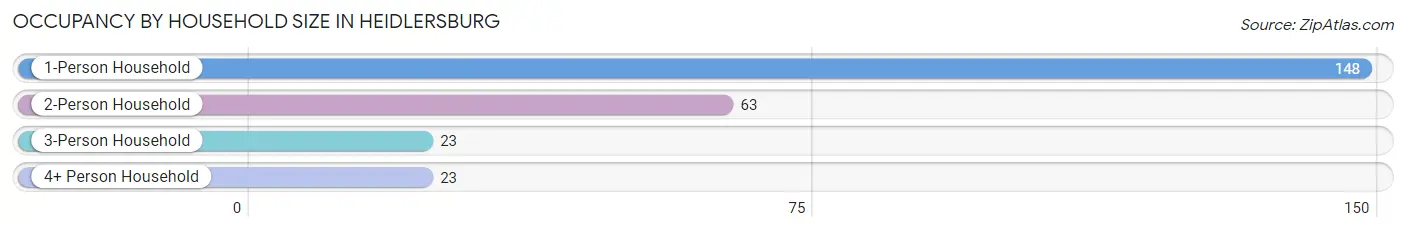
| Household Size | # Housing Units | % Housing Units |
| 1-Person Household | 148 | 57.6% |
| 2-Person Household | 63 | 24.5% |
| 3-Person Household | 23 | 8.9% |
| 4+ Person Household | 23 | 8.9% |
| Total Housing Units | 257 | 100.0% |
Occupancy by Ownership by Household Size in Heidlersburg
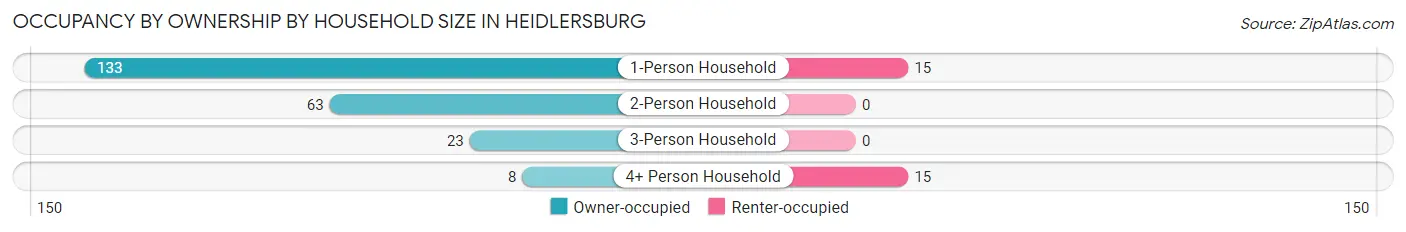
| Household Size | Owner-occupied | Renter-occupied |
| 1-Person Household | 133 (89.9%) | 15 (10.1%) |
| 2-Person Household | 63 (100.0%) | 0 (0.0%) |
| 3-Person Household | 23 (100.0%) | 0 (0.0%) |
| 4+ Person Household | 8 (34.8%) | 15 (65.2%) |
| Total Housing Units | 227 (88.3%) | 30 (11.7%) |
Occupancy by Educational Attainment in Heidlersburg
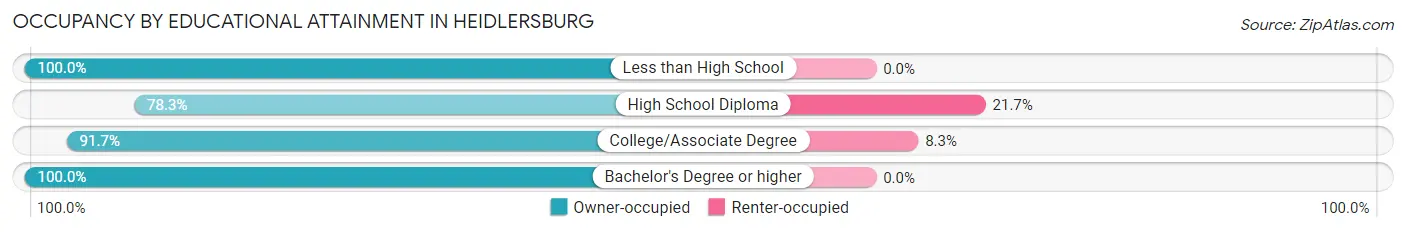
| Household Size | Owner-occupied | Renter-occupied |
| Less than High School | 27 (100.0%) | 0 (0.0%) |
| High School Diploma | 83 (78.3%) | 23 (21.7%) |
| College/Associate Degree | 77 (91.7%) | 7 (8.3%) |
| Bachelor's Degree or higher | 40 (100.0%) | 0 (0.0%) |
Occupancy by Age of Householder in Heidlersburg
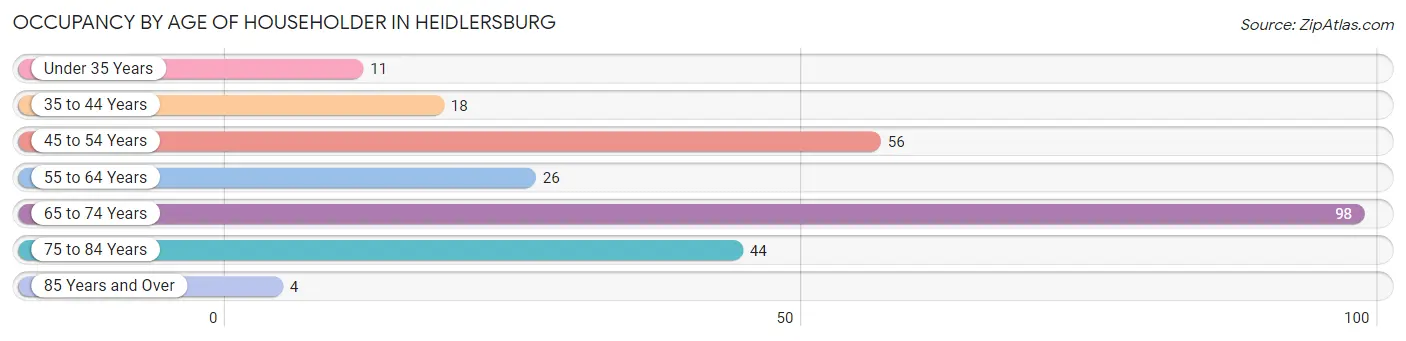
| Age Bracket | # Households | % Households |
| Under 35 Years | 11 | 4.3% |
| 35 to 44 Years | 18 | 7.0% |
| 45 to 54 Years | 56 | 21.8% |
| 55 to 64 Years | 26 | 10.1% |
| 65 to 74 Years | 98 | 38.1% |
| 75 to 84 Years | 44 | 17.1% |
| 85 Years and Over | 4 | 1.6% |
| Total | 257 | 100.0% |
Housing Finances in Heidlersburg
Median Income by Occupancy in Heidlersburg
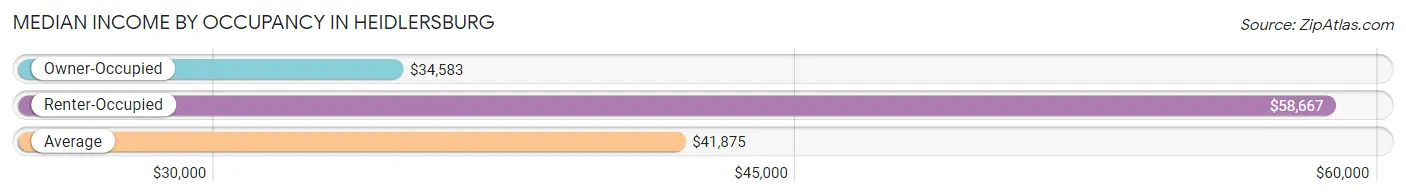
| Occupancy Type | # Households | Median Income |
| Owner-Occupied | 227 (88.3%) | $34,583 |
| Renter-Occupied | 30 (11.7%) | $58,667 |
| Average | 257 (100.0%) | $41,875 |
Occupancy by Householder Income Bracket in Heidlersburg
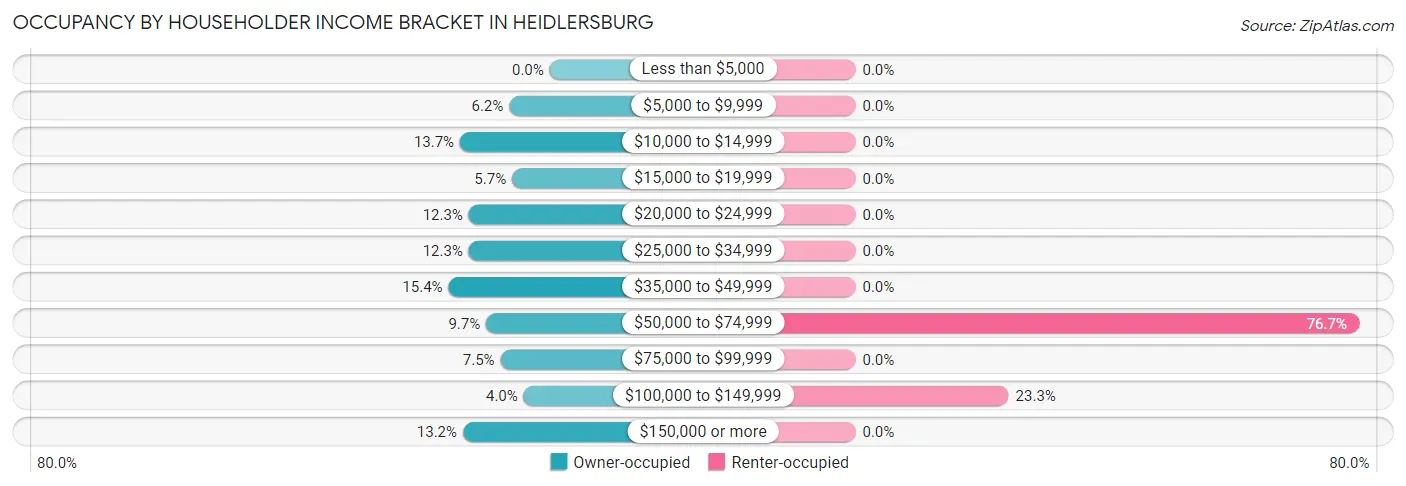
| Income Bracket | Owner-occupied | Renter-occupied |
| Less than $5,000 | 0 (0.0%) | 0 (0.0%) |
| $5,000 to $9,999 | 14 (6.2%) | 0 (0.0%) |
| $10,000 to $14,999 | 31 (13.7%) | 0 (0.0%) |
| $15,000 to $19,999 | 13 (5.7%) | 0 (0.0%) |
| $20,000 to $24,999 | 28 (12.3%) | 0 (0.0%) |
| $25,000 to $34,999 | 28 (12.3%) | 0 (0.0%) |
| $35,000 to $49,999 | 35 (15.4%) | 0 (0.0%) |
| $50,000 to $74,999 | 22 (9.7%) | 23 (76.7%) |
| $75,000 to $99,999 | 17 (7.5%) | 0 (0.0%) |
| $100,000 to $149,999 | 9 (4.0%) | 7 (23.3%) |
| $150,000 or more | 30 (13.2%) | 0 (0.0%) |
| Total | 227 (100.0%) | 30 (100.0%) |
Monthly Housing Cost Tiers in Heidlersburg
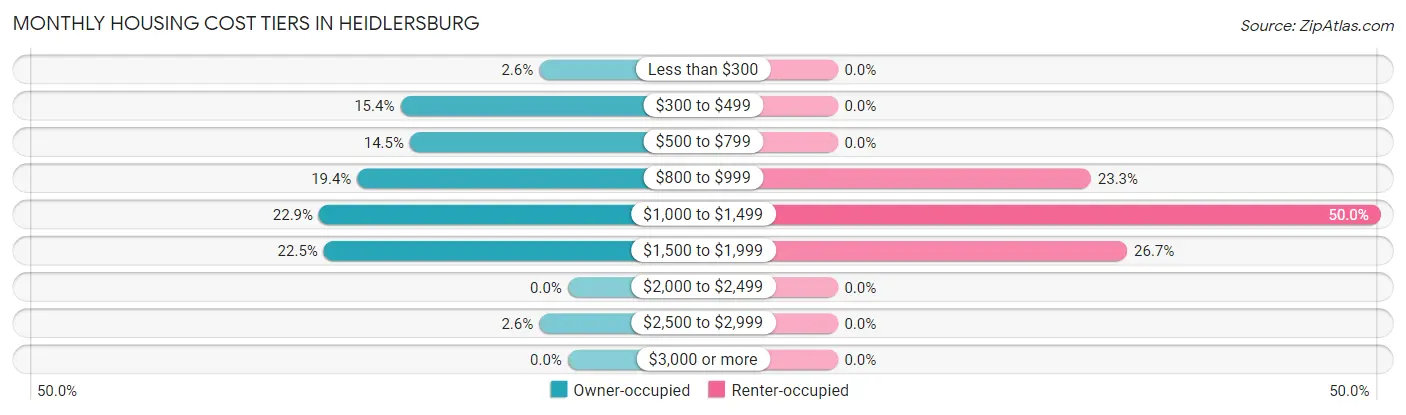
| Monthly Cost | Owner-occupied | Renter-occupied |
| Less than $300 | 6 (2.6%) | 0 (0.0%) |
| $300 to $499 | 35 (15.4%) | 0 (0.0%) |
| $500 to $799 | 33 (14.5%) | 0 (0.0%) |
| $800 to $999 | 44 (19.4%) | 7 (23.3%) |
| $1,000 to $1,499 | 52 (22.9%) | 15 (50.0%) |
| $1,500 to $1,999 | 51 (22.5%) | 8 (26.7%) |
| $2,000 to $2,499 | 0 (0.0%) | 0 (0.0%) |
| $2,500 to $2,999 | 6 (2.6%) | 0 (0.0%) |
| $3,000 or more | 0 (0.0%) | 0 (0.0%) |
| Total | 227 (100.0%) | 30 (100.0%) |
Physical Housing Characteristics in Heidlersburg
Housing Structures in Heidlersburg
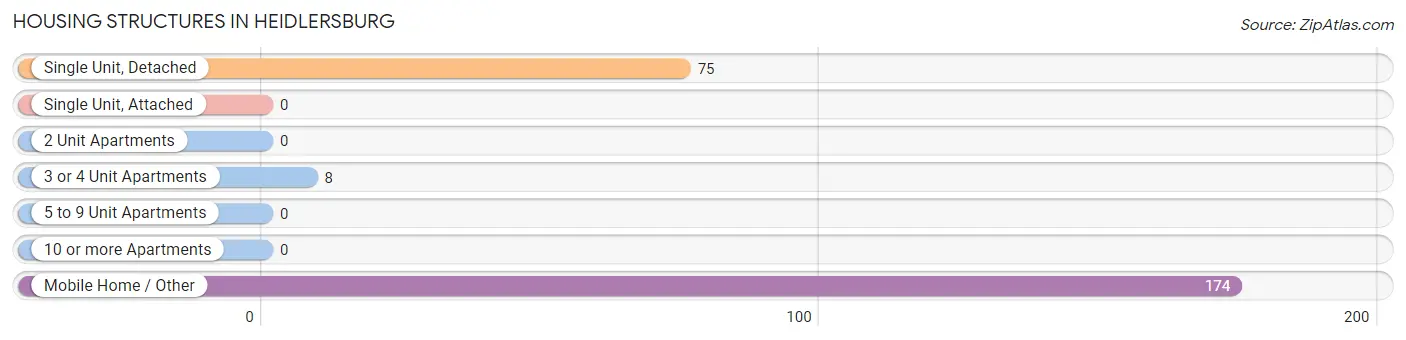
| Structure Type | # Housing Units | % Housing Units |
| Single Unit, Detached | 75 | 29.2% |
| Single Unit, Attached | 0 | 0.0% |
| 2 Unit Apartments | 0 | 0.0% |
| 3 or 4 Unit Apartments | 8 | 3.1% |
| 5 to 9 Unit Apartments | 0 | 0.0% |
| 10 or more Apartments | 0 | 0.0% |
| Mobile Home / Other | 174 | 67.7% |
| Total | 257 | 100.0% |
Housing Structures by Occupancy in Heidlersburg
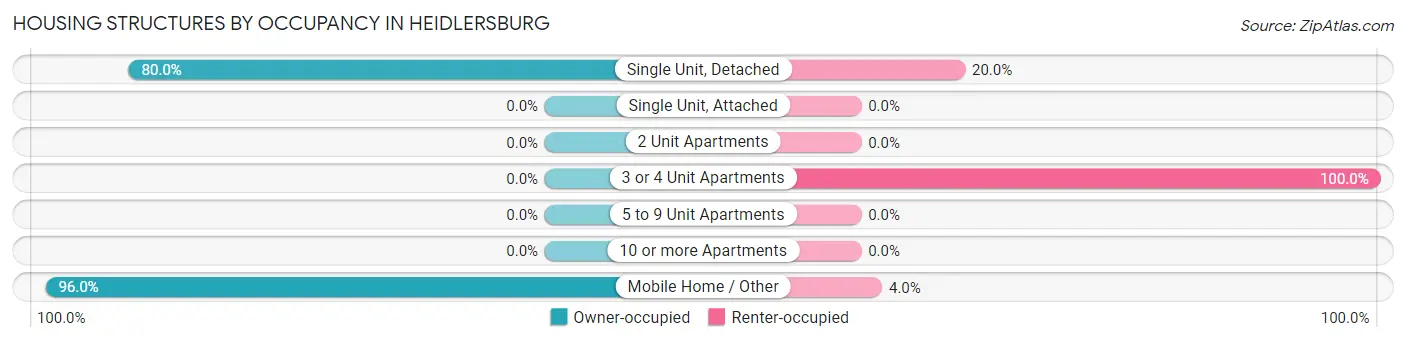
| Structure Type | Owner-occupied | Renter-occupied |
| Single Unit, Detached | 60 (80.0%) | 15 (20.0%) |
| Single Unit, Attached | 0 (0.0%) | 0 (0.0%) |
| 2 Unit Apartments | 0 (0.0%) | 0 (0.0%) |
| 3 or 4 Unit Apartments | 0 (0.0%) | 8 (100.0%) |
| 5 to 9 Unit Apartments | 0 (0.0%) | 0 (0.0%) |
| 10 or more Apartments | 0 (0.0%) | 0 (0.0%) |
| Mobile Home / Other | 167 (96.0%) | 7 (4.0%) |
| Total | 227 (88.3%) | 30 (11.7%) |
Housing Structures by Number of Rooms in Heidlersburg
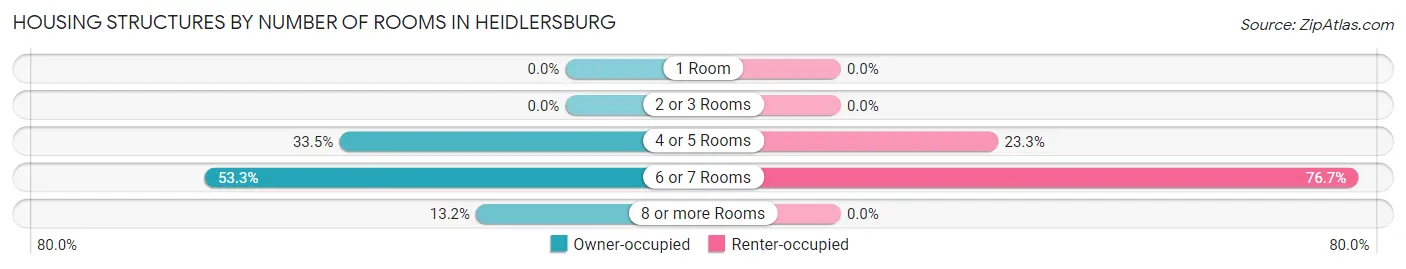
| Number of Rooms | Owner-occupied | Renter-occupied |
| 1 Room | 0 (0.0%) | 0 (0.0%) |
| 2 or 3 Rooms | 0 (0.0%) | 0 (0.0%) |
| 4 or 5 Rooms | 76 (33.5%) | 7 (23.3%) |
| 6 or 7 Rooms | 121 (53.3%) | 23 (76.7%) |
| 8 or more Rooms | 30 (13.2%) | 0 (0.0%) |
| Total | 227 (100.0%) | 30 (100.0%) |
Housing Structure by Heating Type in Heidlersburg
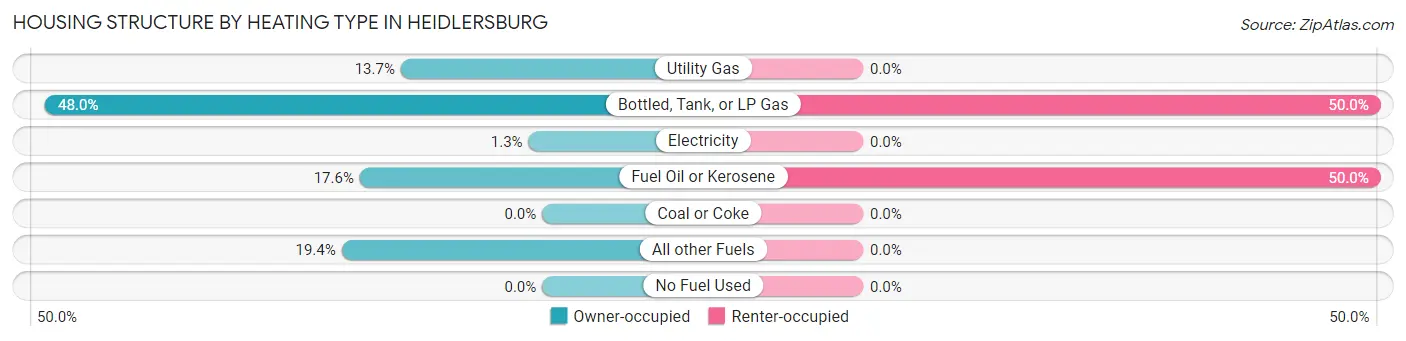
| Heating Type | Owner-occupied | Renter-occupied |
| Utility Gas | 31 (13.7%) | 0 (0.0%) |
| Bottled, Tank, or LP Gas | 109 (48.0%) | 15 (50.0%) |
| Electricity | 3 (1.3%) | 0 (0.0%) |
| Fuel Oil or Kerosene | 40 (17.6%) | 15 (50.0%) |
| Coal or Coke | 0 (0.0%) | 0 (0.0%) |
| All other Fuels | 44 (19.4%) | 0 (0.0%) |
| No Fuel Used | 0 (0.0%) | 0 (0.0%) |
| Total | 227 (100.0%) | 30 (100.0%) |
Household Vehicle Usage in Heidlersburg
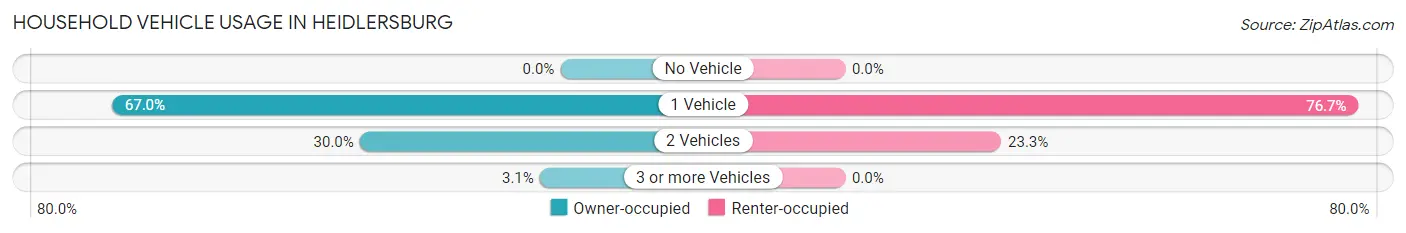
| Vehicles per Household | Owner-occupied | Renter-occupied |
| No Vehicle | 0 (0.0%) | 0 (0.0%) |
| 1 Vehicle | 152 (67.0%) | 23 (76.7%) |
| 2 Vehicles | 68 (30.0%) | 7 (23.3%) |
| 3 or more Vehicles | 7 (3.1%) | 0 (0.0%) |
| Total | 227 (100.0%) | 30 (100.0%) |
Real Estate & Mortgages in Heidlersburg
Real Estate and Mortgage Overview in Heidlersburg
| Characteristic | Without Mortgage | With Mortgage |
| Housing Units | 156 | 71 |
| Median Property Value | $50,900 | $0 |
| Median Household Income | $24,063 | $30 |
| Monthly Housing Costs | $835 | $0 |
| Real Estate Taxes | $982 | $30 |
Property Value by Mortgage Status in Heidlersburg
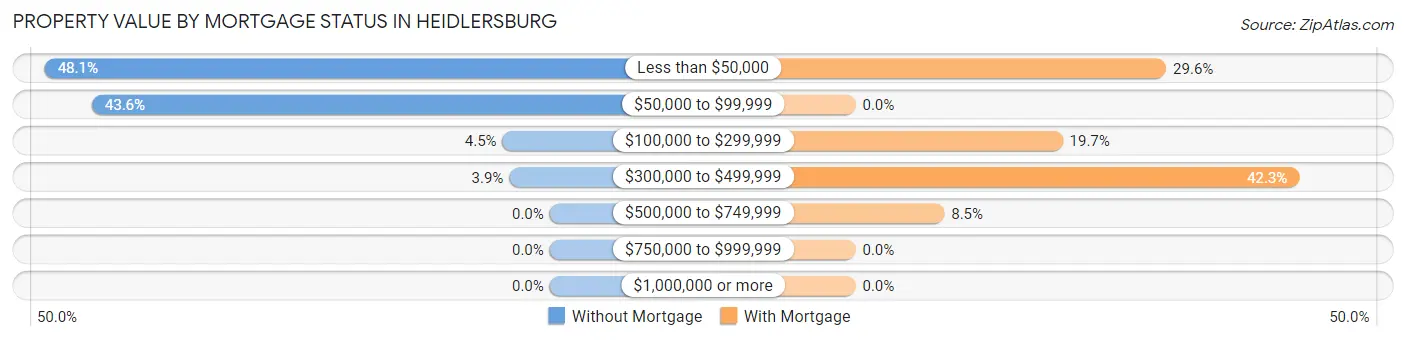
| Property Value | Without Mortgage | With Mortgage |
| Less than $50,000 | 75 (48.1%) | 21 (29.6%) |
| $50,000 to $99,999 | 68 (43.6%) | 0 (0.0%) |
| $100,000 to $299,999 | 7 (4.5%) | 14 (19.7%) |
| $300,000 to $499,999 | 6 (3.8%) | 30 (42.2%) |
| $500,000 to $749,999 | 0 (0.0%) | 6 (8.5%) |
| $750,000 to $999,999 | 0 (0.0%) | 0 (0.0%) |
| $1,000,000 or more | 0 (0.0%) | 0 (0.0%) |
| Total | 156 (100.0%) | 71 (100.0%) |
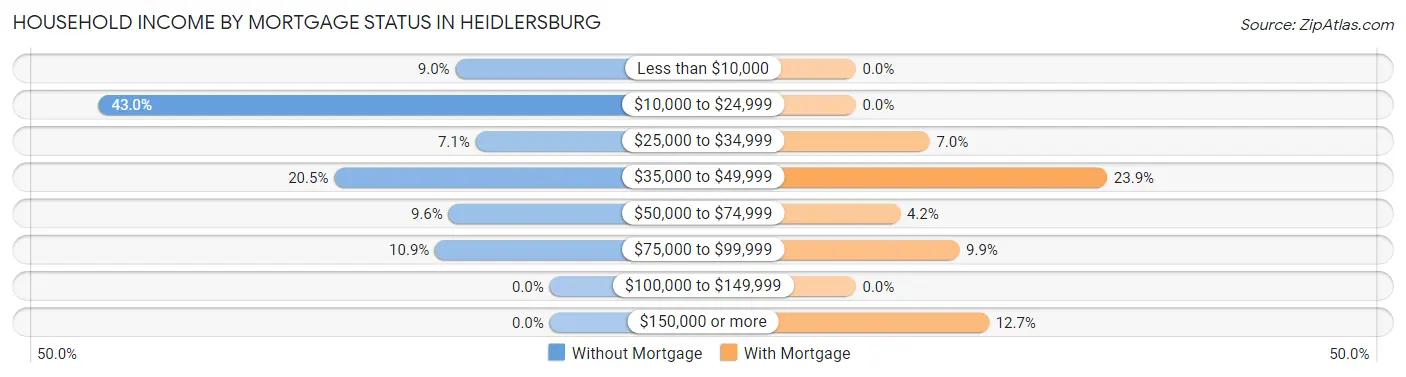
Household Income by Mortgage Status in Heidlersburg
| Household Income | Without Mortgage | With Mortgage |
| Less than $10,000 | 14 (9.0%) | 0 (0.0%) |
| $10,000 to $24,999 | 67 (42.9%) | 0 (0.0%) |
| $25,000 to $34,999 | 11 (7.0%) | 5 (7.0%) |
| $35,000 to $49,999 | 32 (20.5%) | 17 (23.9%) |
| $50,000 to $74,999 | 15 (9.6%) | 3 (4.2%) |
| $75,000 to $99,999 | 17 (10.9%) | 7 (9.9%) |
| $100,000 to $149,999 | 0 (0.0%) | 0 (0.0%) |
| $150,000 or more | 0 (0.0%) | 9 (12.7%) |
| Total | 156 (100.0%) | 71 (100.0%) |
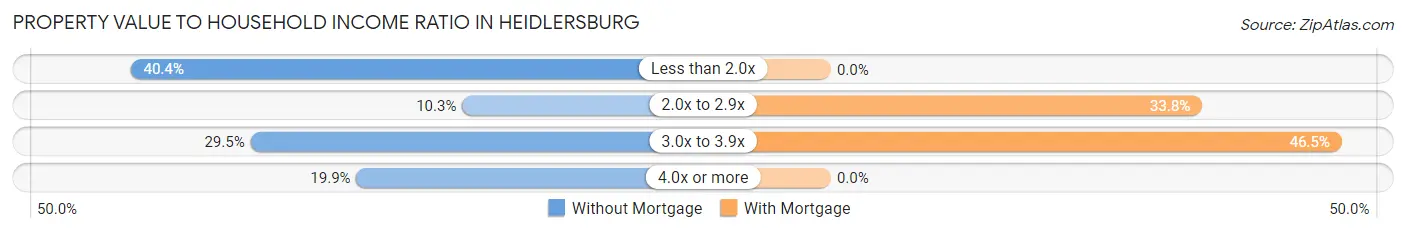
Property Value to Household Income Ratio in Heidlersburg
| Value-to-Income Ratio | Without Mortgage | With Mortgage |
| Less than 2.0x | 63 (40.4%) | 0 (0.0%) |
| 2.0x to 2.9x | 16 (10.3%) | 24 (33.8%) |
| 3.0x to 3.9x | 46 (29.5%) | 33 (46.5%) |
| 4.0x or more | 31 (19.9%) | 0 (0.0%) |
| Total | 156 (100.0%) | 71 (100.0%) |
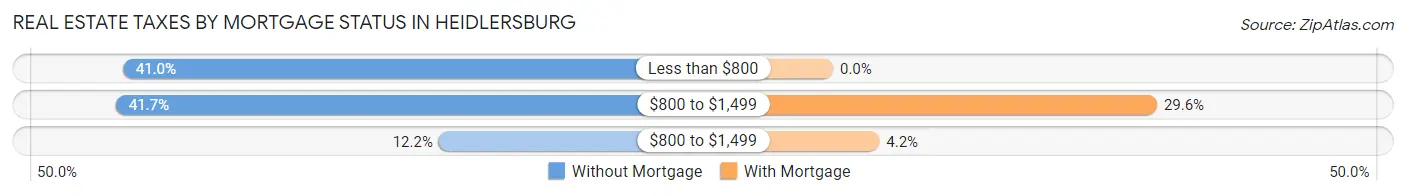
Real Estate Taxes by Mortgage Status in Heidlersburg
| Property Taxes | Without Mortgage | With Mortgage |
| Less than $800 | 64 (41.0%) | 0 (0.0%) |
| $800 to $1,499 | 65 (41.7%) | 21 (29.6%) |
| $800 to $1,499 | 19 (12.2%) | 3 (4.2%) |
| Total | 156 (100.0%) | 71 (100.0%) |
Health & Disability in Heidlersburg
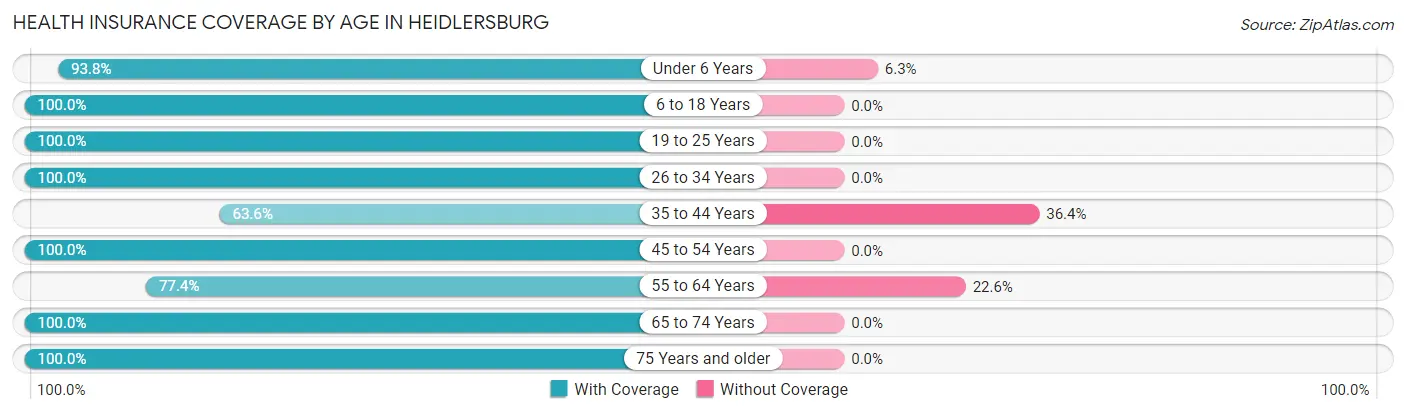
Health Insurance Coverage by Age in Heidlersburg
| Age Bracket | With Coverage | Without Coverage |
| Under 6 Years | 15 (93.8%) | 1 (6.2%) |
| 6 to 18 Years | 41 (100.0%) | 0 (0.0%) |
| 19 to 25 Years | 11 (100.0%) | 0 (0.0%) |
| 26 to 34 Years | 25 (100.0%) | 0 (0.0%) |
| 35 to 44 Years | 14 (63.6%) | 8 (36.4%) |
| 45 to 54 Years | 77 (100.0%) | 0 (0.0%) |
| 55 to 64 Years | 41 (77.4%) | 12 (22.6%) |
| 65 to 74 Years | 145 (100.0%) | 0 (0.0%) |
| 75 Years and older | 52 (100.0%) | 0 (0.0%) |
| Total | 421 (95.3%) | 21 (4.8%) |
Health Insurance Coverage by Citizenship Status in Heidlersburg
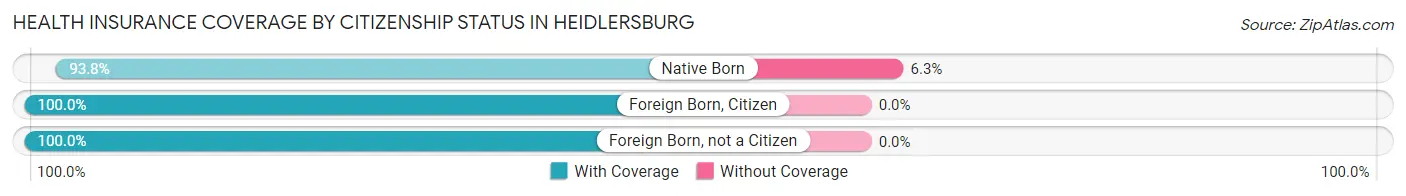
| Citizenship Status | With Coverage | Without Coverage |
| Native Born | 15 (93.8%) | 1 (6.2%) |
| Foreign Born, Citizen | 41 (100.0%) | 0 (0.0%) |
| Foreign Born, not a Citizen | 11 (100.0%) | 0 (0.0%) |
Health Insurance Coverage by Household Income in Heidlersburg
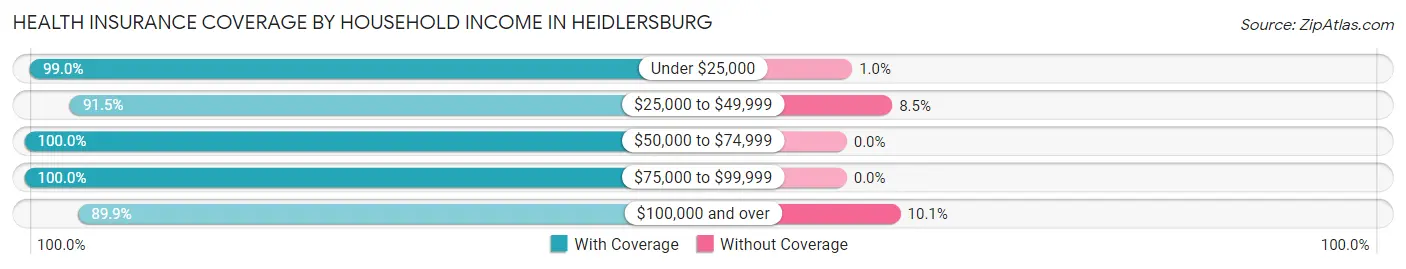
| Household Income | With Coverage | Without Coverage |
| Under $25,000 | 97 (99.0%) | 1 (1.0%) |
| $25,000 to $49,999 | 86 (91.5%) | 8 (8.5%) |
| $50,000 to $74,999 | 78 (100.0%) | 0 (0.0%) |
| $75,000 to $99,999 | 53 (100.0%) | 0 (0.0%) |
| $100,000 and over | 107 (89.9%) | 12 (10.1%) |
Public vs Private Health Insurance Coverage by Age in Heidlersburg
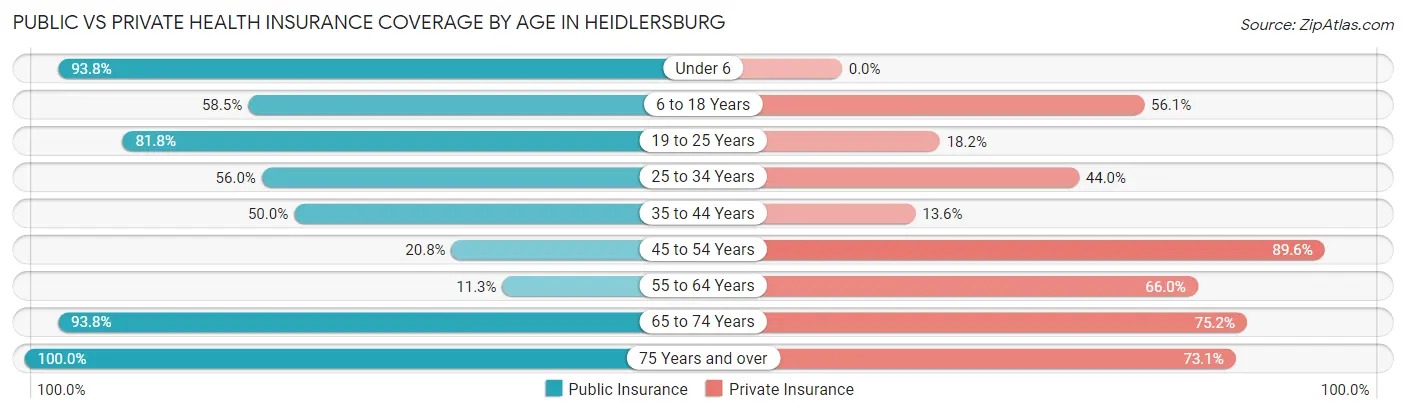
| Age Bracket | Public Insurance | Private Insurance |
| Under 6 | 15 (93.8%) | 0 (0.0%) |
| 6 to 18 Years | 24 (58.5%) | 23 (56.1%) |
| 19 to 25 Years | 9 (81.8%) | 2 (18.2%) |
| 25 to 34 Years | 14 (56.0%) | 11 (44.0%) |
| 35 to 44 Years | 11 (50.0%) | 3 (13.6%) |
| 45 to 54 Years | 16 (20.8%) | 69 (89.6%) |
| 55 to 64 Years | 6 (11.3%) | 35 (66.0%) |
| 65 to 74 Years | 136 (93.8%) | 109 (75.2%) |
| 75 Years and over | 52 (100.0%) | 38 (73.1%) |
| Total | 283 (64.0%) | 290 (65.6%) |
Disability Status by Sex by Age in Heidlersburg
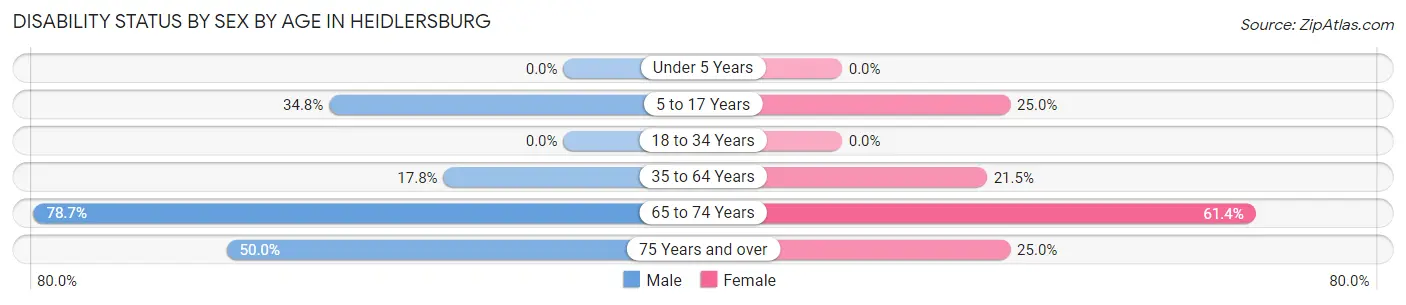
| Age Bracket | Male | Female |
| Under 5 Years | 0 (0.0%) | 0 (0.0%) |
| 5 to 17 Years | 8 (34.8%) | 6 (25.0%) |
| 18 to 34 Years | 0 (0.0%) | 0 (0.0%) |
| 35 to 64 Years | 13 (17.8%) | 17 (21.5%) |
| 65 to 74 Years | 59 (78.7%) | 43 (61.4%) |
| 75 Years and over | 4 (50.0%) | 11 (25.0%) |
Disability Class by Sex by Age in Heidlersburg
Disability Class: Hearing Difficulty
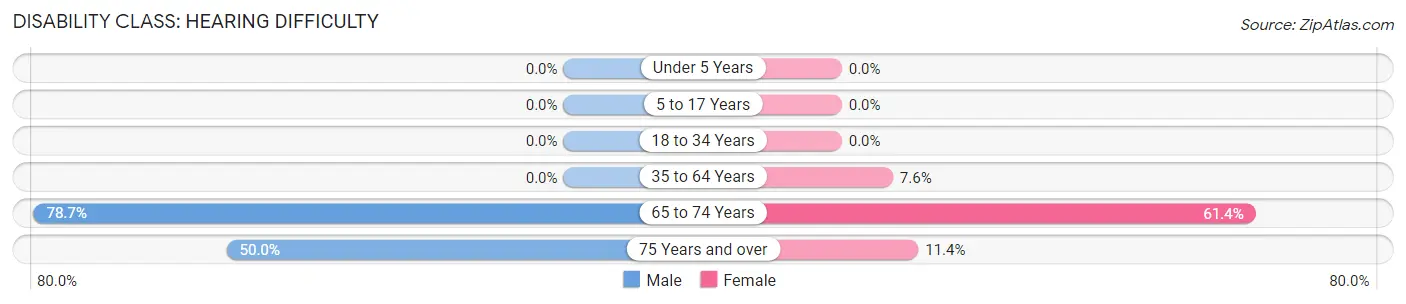
| Age Bracket | Male | Female |
| Under 5 Years | 0 (0.0%) | 0 (0.0%) |
| 5 to 17 Years | 0 (0.0%) | 0 (0.0%) |
| 18 to 34 Years | 0 (0.0%) | 0 (0.0%) |
| 35 to 64 Years | 0 (0.0%) | 6 (7.6%) |
| 65 to 74 Years | 59 (78.7%) | 43 (61.4%) |
| 75 Years and over | 4 (50.0%) | 5 (11.4%) |
Disability Class: Vision Difficulty
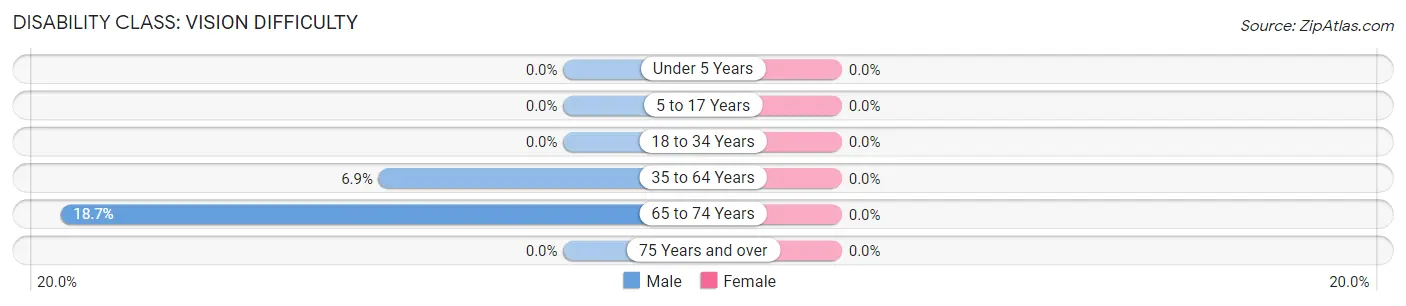
| Age Bracket | Male | Female |
| Under 5 Years | 0 (0.0%) | 0 (0.0%) |
| 5 to 17 Years | 0 (0.0%) | 0 (0.0%) |
| 18 to 34 Years | 0 (0.0%) | 0 (0.0%) |
| 35 to 64 Years | 5 (6.9%) | 0 (0.0%) |
| 65 to 74 Years | 14 (18.7%) | 0 (0.0%) |
| 75 Years and over | 0 (0.0%) | 0 (0.0%) |
Disability Class: Cognitive Difficulty
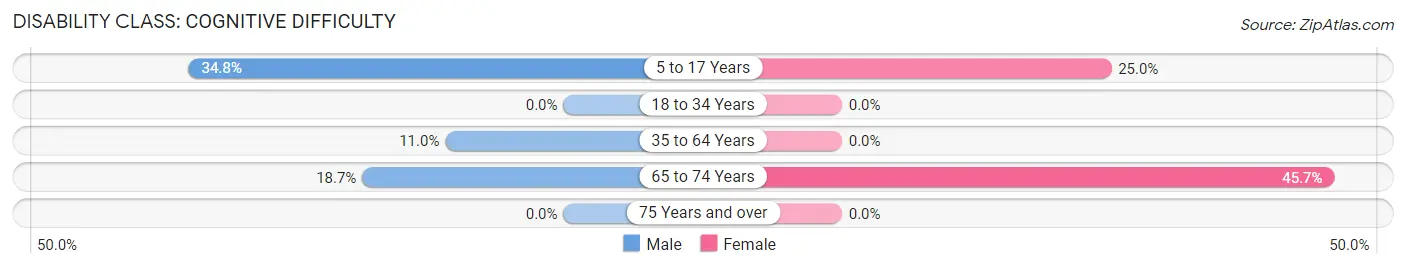
| Age Bracket | Male | Female |
| 5 to 17 Years | 8 (34.8%) | 6 (25.0%) |
| 18 to 34 Years | 0 (0.0%) | 0 (0.0%) |
| 35 to 64 Years | 8 (11.0%) | 0 (0.0%) |
| 65 to 74 Years | 14 (18.7%) | 32 (45.7%) |
| 75 Years and over | 0 (0.0%) | 0 (0.0%) |
Disability Class: Ambulatory Difficulty
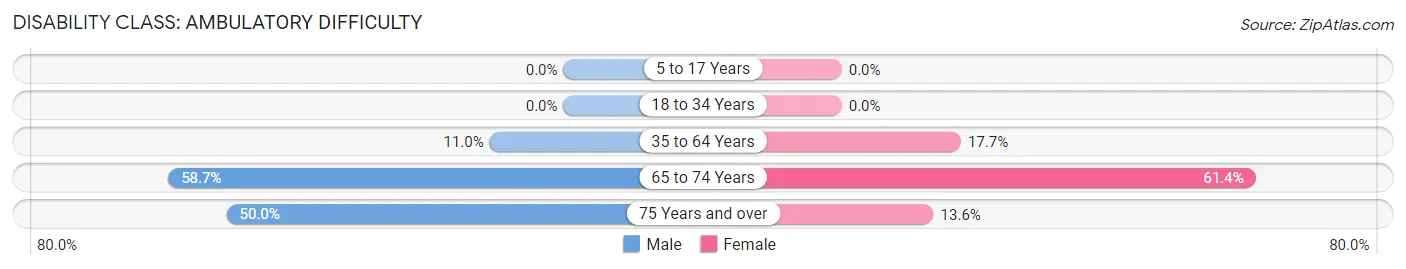
| Age Bracket | Male | Female |
| 5 to 17 Years | 0 (0.0%) | 0 (0.0%) |
| 18 to 34 Years | 0 (0.0%) | 0 (0.0%) |
| 35 to 64 Years | 8 (11.0%) | 14 (17.7%) |
| 65 to 74 Years | 44 (58.7%) | 43 (61.4%) |
| 75 Years and over | 4 (50.0%) | 6 (13.6%) |
Disability Class: Self-Care Difficulty
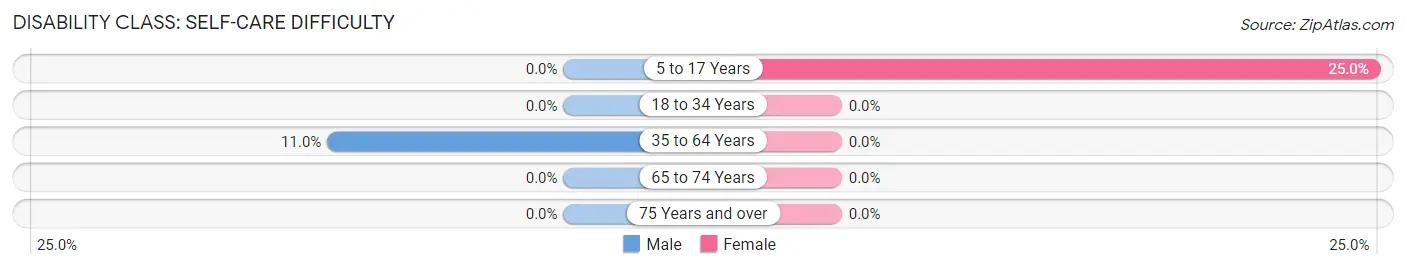
| Age Bracket | Male | Female |
| 5 to 17 Years | 0 (0.0%) | 6 (25.0%) |
| 18 to 34 Years | 0 (0.0%) | 0 (0.0%) |
| 35 to 64 Years | 8 (11.0%) | 0 (0.0%) |
| 65 to 74 Years | 0 (0.0%) | 0 (0.0%) |
| 75 Years and over | 0 (0.0%) | 0 (0.0%) |
Technology Access in Heidlersburg
Computing Device Access in Heidlersburg
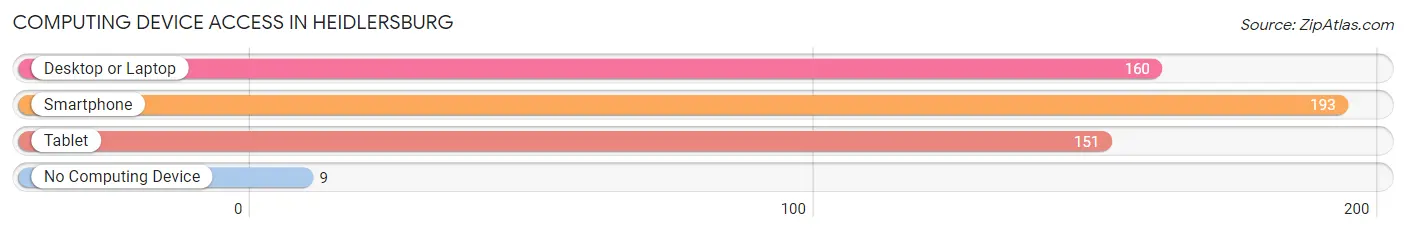
| Device Type | # Households | % Households |
| Desktop or Laptop | 160 | 62.3% |
| Smartphone | 193 | 75.1% |
| Tablet | 151 | 58.8% |
| No Computing Device | 9 | 3.5% |
| Total | 257 | 100.0% |
Internet Access in Heidlersburg
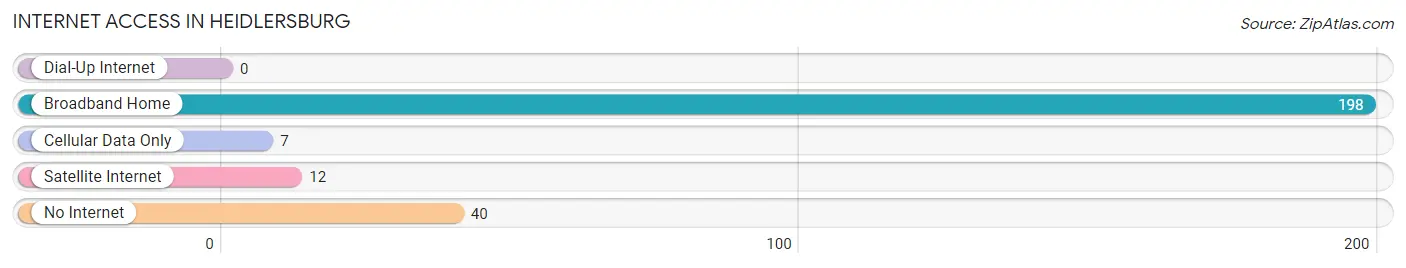
| Internet Type | # Households | % Households |
| Dial-Up Internet | 0 | 0.0% |
| Broadband Home | 198 | 77.0% |
| Cellular Data Only | 7 | 2.7% |
| Satellite Internet | 12 | 4.7% |
| No Internet | 40 | 15.6% |
| Total | 257 | 100.0% |
Heidlersburg Summary
Heidlersburg is a small unincorporated community located in Adams County, Pennsylvania. It is situated in the south-central part of the state, about 10 miles east of Gettysburg. The community is part of the Gettysburg Metropolitan Statistical Area.
History
Heidlersburg was founded in 1790 by John Heidler, a German immigrant who had settled in the area. Heidler built a log cabin and a grist mill on the banks of the Conewago Creek, which runs through the community. The mill was a major source of income for the community, and it was the first mill in the area.
The community grew slowly over the years, and by the mid-1800s, it had become a thriving agricultural center. The town was home to several businesses, including a blacksmith shop, a general store, and a post office.
In the late 1800s, the town began to decline as the railroad bypassed it. The post office closed in 1902, and the mill closed in the 1920s. The town was largely forgotten until the 1970s, when it was rediscovered by local historians.
Geography
Heidlersburg is located in south-central Pennsylvania, about 10 miles east of Gettysburg. The community is situated in the Conewago Valley, which is part of the Appalachian Mountains. The Conewago Creek runs through the town, and the surrounding area is mostly rural.
The climate in Heidlersburg is temperate, with hot summers and cold winters. The average annual temperature is around 50 degrees Fahrenheit. The average annual precipitation is around 40 inches.
Economy
Heidlersburg is a small, rural community with a limited economy. The town is home to a few small businesses, including a general store and a few restaurants. The town is also home to a few farms, which produce a variety of crops, including corn, soybeans, and hay.
The town is also home to a few small manufacturing companies, which produce a variety of products, including furniture, clothing, and electronics.
Demographics
As of the 2010 census, the population of Heidlersburg was 1,072. The population is mostly white (97.2%), with a small percentage of African Americans (1.2%) and Hispanics (1.6%). The median household income is $45,000, and the median home value is $150,000.
The town is home to a few churches, including the Heidlersburg United Methodist Church and the Heidlersburg Presbyterian Church. The town also has a few schools, including Heidlersburg Elementary School and Heidlersburg High School.
Conclusion
Heidlersburg is a small, rural community located in Adams County, Pennsylvania. It was founded in 1790 by John Heidler, and it was once a thriving agricultural center. Today, the town is home to a few small businesses, farms, and manufacturing companies. The population is mostly white, with a small percentage of African Americans and Hispanics. The median household income is $45,000, and the median home value is $150,000.
Common Questions
What is Per Capita Income in Heidlersburg?
Per Capita income in Heidlersburg is $34,582.
What is the Median Family Income in Heidlersburg?
Median Family Income in Heidlersburg is $90,481.
What is the Median Household income in Heidlersburg?
Median Household Income in Heidlersburg is $41,875.
What is Income or Wage Gap in Heidlersburg?
Income or Wage Gap in Heidlersburg is 13.0%.
Women in Heidlersburg earn 87.0 cents for every dollar earned by a man.
What is Inequality or Gini Index in Heidlersburg?
Inequality or Gini Index in Heidlersburg is 0.44.
What is the Total Population of Heidlersburg?
Total Population of Heidlersburg is 450.
What is the Total Male Population of Heidlersburg?
Total Male Population of Heidlersburg is 209.
What is the Total Female Population of Heidlersburg?
Total Female Population of Heidlersburg is 241.
What is the Ratio of Males per 100 Females in Heidlersburg?
There are 86.72 Males per 100 Females in Heidlersburg.
What is the Ratio of Females per 100 Males in Heidlersburg?
There are 115.31 Females per 100 Males in Heidlersburg.
What is the Median Population Age in Heidlersburg?
Median Population Age in Heidlersburg is 62.4 Years.
What is the Average Family Size in Heidlersburg
Average Family Size in Heidlersburg is 2.8 People.
What is the Average Household Size in Heidlersburg
Average Household Size in Heidlersburg is 1.8 People.
How Large is the Labor Force in Heidlersburg?
There are 230 People in the Labor Forcein in Heidlersburg.
What is the Percentage of People in the Labor Force in Heidlersburg?
56.8% of People are in the Labor Force in Heidlersburg.
What is the Unemployment Rate in Heidlersburg?
Unemployment Rate in Heidlersburg is 7.7%.