Cities with the Highest Percentage of Population Employed in Administrative & Support Services in Virginia
RELATED REPORTS & OPTIONS
Administrative & Support Services
Virginia
Compare Cities
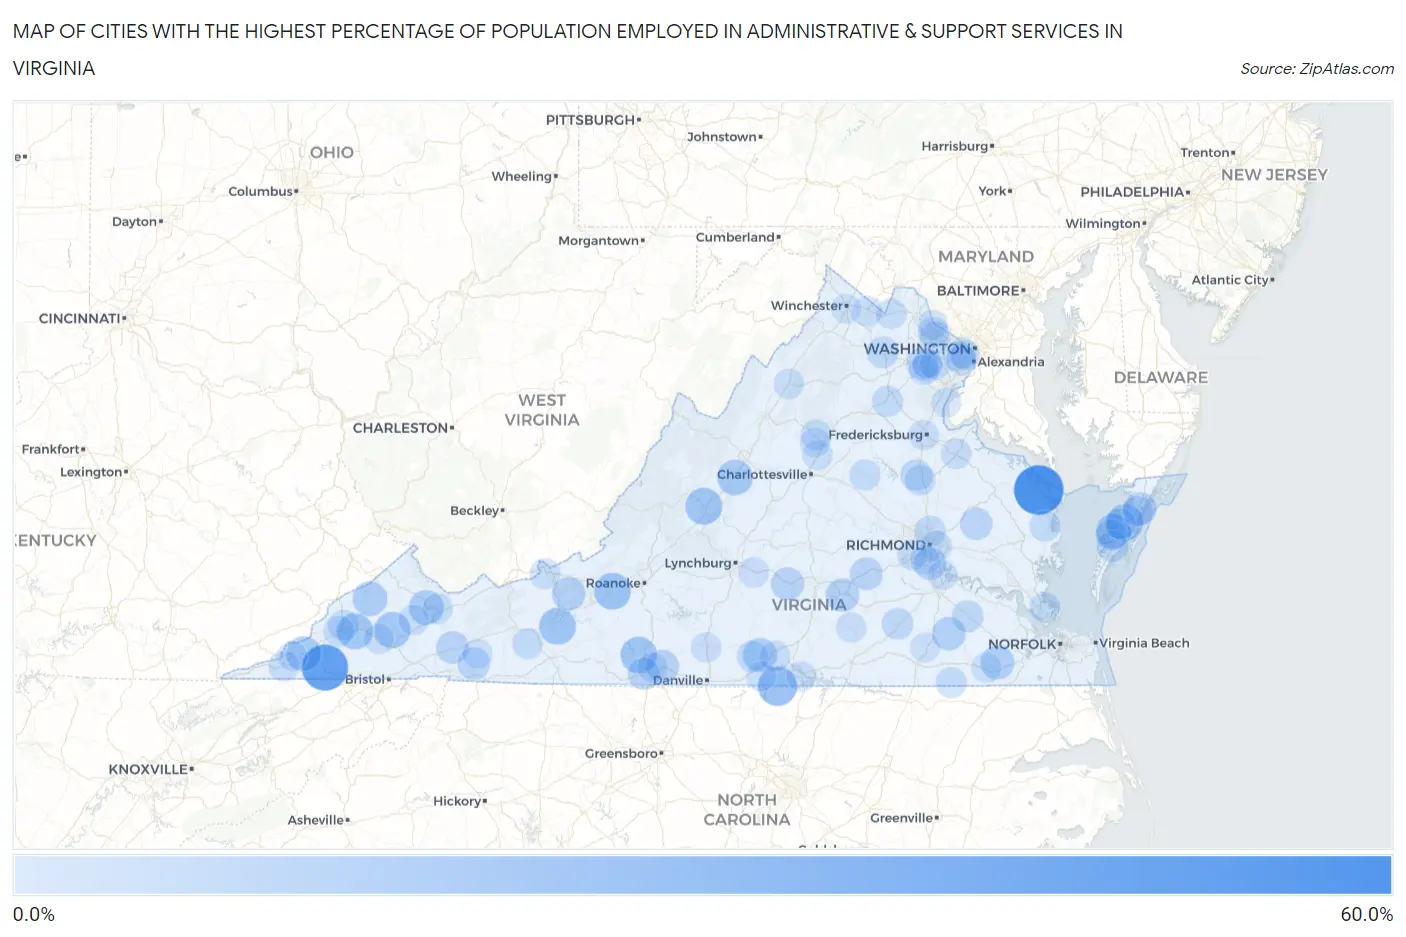
Map of Cities with the Highest Percentage of Population Employed in Administrative & Support Services in Virginia
0.0%
60.0%
Cities with the Highest Percentage of Population Employed in Administrative & Support Services in Virginia
| City | % Employed | vs State | vs National | |
| 1. | Heathsville | 52.6% | 4.1%(+48.5)#1 | 4.1%(+48.5)#49 |
| 2. | Clinchport | 44.4% | 4.1%(+40.3)#2 | 4.1%(+40.3)#81 |
| 3. | Virgilina | 27.5% | 4.1%(+23.4)#3 | 4.1%(+23.4)#232 |
| 4. | East Lexington | 22.2% | 4.1%(+18.1)#4 | 4.1%(+18.1)#365 |
| 5. | Hiwassee | 22.2% | 4.1%(+18.1)#5 | 4.1%(+18.1)#368 |
| 6. | Elliston | 22.0% | 4.1%(+17.9)#6 | 4.1%(+17.8)#375 |
| 7. | Onley | 21.5% | 4.1%(+17.4)#7 | 4.1%(+17.4)#392 |
| 8. | Bassett | 21.3% | 4.1%(+17.2)#8 | 4.1%(+17.2)#397 |
| 9. | Riverview | 20.8% | 4.1%(+16.7)#9 | 4.1%(+16.7)#410 |
| 10. | Cleveland | 20.4% | 4.1%(+16.3)#10 | 4.1%(+16.3)#425 |
| 11. | Greenville | 19.3% | 4.1%(+15.1)#11 | 4.1%(+15.1)#475 |
| 12. | Pungoteague | 18.8% | 4.1%(+14.6)#12 | 4.1%(+14.6)#495 |
| 13. | Dryden | 18.4% | 4.1%(+14.2)#13 | 4.1%(+14.2)#516 |
| 14. | Great Falls Crossing | 18.0% | 4.1%(+13.8)#14 | 4.1%(+13.8)#544 |
| 15. | Camp Barrett | 17.9% | 4.1%(+13.7)#15 | 4.1%(+13.7)#552 |
| 16. | Raven | 17.7% | 4.1%(+13.6)#16 | 4.1%(+13.6)#560 |
| 17. | Eggleston | 17.5% | 4.1%(+13.4)#17 | 4.1%(+13.4)#576 |
| 18. | Clinchco | 17.0% | 4.1%(+12.9)#18 | 4.1%(+12.9)#607 |
| 19. | Halifax | 16.0% | 4.1%(+11.8)#19 | 4.1%(+11.8)#687 |
| 20. | Afton | 15.7% | 4.1%(+11.5)#20 | 4.1%(+11.5)#714 |
| 21. | Moneta | 15.6% | 4.1%(+11.5)#21 | 4.1%(+11.5)#718 |
| 22. | Carrsville | 15.6% | 4.1%(+11.5)#22 | 4.1%(+11.5)#721 |
| 23. | Sussex | 14.8% | 4.1%(+10.7)#23 | 4.1%(+10.7)#825 |
| 24. | Belspring | 14.6% | 4.1%(+10.4)#24 | 4.1%(+10.4)#853 |
| 25. | Burkeville | 14.2% | 4.1%(+10.1)#25 | 4.1%(+10.1)#913 |
| 26. | Pamplin City | 13.8% | 4.1%(+9.66)#26 | 4.1%(+9.64)#971 |
| 27. | Gargatha | 13.6% | 4.1%(+9.44)#27 | 4.1%(+9.43)#1,022 |
| 28. | Laurel Park | 13.3% | 4.1%(+9.16)#28 | 4.1%(+9.15)#1,063 |
| 29. | Amelia Court House | 13.2% | 4.1%(+9.11)#29 | 4.1%(+9.10)#1,070 |
| 30. | Seven Mile Ford | 12.8% | 4.1%(+8.67)#30 | 4.1%(+8.66)#1,153 |
| 31. | Bellwood | 12.8% | 4.1%(+8.63)#31 | 4.1%(+8.61)#1,166 |
| 32. | King William | 12.3% | 4.1%(+8.21)#32 | 4.1%(+8.20)#1,236 |
| 33. | Troutdale | 12.3% | 4.1%(+8.19)#33 | 4.1%(+8.18)#1,241 |
| 34. | Sudley | 11.9% | 4.1%(+7.76)#34 | 4.1%(+7.75)#1,334 |
| 35. | Horse Pasture | 11.7% | 4.1%(+7.60)#35 | 4.1%(+7.59)#1,368 |
| 36. | Waverly | 10.9% | 4.1%(+6.74)#36 | 4.1%(+6.73)#1,593 |
| 37. | Marshall | 10.8% | 4.1%(+6.65)#37 | 4.1%(+6.64)#1,618 |
| 38. | Exmore | 10.6% | 4.1%(+6.50)#38 | 4.1%(+6.49)#1,653 |
| 39. | Lake Land Or | 10.5% | 4.1%(+6.39)#39 | 4.1%(+6.37)#1,695 |
| 40. | Mckenney | 10.4% | 4.1%(+6.23)#40 | 4.1%(+6.21)#1,757 |
| 41. | Mountain Road | 10.0% | 4.1%(+5.84)#41 | 4.1%(+5.83)#1,925 |
| 42. | Boston | 9.9% | 4.1%(+5.77)#42 | 4.1%(+5.76)#1,948 |
| 43. | Hiltons | 9.9% | 4.1%(+5.74)#43 | 4.1%(+5.73)#1,959 |
| 44. | Chamberlayne | 9.8% | 4.1%(+5.63)#44 | 4.1%(+5.62)#2,003 |
| 45. | Remington | 9.6% | 4.1%(+5.47)#45 | 4.1%(+5.45)#2,072 |
| 46. | Montrose | 9.4% | 4.1%(+5.28)#46 | 4.1%(+5.27)#2,156 |
| 47. | Louisa | 9.4% | 4.1%(+5.25)#47 | 4.1%(+5.24)#2,175 |
| 48. | Wise | 9.3% | 4.1%(+5.19)#48 | 4.1%(+5.18)#2,197 |
| 49. | Savageville | 9.3% | 4.1%(+5.15)#49 | 4.1%(+5.13)#2,218 |
| 50. | Earlysville | 9.3% | 4.1%(+5.14)#50 | 4.1%(+5.13)#2,221 |
| 51. | Norton | 9.2% | 4.1%(+5.10)#51 | 4.1%(+5.09)#2,241 |
| 52. | Branchville | 9.2% | 4.1%(+5.09)#52 | 4.1%(+5.08)#2,249 |
| 53. | Allison Gap | 9.2% | 4.1%(+5.08)#53 | 4.1%(+5.07)#2,255 |
| 54. | Herndon | 9.1% | 4.1%(+4.94)#54 | 4.1%(+4.92)#2,339 |
| 55. | Bethel Manor | 9.0% | 4.1%(+4.91)#55 | 4.1%(+4.90)#2,354 |
| 56. | Lake Caroline | 9.0% | 4.1%(+4.89)#56 | 4.1%(+4.88)#2,362 |
| 57. | Irvington | 8.8% | 4.1%(+4.71)#57 | 4.1%(+4.70)#2,470 |
| 58. | Ivanhoe | 8.8% | 4.1%(+4.63)#58 | 4.1%(+4.62)#2,513 |
| 59. | Stanardsville | 8.7% | 4.1%(+4.60)#59 | 4.1%(+4.58)#2,534 |
| 60. | Scottsburg | 8.6% | 4.1%(+4.48)#60 | 4.1%(+4.47)#2,609 |
| 61. | Sterling | 8.6% | 4.1%(+4.43)#61 | 4.1%(+4.42)#2,640 |
| 62. | Narrows | 8.4% | 4.1%(+4.28)#62 | 4.1%(+4.27)#2,724 |
| 63. | Woodlawn Cdp Fairfax County | 8.3% | 4.1%(+4.21)#63 | 4.1%(+4.19)#2,770 |
| 64. | Metompkin | 8.2% | 4.1%(+4.05)#64 | 4.1%(+4.04)#2,877 |
| 65. | Cedar Bluff | 8.1% | 4.1%(+3.94)#65 | 4.1%(+3.93)#2,942 |
| 66. | Round Hill | 8.0% | 4.1%(+3.91)#66 | 4.1%(+3.90)#2,962 |
| 67. | Port Royal | 8.0% | 4.1%(+3.91)#67 | 4.1%(+3.90)#2,965 |
| 68. | Honaker | 8.0% | 4.1%(+3.88)#68 | 4.1%(+3.87)#2,978 |
| 69. | Jonesville | 7.9% | 4.1%(+3.78)#69 | 4.1%(+3.76)#3,055 |
| 70. | Rockwood | 7.8% | 4.1%(+3.70)#70 | 4.1%(+3.69)#3,122 |
| 71. | Manassas Park | 7.8% | 4.1%(+3.64)#71 | 4.1%(+3.63)#3,161 |
| 72. | Baywood | 7.8% | 4.1%(+3.62)#72 | 4.1%(+3.61)#3,179 |
| 73. | Concord | 7.7% | 4.1%(+3.59)#73 | 4.1%(+3.58)#3,200 |
| 74. | Fredericksburg | 7.7% | 4.1%(+3.53)#74 | 4.1%(+3.51)#3,256 |
| 75. | Seven Corners | 7.7% | 4.1%(+3.52)#75 | 4.1%(+3.51)#3,259 |
| 76. | New Market | 7.6% | 4.1%(+3.51)#76 | 4.1%(+3.50)#3,271 |
| 77. | Kenbridge | 7.6% | 4.1%(+3.48)#77 | 4.1%(+3.47)#3,293 |
| 78. | Berryville | 7.6% | 4.1%(+3.45)#78 | 4.1%(+3.44)#3,315 |
| 79. | Martinsville | 7.5% | 4.1%(+3.32)#79 | 4.1%(+3.30)#3,445 |
| 80. | Chatham | 7.4% | 4.1%(+3.25)#80 | 4.1%(+3.24)#3,508 |
| 81. | Countryside | 7.4% | 4.1%(+3.22)#81 | 4.1%(+3.20)#3,540 |
| 82. | Castlewood | 7.4% | 4.1%(+3.22)#82 | 4.1%(+3.20)#3,542 |
| 83. | Manassas | 7.3% | 4.1%(+3.20)#83 | 4.1%(+3.19)#3,551 |
| 84. | Piney Mountain | 7.3% | 4.1%(+3.13)#84 | 4.1%(+3.12)#3,615 |
| 85. | Sugar Grove | 7.1% | 4.1%(+3.01)#85 | 4.1%(+2.99)#3,740 |
| 86. | Quantico | 7.1% | 4.1%(+2.94)#86 | 4.1%(+2.93)#3,811 |
| 87. | Jarratt | 7.1% | 4.1%(+2.93)#87 | 4.1%(+2.92)#3,830 |
| 88. | Clifton | 7.1% | 4.1%(+2.93)#88 | 4.1%(+2.92)#3,831 |
| 89. | Pennington Gap | 7.0% | 4.1%(+2.91)#89 | 4.1%(+2.89)#3,862 |
| 90. | Yorkshire | 7.0% | 4.1%(+2.89)#90 | 4.1%(+2.87)#3,890 |
| 91. | Cluster Springs | 7.0% | 4.1%(+2.88)#91 | 4.1%(+2.87)#3,891 |
| 92. | Clarksville | 7.0% | 4.1%(+2.83)#92 | 4.1%(+2.81)#3,943 |
| 93. | Franklin | 6.9% | 4.1%(+2.76)#93 | 4.1%(+2.75)#3,987 |
| 94. | Twin Lakes | 6.8% | 4.1%(+2.70)#94 | 4.1%(+2.69)#4,061 |
| 95. | Winchester | 6.8% | 4.1%(+2.67)#95 | 4.1%(+2.66)#4,082 |
| 96. | Meadowbrook | 6.8% | 4.1%(+2.67)#96 | 4.1%(+2.66)#4,090 |
| 97. | Annandale | 6.8% | 4.1%(+2.66)#97 | 4.1%(+2.65)#4,099 |
| 98. | Enon | 6.8% | 4.1%(+2.64)#98 | 4.1%(+2.62)#4,122 |
| 99. | Bailey S Crossroads | 6.8% | 4.1%(+2.64)#99 | 4.1%(+2.62)#4,123 |
| 100. | Lincolnia | 6.8% | 4.1%(+2.63)#100 | 4.1%(+2.62)#4,129 |
Common Questions
What are the Top 10 Cities with the Highest Percentage of Population Employed in Administrative & Support Services in Virginia?
Top 10 Cities with the Highest Percentage of Population Employed in Administrative & Support Services in Virginia are:
#1
52.6%
#2
44.4%
#3
27.5%
#4
22.2%
#5
22.2%
#6
22.0%
#7
21.5%
#8
21.3%
#9
20.8%
#10
20.4%
What city has the Highest Percentage of Population Employed in Administrative & Support Services in Virginia?
Heathsville has the Highest Percentage of Population Employed in Administrative & Support Services in Virginia with 52.6%.
What is the Percentage of Population Employed in Administrative & Support Services in the State of Virginia?
Percentage of Population Employed in Administrative & Support Services in Virginia is 4.1%.
What is the Percentage of Population Employed in Administrative & Support Services in the United States?
Percentage of Population Employed in Administrative & Support Services in the United States is 4.1%.