Cities with the Highest Percentage of Population Employed in Administrative & Support Services in Texas
RELATED REPORTS & OPTIONS
Administrative & Support Services
Texas
Compare Cities
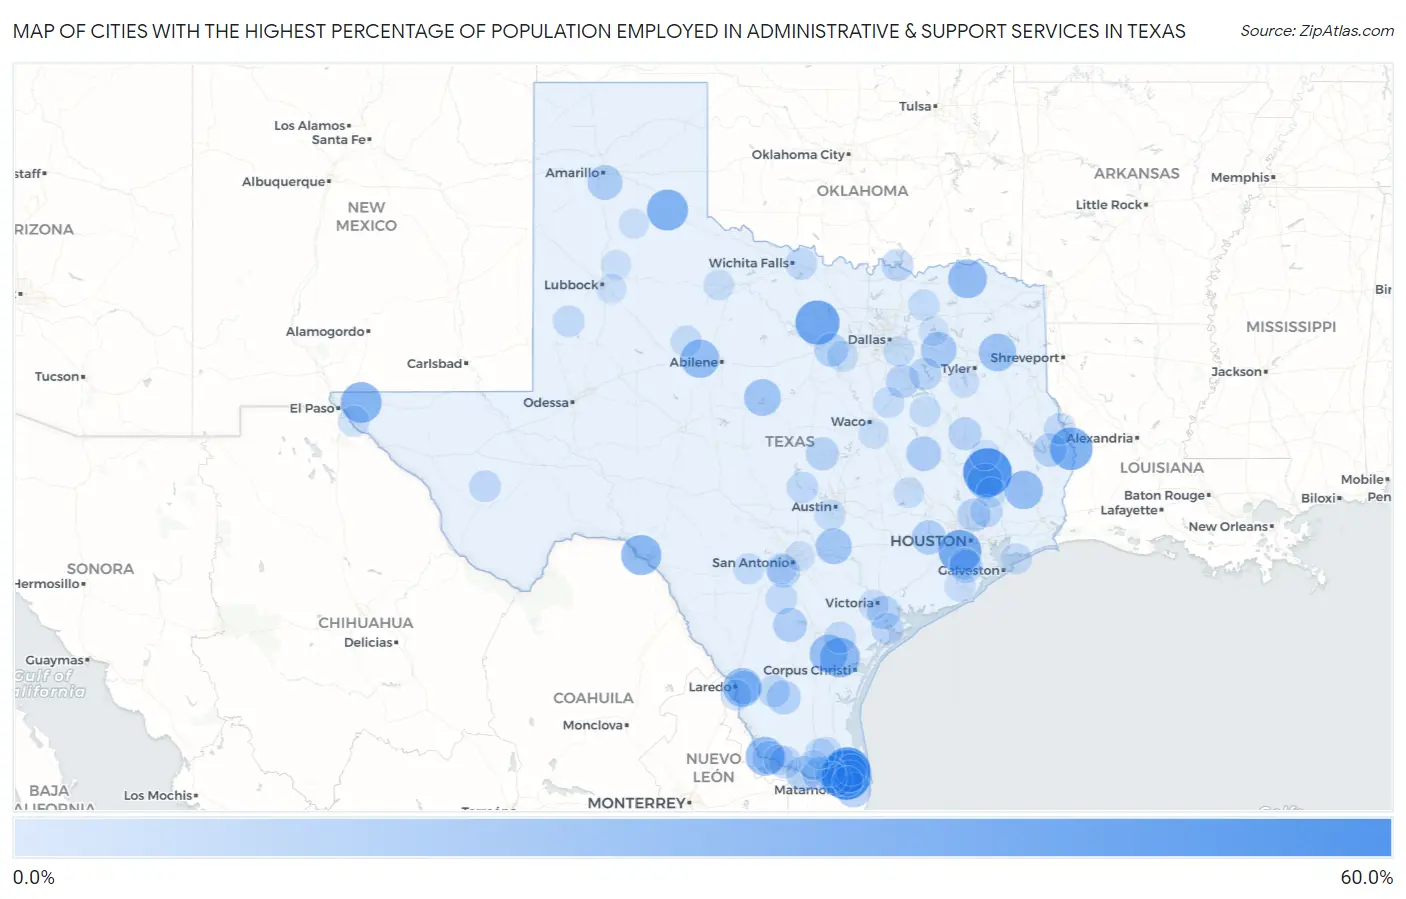
Map of Cities with the Highest Percentage of Population Employed in Administrative & Support Services in Texas
0.0%
60.0%
Cities with the Highest Percentage of Population Employed in Administrative & Support Services in Texas
| City | % Employed | vs State | vs National | |
| 1. | Green Valley Farms | 53.0% | 4.4%(+48.6)#1 | 4.1%(+48.8)#47 |
| 2. | Cedar Point | 50.9% | 4.4%(+46.5)#2 | 4.1%(+46.8)#55 |
| 3. | Lozano | 44.5% | 4.4%(+40.1)#3 | 4.1%(+40.4)#80 |
| 4. | Perrin | 41.3% | 4.4%(+36.9)#4 | 4.1%(+37.2)#98 |
| 5. | Fifth Street | 38.3% | 4.4%(+33.9)#5 | 4.1%(+34.2)#115 |
| 6. | South Toledo Bend | 37.7% | 4.4%(+33.3)#6 | 4.1%(+33.6)#118 |
| 7. | Lakeview | 34.6% | 4.4%(+30.2)#7 | 4.1%(+30.5)#129 |
| 8. | Butterfield | 33.8% | 4.4%(+29.4)#8 | 4.1%(+29.6)#137 |
| 9. | Amistad | 32.4% | 4.4%(+28.0)#9 | 4.1%(+28.3)#150 |
| 10. | Edroy | 31.4% | 4.4%(+26.9)#10 | 4.1%(+27.2)#166 |
| 11. | Sun Valley | 29.5% | 4.4%(+25.1)#11 | 4.1%(+25.4)#190 |
| 12. | Loma Vista | 29.5% | 4.4%(+25.1)#12 | 4.1%(+25.3)#193 |
| 13. | San Carlos I | 29.4% | 4.4%(+25.0)#13 | 4.1%(+25.3)#194 |
| 14. | Trent | 28.8% | 4.4%(+24.4)#14 | 4.1%(+24.7)#210 |
| 15. | Wildwood | 28.7% | 4.4%(+24.3)#15 | 4.1%(+24.5)#213 |
| 16. | Sandia | 28.1% | 4.4%(+23.6)#16 | 4.1%(+23.9)#223 |
| 17. | Union Grove | 26.6% | 4.4%(+22.2)#17 | 4.1%(+22.4)#247 |
| 18. | Thunderbird Bay | 25.3% | 4.4%(+20.8)#18 | 4.1%(+21.1)#270 |
| 19. | Kingsbury | 23.5% | 4.4%(+19.1)#19 | 4.1%(+19.4)#324 |
| 20. | Myrtle Springs | 22.7% | 4.4%(+18.3)#20 | 4.1%(+18.6)#354 |
| 21. | Cape Royale | 22.4% | 4.4%(+18.0)#21 | 4.1%(+18.2)#362 |
| 22. | Rowena | 22.1% | 4.4%(+17.7)#22 | 4.1%(+18.0)#371 |
| 23. | Granjeno | 21.6% | 4.4%(+17.2)#23 | 4.1%(+17.5)#388 |
| 24. | Villa Pancho | 21.3% | 4.4%(+16.9)#24 | 4.1%(+17.2)#398 |
| 25. | Palisades | 21.2% | 4.4%(+16.8)#25 | 4.1%(+17.1)#400 |
| 26. | Hilltop Lakes | 20.9% | 4.4%(+16.5)#26 | 4.1%(+16.8)#409 |
| 27. | Sargent | 20.8% | 4.4%(+16.3)#27 | 4.1%(+16.6)#413 |
| 28. | San Felipe | 20.3% | 4.4%(+15.8)#28 | 4.1%(+16.1)#430 |
| 29. | Tilden | 19.5% | 4.4%(+15.1)#29 | 4.1%(+15.3)#462 |
| 30. | Ranchitos East | 19.4% | 4.4%(+14.9)#30 | 4.1%(+15.2)#468 |
| 31. | Las Lomitas | 19.4% | 4.4%(+14.9)#31 | 4.1%(+15.2)#471 |
| 32. | Western Lake | 18.7% | 4.4%(+14.3)#32 | 4.1%(+14.6)#500 |
| 33. | Browndell | 18.5% | 4.4%(+14.1)#33 | 4.1%(+14.4)#504 |
| 34. | Bloomington | 18.3% | 4.4%(+13.8)#34 | 4.1%(+14.1)#522 |
| 35. | Campo Verde | 18.2% | 4.4%(+13.8)#35 | 4.1%(+14.1)#526 |
| 36. | Emhouse | 17.9% | 4.4%(+13.5)#36 | 4.1%(+13.8)#547 |
| 37. | Scissors | 17.8% | 4.4%(+13.4)#37 | 4.1%(+13.6)#555 |
| 38. | Rosharon | 17.7% | 4.4%(+13.3)#38 | 4.1%(+13.6)#558 |
| 39. | Kempner | 17.7% | 4.4%(+13.3)#39 | 4.1%(+13.6)#559 |
| 40. | Latexo | 17.6% | 4.4%(+13.2)#40 | 4.1%(+13.5)#564 |
| 41. | Porter Heights | 17.5% | 4.4%(+13.1)#41 | 4.1%(+13.3)#577 |
| 42. | Von Ormy | 16.7% | 4.4%(+12.3)#42 | 4.1%(+12.6)#627 |
| 43. | E Lopez | 16.2% | 4.4%(+11.8)#43 | 4.1%(+12.1)#672 |
| 44. | Tool | 16.2% | 4.4%(+11.7)#44 | 4.1%(+12.0)#675 |
| 45. | Hilltop Cdp Frio County | 15.9% | 4.4%(+11.5)#45 | 4.1%(+11.8)#691 |
| 46. | Yancey | 15.9% | 4.4%(+11.5)#46 | 4.1%(+11.8)#692 |
| 47. | Bruni | 15.8% | 4.4%(+11.4)#47 | 4.1%(+11.7)#696 |
| 48. | Austwell | 15.8% | 4.4%(+11.4)#48 | 4.1%(+11.6)#701 |
| 49. | Preston | 15.7% | 4.4%(+11.3)#49 | 4.1%(+11.6)#705 |
| 50. | Los Indios | 15.6% | 4.4%(+11.2)#50 | 4.1%(+11.4)#725 |
| 51. | Plum Grove | 15.4% | 4.4%(+11.0)#51 | 4.1%(+11.3)#746 |
| 52. | Cade Lakes | 15.1% | 4.4%(+10.7)#52 | 4.1%(+10.9)#782 |
| 53. | Skidmore | 15.1% | 4.4%(+10.7)#53 | 4.1%(+10.9)#784 |
| 54. | Sunrise Shores | 15.0% | 4.4%(+10.5)#54 | 4.1%(+10.8)#795 |
| 55. | Lingleville | 14.9% | 4.4%(+10.5)#55 | 4.1%(+10.8)#805 |
| 56. | Jolly | 14.9% | 4.4%(+10.4)#56 | 4.1%(+10.7)#816 |
| 57. | Fort Davis | 14.8% | 4.4%(+10.4)#57 | 4.1%(+10.7)#826 |
| 58. | Sandy Point | 14.6% | 4.4%(+10.2)#58 | 4.1%(+10.5)#845 |
| 59. | Cottonwood Shores | 14.6% | 4.4%(+10.2)#59 | 4.1%(+10.5)#848 |
| 60. | Milam | 14.6% | 4.4%(+10.2)#60 | 4.1%(+10.4)#852 |
| 61. | Rosanky | 14.4% | 4.4%(+10.00)#61 | 4.1%(+10.3)#880 |
| 62. | Wellman | 14.4% | 4.4%(+10.00)#62 | 4.1%(+10.3)#881 |
| 63. | Indian Lake | 14.4% | 4.4%(+9.94)#63 | 4.1%(+10.2)#891 |
| 64. | Roby | 14.2% | 4.4%(+9.74)#64 | 4.1%(+10.0)#919 |
| 65. | Morning Glory | 14.1% | 4.4%(+9.71)#65 | 4.1%(+9.98)#926 |
| 66. | Charlotte | 14.1% | 4.4%(+9.68)#66 | 4.1%(+9.95)#932 |
| 67. | Beauxart Gardens | 14.0% | 4.4%(+9.61)#67 | 4.1%(+9.87)#941 |
| 68. | La Tina Ranch | 14.0% | 4.4%(+9.57)#68 | 4.1%(+9.83)#946 |
| 69. | Road Runner | 13.7% | 4.4%(+9.31)#69 | 4.1%(+9.58)#988 |
| 70. | Macdona | 13.7% | 4.4%(+9.31)#70 | 4.1%(+9.58)#989 |
| 71. | Solis | 13.7% | 4.4%(+9.28)#71 | 4.1%(+9.55)#995 |
| 72. | Manchaca | 13.7% | 4.4%(+9.27)#72 | 4.1%(+9.54)#996 |
| 73. | Bolivar Peninsula | 13.7% | 4.4%(+9.25)#73 | 4.1%(+9.51)#1,000 |
| 74. | Lasara | 13.6% | 4.4%(+9.23)#74 | 4.1%(+9.50)#1,002 |
| 75. | Pendleton | 13.6% | 4.4%(+9.17)#75 | 4.1%(+9.43)#1,021 |
| 76. | Bluetown | 13.6% | 4.4%(+9.16)#76 | 4.1%(+9.42)#1,024 |
| 77. | Fairfield | 13.5% | 4.4%(+9.13)#77 | 4.1%(+9.40)#1,028 |
| 78. | Hubbard | 13.5% | 4.4%(+9.07)#78 | 4.1%(+9.34)#1,035 |
| 79. | Rio Bravo | 13.5% | 4.4%(+9.07)#79 | 4.1%(+9.33)#1,036 |
| 80. | Cresson | 13.4% | 4.4%(+8.96)#80 | 4.1%(+9.22)#1,051 |
| 81. | Celeste | 13.4% | 4.4%(+8.94)#81 | 4.1%(+9.21)#1,052 |
| 82. | D Hanis | 13.3% | 4.4%(+8.92)#82 | 4.1%(+9.18)#1,054 |
| 83. | Wilmer | 13.2% | 4.4%(+8.82)#83 | 4.1%(+9.08)#1,074 |
| 84. | Hargill | 13.1% | 4.4%(+8.72)#84 | 4.1%(+8.99)#1,090 |
| 85. | Brazoria | 13.1% | 4.4%(+8.64)#85 | 4.1%(+8.91)#1,104 |
| 86. | Snook | 12.6% | 4.4%(+8.23)#86 | 4.1%(+8.50)#1,184 |
| 87. | Benjamin | 12.6% | 4.4%(+8.23)#87 | 4.1%(+8.49)#1,186 |
| 88. | Camargito | 12.4% | 4.4%(+7.99)#88 | 4.1%(+8.25)#1,228 |
| 89. | Quail Creek | 12.3% | 4.4%(+7.84)#89 | 4.1%(+8.11)#1,253 |
| 90. | Coffee City | 12.2% | 4.4%(+7.81)#90 | 4.1%(+8.07)#1,263 |
| 91. | Groveton | 12.0% | 4.4%(+7.57)#91 | 4.1%(+7.84)#1,314 |
| 92. | Golinda | 12.0% | 4.4%(+7.54)#92 | 4.1%(+7.80)#1,321 |
| 93. | Olmito | 11.9% | 4.4%(+7.45)#93 | 4.1%(+7.72)#1,343 |
| 94. | Petersburg | 11.7% | 4.4%(+7.32)#94 | 4.1%(+7.58)#1,370 |
| 95. | Silverton | 11.7% | 4.4%(+7.26)#95 | 4.1%(+7.52)#1,384 |
| 96. | Windcrest | 11.6% | 4.4%(+7.14)#96 | 4.1%(+7.40)#1,415 |
| 97. | Ransom Canyon | 11.5% | 4.4%(+7.11)#97 | 4.1%(+7.37)#1,420 |
| 98. | Shepherd | 11.5% | 4.4%(+7.05)#98 | 4.1%(+7.31)#1,431 |
| 99. | Murillo | 11.4% | 4.4%(+7.03)#99 | 4.1%(+7.30)#1,435 |
| 100. | West Tawakoni | 11.4% | 4.4%(+6.98)#100 | 4.1%(+7.25)#1,444 |
Common Questions
What are the Top 10 Cities with the Highest Percentage of Population Employed in Administrative & Support Services in Texas?
Top 10 Cities with the Highest Percentage of Population Employed in Administrative & Support Services in Texas are:
#1
53.0%
#2
50.9%
#3
44.5%
#4
41.3%
#5
38.3%
#6
37.7%
#7
34.6%
#8
33.8%
#9
32.4%
#10
31.4%
What city has the Highest Percentage of Population Employed in Administrative & Support Services in Texas?
Green Valley Farms has the Highest Percentage of Population Employed in Administrative & Support Services in Texas with 53.0%.
What is the Percentage of Population Employed in Administrative & Support Services in the State of Texas?
Percentage of Population Employed in Administrative & Support Services in Texas is 4.4%.
What is the Percentage of Population Employed in Administrative & Support Services in the United States?
Percentage of Population Employed in Administrative & Support Services in the United States is 4.1%.