Shavertown, PA Map & Demographics
Shavertown Map
Shavertown Overview
$34,008
PER CAPITA INCOME
$78,090
AVG FAMILY INCOME
$44,167
AVG HOUSEHOLD INCOME
10.6%
WAGE / INCOME GAP [ % ]
89.4¢/ $1
WAGE / INCOME GAP [ $ ]
0.42
INEQUALITY / GINI INDEX
1,814
TOTAL POPULATION
922
MALE POPULATION
892
FEMALE POPULATION
103.36
MALES / 100 FEMALES
96.75
FEMALES / 100 MALES
40.6
MEDIAN AGE
2.5
AVG FAMILY SIZE
1.9
AVG HOUSEHOLD SIZE
1,181
LABOR FORCE [ PEOPLE ]
75.1%
PERCENT IN LABOR FORCE
10.5%
UNEMPLOYMENT RATE
Shavertown Zip Codes
Shavertown Area Codes
Income in Shavertown
Income Overview in Shavertown
Per Capita Income in Shavertown is $34,008, while median incomes of families and households are $78,090 and $44,167 respectively.
| Characteristic | Number | Measure |
| Per Capita Income | 1,814 | $34,008 |
| Median Family Income | 521 | $78,090 |
| Mean Family Income | 521 | $79,152 |
| Median Household Income | 940 | $44,167 |
| Mean Household Income | 940 | $65,312 |
| Income Deficit | 521 | $0 |
| Wage / Income Gap (%) | 1,814 | 10.56% |
| Wage / Income Gap ($) | 1,814 | 89.44¢ per $1 |
| Gini / Inequality Index | 1,814 | 0.42 |
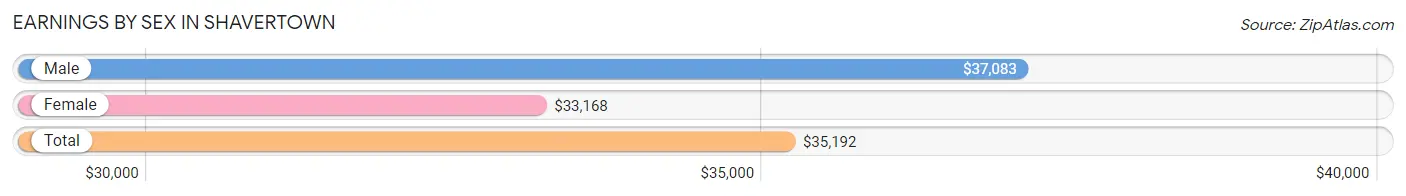
Earnings by Sex in Shavertown
Average Earnings in Shavertown are $35,192, $37,083 for men and $33,168 for women, a difference of 10.6%.
| Sex | Number | Average Earnings |
| Male | 683 (57.9%) | $37,083 |
| Female | 497 (42.1%) | $33,168 |
| Total | 1,180 (100.0%) | $35,192 |
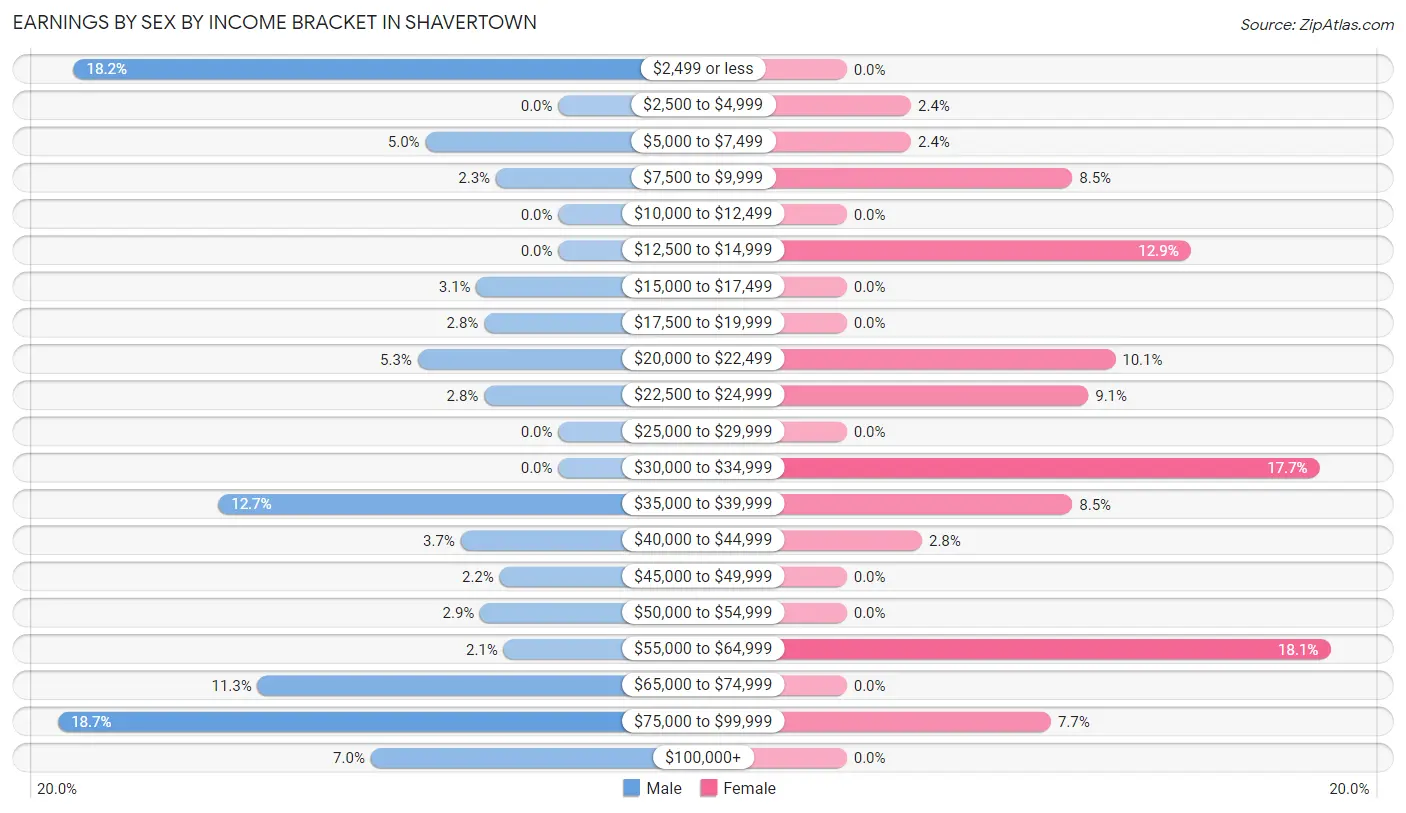
Earnings by Sex by Income Bracket in Shavertown
The most common earnings brackets in Shavertown are $75,000 to $99,999 for men (128 | 18.7%) and $55,000 to $64,999 for women (90 | 18.1%).
| Income | Male | Female |
| $2,499 or less | 124 (18.2%) | 0 (0.0%) |
| $2,500 to $4,999 | 0 (0.0%) | 12 (2.4%) |
| $5,000 to $7,499 | 34 (5.0%) | 12 (2.4%) |
| $7,500 to $9,999 | 16 (2.3%) | 42 (8.5%) |
| $10,000 to $12,499 | 0 (0.0%) | 0 (0.0%) |
| $12,500 to $14,999 | 0 (0.0%) | 64 (12.9%) |
| $15,000 to $17,499 | 21 (3.1%) | 0 (0.0%) |
| $17,500 to $19,999 | 19 (2.8%) | 0 (0.0%) |
| $20,000 to $22,499 | 36 (5.3%) | 50 (10.1%) |
| $22,500 to $24,999 | 19 (2.8%) | 45 (9.0%) |
| $25,000 to $29,999 | 0 (0.0%) | 0 (0.0%) |
| $30,000 to $34,999 | 0 (0.0%) | 88 (17.7%) |
| $35,000 to $39,999 | 87 (12.7%) | 42 (8.5%) |
| $40,000 to $44,999 | 25 (3.7%) | 14 (2.8%) |
| $45,000 to $49,999 | 15 (2.2%) | 0 (0.0%) |
| $50,000 to $54,999 | 20 (2.9%) | 0 (0.0%) |
| $55,000 to $64,999 | 14 (2.1%) | 90 (18.1%) |
| $65,000 to $74,999 | 77 (11.3%) | 0 (0.0%) |
| $75,000 to $99,999 | 128 (18.7%) | 38 (7.6%) |
| $100,000+ | 48 (7.0%) | 0 (0.0%) |
| Total | 683 (100.0%) | 497 (100.0%) |
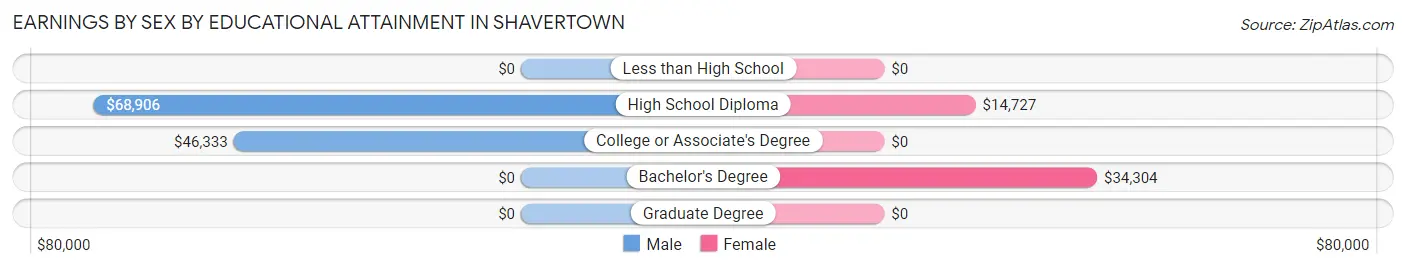
Earnings by Sex by Educational Attainment in Shavertown
Average earnings in Shavertown are $58,929 for men and $33,509 for women, a difference of 43.1%. Men with an educational attainment of high school diploma enjoy the highest average annual earnings of $68,906, while those with college or associate's degree education earn the least with $46,333. Women with an educational attainment of bachelor's degree earn the most with the average annual earnings of $34,304, while those with high school diploma education have the smallest earnings of $14,727.
| Educational Attainment | Male Income | Female Income |
| Less than High School | - | - |
| High School Diploma | $68,906 | $14,727 |
| College or Associate's Degree | $46,333 | $0 |
| Bachelor's Degree | - | - |
| Graduate Degree | - | - |
| Total | $58,929 | $33,509 |
Family Income in Shavertown
Family Income Brackets in Shavertown
According to the Shavertown family income data, there are 155 families falling into the $75,000 to $99,999 income range, which is the most common income bracket and makes up 29.7% of all families.
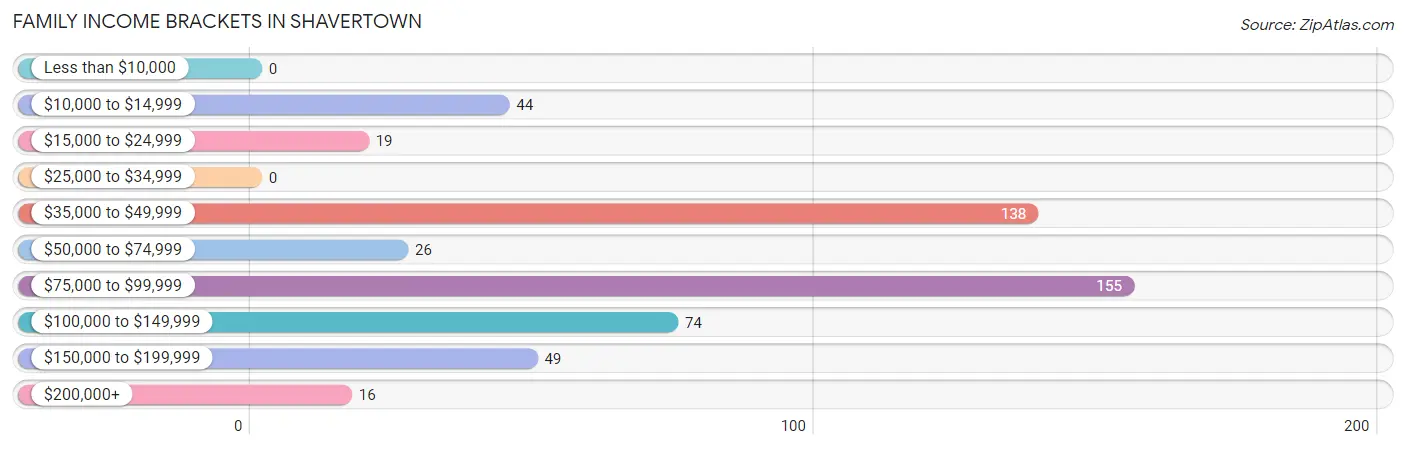
| Income Bracket | # Families | % Families |
| Less than $10,000 | 0 | 0.0% |
| $10,000 to $14,999 | 44 | 8.4% |
| $15,000 to $24,999 | 19 | 3.6% |
| $25,000 to $34,999 | 0 | 0.0% |
| $35,000 to $49,999 | 138 | 26.5% |
| $50,000 to $74,999 | 26 | 5.0% |
| $75,000 to $99,999 | 155 | 29.8% |
| $100,000 to $149,999 | 74 | 14.2% |
| $150,000 to $199,999 | 49 | 9.4% |
| $200,000+ | 16 | 3.1% |
Family Income by Famaliy Size in Shavertown
4-person families (46 | 8.8%) account for the highest median family income in Shavertown with $113,167 per family, while 2-person families (410 | 78.7%) have the highest median income of $29,664 per family member.
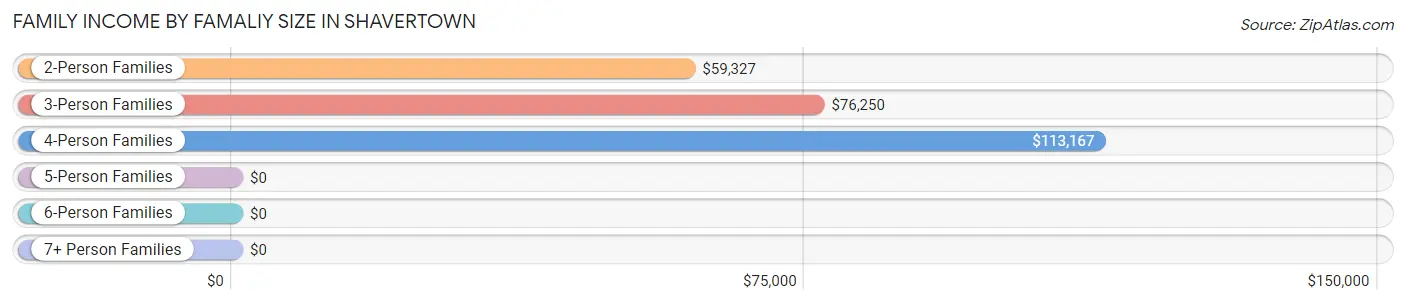
| Income Bracket | # Families | Median Income |
| 2-Person Families | 410 (78.7%) | $59,327 |
| 3-Person Families | 55 (10.6%) | $76,250 |
| 4-Person Families | 46 (8.8%) | $113,167 |
| 5-Person Families | 10 (1.9%) | $0 |
| 6-Person Families | 0 (0.0%) | $0 |
| 7+ Person Families | 0 (0.0%) | $0 |
| Total | 521 (100.0%) | $78,090 |
Family Income by Number of Earners in Shavertown
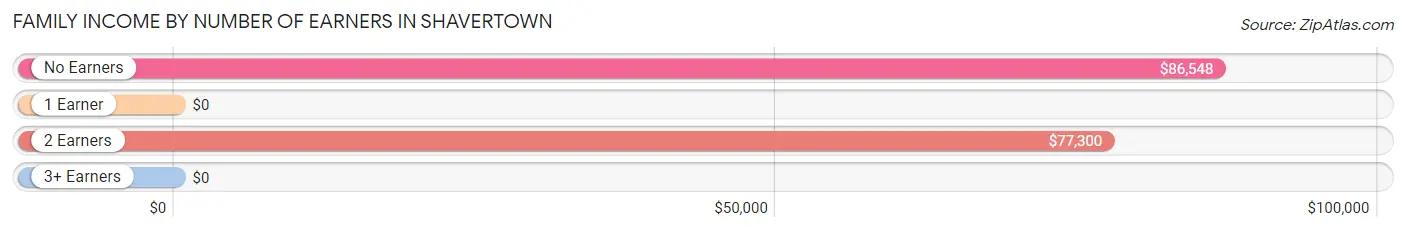
| Number of Earners | # Families | Median Income |
| No Earners | 98 (18.8%) | $86,548 |
| 1 Earner | 104 (20.0%) | $0 |
| 2 Earners | 292 (56.0%) | $77,300 |
| 3+ Earners | 27 (5.2%) | $0 |
| Total | 521 (100.0%) | $78,090 |
Household Income in Shavertown
Household Income Brackets in Shavertown
With 186 households falling in the category, the $100,000 to $149,999 income range is the most frequent in Shavertown, accounting for 19.8% of all households. In contrast, only 16 households (1.7%) fall into the $200,000+ income bracket, making it the least populous group.
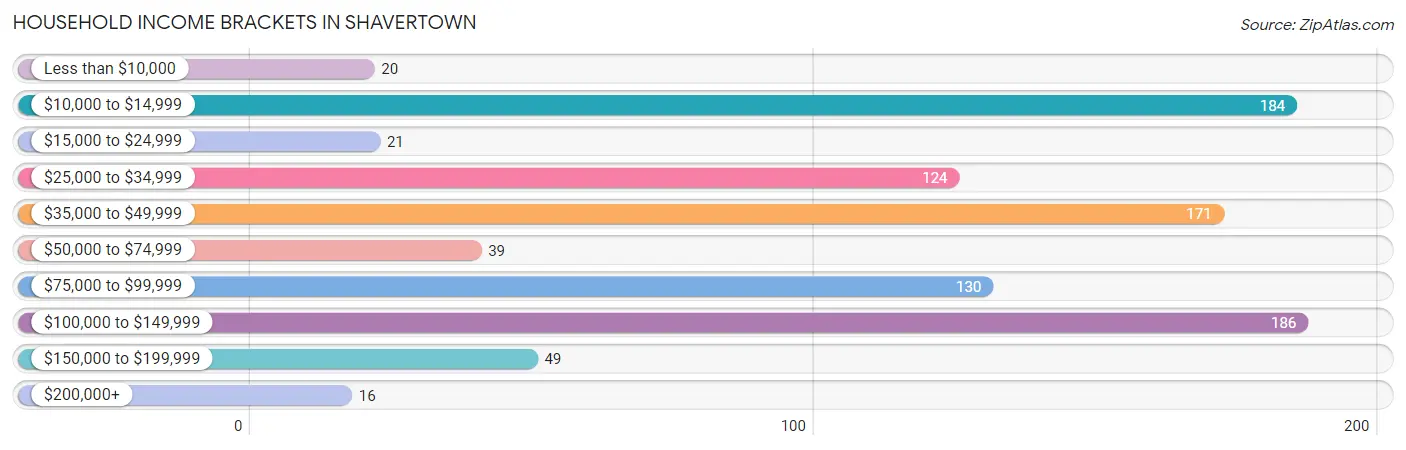
| Income Bracket | # Households | % Households |
| Less than $10,000 | 20 | 2.1% |
| $10,000 to $14,999 | 184 | 19.6% |
| $15,000 to $24,999 | 21 | 2.2% |
| $25,000 to $34,999 | 124 | 13.2% |
| $35,000 to $49,999 | 171 | 18.2% |
| $50,000 to $74,999 | 39 | 4.1% |
| $75,000 to $99,999 | 130 | 13.8% |
| $100,000 to $149,999 | 186 | 19.8% |
| $150,000 to $199,999 | 49 | 5.2% |
| $200,000+ | 16 | 1.7% |
Household Income by Householder Age in Shavertown
The median household income in Shavertown is $44,167, with the highest median household income of $107,961 found in the 25 to 44 years age bracket for the primary householder. A total of 268 households (28.5%) fall into this category.
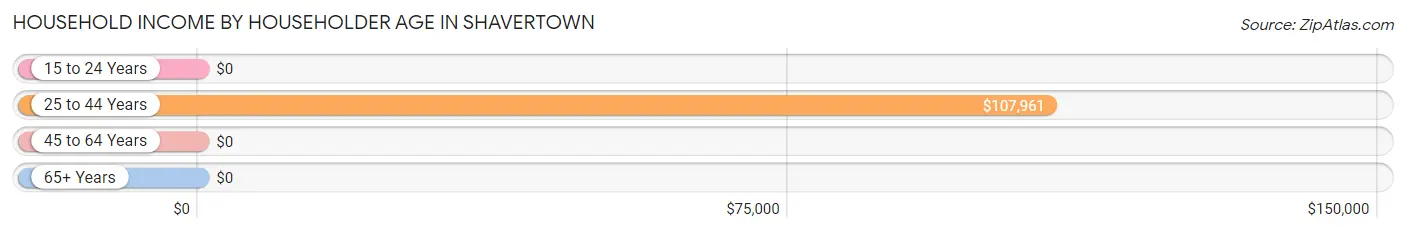
| Income Bracket | # Households | Median Income |
| 15 to 24 Years | 0 (0.0%) | $0 |
| 25 to 44 Years | 268 (28.5%) | $107,961 |
| 45 to 64 Years | 319 (33.9%) | $0 |
| 65+ Years | 353 (37.6%) | $0 |
| Total | 940 (100.0%) | $44,167 |
Poverty in Shavertown
Income Below Poverty by Sex and Age in Shavertown
With 5.0% poverty level for males and 22.9% for females among the residents of Shavertown, 6 to 11 year old males and 75 year old and over females are the most vulnerable to poverty, with 46 males (62.2%) and 160 females (72.4%) in their respective age groups living below the poverty level.
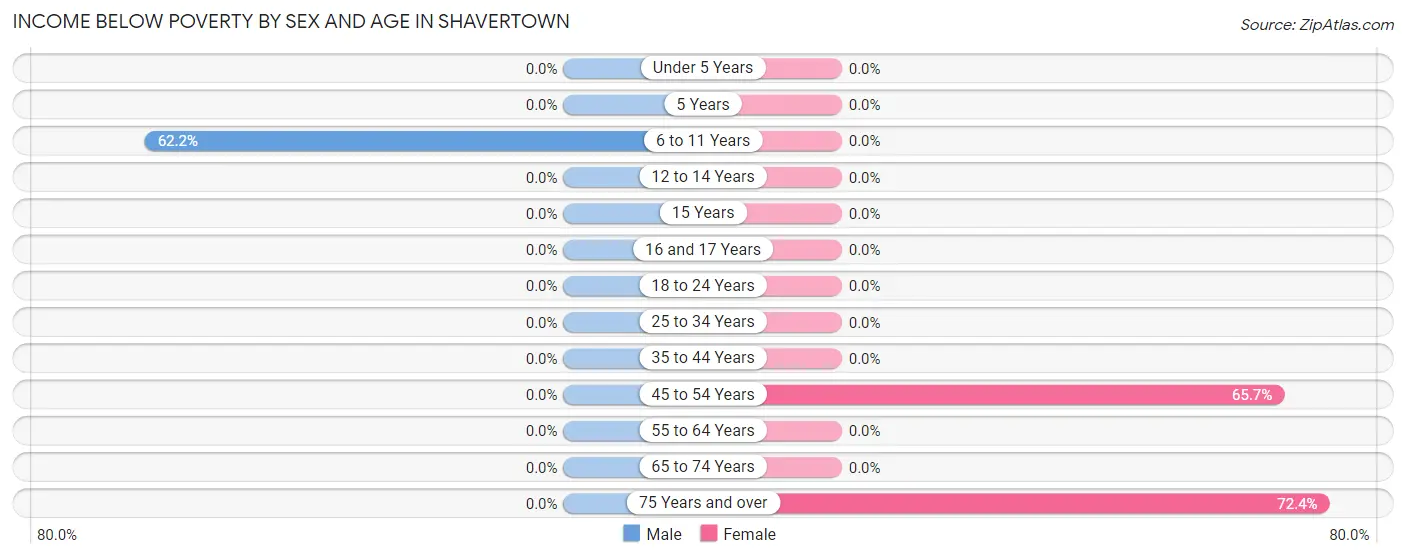
| Age Bracket | Male | Female |
| Under 5 Years | 0 (0.0%) | 0 (0.0%) |
| 5 Years | 0 (0.0%) | 0 (0.0%) |
| 6 to 11 Years | 46 (62.2%) | 0 (0.0%) |
| 12 to 14 Years | 0 (0.0%) | 0 (0.0%) |
| 15 Years | 0 (0.0%) | 0 (0.0%) |
| 16 and 17 Years | 0 (0.0%) | 0 (0.0%) |
| 18 to 24 Years | 0 (0.0%) | 0 (0.0%) |
| 25 to 34 Years | 0 (0.0%) | 0 (0.0%) |
| 35 to 44 Years | 0 (0.0%) | 0 (0.0%) |
| 45 to 54 Years | 0 (0.0%) | 44 (65.7%) |
| 55 to 64 Years | 0 (0.0%) | 0 (0.0%) |
| 65 to 74 Years | 0 (0.0%) | 0 (0.0%) |
| 75 Years and over | 0 (0.0%) | 160 (72.4%) |
| Total | 46 (5.0%) | 204 (22.9%) |
Income Above Poverty by Sex and Age in Shavertown
According to the poverty statistics in Shavertown, males aged under 5 years and females aged under 5 years are the age groups that are most secure financially, with 100.0% of males and 100.0% of females in these age groups living above the poverty line.
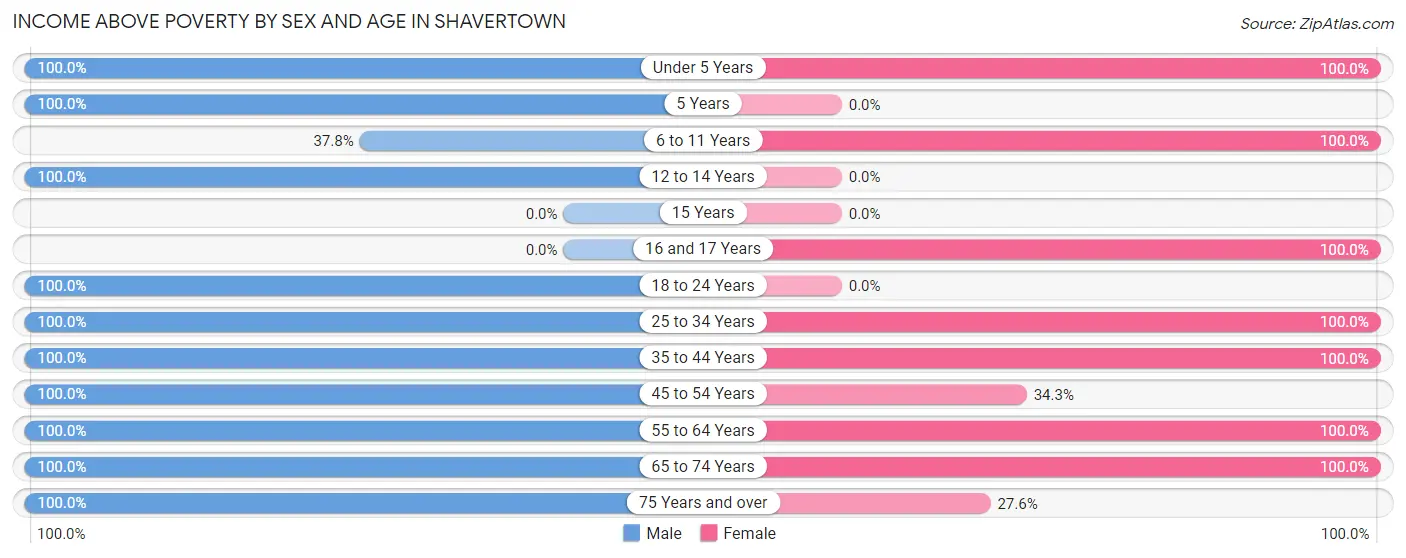
| Age Bracket | Male | Female |
| Under 5 Years | 14 (100.0%) | 125 (100.0%) |
| 5 Years | 11 (100.0%) | 0 (0.0%) |
| 6 to 11 Years | 28 (37.8%) | 9 (100.0%) |
| 12 to 14 Years | 9 (100.0%) | 0 (0.0%) |
| 15 Years | 0 (0.0%) | 0 (0.0%) |
| 16 and 17 Years | 0 (0.0%) | 24 (100.0%) |
| 18 to 24 Years | 182 (100.0%) | 0 (0.0%) |
| 25 to 34 Years | 195 (100.0%) | 230 (100.0%) |
| 35 to 44 Years | 19 (100.0%) | 25 (100.0%) |
| 45 to 54 Years | 89 (100.0%) | 23 (34.3%) |
| 55 to 64 Years | 169 (100.0%) | 118 (100.0%) |
| 65 to 74 Years | 80 (100.0%) | 73 (100.0%) |
| 75 Years and over | 80 (100.0%) | 61 (27.6%) |
| Total | 876 (95.0%) | 688 (77.1%) |
Income Below Poverty Among Married-Couple Families in Shavertown
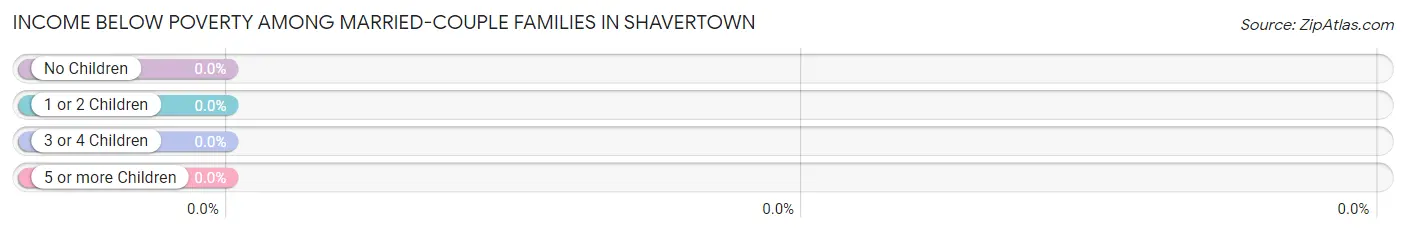
| Children | Above Poverty | Below Poverty |
| No Children | 232 (100.0%) | 0 (0.0%) |
| 1 or 2 Children | 59 (100.0%) | 0 (0.0%) |
| 3 or 4 Children | 10 (100.0%) | 0 (0.0%) |
| 5 or more Children | 0 (0.0%) | 0 (0.0%) |
| Total | 301 (100.0%) | 0 (0.0%) |
Income Below Poverty Among Single-Parent Households in Shavertown
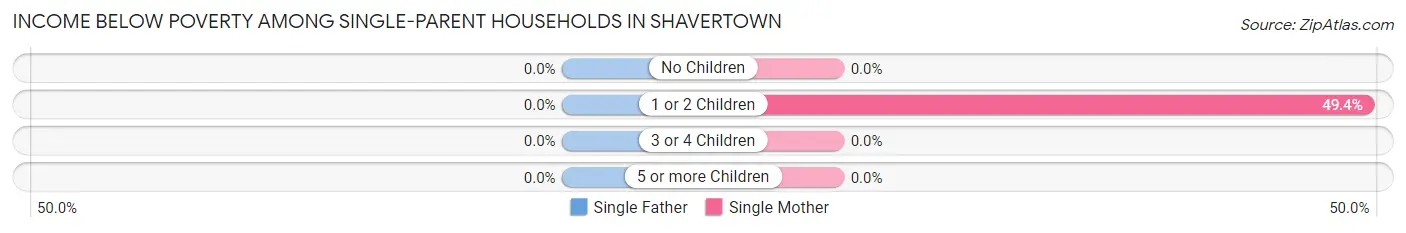
| Children | Single Father | Single Mother |
| No Children | 0 (0.0%) | 0 (0.0%) |
| 1 or 2 Children | 0 (0.0%) | 44 (49.4%) |
| 3 or 4 Children | 0 (0.0%) | 0 (0.0%) |
| 5 or more Children | 0 (0.0%) | 0 (0.0%) |
| Total | 0 (0.0%) | 44 (49.4%) |
Income Below Poverty Among Married-Couple vs Single-Parent Households in Shavertown
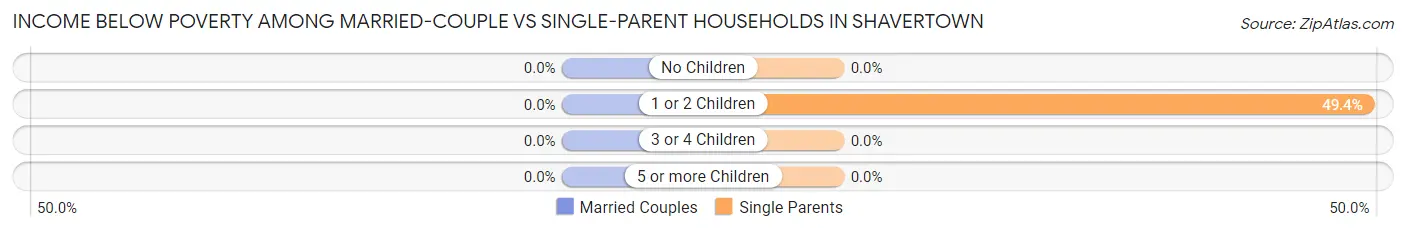
| Children | Married-Couple Families | Single-Parent Households |
| No Children | 0 (0.0%) | 0 (0.0%) |
| 1 or 2 Children | 0 (0.0%) | 44 (49.4%) |
| 3 or 4 Children | 0 (0.0%) | 0 (0.0%) |
| 5 or more Children | 0 (0.0%) | 0 (0.0%) |
| Total | 0 (0.0%) | 44 (20.0%) |
Race in Shavertown
The most populous races in Shavertown are , and White / Caucasian (1,814 | 100.0%).
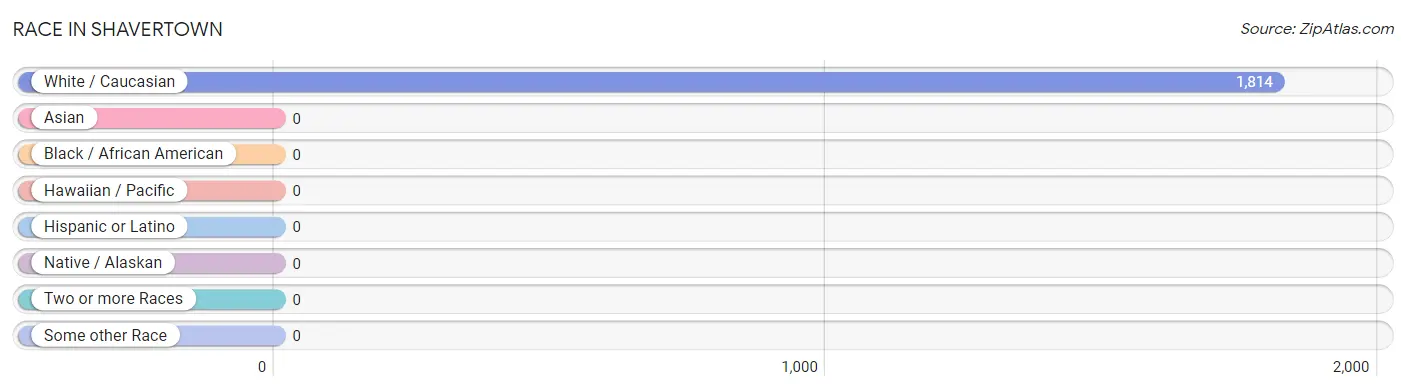
| Race | # Population | % Population |
| Asian | 0 | 0.0% |
| Black / African American | 0 | 0.0% |
| Hawaiian / Pacific | 0 | 0.0% |
| Hispanic or Latino | 0 | 0.0% |
| Native / Alaskan | 0 | 0.0% |
| White / Caucasian | 1,814 | 100.0% |
| Two or more Races | 0 | 0.0% |
| Some other Race | 0 | 0.0% |
| Total | 1,814 | 100.0% |
Ancestry in Shavertown
The most populous ancestries reported in Shavertown are Irish (613 | 33.8%), Polish (305 | 16.8%), German (274 | 15.1%), English (254 | 14.0%), and Welsh (252 | 13.9%), together accounting for 93.6% of all Shavertown residents.
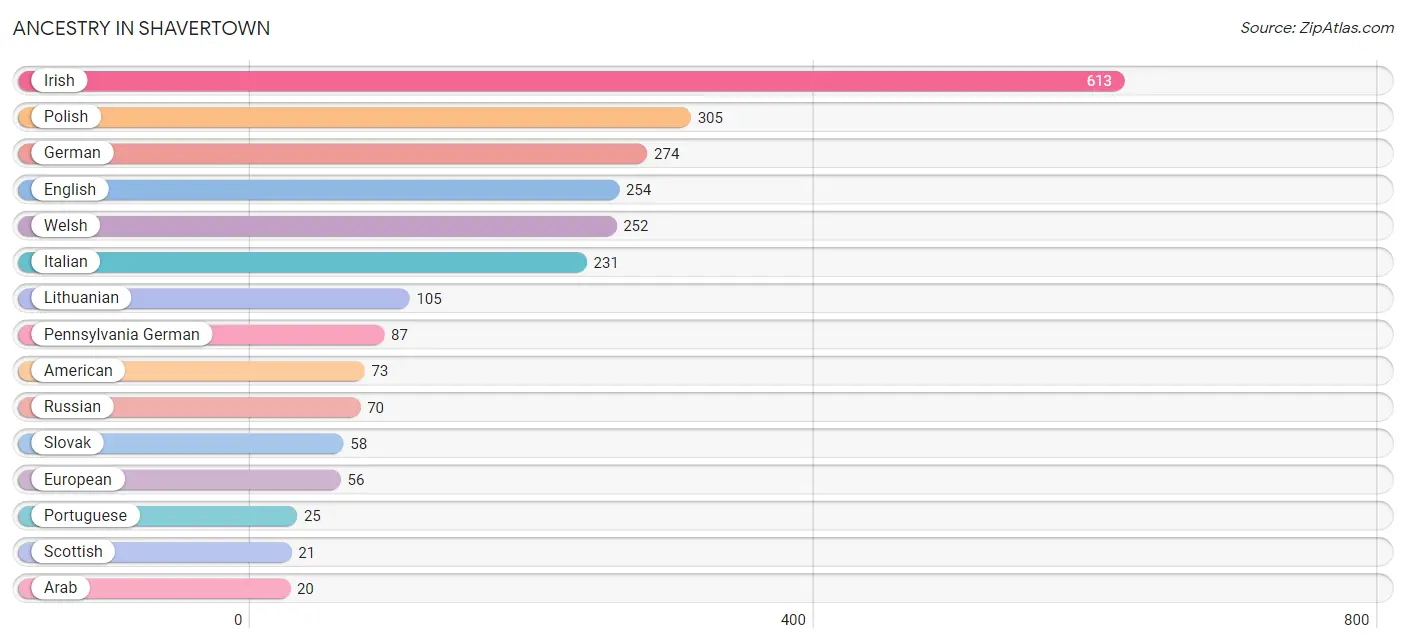
| Ancestry | # Population | % Population |
| American | 73 | 4.0% |
| Arab | 20 | 1.1% |
| Eastern European | 19 | 1.1% |
| English | 254 | 14.0% |
| European | 56 | 3.1% |
| German | 274 | 15.1% |
| Hungarian | 20 | 1.1% |
| Irish | 613 | 33.8% |
| Italian | 231 | 12.7% |
| Lithuanian | 105 | 5.8% |
| Pennsylvania German | 87 | 4.8% |
| Polish | 305 | 16.8% |
| Portuguese | 25 | 1.4% |
| Russian | 70 | 3.9% |
| Scotch-Irish | 20 | 1.1% |
| Scottish | 21 | 1.2% |
| Slovak | 58 | 3.2% |
| Syrian | 20 | 1.1% |
| Welsh | 252 | 13.9% | View All 19 Rows |
Immigrants in Shavertown

| Immigration Origin | # Population | % Population | View All 0 Rows |
Sex and Age in Shavertown
Sex and Age in Shavertown
The most populous age groups in Shavertown are 20 to 24 Years (182 | 19.7%) for men and 30 to 34 Years (167 | 18.7%) for women.
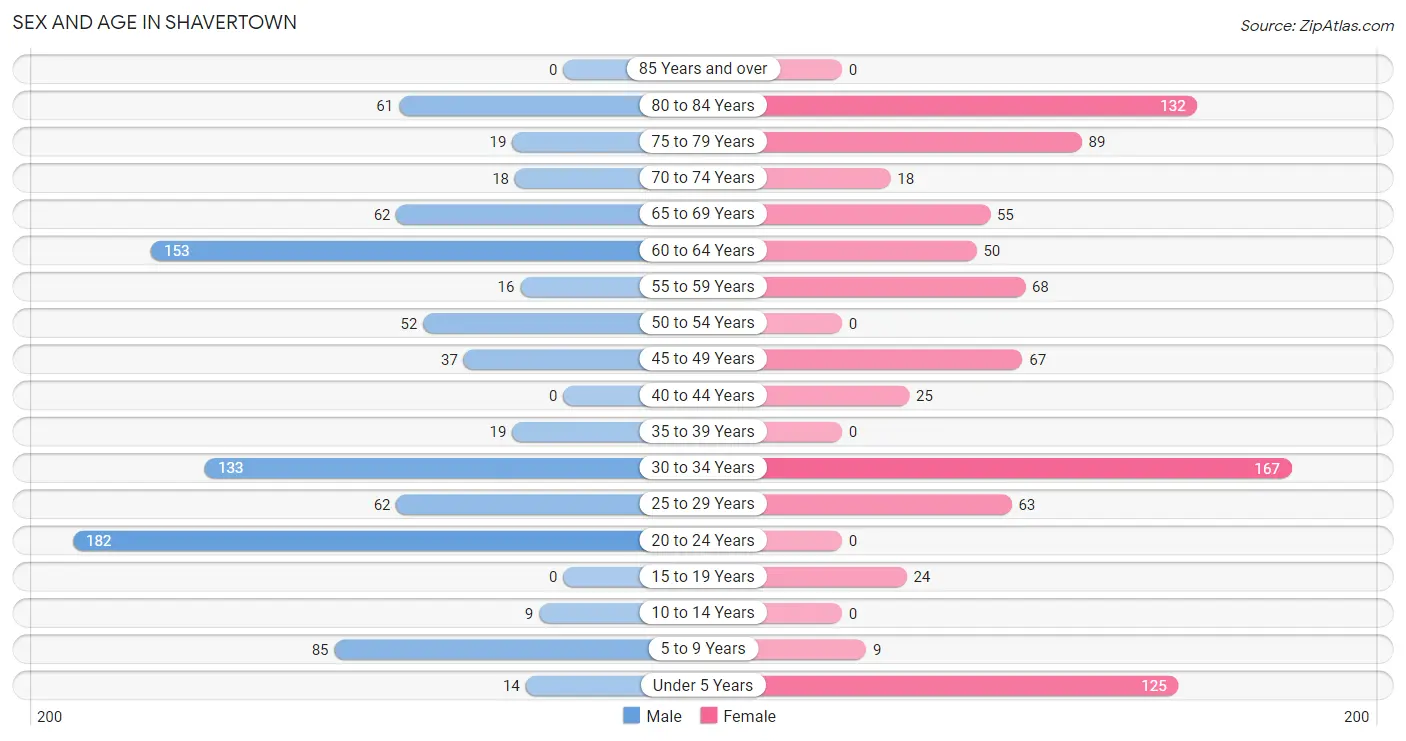
| Age Bracket | Male | Female |
| Under 5 Years | 14 (1.5%) | 125 (14.0%) |
| 5 to 9 Years | 85 (9.2%) | 9 (1.0%) |
| 10 to 14 Years | 9 (1.0%) | 0 (0.0%) |
| 15 to 19 Years | 0 (0.0%) | 24 (2.7%) |
| 20 to 24 Years | 182 (19.7%) | 0 (0.0%) |
| 25 to 29 Years | 62 (6.7%) | 63 (7.1%) |
| 30 to 34 Years | 133 (14.4%) | 167 (18.7%) |
| 35 to 39 Years | 19 (2.1%) | 0 (0.0%) |
| 40 to 44 Years | 0 (0.0%) | 25 (2.8%) |
| 45 to 49 Years | 37 (4.0%) | 67 (7.5%) |
| 50 to 54 Years | 52 (5.6%) | 0 (0.0%) |
| 55 to 59 Years | 16 (1.7%) | 68 (7.6%) |
| 60 to 64 Years | 153 (16.6%) | 50 (5.6%) |
| 65 to 69 Years | 62 (6.7%) | 55 (6.2%) |
| 70 to 74 Years | 18 (1.9%) | 18 (2.0%) |
| 75 to 79 Years | 19 (2.1%) | 89 (10.0%) |
| 80 to 84 Years | 61 (6.6%) | 132 (14.8%) |
| 85 Years and over | 0 (0.0%) | 0 (0.0%) |
| Total | 922 (100.0%) | 892 (100.0%) |
Families and Households in Shavertown
Median Family Size in Shavertown
The median family size in Shavertown is 2.46 persons per family, with married-couple families (301 | 57.8%) accounting for the largest median family size of 2.58 persons per family. On the other hand, single female/mother families (89 | 17.1%) represent the smallest median family size with 2.04 persons per family.
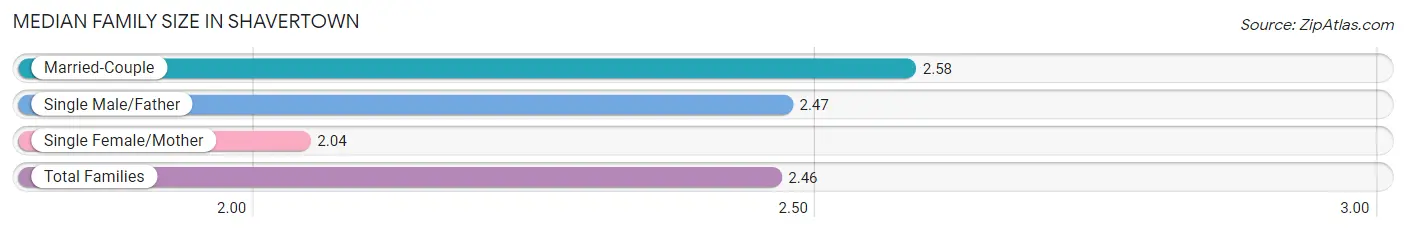
| Family Type | # Families | Family Size |
| Married-Couple | 301 (57.8%) | 2.58 |
| Single Male/Father | 131 (25.1%) | 2.47 |
| Single Female/Mother | 89 (17.1%) | 2.04 |
| Total Families | 521 (100.0%) | 2.46 |
Median Household Size in Shavertown
The median household size in Shavertown is 1.93 persons per household, with married-couple households (301 | 32.0%) accounting for the largest median household size of 2.67 persons per household. non-family households (419 | 44.6%) represent the smallest median household size with 1.09 persons per household.
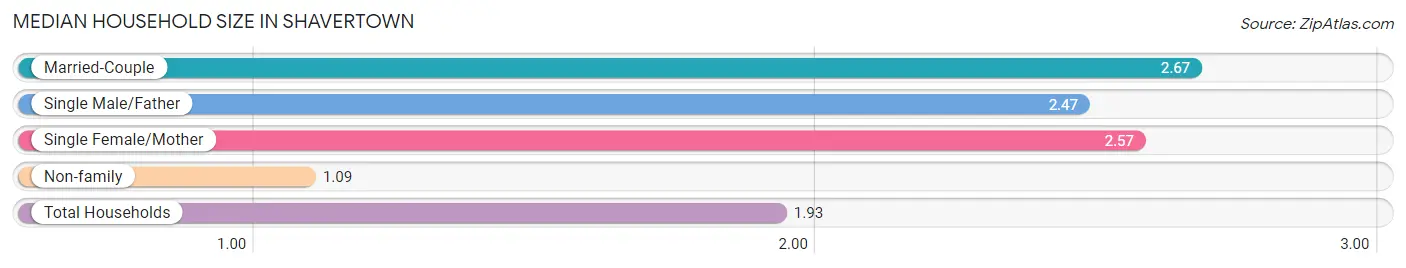
| Household Type | # Households | Household Size |
| Married-Couple | 301 (32.0%) | 2.67 |
| Single Male/Father | 131 (13.9%) | 2.47 |
| Single Female/Mother | 89 (9.5%) | 2.57 |
| Non-family | 419 (44.6%) | 1.09 |
| Total Households | 940 (100.0%) | 1.93 |
Household Size by Marriage Status in Shavertown
Out of a total of 940 households in Shavertown, 521 (55.4%) are family households, while 419 (44.6%) are nonfamily households. The most numerous type of family households are 2-person households, comprising 365, and the most common type of nonfamily households are 1-person households, comprising 380.
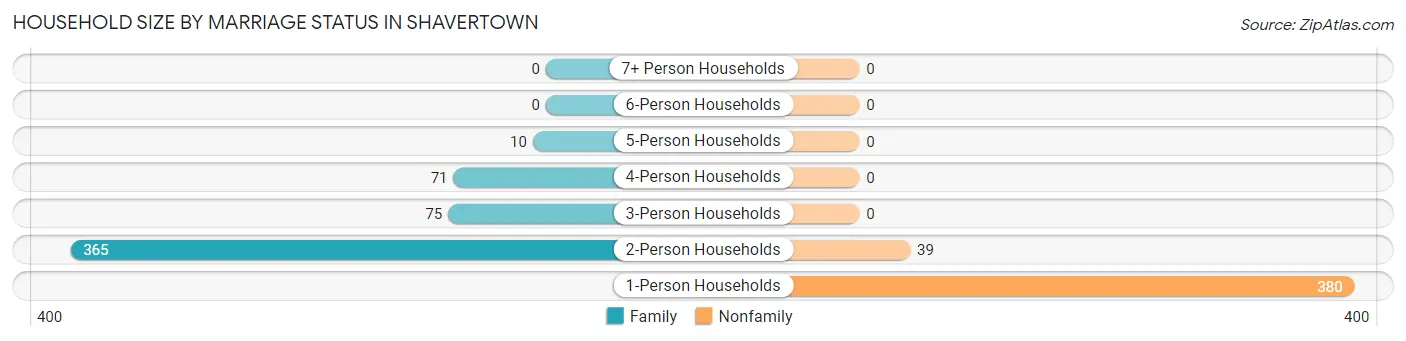
| Household Size | Family Households | Nonfamily Households |
| 1-Person Households | - | 380 (40.4%) |
| 2-Person Households | 365 (38.8%) | 39 (4.2%) |
| 3-Person Households | 75 (8.0%) | 0 (0.0%) |
| 4-Person Households | 71 (7.5%) | 0 (0.0%) |
| 5-Person Households | 10 (1.1%) | 0 (0.0%) |
| 6-Person Households | 0 (0.0%) | 0 (0.0%) |
| 7+ Person Households | 0 (0.0%) | 0 (0.0%) |
| Total | 521 (55.4%) | 419 (44.6%) |
Female Fertility in Shavertown
Fertility by Age in Shavertown
| Age Bracket | Women with Births | Births / 1,000 Women |
| 15 to 19 years | 0 (0.0%) | 0.0 |
| 20 to 34 years | 0 (0.0%) | 0.0 |
| 35 to 50 years | 0 (0.0%) | 0.0 |
| Total | 0 (0.0%) | 0.0 |
Fertility by Age by Marriage Status in Shavertown
| Age Bracket | Married | Unmarried |
| 15 to 19 years | 0 (0.0%) | 0 (0.0%) |
| 20 to 34 years | 0 (0.0%) | 0 (0.0%) |
| 35 to 50 years | 0 (0.0%) | 0 (0.0%) |
| Total | 0 (0.0%) | 0 (0.0%) |
Fertility by Education in Shavertown
| Educational Attainment | Women with Births | Births / 1,000 Women |
| Less than High School | 0 (0.0%) | 0.0 |
| High School Diploma | 0 (0.0%) | 0.0 |
| College or Associate's Degree | 0 (0.0%) | 0.0 |
| Bachelor's Degree | 0 (0.0%) | 0.0 |
| Graduate Degree | 0 (0.0%) | 0.0 |
| Total | 0 (0.0%) | 0.0 |
Fertility by Education by Marriage Status in Shavertown
| Educational Attainment | Married | Unmarried |
| Less than High School | 0 (0.0%) | 0 (0.0%) |
| High School Diploma | 0 (0.0%) | 0 (0.0%) |
| College or Associate's Degree | 0 (0.0%) | 0 (0.0%) |
| Bachelor's Degree | 0 (0.0%) | 0 (0.0%) |
| Graduate Degree | 0 (0.0%) | 0 (0.0%) |
| Total | 0 (0.0%) | 0 (0.0%) |
Employment Characteristics in Shavertown
Employment by Class of Employer in Shavertown
Among the 1,036 employed individuals in Shavertown, private company employees (662 | 63.9%), not-for-profit organizations (172 | 16.6%), and local government employees (105 | 10.1%) make up the most common classes of employment.
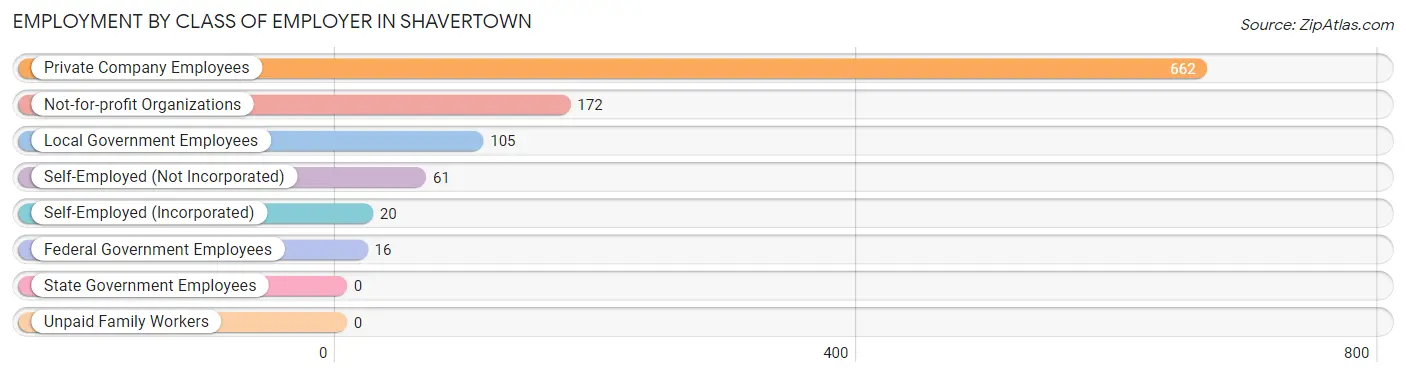
| Employer Class | # Employees | % Employees |
| Private Company Employees | 662 | 63.9% |
| Self-Employed (Incorporated) | 20 | 1.9% |
| Self-Employed (Not Incorporated) | 61 | 5.9% |
| Not-for-profit Organizations | 172 | 16.6% |
| Local Government Employees | 105 | 10.1% |
| State Government Employees | 0 | 0.0% |
| Federal Government Employees | 16 | 1.5% |
| Unpaid Family Workers | 0 | 0.0% |
| Total | 1,036 | 100.0% |
Employment Status by Age in Shavertown
According to the labor force statistics for Shavertown, out of the total population over 16 years of age (1,572), 75.1% or 1,181 individuals are in the labor force, with 10.5% or 124 of them unemployed. The age group with the highest labor force participation rate is 16 to 19 years, with 100.0% or 24 individuals in the labor force. Within the labor force, the 20 to 24 years age range has the highest percentage of unemployed individuals, with 75.2% or 124 of them being unemployed.
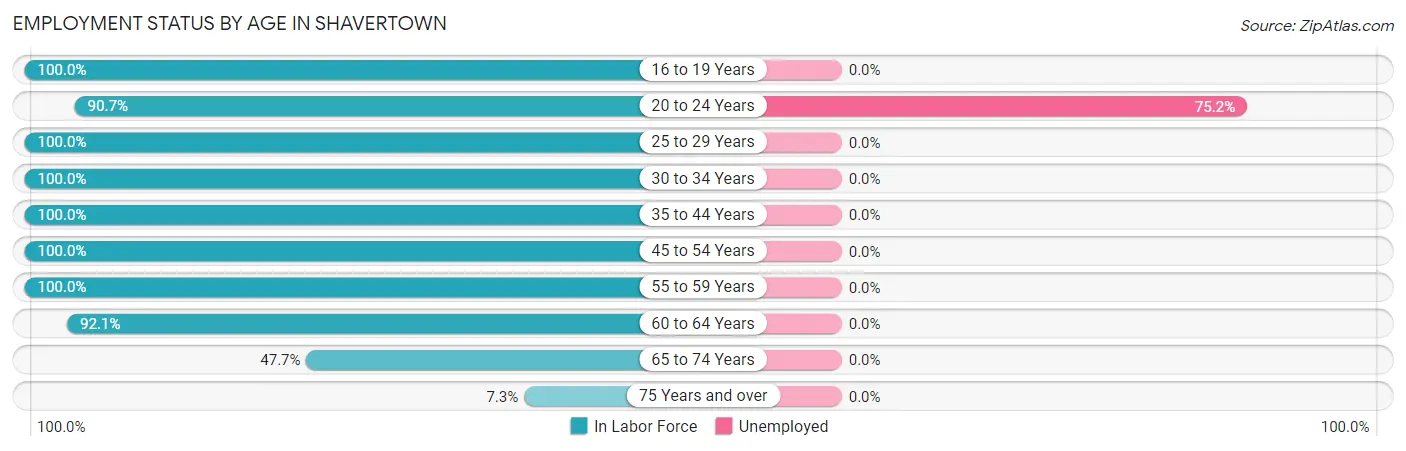
| Age Bracket | In Labor Force | Unemployed |
| 16 to 19 Years | 24 (100.0%) | 0 (0.0%) |
| 20 to 24 Years | 165 (90.7%) | 124 (75.2%) |
| 25 to 29 Years | 125 (100.0%) | 0 (0.0%) |
| 30 to 34 Years | 300 (100.0%) | 0 (0.0%) |
| 35 to 44 Years | 44 (100.0%) | 0 (0.0%) |
| 45 to 54 Years | 156 (100.0%) | 0 (0.0%) |
| 55 to 59 Years | 84 (100.0%) | 0 (0.0%) |
| 60 to 64 Years | 187 (92.1%) | 0 (0.0%) |
| 65 to 74 Years | 73 (47.7%) | 0 (0.0%) |
| 75 Years and over | 22 (7.3%) | 0 (0.0%) |
| Total | 1,181 (75.1%) | 124 (10.5%) |
Employment Status by Educational Attainment in Shavertown
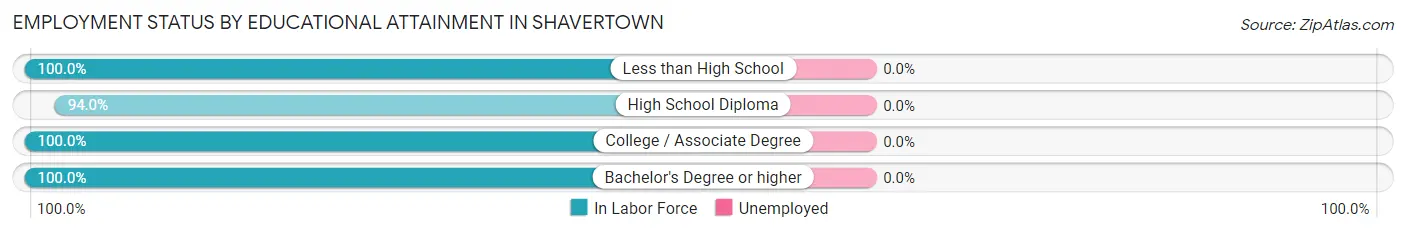
| Educational Attainment | In Labor Force | Unemployed |
| Less than High School | 19 (100.0%) | 0 (0.0%) |
| High School Diploma | 250 (94.0%) | 0 (0.0%) |
| College / Associate Degree | 254 (100.0%) | 0 (0.0%) |
| Bachelor's Degree or higher | 373 (100.0%) | 0 (0.0%) |
| Total | 896 (98.2%) | 0 (0.0%) |
Employment Occupations by Sex in Shavertown
Management, Business, Science and Arts Occupations
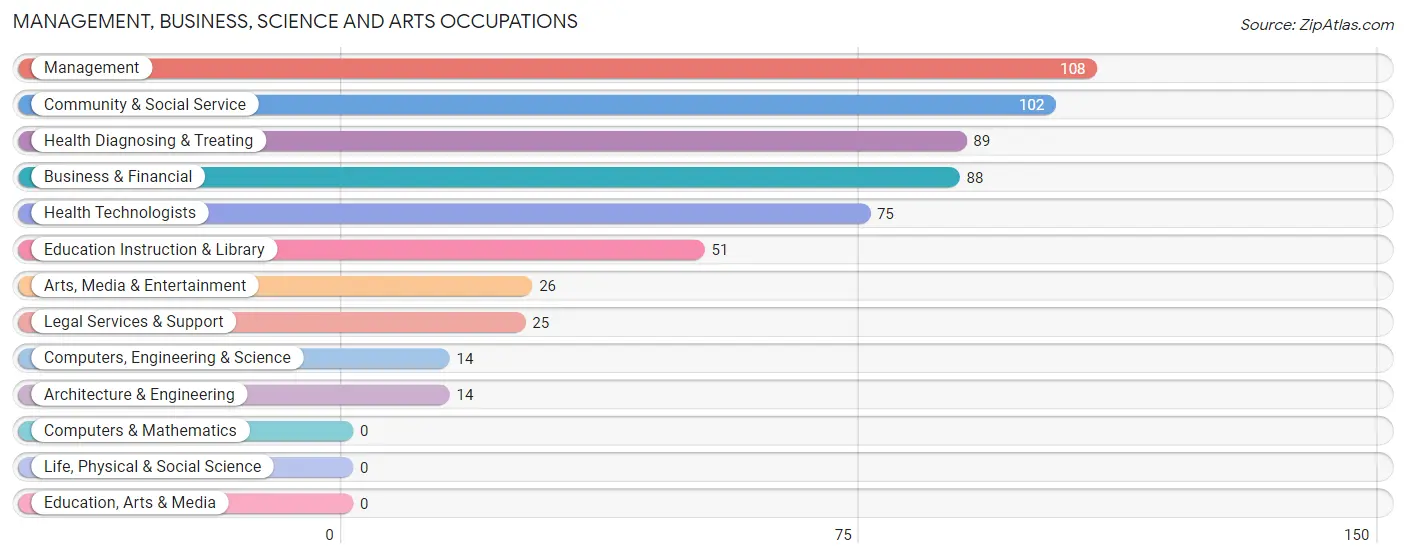
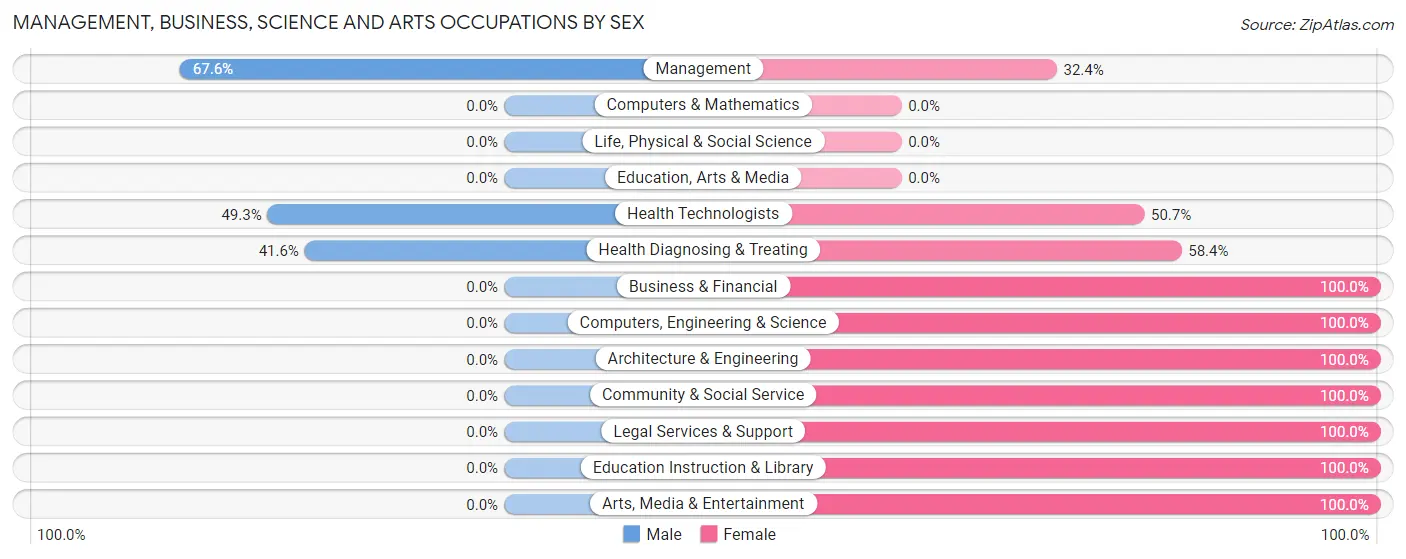
The most common Management, Business, Science and Arts occupations in Shavertown are Management (108 | 10.2%), Community & Social Service (102 | 9.7%), Health Diagnosing & Treating (89 | 8.4%), Business & Financial (88 | 8.3%), and Health Technologists (75 | 7.1%).
Management, Business, Science and Arts Occupations by Sex
Within the Management, Business, Science and Arts occupations in Shavertown, the most male-oriented occupations are Management (67.6%), Health Technologists (49.3%), and Health Diagnosing & Treating (41.6%), while the most female-oriented occupations are Business & Financial (100.0%), Computers, Engineering & Science (100.0%), and Architecture & Engineering (100.0%).
| Occupation | Male | Female |
| Management | 73 (67.6%) | 35 (32.4%) |
| Business & Financial | 0 (0.0%) | 88 (100.0%) |
| Computers, Engineering & Science | 0 (0.0%) | 14 (100.0%) |
| Computers & Mathematics | 0 (0.0%) | 0 (0.0%) |
| Architecture & Engineering | 0 (0.0%) | 14 (100.0%) |
| Life, Physical & Social Science | 0 (0.0%) | 0 (0.0%) |
| Community & Social Service | 0 (0.0%) | 102 (100.0%) |
| Education, Arts & Media | 0 (0.0%) | 0 (0.0%) |
| Legal Services & Support | 0 (0.0%) | 25 (100.0%) |
| Education Instruction & Library | 0 (0.0%) | 51 (100.0%) |
| Arts, Media & Entertainment | 0 (0.0%) | 26 (100.0%) |
| Health Diagnosing & Treating | 37 (41.6%) | 52 (58.4%) |
| Health Technologists | 37 (49.3%) | 38 (50.7%) |
| Total (Category) | 110 (27.4%) | 291 (72.6%) |
| Total (Overall) | 559 (52.9%) | 497 (47.1%) |
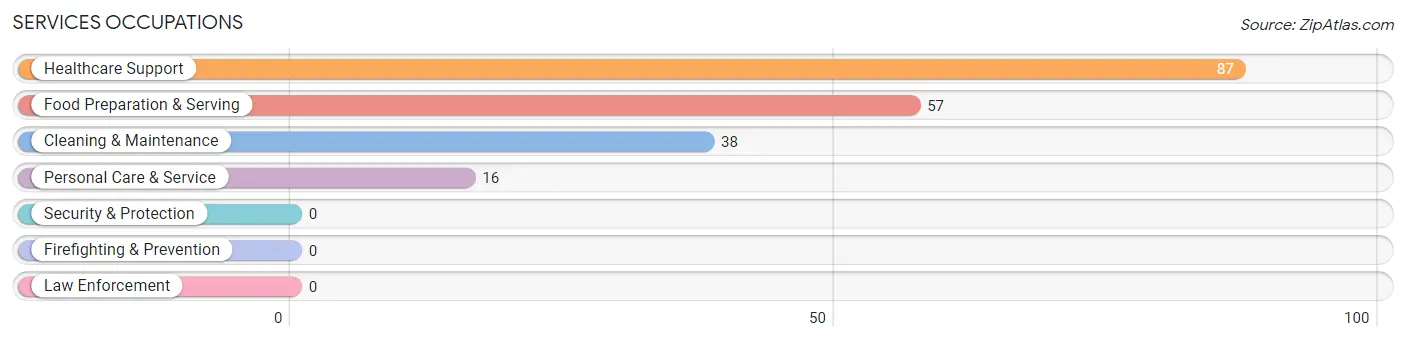
Services Occupations
The most common Services occupations in Shavertown are Healthcare Support (87 | 8.2%), Food Preparation & Serving (57 | 5.4%), Cleaning & Maintenance (38 | 3.6%), and Personal Care & Service (16 | 1.5%).
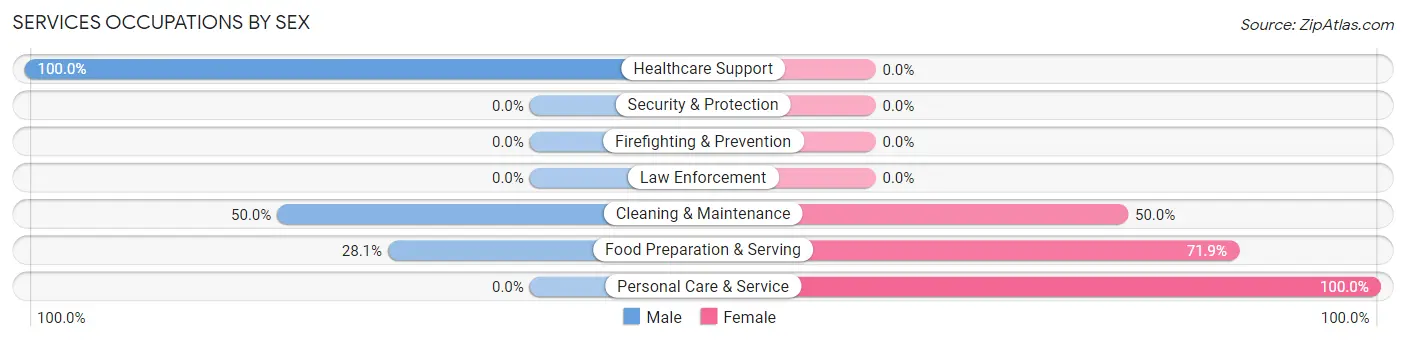
Services Occupations by Sex
Within the Services occupations in Shavertown, the most male-oriented occupations are Healthcare Support (100.0%), Cleaning & Maintenance (50.0%), and Food Preparation & Serving (28.1%), while the most female-oriented occupations are Personal Care & Service (100.0%), Food Preparation & Serving (71.9%), and Cleaning & Maintenance (50.0%).
| Occupation | Male | Female |
| Healthcare Support | 87 (100.0%) | 0 (0.0%) |
| Security & Protection | 0 (0.0%) | 0 (0.0%) |
| Firefighting & Prevention | 0 (0.0%) | 0 (0.0%) |
| Law Enforcement | 0 (0.0%) | 0 (0.0%) |
| Food Preparation & Serving | 16 (28.1%) | 41 (71.9%) |
| Cleaning & Maintenance | 19 (50.0%) | 19 (50.0%) |
| Personal Care & Service | 0 (0.0%) | 16 (100.0%) |
| Total (Category) | 122 (61.6%) | 76 (38.4%) |
| Total (Overall) | 559 (52.9%) | 497 (47.1%) |
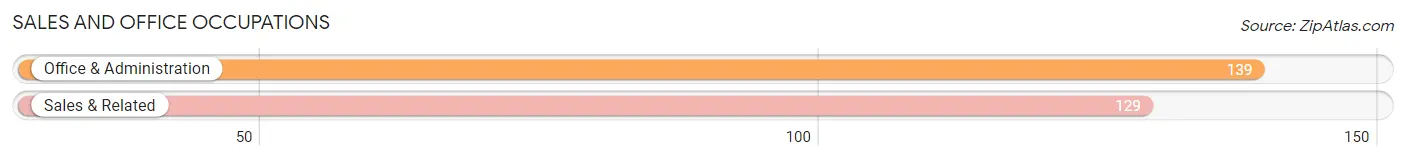
Sales and Office Occupations
The most common Sales and Office occupations in Shavertown are Office & Administration (139 | 13.2%), and Sales & Related (129 | 12.2%).
Sales and Office Occupations by Sex
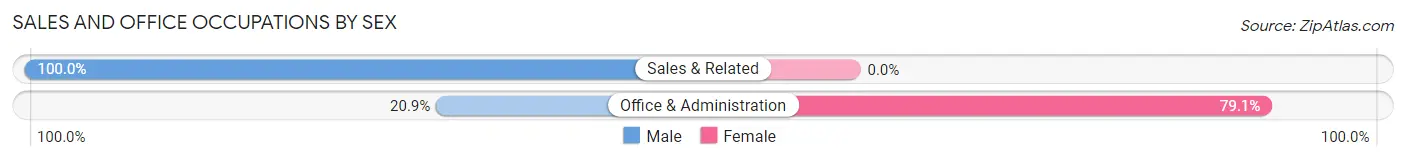
| Occupation | Male | Female |
| Sales & Related | 129 (100.0%) | 0 (0.0%) |
| Office & Administration | 29 (20.9%) | 110 (79.1%) |
| Total (Category) | 158 (59.0%) | 110 (41.0%) |
| Total (Overall) | 559 (52.9%) | 497 (47.1%) |
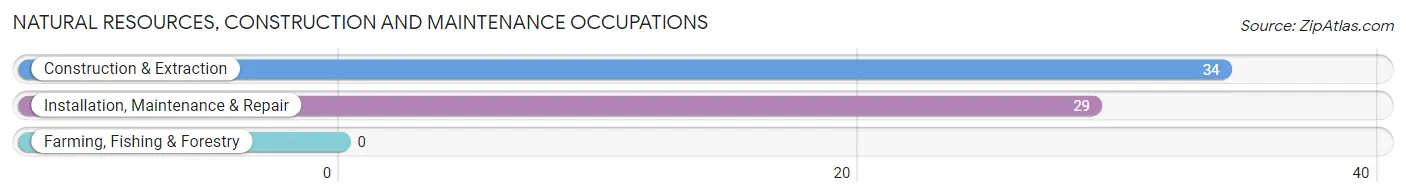
Natural Resources, Construction and Maintenance Occupations
The most common Natural Resources, Construction and Maintenance occupations in Shavertown are Construction & Extraction (34 | 3.2%), and Installation, Maintenance & Repair (29 | 2.8%).
Natural Resources, Construction and Maintenance Occupations by Sex
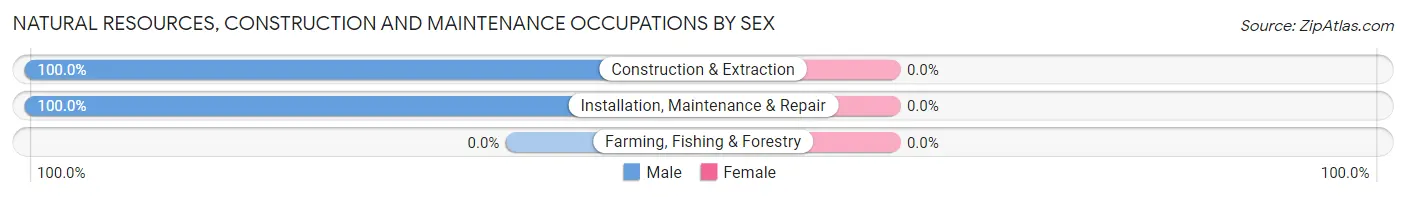
| Occupation | Male | Female |
| Farming, Fishing & Forestry | 0 (0.0%) | 0 (0.0%) |
| Construction & Extraction | 34 (100.0%) | 0 (0.0%) |
| Installation, Maintenance & Repair | 29 (100.0%) | 0 (0.0%) |
| Total (Category) | 63 (100.0%) | 0 (0.0%) |
| Total (Overall) | 559 (52.9%) | 497 (47.1%) |
Production, Transportation and Moving Occupations
The most common Production, Transportation and Moving occupations in Shavertown are Production (71 | 6.7%), Material Moving (34 | 3.2%), and Transportation (21 | 2.0%).
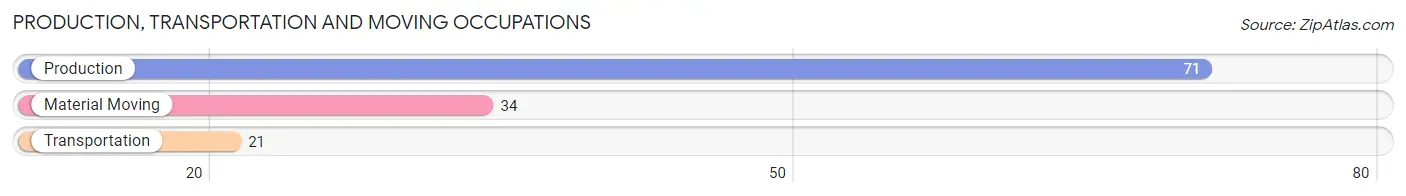
Production, Transportation and Moving Occupations by Sex
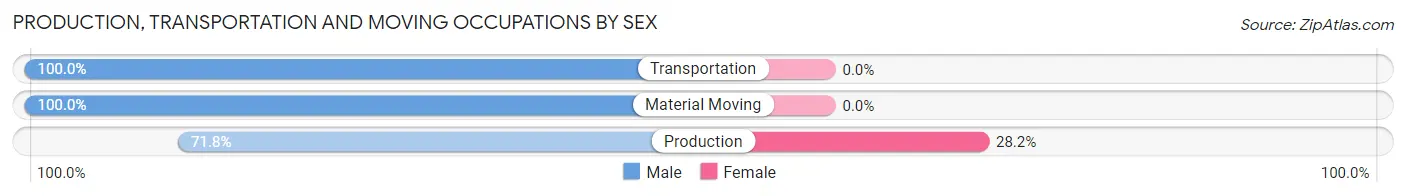
| Occupation | Male | Female |
| Production | 51 (71.8%) | 20 (28.2%) |
| Transportation | 21 (100.0%) | 0 (0.0%) |
| Material Moving | 34 (100.0%) | 0 (0.0%) |
| Total (Category) | 106 (84.1%) | 20 (15.9%) |
| Total (Overall) | 559 (52.9%) | 497 (47.1%) |
Employment Industries by Sex in Shavertown
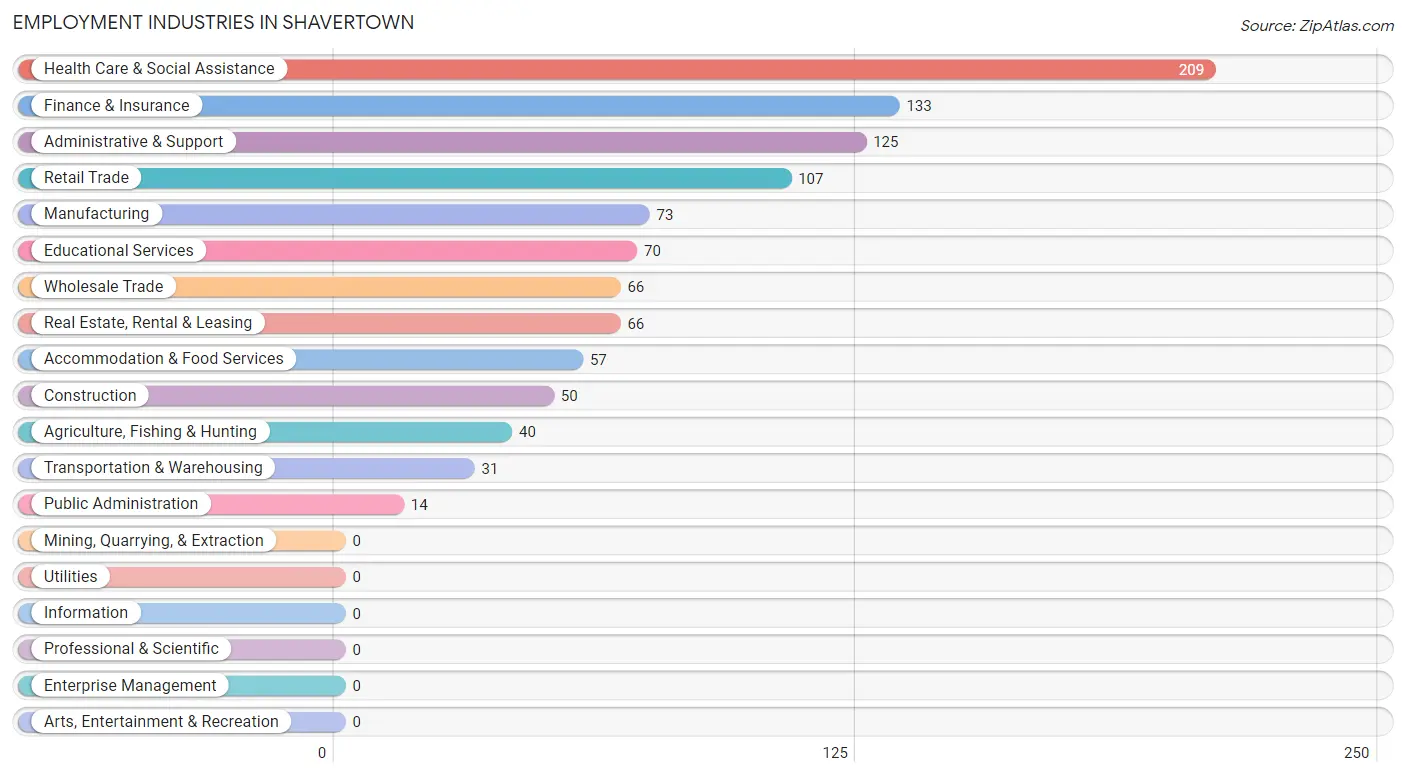
Employment Industries in Shavertown
The major employment industries in Shavertown include Health Care & Social Assistance (209 | 19.8%), Finance & Insurance (133 | 12.6%), Administrative & Support (125 | 11.8%), Retail Trade (107 | 10.1%), and Manufacturing (73 | 6.9%).
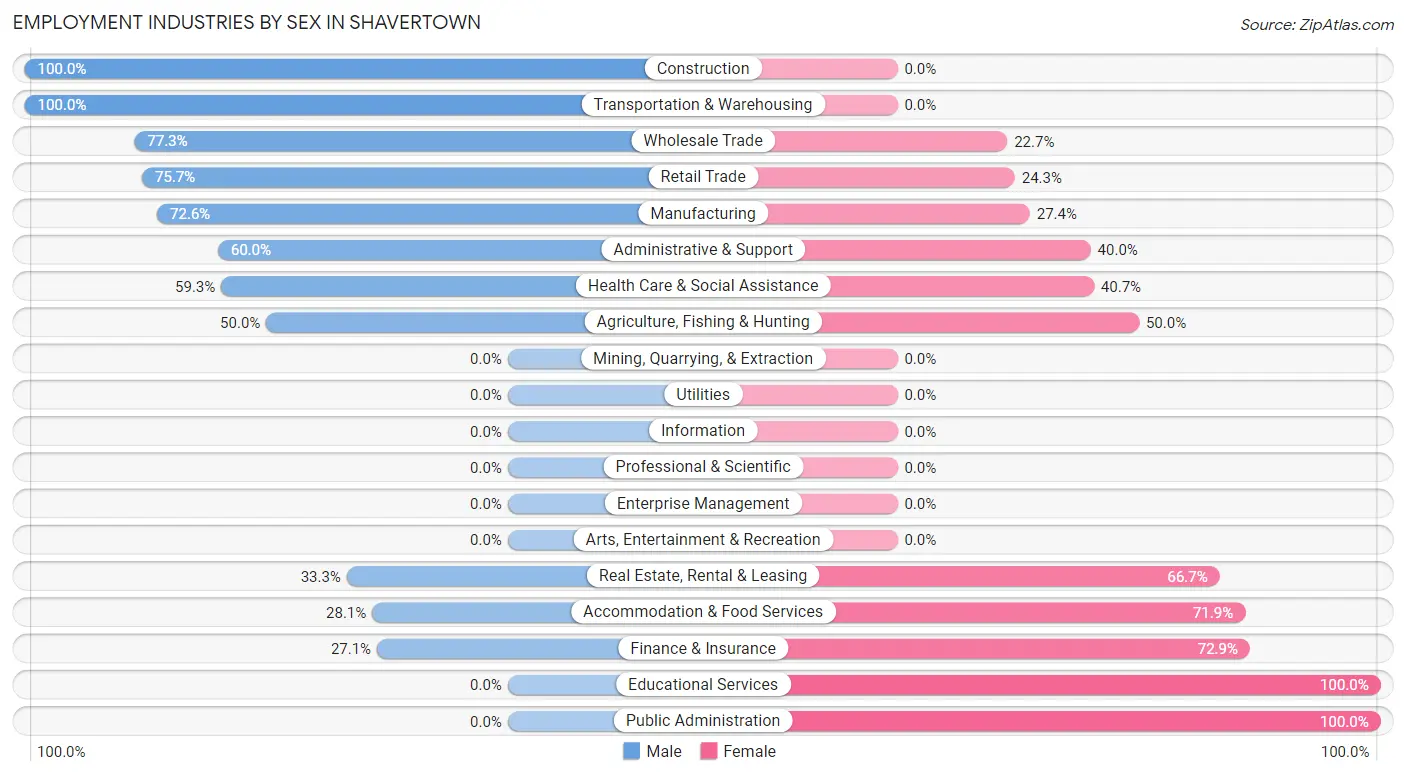
Employment Industries by Sex in Shavertown
The Shavertown industries that see more men than women are Construction (100.0%), Transportation & Warehousing (100.0%), and Wholesale Trade (77.3%), whereas the industries that tend to have a higher number of women are Educational Services (100.0%), Public Administration (100.0%), and Finance & Insurance (72.9%).
| Industry | Male | Female |
| Agriculture, Fishing & Hunting | 20 (50.0%) | 20 (50.0%) |
| Mining, Quarrying, & Extraction | 0 (0.0%) | 0 (0.0%) |
| Construction | 50 (100.0%) | 0 (0.0%) |
| Manufacturing | 53 (72.6%) | 20 (27.4%) |
| Wholesale Trade | 51 (77.3%) | 15 (22.7%) |
| Retail Trade | 81 (75.7%) | 26 (24.3%) |
| Transportation & Warehousing | 31 (100.0%) | 0 (0.0%) |
| Utilities | 0 (0.0%) | 0 (0.0%) |
| Information | 0 (0.0%) | 0 (0.0%) |
| Finance & Insurance | 36 (27.1%) | 97 (72.9%) |
| Real Estate, Rental & Leasing | 22 (33.3%) | 44 (66.7%) |
| Professional & Scientific | 0 (0.0%) | 0 (0.0%) |
| Enterprise Management | 0 (0.0%) | 0 (0.0%) |
| Administrative & Support | 75 (60.0%) | 50 (40.0%) |
| Educational Services | 0 (0.0%) | 70 (100.0%) |
| Health Care & Social Assistance | 124 (59.3%) | 85 (40.7%) |
| Arts, Entertainment & Recreation | 0 (0.0%) | 0 (0.0%) |
| Accommodation & Food Services | 16 (28.1%) | 41 (71.9%) |
| Public Administration | 0 (0.0%) | 14 (100.0%) |
| Total | 559 (52.9%) | 497 (47.1%) |
Education in Shavertown
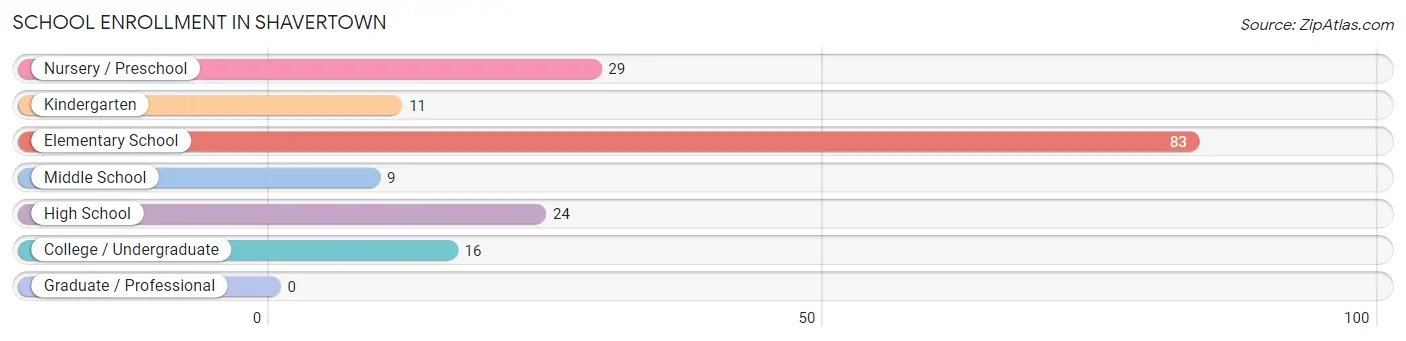
School Enrollment in Shavertown
The most common levels of schooling among the 172 students in Shavertown are elementary school (83 | 48.3%), nursery / preschool (29 | 16.9%), and high school (24 | 14.0%).
| School Level | # Students | % Students |
| Nursery / Preschool | 29 | 16.9% |
| Kindergarten | 11 | 6.4% |
| Elementary School | 83 | 48.3% |
| Middle School | 9 | 5.2% |
| High School | 24 | 14.0% |
| College / Undergraduate | 16 | 9.3% |
| Graduate / Professional | 0 | 0.0% |
| Total | 172 | 100.0% |
School Enrollment by Age by Funding Source in Shavertown
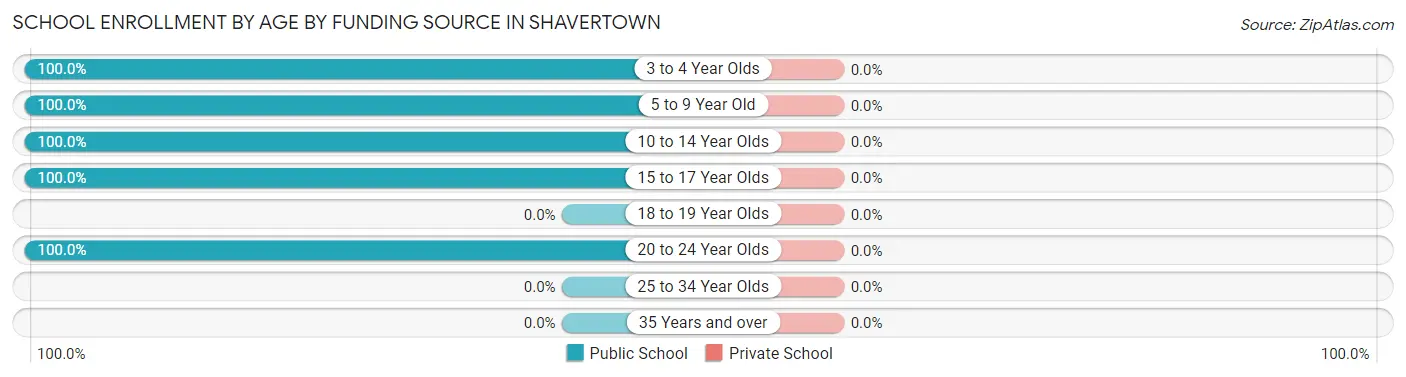
| Age Bracket | Public School | Private School |
| 3 to 4 Year Olds | 29 (100.0%) | 0 (0.0%) |
| 5 to 9 Year Old | 94 (100.0%) | 0 (0.0%) |
| 10 to 14 Year Olds | 9 (100.0%) | 0 (0.0%) |
| 15 to 17 Year Olds | 24 (100.0%) | 0 (0.0%) |
| 18 to 19 Year Olds | 0 (0.0%) | 0 (0.0%) |
| 20 to 24 Year Olds | 16 (100.0%) | 0 (0.0%) |
| 25 to 34 Year Olds | 0 (0.0%) | 0 (0.0%) |
| 35 Years and over | 0 (0.0%) | 0 (0.0%) |
| Total | 172 (100.0%) | 0 (0.0%) |
Educational Attainment by Field of Study in Shavertown
Business (163 | 32.7%), psychology (87 | 17.4%), education (58 | 11.6%), science & technology (52 | 10.4%), and bio, nature & agricultural (37 | 7.4%) are the most common fields of study among 499 individuals in Shavertown who have obtained a bachelor's degree or higher.
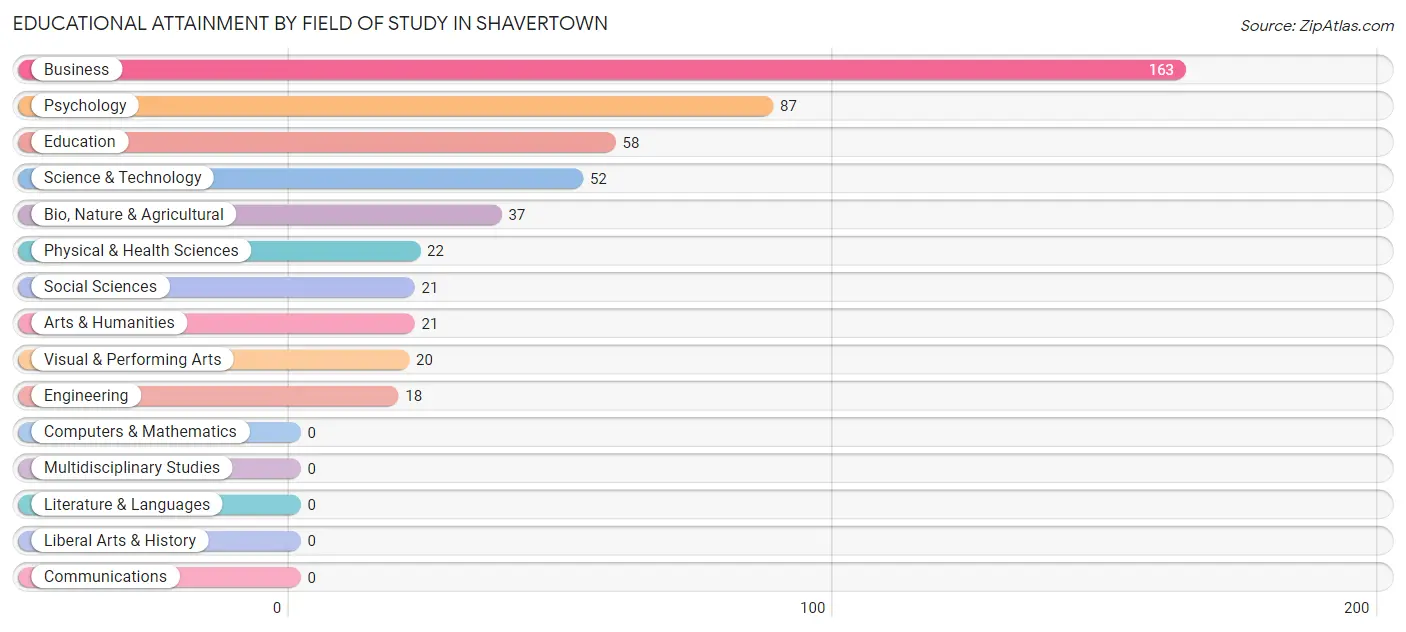
| Field of Study | # Graduates | % Graduates |
| Computers & Mathematics | 0 | 0.0% |
| Bio, Nature & Agricultural | 37 | 7.4% |
| Physical & Health Sciences | 22 | 4.4% |
| Psychology | 87 | 17.4% |
| Social Sciences | 21 | 4.2% |
| Engineering | 18 | 3.6% |
| Multidisciplinary Studies | 0 | 0.0% |
| Science & Technology | 52 | 10.4% |
| Business | 163 | 32.7% |
| Education | 58 | 11.6% |
| Literature & Languages | 0 | 0.0% |
| Liberal Arts & History | 0 | 0.0% |
| Visual & Performing Arts | 20 | 4.0% |
| Communications | 0 | 0.0% |
| Arts & Humanities | 21 | 4.2% |
| Total | 499 | 100.0% |
Transportation & Commute in Shavertown
Vehicle Availability by Sex in Shavertown
The most prevalent vehicle ownership categories in Shavertown are males with 2 vehicles (271, accounting for 48.5%) and females with 2 vehicles (223, making up 56.8%).
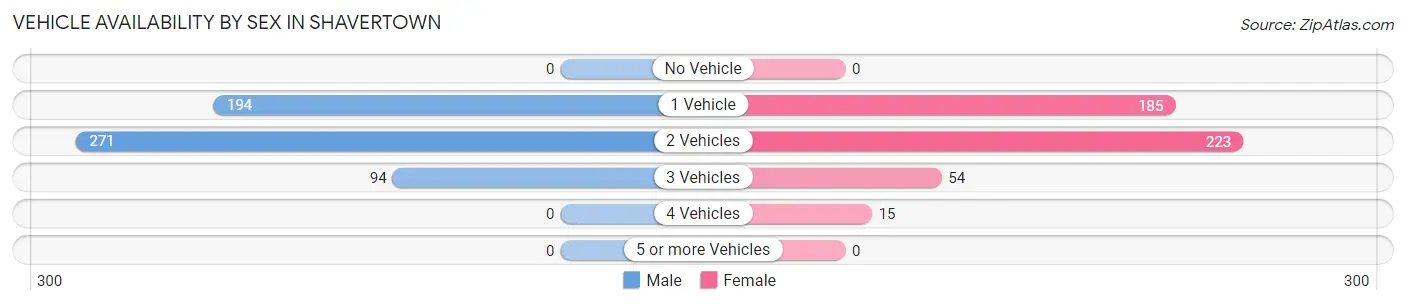
| Vehicles Available | Male | Female |
| No Vehicle | 0 (0.0%) | 0 (0.0%) |
| 1 Vehicle | 194 (34.7%) | 185 (38.8%) |
| 2 Vehicles | 271 (48.5%) | 223 (46.8%) |
| 3 Vehicles | 94 (16.8%) | 54 (11.3%) |
| 4 Vehicles | 0 (0.0%) | 15 (3.1%) |
| 5 or more Vehicles | 0 (0.0%) | 0 (0.0%) |
| Total | 559 (100.0%) | 477 (100.0%) |
Commute Time in Shavertown
The most frequently occuring commute durations in Shavertown are 10 to 14 minutes (251 commuters, 26.8%), 20 to 24 minutes (159 commuters, 17.0%), and 60 to 89 minutes (120 commuters, 12.8%).
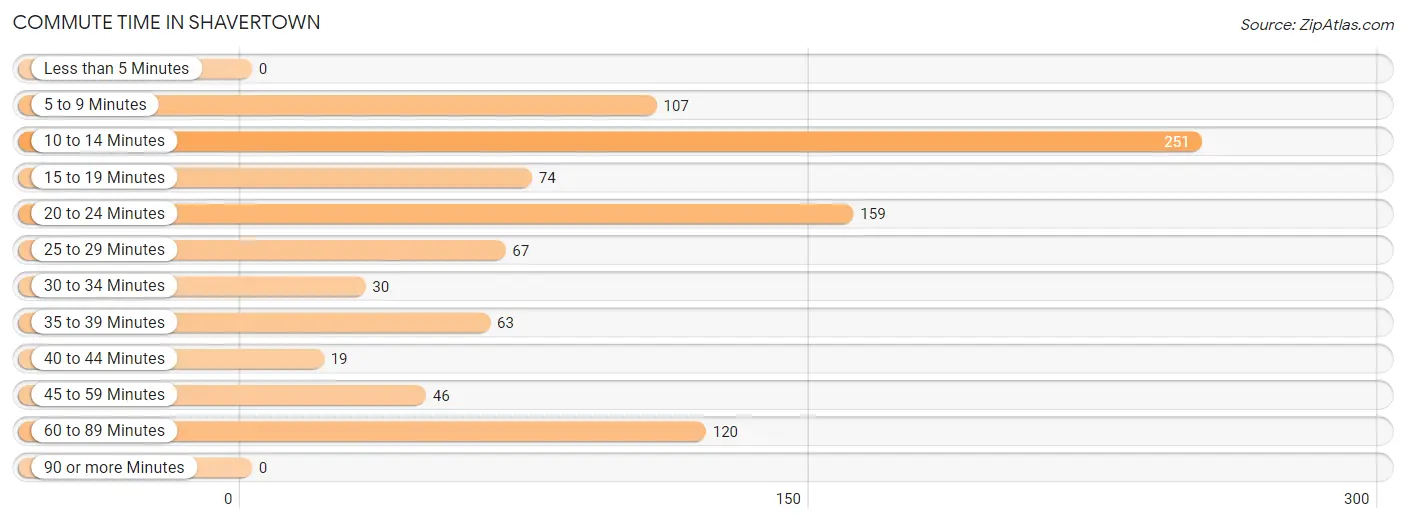
| Commute Time | # Commuters | % Commuters |
| Less than 5 Minutes | 0 | 0.0% |
| 5 to 9 Minutes | 107 | 11.4% |
| 10 to 14 Minutes | 251 | 26.8% |
| 15 to 19 Minutes | 74 | 7.9% |
| 20 to 24 Minutes | 159 | 17.0% |
| 25 to 29 Minutes | 67 | 7.2% |
| 30 to 34 Minutes | 30 | 3.2% |
| 35 to 39 Minutes | 63 | 6.7% |
| 40 to 44 Minutes | 19 | 2.0% |
| 45 to 59 Minutes | 46 | 4.9% |
| 60 to 89 Minutes | 120 | 12.8% |
| 90 or more Minutes | 0 | 0.0% |
Commute Time by Sex in Shavertown
The most common commute times in Shavertown are 10 to 14 minutes (137 commuters, 25.1%) for males and 10 to 14 minutes (114 commuters, 29.3%) for females.
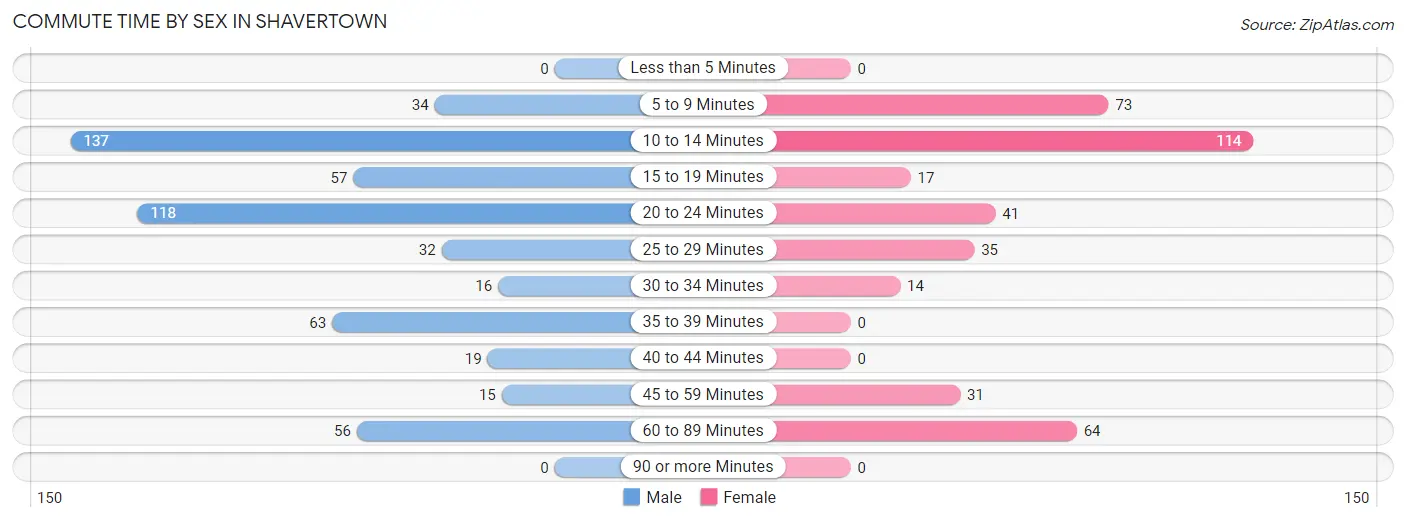
| Commute Time | Male | Female |
| Less than 5 Minutes | 0 (0.0%) | 0 (0.0%) |
| 5 to 9 Minutes | 34 (6.2%) | 73 (18.8%) |
| 10 to 14 Minutes | 137 (25.1%) | 114 (29.3%) |
| 15 to 19 Minutes | 57 (10.4%) | 17 (4.4%) |
| 20 to 24 Minutes | 118 (21.6%) | 41 (10.5%) |
| 25 to 29 Minutes | 32 (5.9%) | 35 (9.0%) |
| 30 to 34 Minutes | 16 (2.9%) | 14 (3.6%) |
| 35 to 39 Minutes | 63 (11.5%) | 0 (0.0%) |
| 40 to 44 Minutes | 19 (3.5%) | 0 (0.0%) |
| 45 to 59 Minutes | 15 (2.7%) | 31 (8.0%) |
| 60 to 89 Minutes | 56 (10.2%) | 64 (16.5%) |
| 90 or more Minutes | 0 (0.0%) | 0 (0.0%) |
Time of Departure to Work by Sex in Shavertown
The most frequent times of departure to work in Shavertown are 12:00 PM to 3:59 PM (113, 20.7%) for males and 7:30 AM to 7:59 AM (94, 24.2%) for females.
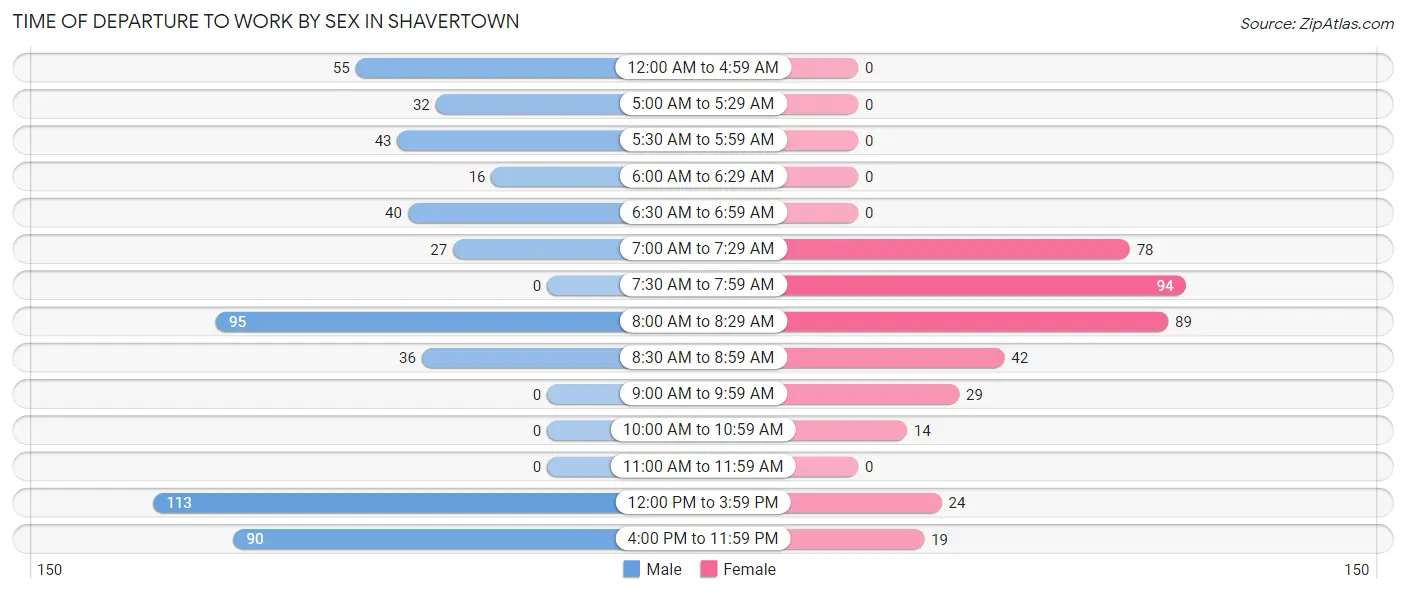
| Time of Departure | Male | Female |
| 12:00 AM to 4:59 AM | 55 (10.1%) | 0 (0.0%) |
| 5:00 AM to 5:29 AM | 32 (5.9%) | 0 (0.0%) |
| 5:30 AM to 5:59 AM | 43 (7.9%) | 0 (0.0%) |
| 6:00 AM to 6:29 AM | 16 (2.9%) | 0 (0.0%) |
| 6:30 AM to 6:59 AM | 40 (7.3%) | 0 (0.0%) |
| 7:00 AM to 7:29 AM | 27 (4.9%) | 78 (20.1%) |
| 7:30 AM to 7:59 AM | 0 (0.0%) | 94 (24.2%) |
| 8:00 AM to 8:29 AM | 95 (17.4%) | 89 (22.9%) |
| 8:30 AM to 8:59 AM | 36 (6.6%) | 42 (10.8%) |
| 9:00 AM to 9:59 AM | 0 (0.0%) | 29 (7.5%) |
| 10:00 AM to 10:59 AM | 0 (0.0%) | 14 (3.6%) |
| 11:00 AM to 11:59 AM | 0 (0.0%) | 0 (0.0%) |
| 12:00 PM to 3:59 PM | 113 (20.7%) | 24 (6.2%) |
| 4:00 PM to 11:59 PM | 90 (16.5%) | 19 (4.9%) |
| Total | 547 (100.0%) | 389 (100.0%) |
Housing Occupancy in Shavertown
Occupancy by Ownership in Shavertown
Of the total 940 dwellings in Shavertown, owner-occupied units account for 773 (82.2%), while renter-occupied units make up 167 (17.8%).
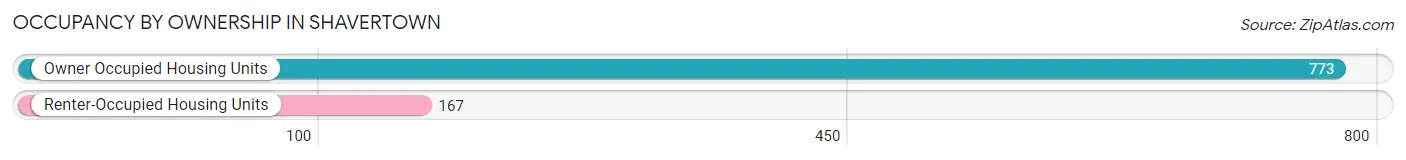
| Occupancy | # Housing Units | % Housing Units |
| Owner Occupied Housing Units | 773 | 82.2% |
| Renter-Occupied Housing Units | 167 | 17.8% |
| Total Occupied Housing Units | 940 | 100.0% |
Occupancy by Household Size in Shavertown
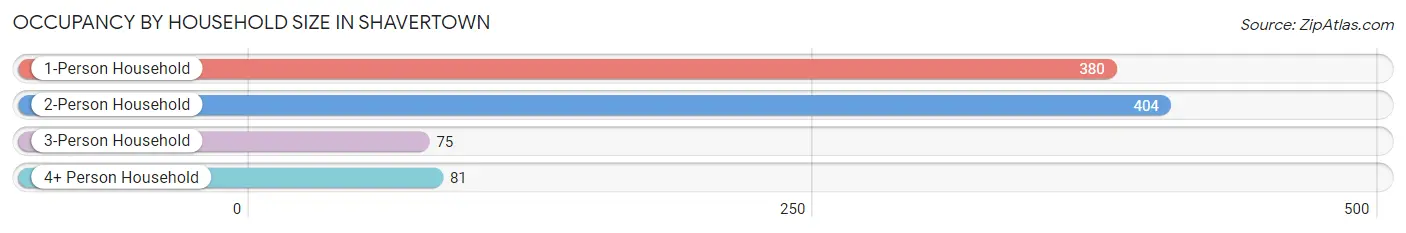
| Household Size | # Housing Units | % Housing Units |
| 1-Person Household | 380 | 40.4% |
| 2-Person Household | 404 | 43.0% |
| 3-Person Household | 75 | 8.0% |
| 4+ Person Household | 81 | 8.6% |
| Total Housing Units | 940 | 100.0% |
Occupancy by Ownership by Household Size in Shavertown
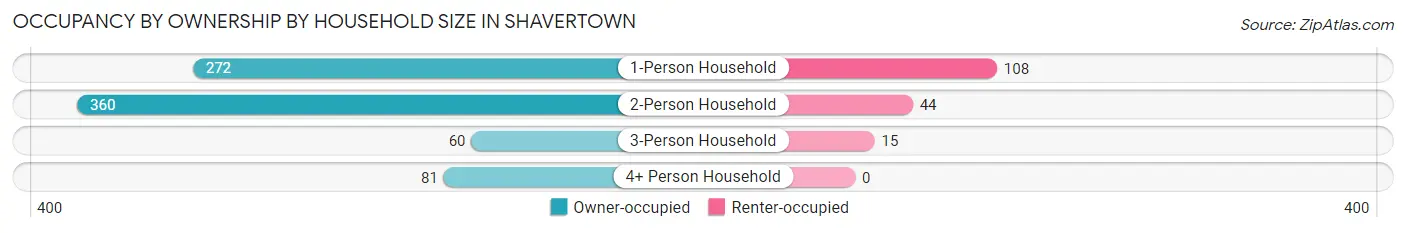
| Household Size | Owner-occupied | Renter-occupied |
| 1-Person Household | 272 (71.6%) | 108 (28.4%) |
| 2-Person Household | 360 (89.1%) | 44 (10.9%) |
| 3-Person Household | 60 (80.0%) | 15 (20.0%) |
| 4+ Person Household | 81 (100.0%) | 0 (0.0%) |
| Total Housing Units | 773 (82.2%) | 167 (17.8%) |
Occupancy by Educational Attainment in Shavertown
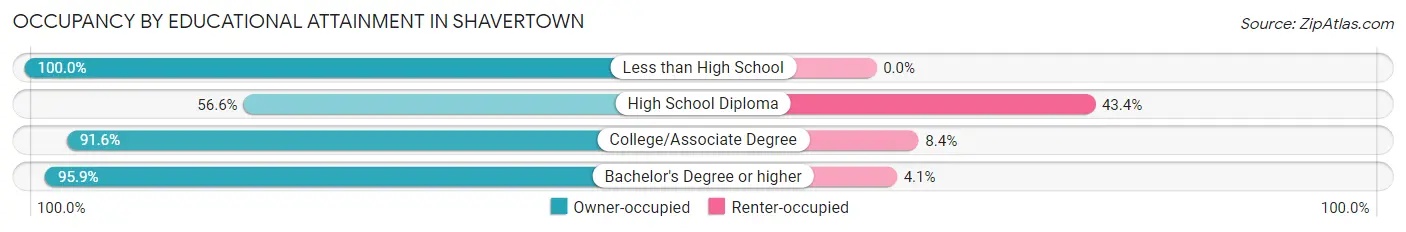
| Household Size | Owner-occupied | Renter-occupied |
| Less than High School | 19 (100.0%) | 0 (0.0%) |
| High School Diploma | 171 (56.6%) | 131 (43.4%) |
| College/Associate Degree | 230 (91.6%) | 21 (8.4%) |
| Bachelor's Degree or higher | 353 (95.9%) | 15 (4.1%) |
Occupancy by Age of Householder in Shavertown
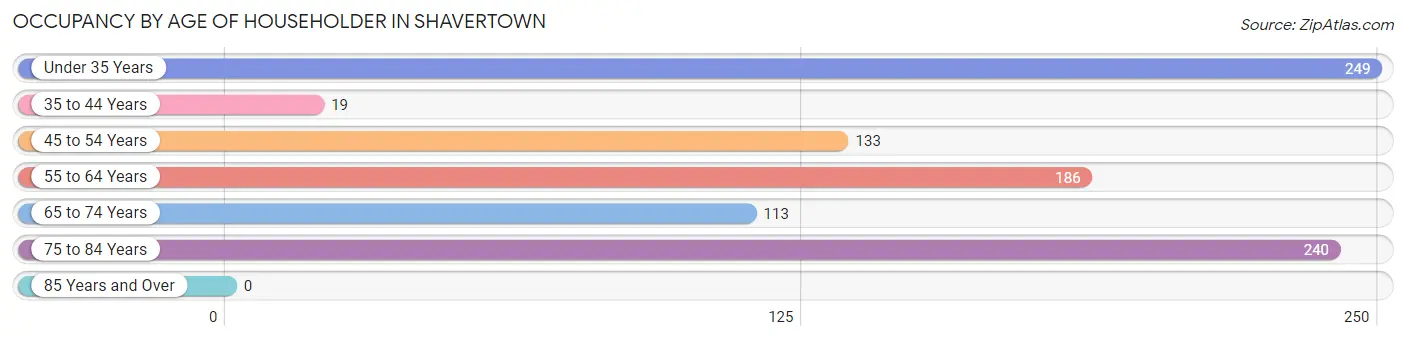
| Age Bracket | # Households | % Households |
| Under 35 Years | 249 | 26.5% |
| 35 to 44 Years | 19 | 2.0% |
| 45 to 54 Years | 133 | 14.1% |
| 55 to 64 Years | 186 | 19.8% |
| 65 to 74 Years | 113 | 12.0% |
| 75 to 84 Years | 240 | 25.5% |
| 85 Years and Over | 0 | 0.0% |
| Total | 940 | 100.0% |
Housing Finances in Shavertown
Median Income by Occupancy in Shavertown
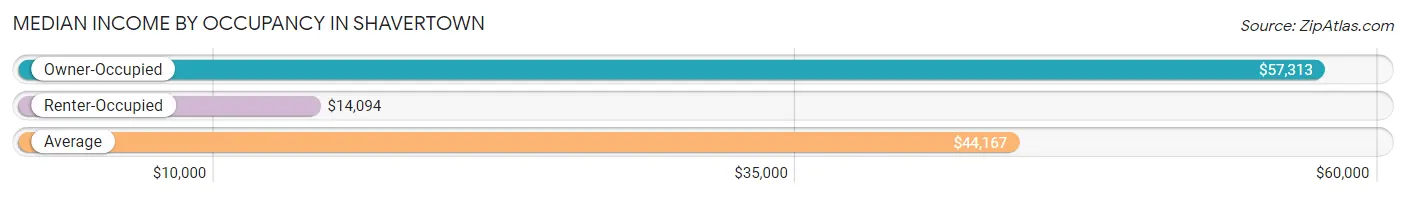
| Occupancy Type | # Households | Median Income |
| Owner-Occupied | 773 (82.2%) | $57,313 |
| Renter-Occupied | 167 (17.8%) | $14,094 |
| Average | 940 (100.0%) | $44,167 |
Occupancy by Householder Income Bracket in Shavertown
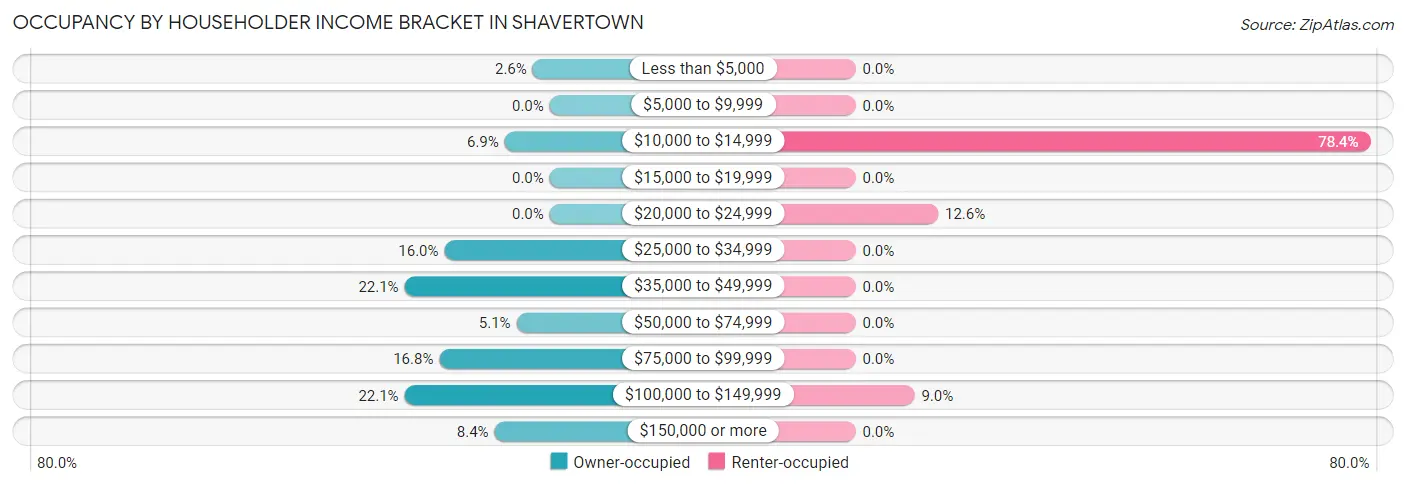
| Income Bracket | Owner-occupied | Renter-occupied |
| Less than $5,000 | 20 (2.6%) | 0 (0.0%) |
| $5,000 to $9,999 | 0 (0.0%) | 0 (0.0%) |
| $10,000 to $14,999 | 53 (6.9%) | 131 (78.4%) |
| $15,000 to $19,999 | 0 (0.0%) | 0 (0.0%) |
| $20,000 to $24,999 | 0 (0.0%) | 21 (12.6%) |
| $25,000 to $34,999 | 124 (16.0%) | 0 (0.0%) |
| $35,000 to $49,999 | 171 (22.1%) | 0 (0.0%) |
| $50,000 to $74,999 | 39 (5.1%) | 0 (0.0%) |
| $75,000 to $99,999 | 130 (16.8%) | 0 (0.0%) |
| $100,000 to $149,999 | 171 (22.1%) | 15 (9.0%) |
| $150,000 or more | 65 (8.4%) | 0 (0.0%) |
| Total | 773 (100.0%) | 167 (100.0%) |
Monthly Housing Cost Tiers in Shavertown
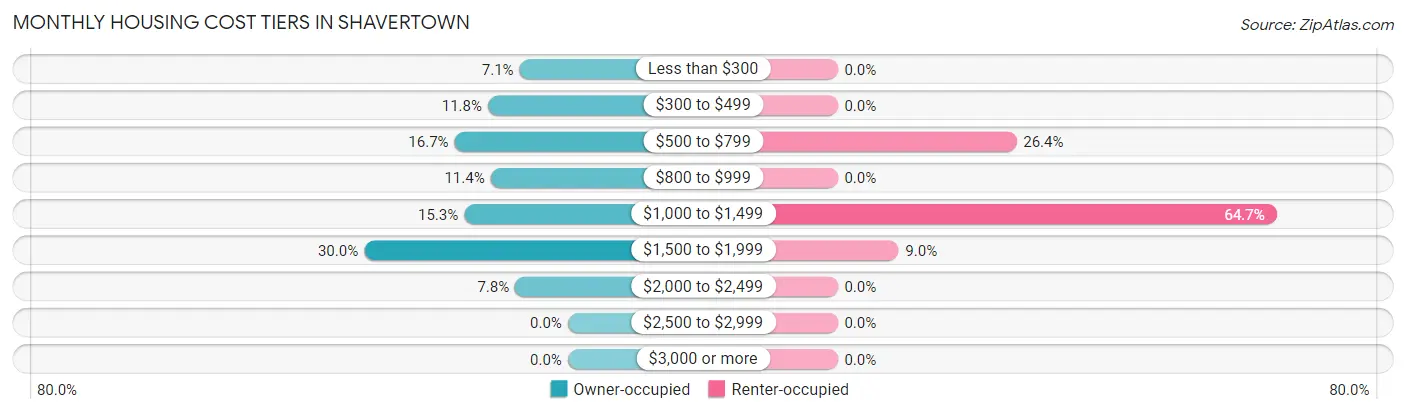
| Monthly Cost | Owner-occupied | Renter-occupied |
| Less than $300 | 55 (7.1%) | 0 (0.0%) |
| $300 to $499 | 91 (11.8%) | 0 (0.0%) |
| $500 to $799 | 129 (16.7%) | 44 (26.4%) |
| $800 to $999 | 88 (11.4%) | 0 (0.0%) |
| $1,000 to $1,499 | 118 (15.3%) | 108 (64.7%) |
| $1,500 to $1,999 | 232 (30.0%) | 15 (9.0%) |
| $2,000 to $2,499 | 60 (7.8%) | 0 (0.0%) |
| $2,500 to $2,999 | 0 (0.0%) | 0 (0.0%) |
| $3,000 or more | 0 (0.0%) | 0 (0.0%) |
| Total | 773 (100.0%) | 167 (100.0%) |
Physical Housing Characteristics in Shavertown
Housing Structures in Shavertown
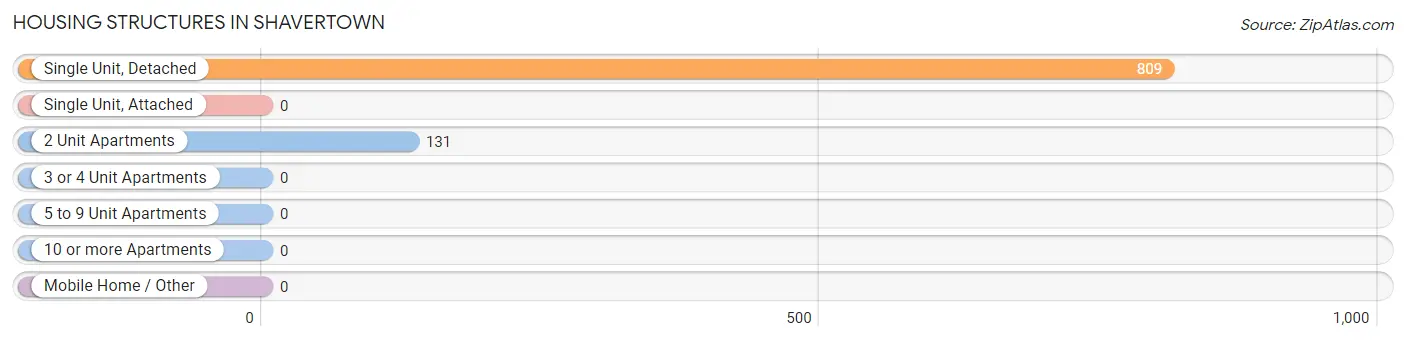
| Structure Type | # Housing Units | % Housing Units |
| Single Unit, Detached | 809 | 86.1% |
| Single Unit, Attached | 0 | 0.0% |
| 2 Unit Apartments | 131 | 13.9% |
| 3 or 4 Unit Apartments | 0 | 0.0% |
| 5 to 9 Unit Apartments | 0 | 0.0% |
| 10 or more Apartments | 0 | 0.0% |
| Mobile Home / Other | 0 | 0.0% |
| Total | 940 | 100.0% |
Housing Structures by Occupancy in Shavertown
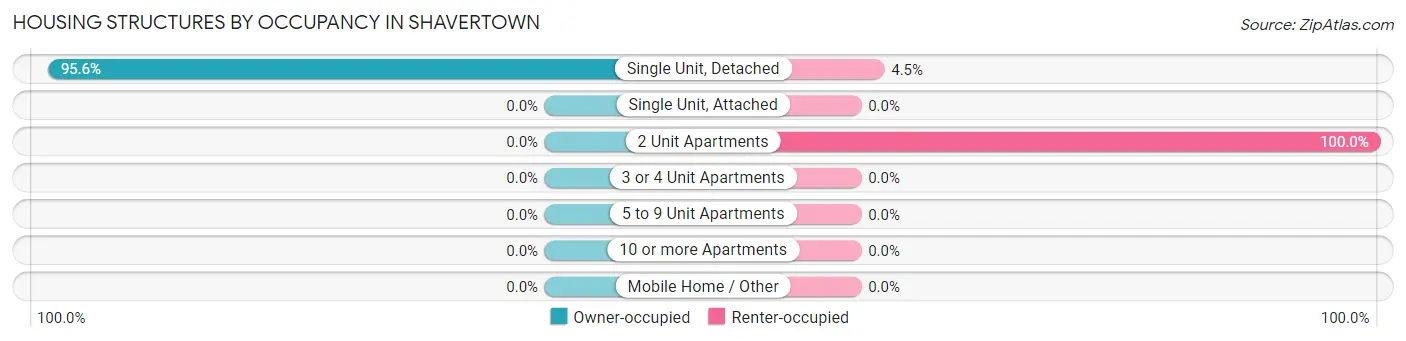
| Structure Type | Owner-occupied | Renter-occupied |
| Single Unit, Detached | 773 (95.6%) | 36 (4.4%) |
| Single Unit, Attached | 0 (0.0%) | 0 (0.0%) |
| 2 Unit Apartments | 0 (0.0%) | 131 (100.0%) |
| 3 or 4 Unit Apartments | 0 (0.0%) | 0 (0.0%) |
| 5 to 9 Unit Apartments | 0 (0.0%) | 0 (0.0%) |
| 10 or more Apartments | 0 (0.0%) | 0 (0.0%) |
| Mobile Home / Other | 0 (0.0%) | 0 (0.0%) |
| Total | 773 (82.2%) | 167 (17.8%) |
Housing Structures by Number of Rooms in Shavertown
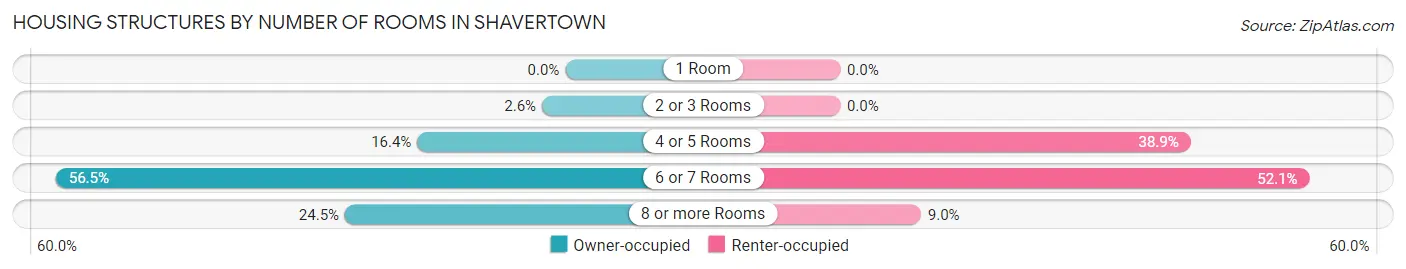
| Number of Rooms | Owner-occupied | Renter-occupied |
| 1 Room | 0 (0.0%) | 0 (0.0%) |
| 2 or 3 Rooms | 20 (2.6%) | 0 (0.0%) |
| 4 or 5 Rooms | 127 (16.4%) | 65 (38.9%) |
| 6 or 7 Rooms | 437 (56.5%) | 87 (52.1%) |
| 8 or more Rooms | 189 (24.4%) | 15 (9.0%) |
| Total | 773 (100.0%) | 167 (100.0%) |
Housing Structure by Heating Type in Shavertown
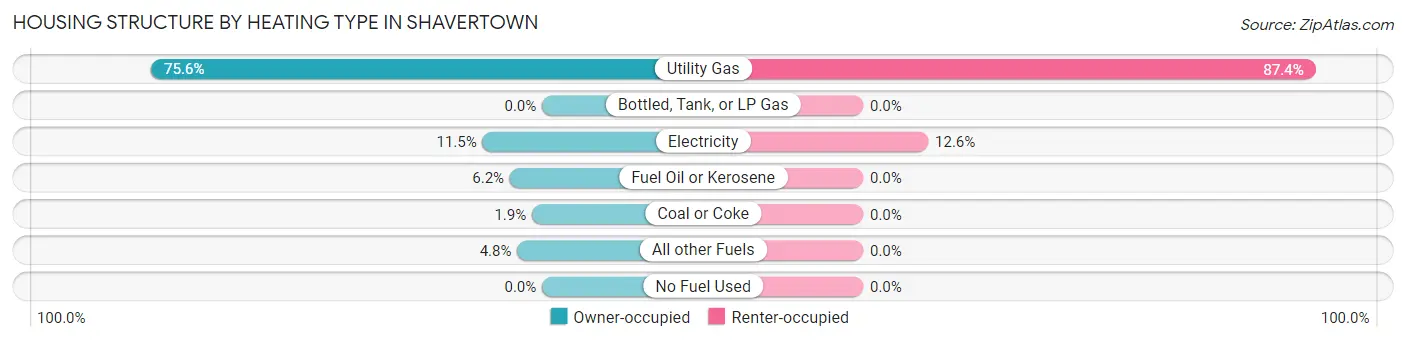
| Heating Type | Owner-occupied | Renter-occupied |
| Utility Gas | 584 (75.5%) | 146 (87.4%) |
| Bottled, Tank, or LP Gas | 0 (0.0%) | 0 (0.0%) |
| Electricity | 89 (11.5%) | 21 (12.6%) |
| Fuel Oil or Kerosene | 48 (6.2%) | 0 (0.0%) |
| Coal or Coke | 15 (1.9%) | 0 (0.0%) |
| All other Fuels | 37 (4.8%) | 0 (0.0%) |
| No Fuel Used | 0 (0.0%) | 0 (0.0%) |
| Total | 773 (100.0%) | 167 (100.0%) |
Household Vehicle Usage in Shavertown
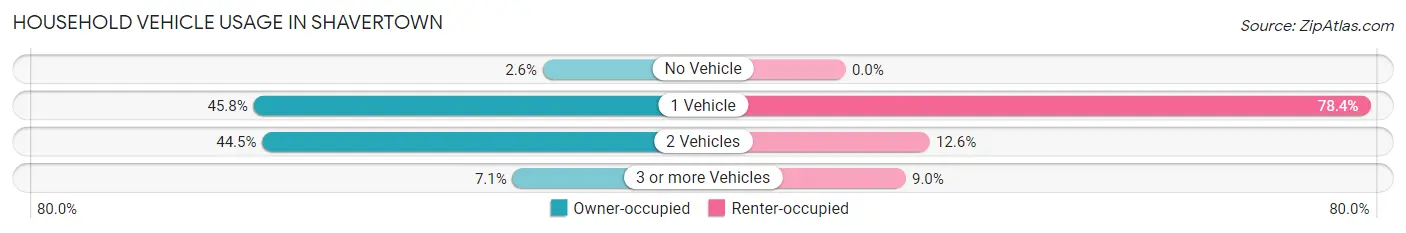
| Vehicles per Household | Owner-occupied | Renter-occupied |
| No Vehicle | 20 (2.6%) | 0 (0.0%) |
| 1 Vehicle | 354 (45.8%) | 131 (78.4%) |
| 2 Vehicles | 344 (44.5%) | 21 (12.6%) |
| 3 or more Vehicles | 55 (7.1%) | 15 (9.0%) |
| Total | 773 (100.0%) | 167 (100.0%) |
Real Estate & Mortgages in Shavertown
Real Estate and Mortgage Overview in Shavertown
| Characteristic | Without Mortgage | With Mortgage |
| Housing Units | 275 | 498 |
| Median Property Value | $147,700 | $141,400 |
| Median Household Income | - | - |
| Monthly Housing Costs | $491 | $0 |
| Real Estate Taxes | $1,822 | $0 |
Property Value by Mortgage Status in Shavertown
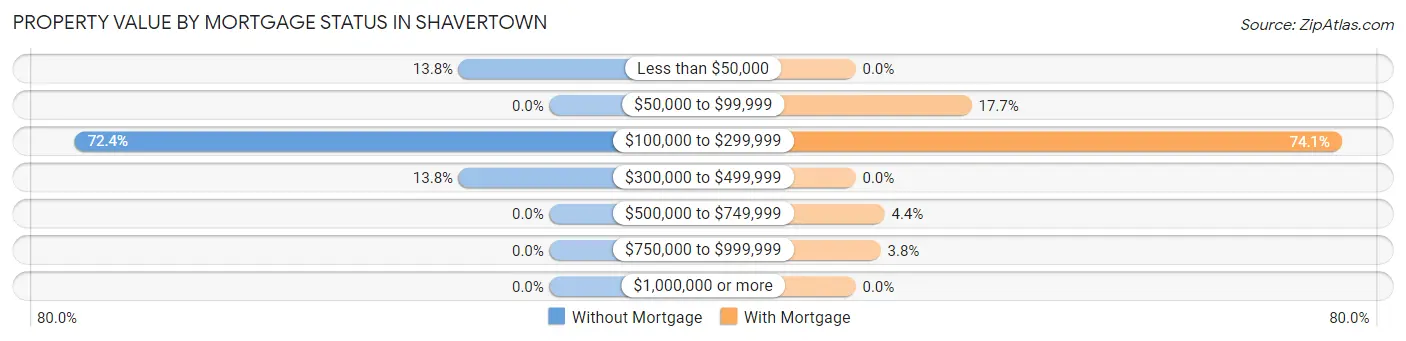
| Property Value | Without Mortgage | With Mortgage |
| Less than $50,000 | 38 (13.8%) | 0 (0.0%) |
| $50,000 to $99,999 | 0 (0.0%) | 88 (17.7%) |
| $100,000 to $299,999 | 199 (72.4%) | 369 (74.1%) |
| $300,000 to $499,999 | 38 (13.8%) | 0 (0.0%) |
| $500,000 to $749,999 | 0 (0.0%) | 22 (4.4%) |
| $750,000 to $999,999 | 0 (0.0%) | 19 (3.8%) |
| $1,000,000 or more | 0 (0.0%) | 0 (0.0%) |
| Total | 275 (100.0%) | 498 (100.0%) |
Household Income by Mortgage Status in Shavertown
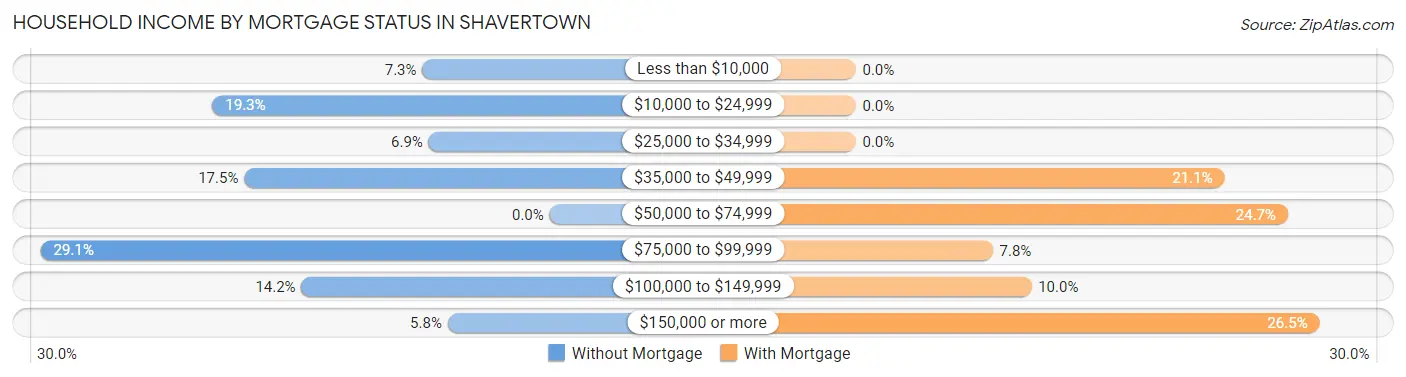
| Household Income | Without Mortgage | With Mortgage |
| Less than $10,000 | 20 (7.3%) | 0 (0.0%) |
| $10,000 to $24,999 | 53 (19.3%) | 0 (0.0%) |
| $25,000 to $34,999 | 19 (6.9%) | 0 (0.0%) |
| $35,000 to $49,999 | 48 (17.4%) | 105 (21.1%) |
| $50,000 to $74,999 | 0 (0.0%) | 123 (24.7%) |
| $75,000 to $99,999 | 80 (29.1%) | 39 (7.8%) |
| $100,000 to $149,999 | 39 (14.2%) | 50 (10.0%) |
| $150,000 or more | 16 (5.8%) | 132 (26.5%) |
| Total | 275 (100.0%) | 498 (100.0%) |
Property Value to Household Income Ratio in Shavertown
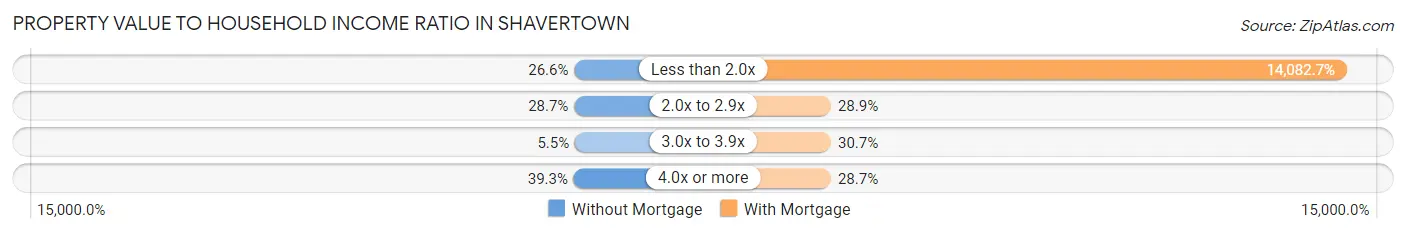
| Value-to-Income Ratio | Without Mortgage | With Mortgage |
| Less than 2.0x | 73 (26.6%) | 70,132 (14,082.7%) |
| 2.0x to 2.9x | 79 (28.7%) | 144 (28.9%) |
| 3.0x to 3.9x | 15 (5.4%) | 153 (30.7%) |
| 4.0x or more | 108 (39.3%) | 143 (28.7%) |
| Total | 275 (100.0%) | 498 (100.0%) |
Real Estate Taxes by Mortgage Status in Shavertown
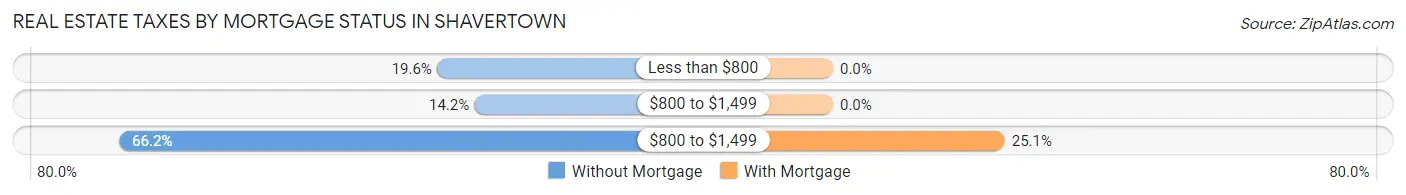
| Property Taxes | Without Mortgage | With Mortgage |
| Less than $800 | 54 (19.6%) | 0 (0.0%) |
| $800 to $1,499 | 39 (14.2%) | 0 (0.0%) |
| $800 to $1,499 | 182 (66.2%) | 125 (25.1%) |
| Total | 275 (100.0%) | 498 (100.0%) |
Health & Disability in Shavertown
Health Insurance Coverage by Age in Shavertown
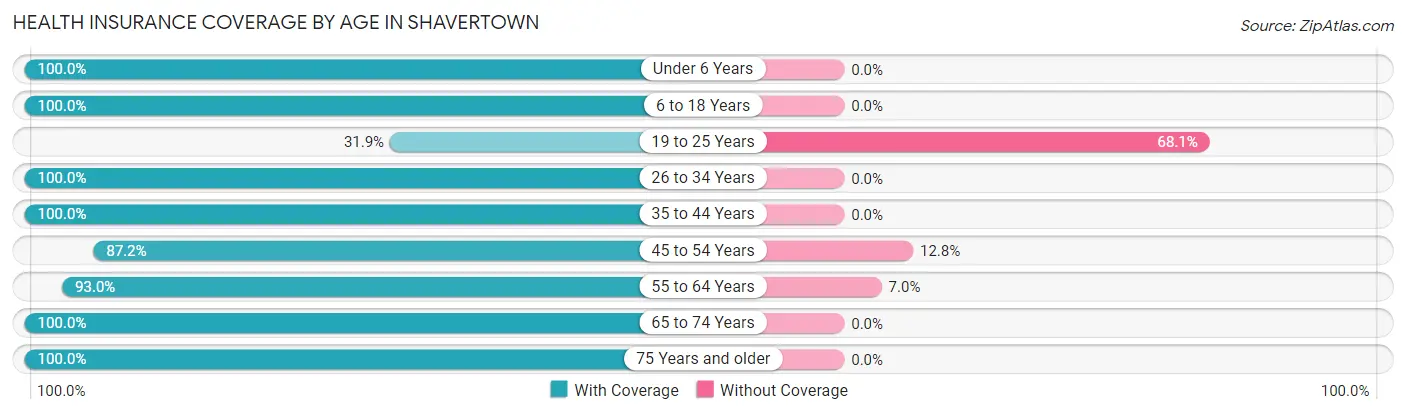
| Age Bracket | With Coverage | Without Coverage |
| Under 6 Years | 150 (100.0%) | 0 (0.0%) |
| 6 to 18 Years | 116 (100.0%) | 0 (0.0%) |
| 19 to 25 Years | 58 (31.9%) | 124 (68.1%) |
| 26 to 34 Years | 425 (100.0%) | 0 (0.0%) |
| 35 to 44 Years | 44 (100.0%) | 0 (0.0%) |
| 45 to 54 Years | 136 (87.2%) | 20 (12.8%) |
| 55 to 64 Years | 267 (93.0%) | 20 (7.0%) |
| 65 to 74 Years | 153 (100.0%) | 0 (0.0%) |
| 75 Years and older | 301 (100.0%) | 0 (0.0%) |
| Total | 1,650 (91.0%) | 164 (9.0%) |
Health Insurance Coverage by Citizenship Status in Shavertown
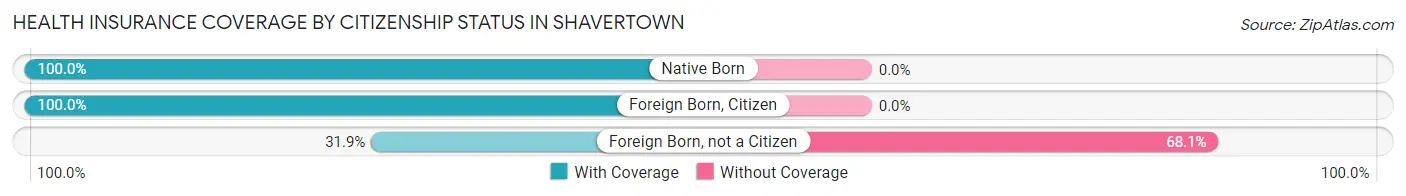
| Citizenship Status | With Coverage | Without Coverage |
| Native Born | 150 (100.0%) | 0 (0.0%) |
| Foreign Born, Citizen | 116 (100.0%) | 0 (0.0%) |
| Foreign Born, not a Citizen | 58 (31.9%) | 124 (68.1%) |
Health Insurance Coverage by Household Income in Shavertown
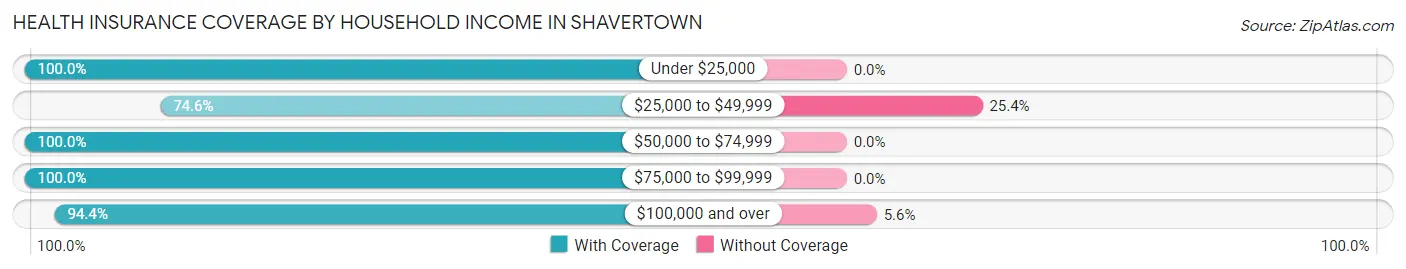
| Household Income | With Coverage | Without Coverage |
| Under $25,000 | 271 (100.0%) | 0 (0.0%) |
| $25,000 to $49,999 | 364 (74.6%) | 124 (25.4%) |
| $50,000 to $74,999 | 77 (100.0%) | 0 (0.0%) |
| $75,000 to $99,999 | 265 (100.0%) | 0 (0.0%) |
| $100,000 and over | 673 (94.4%) | 40 (5.6%) |
Public vs Private Health Insurance Coverage by Age in Shavertown
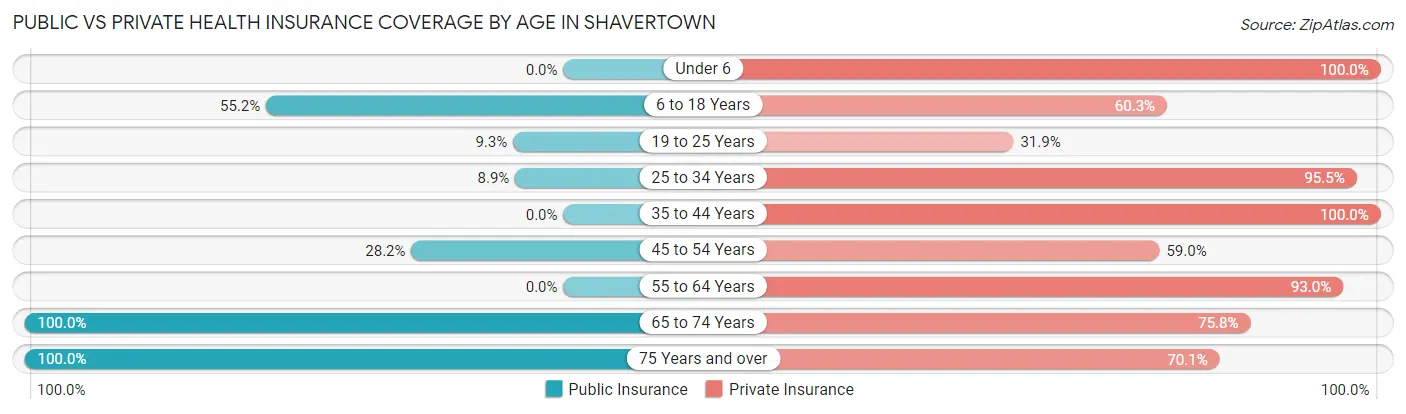
| Age Bracket | Public Insurance | Private Insurance |
| Under 6 | 0 (0.0%) | 150 (100.0%) |
| 6 to 18 Years | 64 (55.2%) | 70 (60.3%) |
| 19 to 25 Years | 17 (9.3%) | 58 (31.9%) |
| 25 to 34 Years | 38 (8.9%) | 406 (95.5%) |
| 35 to 44 Years | 0 (0.0%) | 44 (100.0%) |
| 45 to 54 Years | 44 (28.2%) | 92 (59.0%) |
| 55 to 64 Years | 0 (0.0%) | 267 (93.0%) |
| 65 to 74 Years | 153 (100.0%) | 116 (75.8%) |
| 75 Years and over | 301 (100.0%) | 211 (70.1%) |
| Total | 617 (34.0%) | 1,414 (77.9%) |
Disability Status by Sex by Age in Shavertown
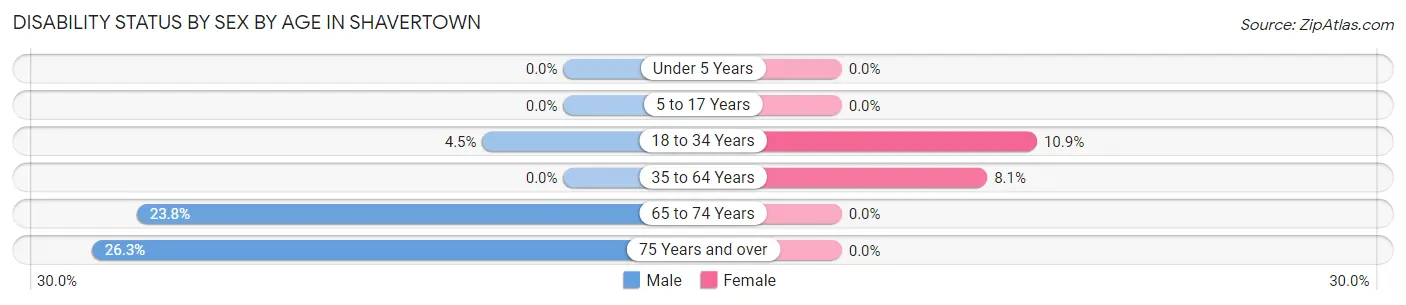
| Age Bracket | Male | Female |
| Under 5 Years | 0 (0.0%) | 0 (0.0%) |
| 5 to 17 Years | 0 (0.0%) | 0 (0.0%) |
| 18 to 34 Years | 17 (4.5%) | 25 (10.9%) |
| 35 to 64 Years | 0 (0.0%) | 17 (8.1%) |
| 65 to 74 Years | 19 (23.7%) | 0 (0.0%) |
| 75 Years and over | 21 (26.3%) | 0 (0.0%) |
Disability Class by Sex by Age in Shavertown
Disability Class: Hearing Difficulty
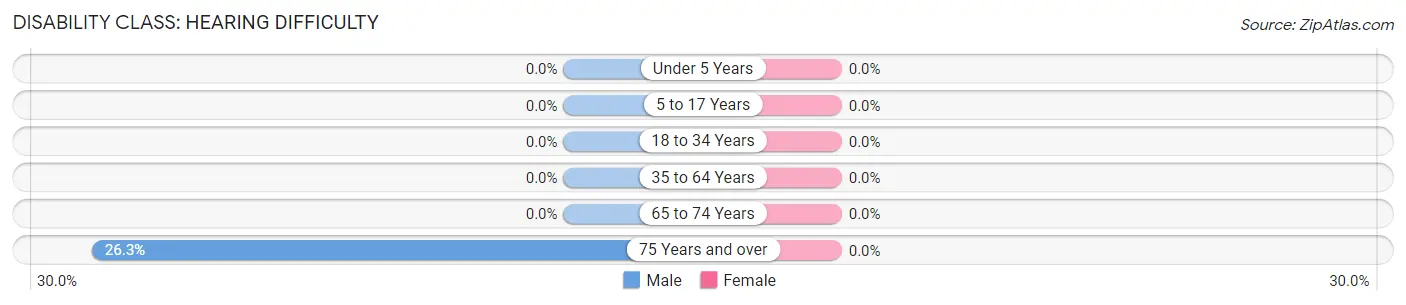
| Age Bracket | Male | Female |
| Under 5 Years | 0 (0.0%) | 0 (0.0%) |
| 5 to 17 Years | 0 (0.0%) | 0 (0.0%) |
| 18 to 34 Years | 0 (0.0%) | 0 (0.0%) |
| 35 to 64 Years | 0 (0.0%) | 0 (0.0%) |
| 65 to 74 Years | 0 (0.0%) | 0 (0.0%) |
| 75 Years and over | 21 (26.3%) | 0 (0.0%) |
Disability Class: Vision Difficulty
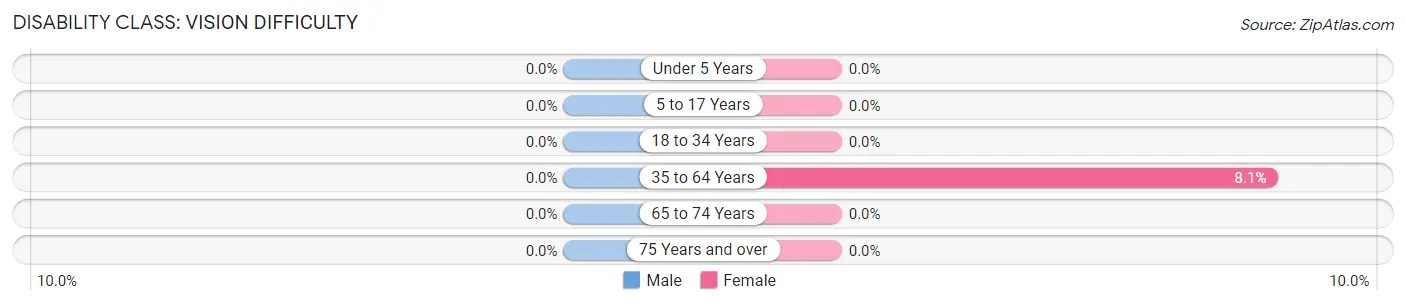
| Age Bracket | Male | Female |
| Under 5 Years | 0 (0.0%) | 0 (0.0%) |
| 5 to 17 Years | 0 (0.0%) | 0 (0.0%) |
| 18 to 34 Years | 0 (0.0%) | 0 (0.0%) |
| 35 to 64 Years | 0 (0.0%) | 17 (8.1%) |
| 65 to 74 Years | 0 (0.0%) | 0 (0.0%) |
| 75 Years and over | 0 (0.0%) | 0 (0.0%) |
Disability Class: Cognitive Difficulty
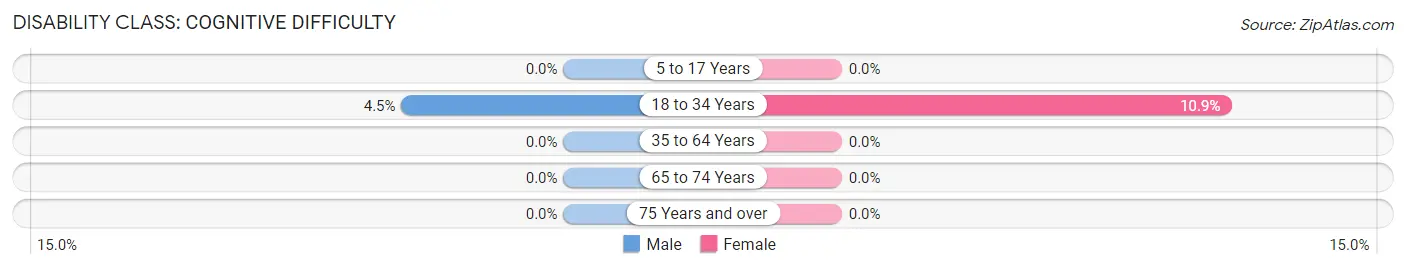
| Age Bracket | Male | Female |
| 5 to 17 Years | 0 (0.0%) | 0 (0.0%) |
| 18 to 34 Years | 17 (4.5%) | 25 (10.9%) |
| 35 to 64 Years | 0 (0.0%) | 0 (0.0%) |
| 65 to 74 Years | 0 (0.0%) | 0 (0.0%) |
| 75 Years and over | 0 (0.0%) | 0 (0.0%) |
Disability Class: Ambulatory Difficulty
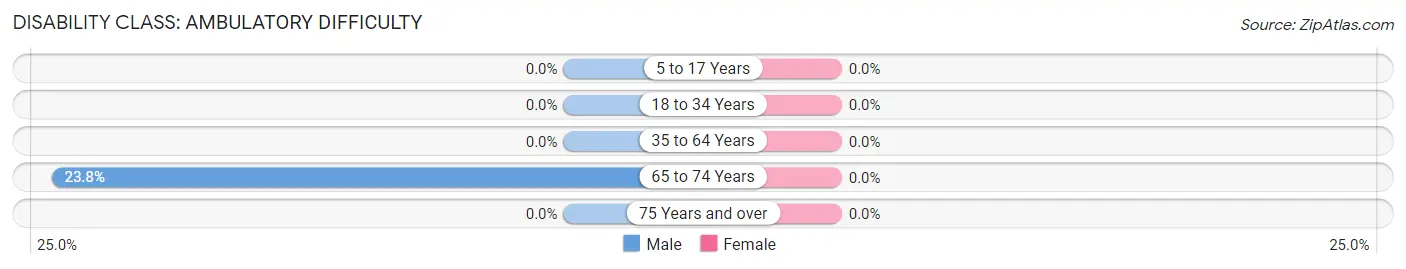
| Age Bracket | Male | Female |
| 5 to 17 Years | 0 (0.0%) | 0 (0.0%) |
| 18 to 34 Years | 0 (0.0%) | 0 (0.0%) |
| 35 to 64 Years | 0 (0.0%) | 0 (0.0%) |
| 65 to 74 Years | 19 (23.7%) | 0 (0.0%) |
| 75 Years and over | 0 (0.0%) | 0 (0.0%) |
Disability Class: Self-Care Difficulty
| Age Bracket | Male | Female |
| 5 to 17 Years | 0 (0.0%) | 0 (0.0%) |
| 18 to 34 Years | 0 (0.0%) | 0 (0.0%) |
| 35 to 64 Years | 0 (0.0%) | 0 (0.0%) |
| 65 to 74 Years | 0 (0.0%) | 0 (0.0%) |
| 75 Years and over | 0 (0.0%) | 0 (0.0%) |
Technology Access in Shavertown
Computing Device Access in Shavertown
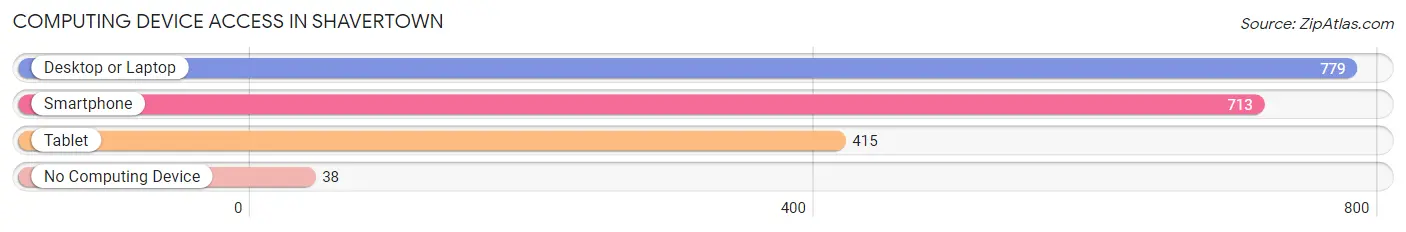
| Device Type | # Households | % Households |
| Desktop or Laptop | 779 | 82.9% |
| Smartphone | 713 | 75.8% |
| Tablet | 415 | 44.2% |
| No Computing Device | 38 | 4.0% |
| Total | 940 | 100.0% |
Internet Access in Shavertown
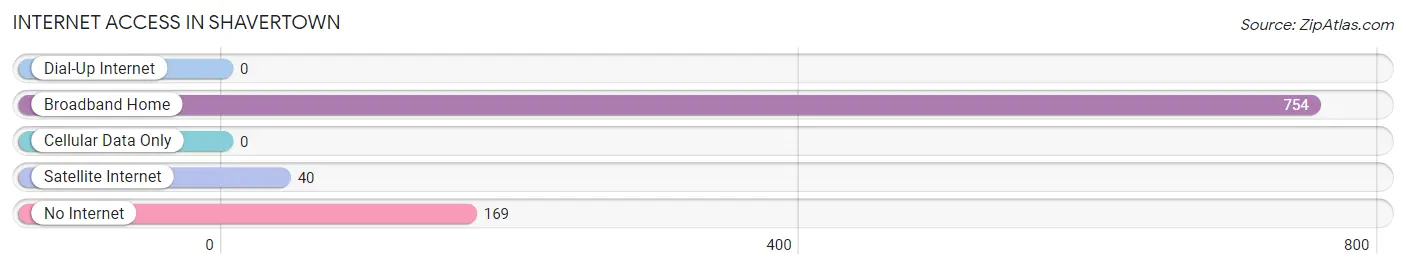
| Internet Type | # Households | % Households |
| Dial-Up Internet | 0 | 0.0% |
| Broadband Home | 754 | 80.2% |
| Cellular Data Only | 0 | 0.0% |
| Satellite Internet | 40 | 4.3% |
| No Internet | 169 | 18.0% |
| Total | 940 | 100.0% |
Shavertown Summary
Shavertown is a small borough located in Luzerne County, Pennsylvania. It is situated in the Wyoming Valley, a region of the state known for its rich history and culture. The borough is located approximately 10 miles southwest of Wilkes-Barre, the county seat. As of the 2010 census, the population of Shavertown was 2,717.
History
Shavertown was first settled in the late 1700s by a group of Welsh immigrants. The town was originally known as “Shaver’s Town” after the family who owned the land. The town was officially incorporated in 1845.
In the late 1800s, Shavertown was a thriving industrial center. The town was home to several coal mines, brickyards, and other businesses. The town also had a large population of Welsh immigrants, who brought their culture and traditions to the area.
Geography
Shavertown is located in the Wyoming Valley of northeastern Pennsylvania. The borough is situated in the foothills of the Pocono Mountains, and is surrounded by rolling hills and forests. The town is located approximately 10 miles southwest of Wilkes-Barre, the county seat.
The climate in Shavertown is typical of the northeastern United States. Summers are warm and humid, while winters are cold and snowy. The average annual temperature is around 50 degrees Fahrenheit.
Economy
Shavertown’s economy is largely based on the service industry. The town is home to several restaurants, retail stores, and other businesses. The town also has a small manufacturing sector, which produces a variety of products, including furniture and clothing.
The town is also home to several small farms, which produce a variety of crops, including corn, soybeans, and hay.
Demographics
As of the 2010 census, the population of Shavertown was 2,717. The racial makeup of the town was 97.3% White, 0.7% African American, 0.2% Native American, 0.4% Asian, and 1.4% from other races.
The median household income in Shavertown was $45,938, and the median family income was $54,938. The per capita income was $21,938. About 8.3% of the population was below the poverty line.
Shavertown is a small, close-knit community with a rich history and culture. The town is home to a diverse population, and is a great place to live and work. The town offers a variety of amenities, including restaurants, retail stores, and other businesses. The town also has a strong sense of community, and is a great place to raise a family.
Common Questions
What is Per Capita Income in Shavertown?
Per Capita income in Shavertown is $34,008.
What is the Median Family Income in Shavertown?
Median Family Income in Shavertown is $78,090.
What is the Median Household income in Shavertown?
Median Household Income in Shavertown is $44,167.
What is Income or Wage Gap in Shavertown?
Income or Wage Gap in Shavertown is 10.6%.
Women in Shavertown earn 89.4 cents for every dollar earned by a man.
What is Inequality or Gini Index in Shavertown?
Inequality or Gini Index in Shavertown is 0.42.
What is the Total Population of Shavertown?
Total Population of Shavertown is 1,814.
What is the Total Male Population of Shavertown?
Total Male Population of Shavertown is 922.
What is the Total Female Population of Shavertown?
Total Female Population of Shavertown is 892.
What is the Ratio of Males per 100 Females in Shavertown?
There are 103.36 Males per 100 Females in Shavertown.
What is the Ratio of Females per 100 Males in Shavertown?
There are 96.75 Females per 100 Males in Shavertown.
What is the Median Population Age in Shavertown?
Median Population Age in Shavertown is 40.6 Years.
What is the Average Family Size in Shavertown
Average Family Size in Shavertown is 2.5 People.
What is the Average Household Size in Shavertown
Average Household Size in Shavertown is 1.9 People.
How Large is the Labor Force in Shavertown?
There are 1,181 People in the Labor Forcein in Shavertown.
What is the Percentage of People in the Labor Force in Shavertown?
75.1% of People are in the Labor Force in Shavertown.
What is the Unemployment Rate in Shavertown?
Unemployment Rate in Shavertown is 10.5%.