Cities with the Highest Percentage of Population Employed in Administrative & Support Services in Mississippi
RELATED REPORTS & OPTIONS
Administrative & Support Services
Mississippi
Compare Cities
Map of Cities with the Highest Percentage of Population Employed in Administrative & Support Services in Mississippi
0.0%
40.0%
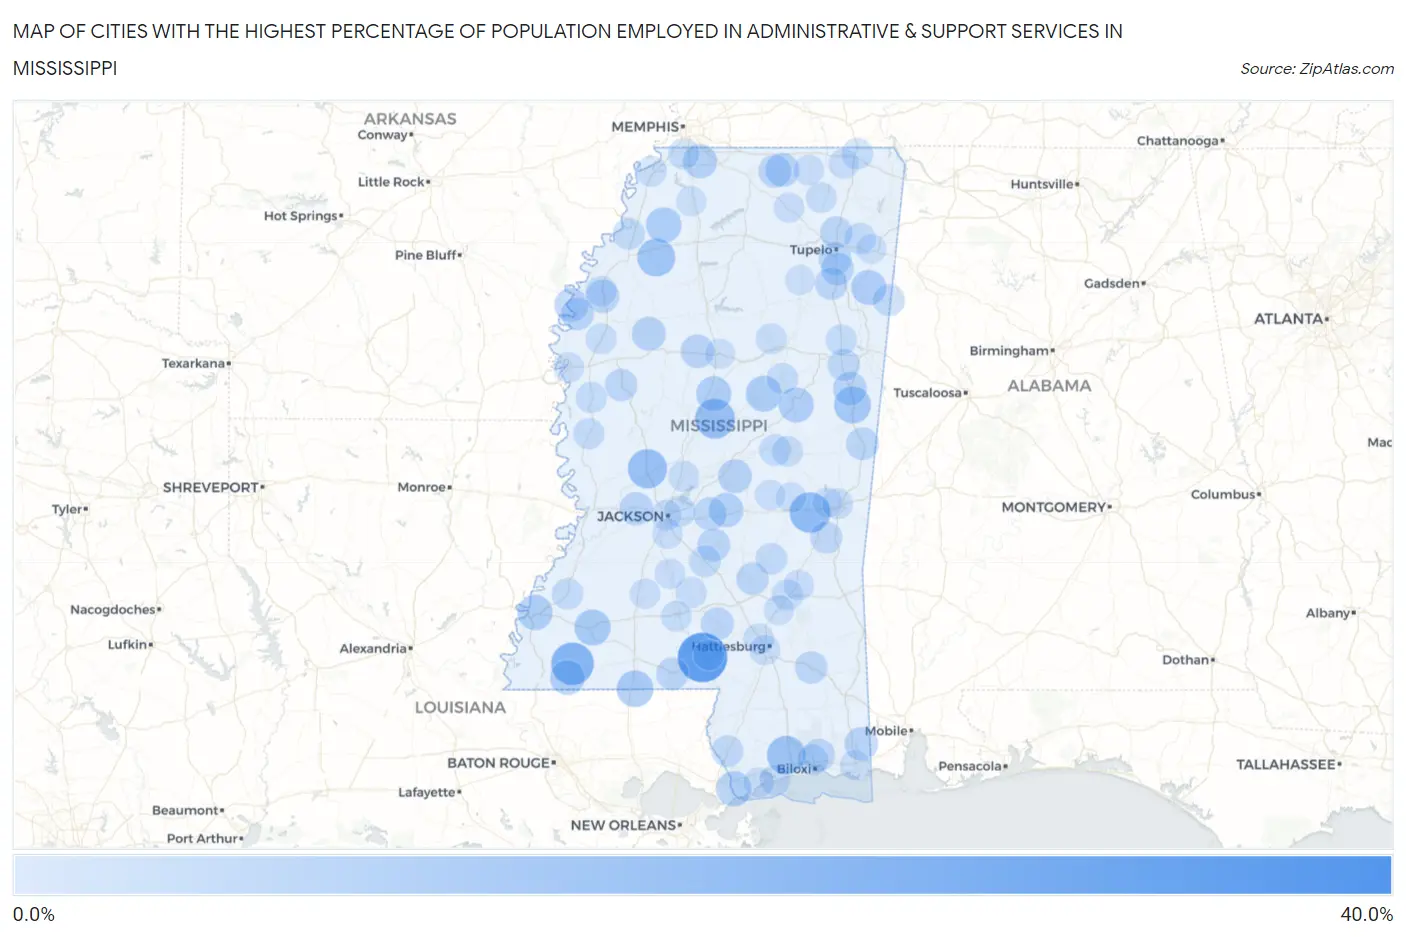
Cities with the Highest Percentage of Population Employed in Administrative & Support Services in Mississippi
| City | % Employed | vs State | vs National | |
| 1. | Kirkville | 32.4% | 3.4%(+28.9)#1 | 4.1%(+28.2)#151 |
| 2. | Bogue Chitto Cdp Kemper And Neshoba Counties | 31.9% | 3.4%(+28.5)#2 | 4.1%(+27.7)#161 |
| 3. | Foxworth | 27.7% | 3.4%(+24.3)#3 | 4.1%(+23.5)#228 |
| 4. | Redwood | 26.1% | 3.4%(+22.7)#4 | 4.1%(+21.9)#259 |
| 5. | Gloster | 19.3% | 3.4%(+15.9)#5 | 4.1%(+15.1)#474 |
| 6. | Chunky | 16.8% | 3.4%(+13.4)#6 | 4.1%(+12.7)#624 |
| 7. | Sallis | 15.8% | 3.4%(+12.4)#7 | 4.1%(+11.6)#699 |
| 8. | Bentonia | 15.0% | 3.4%(+11.6)#8 | 4.1%(+10.9)#785 |
| 9. | Lyman | 14.3% | 3.4%(+10.8)#9 | 4.1%(+10.1)#910 |
| 10. | Lambert | 13.6% | 3.4%(+10.2)#10 | 4.1%(+9.41)#1,026 |
| 11. | Macon | 12.4% | 3.4%(+9.01)#11 | 4.1%(+8.26)#1,225 |
| 12. | Osyka | 12.0% | 3.4%(+8.60)#12 | 4.1%(+7.85)#1,310 |
| 13. | Bude | 11.5% | 3.4%(+8.10)#13 | 4.1%(+7.36)#1,422 |
| 14. | Mccool | 11.1% | 3.4%(+7.71)#14 | 4.1%(+6.96)#1,520 |
| 15. | Sledge | 10.6% | 3.4%(+7.21)#15 | 4.1%(+6.46)#1,661 |
| 16. | Pearlington | 10.6% | 3.4%(+7.21)#16 | 4.1%(+6.46)#1,664 |
| 17. | Morgantown | 10.4% | 3.4%(+6.96)#17 | 4.1%(+6.21)#1,755 |
| 18. | West | 10.3% | 3.4%(+6.85)#18 | 4.1%(+6.11)#1,796 |
| 19. | Louisville | 10.2% | 3.4%(+6.80)#19 | 4.1%(+6.06)#1,813 |
| 20. | Hatley | 10.2% | 3.4%(+6.76)#20 | 4.1%(+6.01)#1,831 |
| 21. | Centreville | 9.9% | 3.4%(+6.49)#21 | 4.1%(+5.74)#1,953 |
| 22. | Morton | 9.5% | 3.4%(+6.10)#22 | 4.1%(+5.35)#2,123 |
| 23. | Bridgetown | 9.1% | 3.4%(+5.72)#23 | 4.1%(+4.97)#2,303 |
| 24. | Schlater | 8.9% | 3.4%(+5.48)#24 | 4.1%(+4.74)#2,442 |
| 25. | Lena | 8.8% | 3.4%(+5.37)#25 | 4.1%(+4.62)#2,511 |
| 26. | Ashland | 8.8% | 3.4%(+5.35)#26 | 4.1%(+4.61)#2,520 |
| 27. | Rosedale | 8.7% | 3.4%(+5.30)#27 | 4.1%(+4.56)#2,547 |
| 28. | Brooksville | 8.6% | 3.4%(+5.17)#28 | 4.1%(+4.42)#2,631 |
| 29. | North Carrollton | 8.4% | 3.4%(+4.99)#29 | 4.1%(+4.25)#2,738 |
| 30. | Winstonville | 8.3% | 3.4%(+4.93)#30 | 4.1%(+4.18)#2,795 |
| 31. | Bolton | 8.3% | 3.4%(+4.85)#31 | 4.1%(+4.11)#2,829 |
| 32. | Big Point | 8.2% | 3.4%(+4.82)#32 | 4.1%(+4.07)#2,852 |
| 33. | Pelahatchie | 8.0% | 3.4%(+4.56)#33 | 4.1%(+3.81)#3,018 |
| 34. | Snow Lake Shores | 7.9% | 3.4%(+4.45)#34 | 4.1%(+3.71)#3,108 |
| 35. | Puckett | 7.8% | 3.4%(+4.38)#35 | 4.1%(+3.63)#3,154 |
| 36. | Scooba | 7.6% | 3.4%(+4.23)#36 | 4.1%(+3.49)#3,277 |
| 37. | Bassfield | 7.6% | 3.4%(+4.20)#37 | 4.1%(+3.46)#3,299 |
| 38. | Beulah | 7.5% | 3.4%(+4.14)#38 | 4.1%(+3.40)#3,341 |
| 39. | Verona | 7.5% | 3.4%(+4.13)#39 | 4.1%(+3.39)#3,356 |
| 40. | Shannon | 7.5% | 3.4%(+4.13)#40 | 4.1%(+3.39)#3,357 |
| 41. | Tylertown | 7.5% | 3.4%(+4.05)#41 | 4.1%(+3.31)#3,441 |
| 42. | Latimer | 7.2% | 3.4%(+3.82)#42 | 4.1%(+3.07)#3,665 |
| 43. | Beaumont | 7.2% | 3.4%(+3.81)#43 | 4.1%(+3.06)#3,672 |
| 44. | Taylorsville | 7.2% | 3.4%(+3.77)#44 | 4.1%(+3.02)#3,709 |
| 45. | Okolona | 7.2% | 3.4%(+3.75)#45 | 4.1%(+3.00)#3,731 |
| 46. | Isola | 7.1% | 3.4%(+3.74)#46 | 4.1%(+2.99)#3,739 |
| 47. | Saltillo | 7.1% | 3.4%(+3.69)#47 | 4.1%(+2.95)#3,798 |
| 48. | Artesia | 7.0% | 3.4%(+3.63)#48 | 4.1%(+2.88)#3,882 |
| 49. | Stonewall | 6.8% | 3.4%(+3.41)#49 | 4.1%(+2.66)#4,083 |
| 50. | Gattman | 6.7% | 3.4%(+3.26)#50 | 4.1%(+2.52)#4,239 |
| 51. | Picayune | 6.6% | 3.4%(+3.22)#51 | 4.1%(+2.47)#4,291 |
| 52. | Mendenhall | 6.5% | 3.4%(+3.13)#52 | 4.1%(+2.38)#4,395 |
| 53. | Coahoma | 6.5% | 3.4%(+3.05)#53 | 4.1%(+2.30)#4,505 |
| 54. | Bay Springs | 6.3% | 3.4%(+2.88)#54 | 4.1%(+2.14)#4,716 |
| 55. | Mantachie | 6.3% | 3.4%(+2.87)#55 | 4.1%(+2.13)#4,729 |
| 56. | Fayette | 6.1% | 3.4%(+2.69)#56 | 4.1%(+1.94)#4,992 |
| 57. | Pearl River | 6.0% | 3.4%(+2.61)#57 | 4.1%(+1.87)#5,119 |
| 58. | Corinth | 6.0% | 3.4%(+2.57)#58 | 4.1%(+1.82)#5,188 |
| 59. | D Iberville | 6.0% | 3.4%(+2.55)#59 | 4.1%(+1.80)#5,234 |
| 60. | Eudora | 5.9% | 3.4%(+2.53)#60 | 4.1%(+1.79)#5,254 |
| 61. | Ackerman | 5.9% | 3.4%(+2.51)#61 | 4.1%(+1.77)#5,284 |
| 62. | Rolling Fork | 5.9% | 3.4%(+2.47)#62 | 4.1%(+1.73)#5,350 |
| 63. | Horn Lake | 5.8% | 3.4%(+2.44)#63 | 4.1%(+1.69)#5,389 |
| 64. | Flowood | 5.8% | 3.4%(+2.43)#64 | 4.1%(+1.69)#5,396 |
| 65. | Hollandale | 5.7% | 3.4%(+2.31)#65 | 4.1%(+1.56)#5,610 |
| 66. | Laurel | 5.7% | 3.4%(+2.30)#66 | 4.1%(+1.56)#5,612 |
| 67. | West Point | 5.7% | 3.4%(+2.26)#67 | 4.1%(+1.52)#5,683 |
| 68. | Canton | 5.6% | 3.4%(+2.20)#68 | 4.1%(+1.46)#5,787 |
| 69. | Walthall | 5.6% | 3.4%(+2.15)#69 | 4.1%(+1.41)#5,892 |
| 70. | Philadelphia | 5.5% | 3.4%(+2.12)#70 | 4.1%(+1.38)#5,946 |
| 71. | New Hebron | 5.5% | 3.4%(+2.12)#71 | 4.1%(+1.38)#5,954 |
| 72. | Shaw | 5.5% | 3.4%(+2.07)#72 | 4.1%(+1.32)#6,060 |
| 73. | Meridian | 5.4% | 3.4%(+1.96)#73 | 4.1%(+1.22)#6,248 |
| 74. | Shelby | 5.3% | 3.4%(+1.94)#74 | 4.1%(+1.20)#6,291 |
| 75. | Rawls Springs | 5.3% | 3.4%(+1.92)#75 | 4.1%(+1.18)#6,332 |
| 76. | Pass Christian | 5.3% | 3.4%(+1.91)#76 | 4.1%(+1.17)#6,352 |
| 77. | Columbia | 5.3% | 3.4%(+1.90)#77 | 4.1%(+1.16)#6,378 |
| 78. | Tunica Resorts | 5.2% | 3.4%(+1.84)#78 | 4.1%(+1.09)#6,534 |
| 79. | Monticello | 5.2% | 3.4%(+1.80)#79 | 4.1%(+1.06)#6,603 |
| 80. | Dumas | 5.2% | 3.4%(+1.79)#80 | 4.1%(+1.04)#6,628 |
| 81. | Sandersville | 5.1% | 3.4%(+1.74)#81 | 4.1%(+0.997)#6,719 |
| 82. | Greenville | 5.1% | 3.4%(+1.74)#82 | 4.1%(+0.997)#6,723 |
| 83. | Decatur | 5.1% | 3.4%(+1.74)#83 | 4.1%(+0.990)#6,736 |
| 84. | Hattiesburg | 5.0% | 3.4%(+1.62)#84 | 4.1%(+0.880)#6,975 |
| 85. | Falkner | 5.0% | 3.4%(+1.62)#85 | 4.1%(+0.871)#7,004 |
| 86. | Jackson | 5.0% | 3.4%(+1.61)#86 | 4.1%(+0.863)#7,020 |
| 87. | Georgetown | 5.0% | 3.4%(+1.60)#87 | 4.1%(+0.850)#7,060 |
| 88. | Waveland | 5.0% | 3.4%(+1.56)#88 | 4.1%(+0.812)#7,141 |
| 89. | Beauregard | 4.9% | 3.4%(+1.54)#89 | 4.1%(+0.795)#7,172 |
| 90. | Myrtle | 4.9% | 3.4%(+1.53)#90 | 4.1%(+0.782)#7,208 |
| 91. | Cleary | 4.9% | 3.4%(+1.52)#91 | 4.1%(+0.777)#7,219 |
| 92. | Kossuth | 4.8% | 3.4%(+1.43)#92 | 4.1%(+0.689)#7,424 |
| 93. | Moss Point | 4.8% | 3.4%(+1.38)#93 | 4.1%(+0.636)#7,556 |
| 94. | Conehatta | 4.7% | 3.4%(+1.34)#94 | 4.1%(+0.599)#7,659 |
| 95. | Winona | 4.7% | 3.4%(+1.28)#95 | 4.1%(+0.538)#7,808 |
| 96. | Senatobia | 4.6% | 3.4%(+1.24)#96 | 4.1%(+0.492)#7,937 |
| 97. | New Houlka | 4.6% | 3.4%(+1.18)#97 | 4.1%(+0.437)#8,066 |
| 98. | Nellieburg | 4.6% | 3.4%(+1.18)#98 | 4.1%(+0.434)#8,075 |
| 99. | Ellisville | 4.5% | 3.4%(+1.08)#99 | 4.1%(+0.336)#8,336 |
| 100. | Fulton | 4.5% | 3.4%(+1.08)#100 | 4.1%(+0.336)#8,337 |
Common Questions
What are the Top 10 Cities with the Highest Percentage of Population Employed in Administrative & Support Services in Mississippi?
Top 10 Cities with the Highest Percentage of Population Employed in Administrative & Support Services in Mississippi are:
What city has the Highest Percentage of Population Employed in Administrative & Support Services in Mississippi?
Foxworth has the Highest Percentage of Population Employed in Administrative & Support Services in Mississippi with 27.7%.
What is the Percentage of Population Employed in Administrative & Support Services in the State of Mississippi?
Percentage of Population Employed in Administrative & Support Services in Mississippi is 3.4%.
What is the Percentage of Population Employed in Administrative & Support Services in the United States?
Percentage of Population Employed in Administrative & Support Services in the United States is 4.1%.