Mapleton borough, PA Map & Demographics
Mapleton borough Overview
$24,137
PER CAPITA INCOME
$61,250
AVG FAMILY INCOME
$51,250
AVG HOUSEHOLD INCOME
10.2%
WAGE / INCOME GAP [ % ]
89.8¢/ $1
WAGE / INCOME GAP [ $ ]
0.35
INEQUALITY / GINI INDEX
361
TOTAL POPULATION
182
MALE POPULATION
179
FEMALE POPULATION
101.68
MALES / 100 FEMALES
98.35
FEMALES / 100 MALES
29.9
MEDIAN AGE
3.6
AVG FAMILY SIZE
2.9
AVG HOUSEHOLD SIZE
191
LABOR FORCE [ PEOPLE ]
69.7%
PERCENT IN LABOR FORCE
7.3%
UNEMPLOYMENT RATE
Income in Mapleton borough
Income Overview in Mapleton borough
Per Capita Income in Mapleton borough is $24,137, while median incomes of families and households are $61,250 and $51,250 respectively.
| Characteristic | Number | Measure |
| Per Capita Income | 361 | $24,137 |
| Median Family Income | 82 | $61,250 |
| Mean Family Income | 82 | $68,787 |
| Median Household Income | 126 | $51,250 |
| Mean Household Income | 126 | $62,104 |
| Income Deficit | 82 | $0 |
| Wage / Income Gap (%) | 361 | 10.20% |
| Wage / Income Gap ($) | 361 | 89.80¢ per $1 |
| Gini / Inequality Index | 361 | 0.35 |
Earnings by Sex in Mapleton borough
Average Earnings in Mapleton borough are $38,487, $39,375 for men and $35,357 for women, a difference of 10.2%.
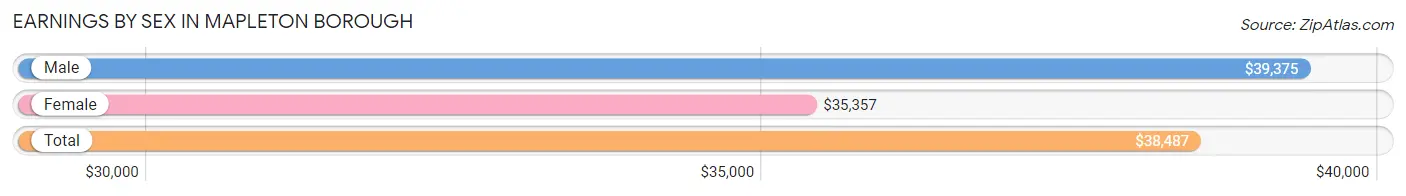
| Sex | Number | Average Earnings |
| Male | 91 (49.2%) | $39,375 |
| Female | 94 (50.8%) | $35,357 |
| Total | 185 (100.0%) | $38,487 |
Earnings by Sex by Income Bracket in Mapleton borough
The most common earnings brackets in Mapleton borough are $35,000 to $39,999 for men (18 | 19.8%) and $55,000 to $64,999 for women (18 | 19.2%).
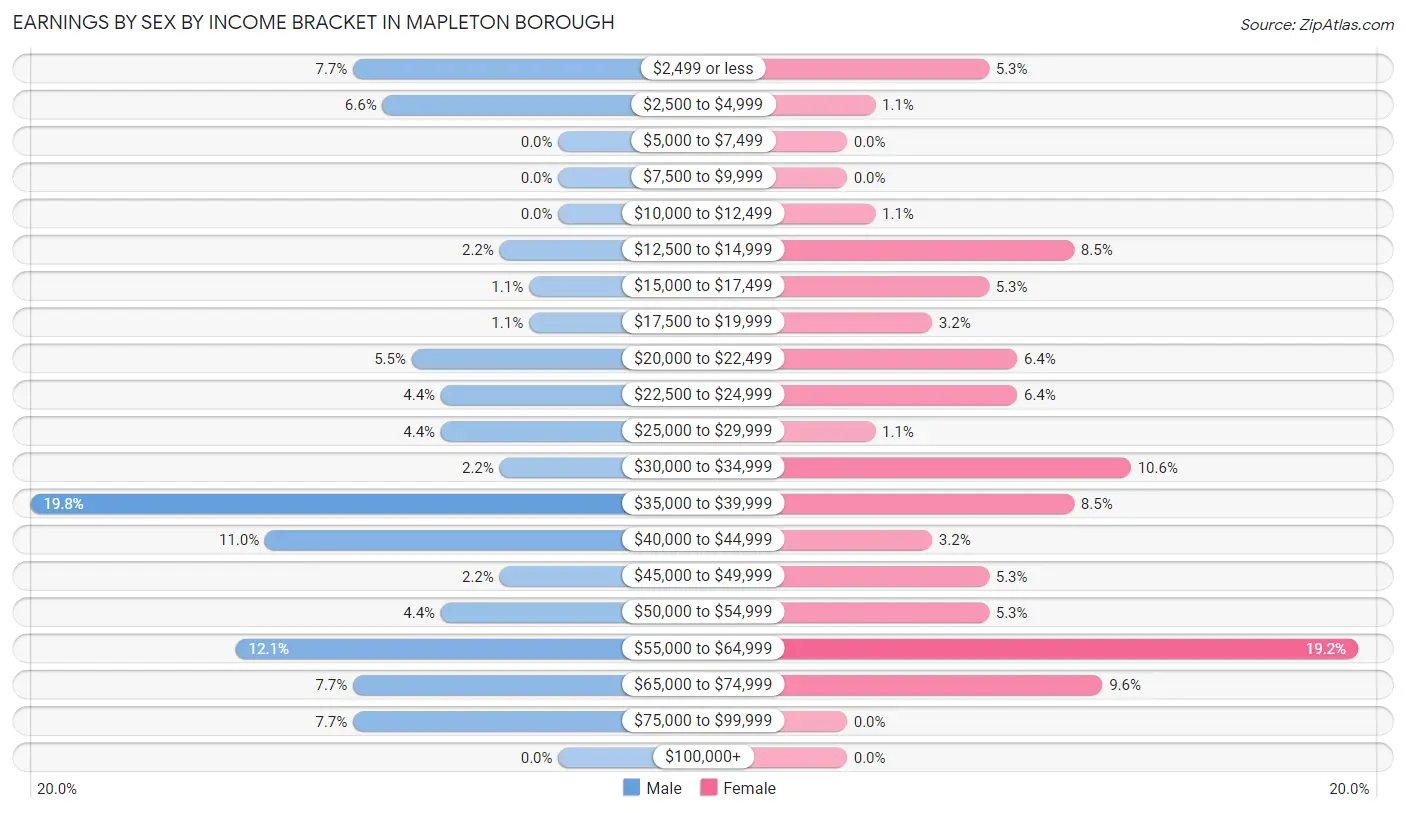
| Income | Male | Female |
| $2,499 or less | 7 (7.7%) | 5 (5.3%) |
| $2,500 to $4,999 | 6 (6.6%) | 1 (1.1%) |
| $5,000 to $7,499 | 0 (0.0%) | 0 (0.0%) |
| $7,500 to $9,999 | 0 (0.0%) | 0 (0.0%) |
| $10,000 to $12,499 | 0 (0.0%) | 1 (1.1%) |
| $12,500 to $14,999 | 2 (2.2%) | 8 (8.5%) |
| $15,000 to $17,499 | 1 (1.1%) | 5 (5.3%) |
| $17,500 to $19,999 | 1 (1.1%) | 3 (3.2%) |
| $20,000 to $22,499 | 5 (5.5%) | 6 (6.4%) |
| $22,500 to $24,999 | 4 (4.4%) | 6 (6.4%) |
| $25,000 to $29,999 | 4 (4.4%) | 1 (1.1%) |
| $30,000 to $34,999 | 2 (2.2%) | 10 (10.6%) |
| $35,000 to $39,999 | 18 (19.8%) | 8 (8.5%) |
| $40,000 to $44,999 | 10 (11.0%) | 3 (3.2%) |
| $45,000 to $49,999 | 2 (2.2%) | 5 (5.3%) |
| $50,000 to $54,999 | 4 (4.4%) | 5 (5.3%) |
| $55,000 to $64,999 | 11 (12.1%) | 18 (19.2%) |
| $65,000 to $74,999 | 7 (7.7%) | 9 (9.6%) |
| $75,000 to $99,999 | 7 (7.7%) | 0 (0.0%) |
| $100,000+ | 0 (0.0%) | 0 (0.0%) |
| Total | 91 (100.0%) | 94 (100.0%) |
Earnings by Sex by Educational Attainment in Mapleton borough
Average earnings in Mapleton borough are $39,653 for men and $36,071 for women, a difference of 9.0%. Men with an educational attainment of high school diploma enjoy the highest average annual earnings of $39,167, while those with high school diploma education earn the least with $39,167. Women with an educational attainment of college or associate's degree earn the most with the average annual earnings of $56,607, while those with high school diploma education have the smallest earnings of $34,583.
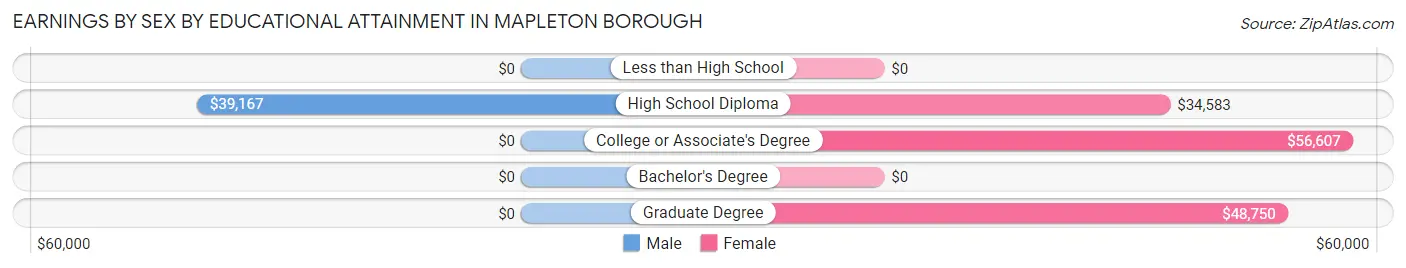
| Educational Attainment | Male Income | Female Income |
| Less than High School | - | - |
| High School Diploma | $39,167 | $34,583 |
| College or Associate's Degree | - | - |
| Bachelor's Degree | - | - |
| Graduate Degree | - | - |
| Total | $39,653 | $36,071 |
Family Income in Mapleton borough
Family Income Brackets in Mapleton borough
According to the Mapleton borough family income data, there are 24 families falling into the $35,000 to $49,999 income range, which is the most common income bracket and makes up 29.3% of all families.
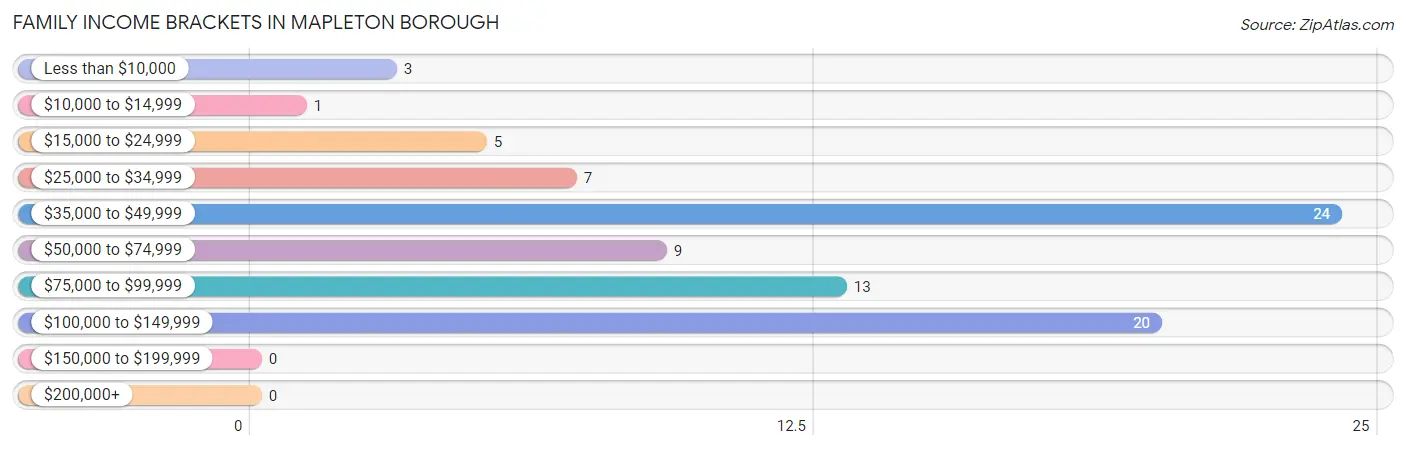
| Income Bracket | # Families | % Families |
| Less than $10,000 | 3 | 3.7% |
| $10,000 to $14,999 | 1 | 1.2% |
| $15,000 to $24,999 | 5 | 6.1% |
| $25,000 to $34,999 | 7 | 8.5% |
| $35,000 to $49,999 | 24 | 29.3% |
| $50,000 to $74,999 | 9 | 11.0% |
| $75,000 to $99,999 | 13 | 15.9% |
| $100,000 to $149,999 | 20 | 24.4% |
| $150,000 to $199,999 | 0 | 0.0% |
| $200,000+ | 0 | 0.0% |
Family Income by Famaliy Size in Mapleton borough
3-person families (14 | 17.1%) account for the highest median family income in Mapleton borough with $115,000 per family, while 3-person families (14 | 17.1%) have the highest median income of $38,333 per family member.
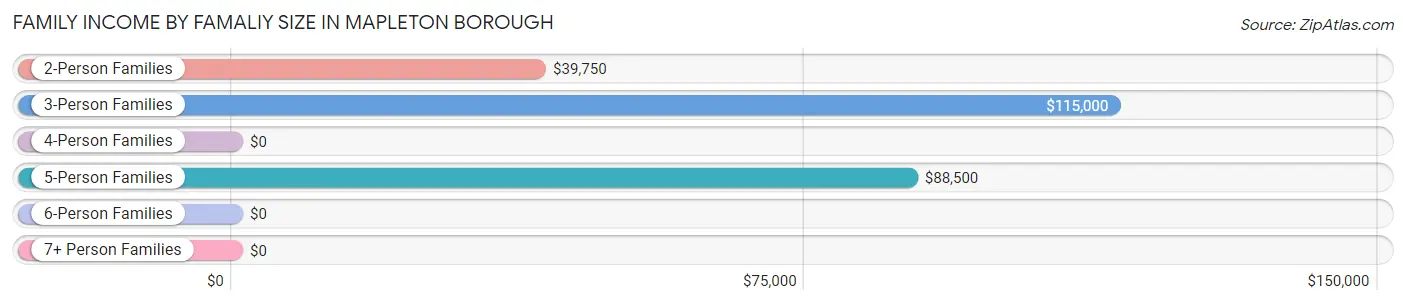
| Income Bracket | # Families | Median Income |
| 2-Person Families | 37 (45.1%) | $39,750 |
| 3-Person Families | 14 (17.1%) | $115,000 |
| 4-Person Families | 15 (18.3%) | $0 |
| 5-Person Families | 14 (17.1%) | $88,500 |
| 6-Person Families | 0 (0.0%) | $0 |
| 7+ Person Families | 2 (2.4%) | $0 |
| Total | 82 (100.0%) | $61,250 |
Family Income by Number of Earners in Mapleton borough
The median family income in Mapleton borough is $61,250, with families comprising 3+ earners (9) having the highest median family income of $147,750, while families with no earners (15) have the lowest median family income of $28,125, accounting for 11.0% and 18.3% of families, respectively.
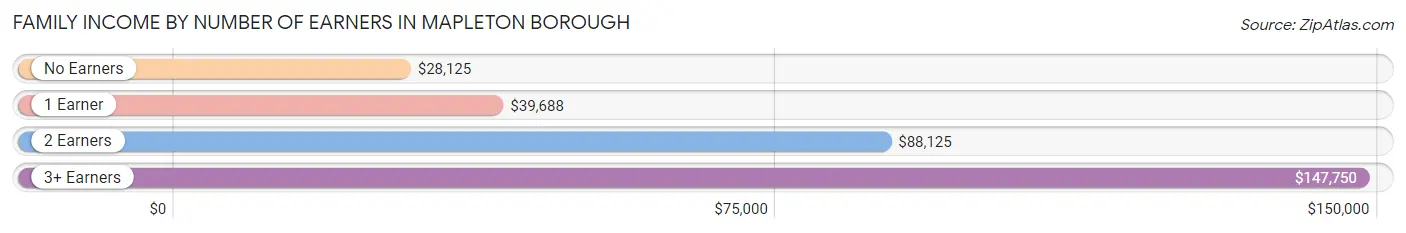
| Number of Earners | # Families | Median Income |
| No Earners | 15 (18.3%) | $28,125 |
| 1 Earner | 21 (25.6%) | $39,688 |
| 2 Earners | 37 (45.1%) | $88,125 |
| 3+ Earners | 9 (11.0%) | $147,750 |
| Total | 82 (100.0%) | $61,250 |
Household Income in Mapleton borough
Household Income Brackets in Mapleton borough
With 29 households falling in the category, the $35,000 to $49,999 income range is the most frequent in Mapleton borough, accounting for 23.0% of all households.
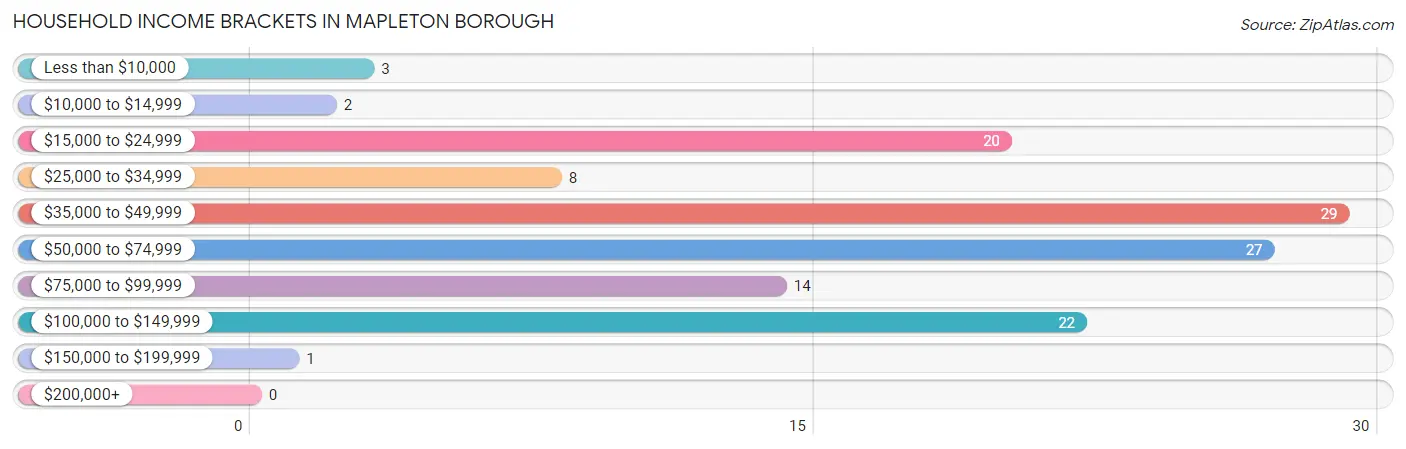
| Income Bracket | # Households | % Households |
| Less than $10,000 | 3 | 2.4% |
| $10,000 to $14,999 | 2 | 1.6% |
| $15,000 to $24,999 | 20 | 15.9% |
| $25,000 to $34,999 | 8 | 6.3% |
| $35,000 to $49,999 | 29 | 23.0% |
| $50,000 to $74,999 | 27 | 21.4% |
| $75,000 to $99,999 | 14 | 11.1% |
| $100,000 to $149,999 | 22 | 17.5% |
| $150,000 to $199,999 | 1 | 0.8% |
| $200,000+ | 0 | 0.0% |
Household Income by Householder Age in Mapleton borough
The median household income in Mapleton borough is $51,250, with the highest median household income of $74,063 found in the 25 to 44 years age bracket for the primary householder. A total of 39 households (30.9%) fall into this category. Meanwhile, the 15 to 24 years age bracket for the primary householder has the lowest median household income of $0, with 6 households (4.8%) in this group.
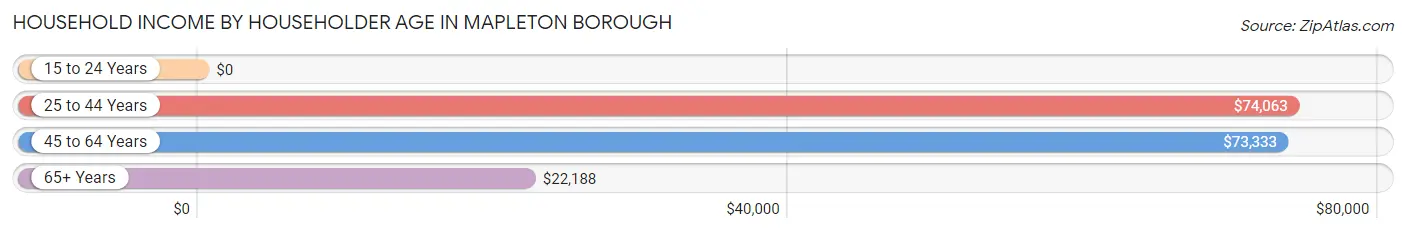
| Income Bracket | # Households | Median Income |
| 15 to 24 Years | 6 (4.8%) | $0 |
| 25 to 44 Years | 39 (30.9%) | $74,063 |
| 45 to 64 Years | 50 (39.7%) | $73,333 |
| 65+ Years | 31 (24.6%) | $22,188 |
| Total | 126 (100.0%) | $51,250 |
Poverty in Mapleton borough
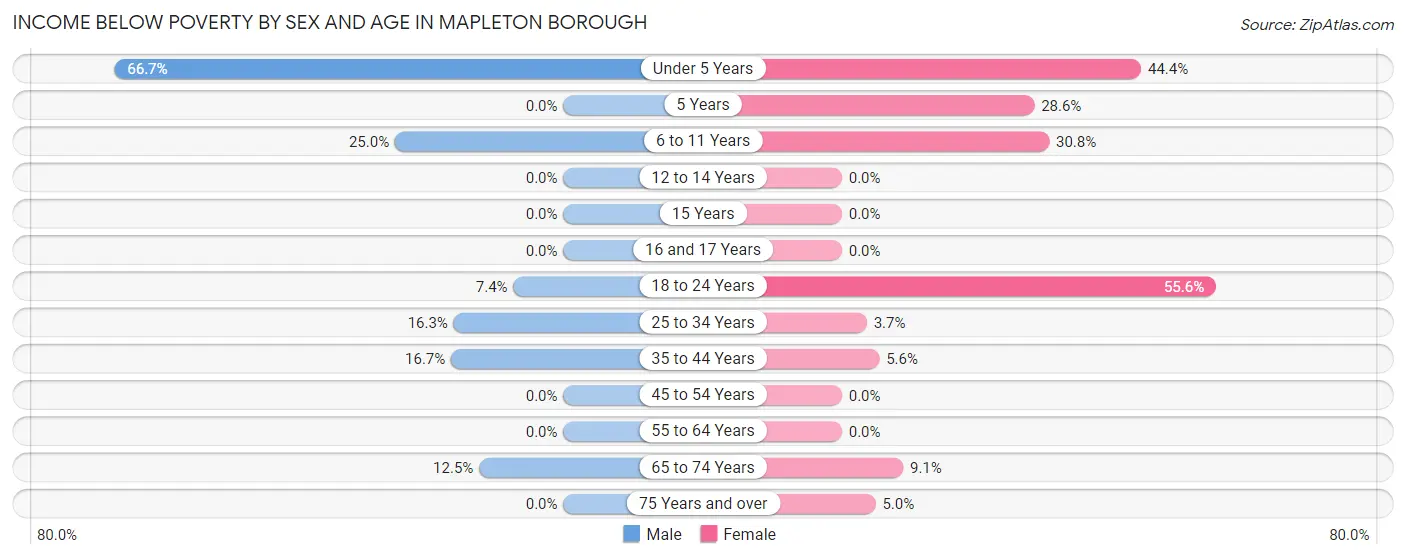
Income Below Poverty by Sex and Age in Mapleton borough
With 12.3% poverty level for males and 12.9% for females among the residents of Mapleton borough, under 5 year old males and 18 to 24 year old females are the most vulnerable to poverty, with 8 males (66.7%) and 5 females (55.6%) in their respective age groups living below the poverty level.
| Age Bracket | Male | Female |
| Under 5 Years | 8 (66.7%) | 8 (44.4%) |
| 5 Years | 0 (0.0%) | 2 (28.6%) |
| 6 to 11 Years | 2 (25.0%) | 4 (30.8%) |
| 12 to 14 Years | 0 (0.0%) | 0 (0.0%) |
| 15 Years | 0 (0.0%) | 0 (0.0%) |
| 16 and 17 Years | 0 (0.0%) | 0 (0.0%) |
| 18 to 24 Years | 2 (7.4%) | 5 (55.6%) |
| 25 to 34 Years | 7 (16.3%) | 1 (3.7%) |
| 35 to 44 Years | 2 (16.7%) | 1 (5.6%) |
| 45 to 54 Years | 0 (0.0%) | 0 (0.0%) |
| 55 to 64 Years | 0 (0.0%) | 0 (0.0%) |
| 65 to 74 Years | 1 (12.5%) | 1 (9.1%) |
| 75 Years and over | 0 (0.0%) | 1 (5.0%) |
| Total | 22 (12.3%) | 23 (12.9%) |
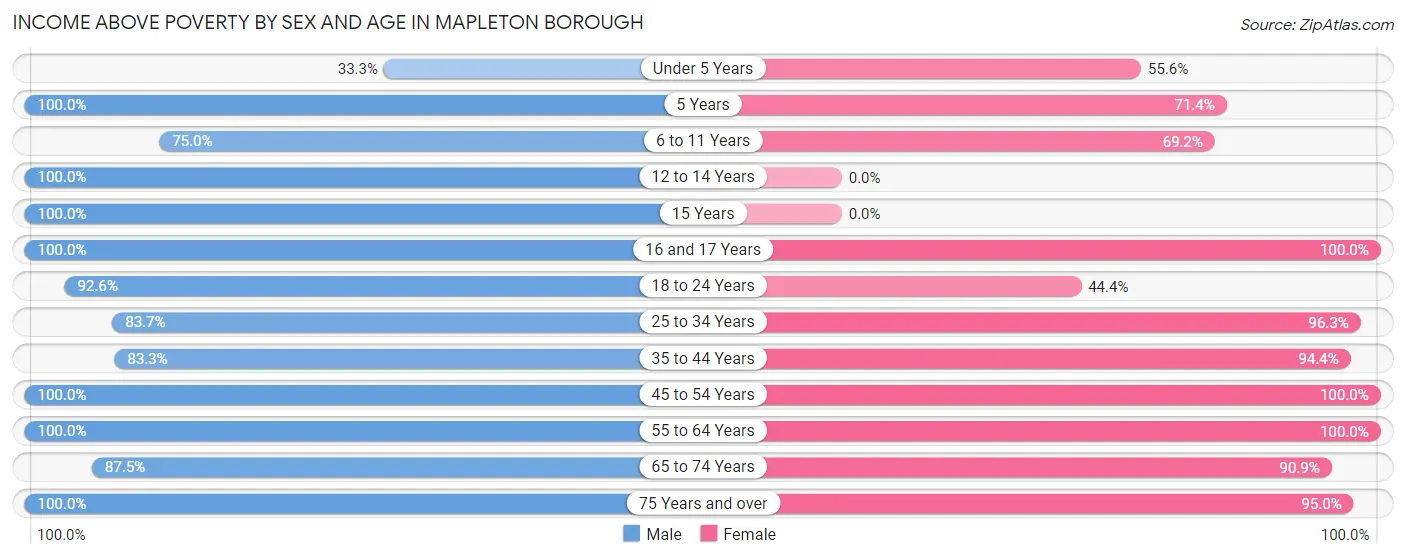
Income Above Poverty by Sex and Age in Mapleton borough
According to the poverty statistics in Mapleton borough, males aged 5 years and females aged 16 and 17 years are the age groups that are most secure financially, with 100.0% of males and 100.0% of females in these age groups living above the poverty line.
| Age Bracket | Male | Female |
| Under 5 Years | 4 (33.3%) | 10 (55.6%) |
| 5 Years | 10 (100.0%) | 5 (71.4%) |
| 6 to 11 Years | 6 (75.0%) | 9 (69.2%) |
| 12 to 14 Years | 5 (100.0%) | 0 (0.0%) |
| 15 Years | 11 (100.0%) | 0 (0.0%) |
| 16 and 17 Years | 4 (100.0%) | 4 (100.0%) |
| 18 to 24 Years | 25 (92.6%) | 4 (44.4%) |
| 25 to 34 Years | 36 (83.7%) | 26 (96.3%) |
| 35 to 44 Years | 10 (83.3%) | 17 (94.4%) |
| 45 to 54 Years | 12 (100.0%) | 20 (100.0%) |
| 55 to 64 Years | 19 (100.0%) | 32 (100.0%) |
| 65 to 74 Years | 7 (87.5%) | 10 (90.9%) |
| 75 Years and over | 8 (100.0%) | 19 (95.0%) |
| Total | 157 (87.7%) | 156 (87.2%) |
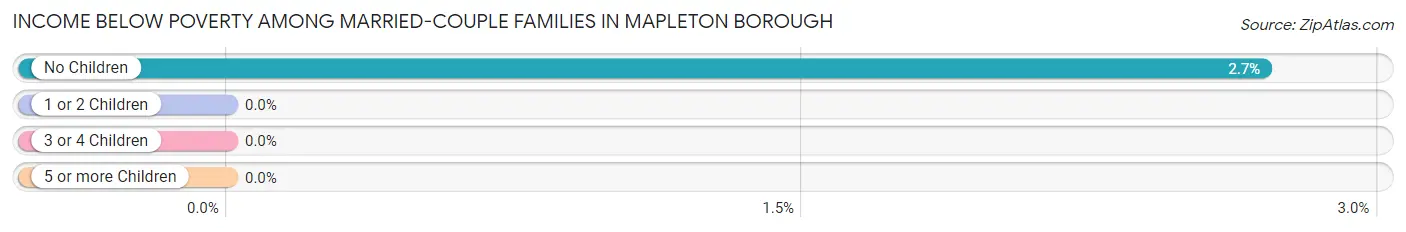
Income Below Poverty Among Married-Couple Families in Mapleton borough
The poverty statistics for married-couple families in Mapleton borough show that 1.6% or 1 of the total 61 families live below the poverty line. Families with no children have the highest poverty rate of 2.7%, comprising of 1 families. On the other hand, families with 1 or 2 children have the lowest poverty rate of 0.0%, which includes 0 families.
| Children | Above Poverty | Below Poverty |
| No Children | 36 (97.3%) | 1 (2.7%) |
| 1 or 2 Children | 17 (100.0%) | 0 (0.0%) |
| 3 or 4 Children | 7 (100.0%) | 0 (0.0%) |
| 5 or more Children | 0 (0.0%) | 0 (0.0%) |
| Total | 60 (98.4%) | 1 (1.6%) |
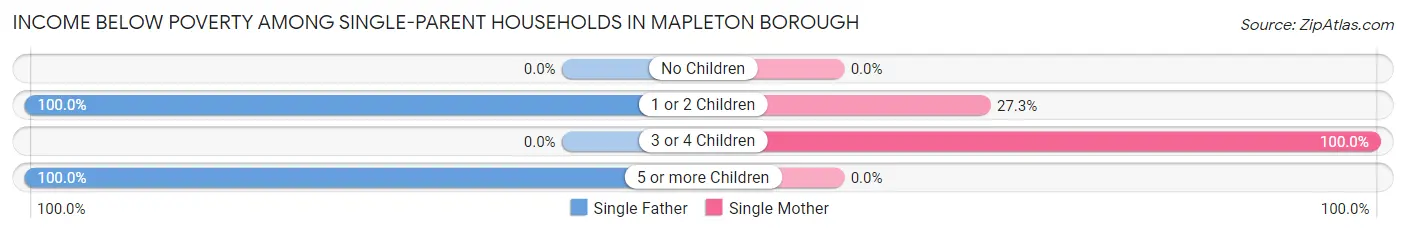
Income Below Poverty Among Single-Parent Households in Mapleton borough
According to the poverty data in Mapleton borough, 100.0% or 3 single-father households and 27.8% or 5 single-mother households are living below the poverty line. Among single-father households, those with 1 or 2 children have the highest poverty rate, with 1 households (100.0%) experiencing poverty. Likewise, among single-mother households, those with 3 or 4 children have the highest poverty rate, with 2 households (100.0%) falling below the poverty line.
| Children | Single Father | Single Mother |
| No Children | 0 (0.0%) | 0 (0.0%) |
| 1 or 2 Children | 1 (100.0%) | 3 (27.3%) |
| 3 or 4 Children | 0 (0.0%) | 2 (100.0%) |
| 5 or more Children | 2 (100.0%) | 0 (0.0%) |
| Total | 3 (100.0%) | 5 (27.8%) |
Income Below Poverty Among Married-Couple vs Single-Parent Households in Mapleton borough
The poverty data for Mapleton borough shows that 1 of the married-couple family households (1.6%) and 8 of the single-parent households (38.1%) are living below the poverty level. Within the married-couple family households, those with no children have the highest poverty rate, with 1 households (2.7%) falling below the poverty line. Among the single-parent households, those with 3 or 4 children have the highest poverty rate, with 2 household (100.0%) living below poverty.
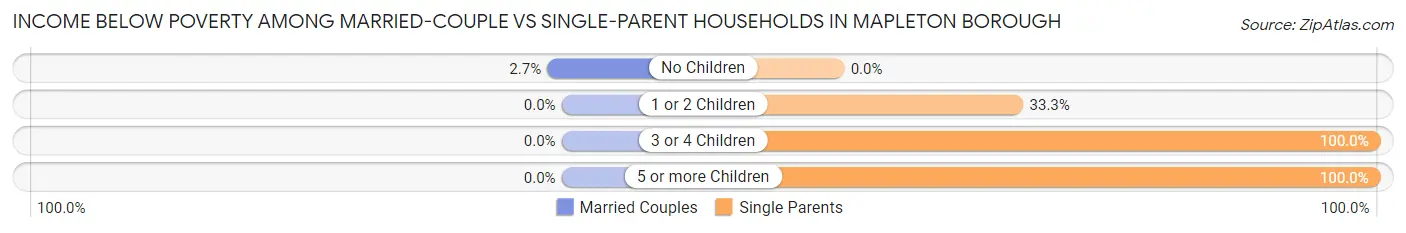
| Children | Married-Couple Families | Single-Parent Households |
| No Children | 1 (2.7%) | 0 (0.0%) |
| 1 or 2 Children | 0 (0.0%) | 4 (33.3%) |
| 3 or 4 Children | 0 (0.0%) | 2 (100.0%) |
| 5 or more Children | 0 (0.0%) | 2 (100.0%) |
| Total | 1 (1.6%) | 8 (38.1%) |
Race in Mapleton borough
The most populous races in Mapleton borough are White / Caucasian (325 | 90.0%), Two or more Races (33 | 9.1%), and Black / African American (3 | 0.8%).
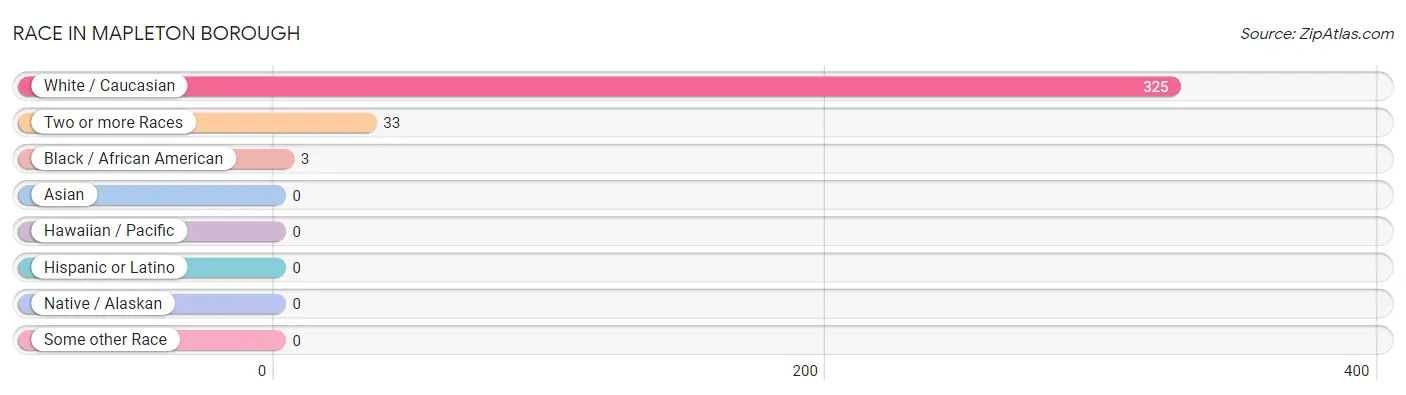
| Race | # Population | % Population |
| Asian | 0 | 0.0% |
| Black / African American | 3 | 0.8% |
| Hawaiian / Pacific | 0 | 0.0% |
| Hispanic or Latino | 0 | 0.0% |
| Native / Alaskan | 0 | 0.0% |
| White / Caucasian | 325 | 90.0% |
| Two or more Races | 33 | 9.1% |
| Some other Race | 0 | 0.0% |
| Total | 361 | 100.0% |
Ancestry in Mapleton borough
The most populous ancestries reported in Mapleton borough are German (125 | 34.6%), Irish (68 | 18.8%), American (15 | 4.2%), British (13 | 3.6%), and English (12 | 3.3%), together accounting for 64.5% of all Mapleton borough residents.
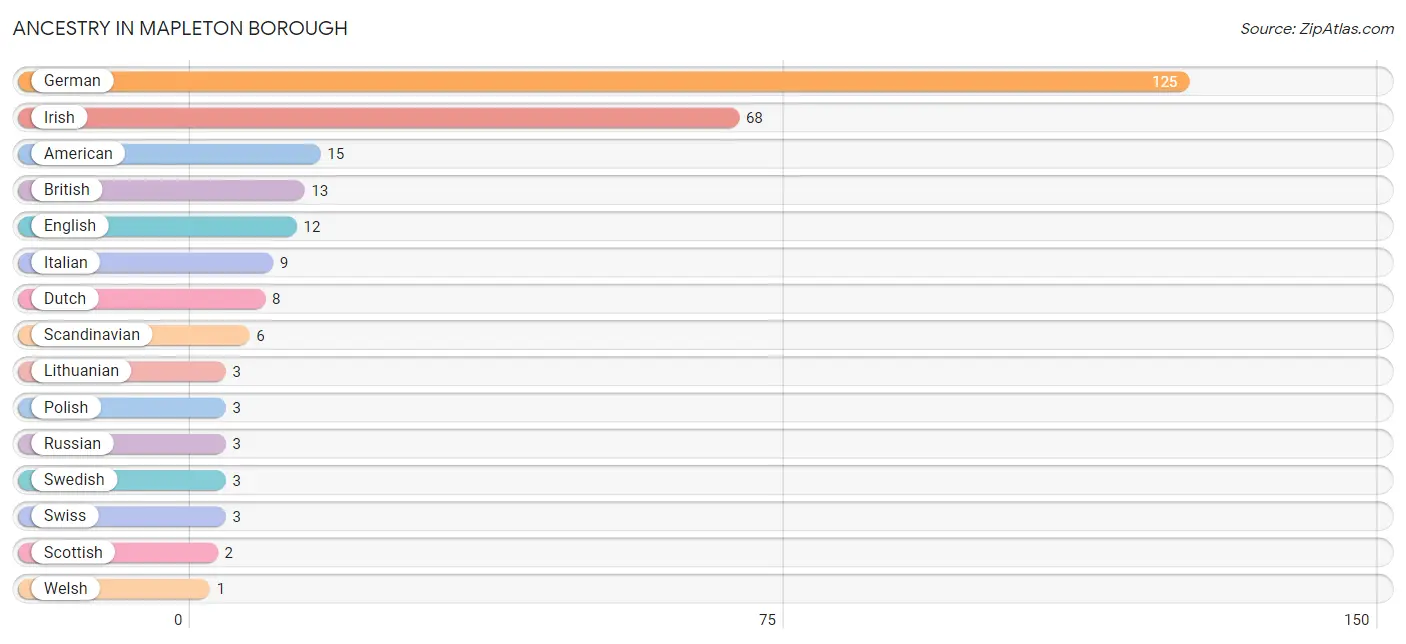
| Ancestry | # Population | % Population |
| American | 15 | 4.2% |
| British | 13 | 3.6% |
| Dutch | 8 | 2.2% |
| English | 12 | 3.3% |
| German | 125 | 34.6% |
| Irish | 68 | 18.8% |
| Italian | 9 | 2.5% |
| Lithuanian | 3 | 0.8% |
| Polish | 3 | 0.8% |
| Russian | 3 | 0.8% |
| Scandinavian | 6 | 1.7% |
| Scottish | 2 | 0.5% |
| Swedish | 3 | 0.8% |
| Swiss | 3 | 0.8% |
| Welsh | 1 | 0.3% | View All 15 Rows |
Immigrants in Mapleton borough

| Immigration Origin | # Population | % Population | View All 0 Rows |
Sex and Age in Mapleton borough
Sex and Age in Mapleton borough
The most populous age groups in Mapleton borough are 25 to 29 Years (34 | 18.7%) for men and 55 to 59 Years (23 | 12.9%) for women.
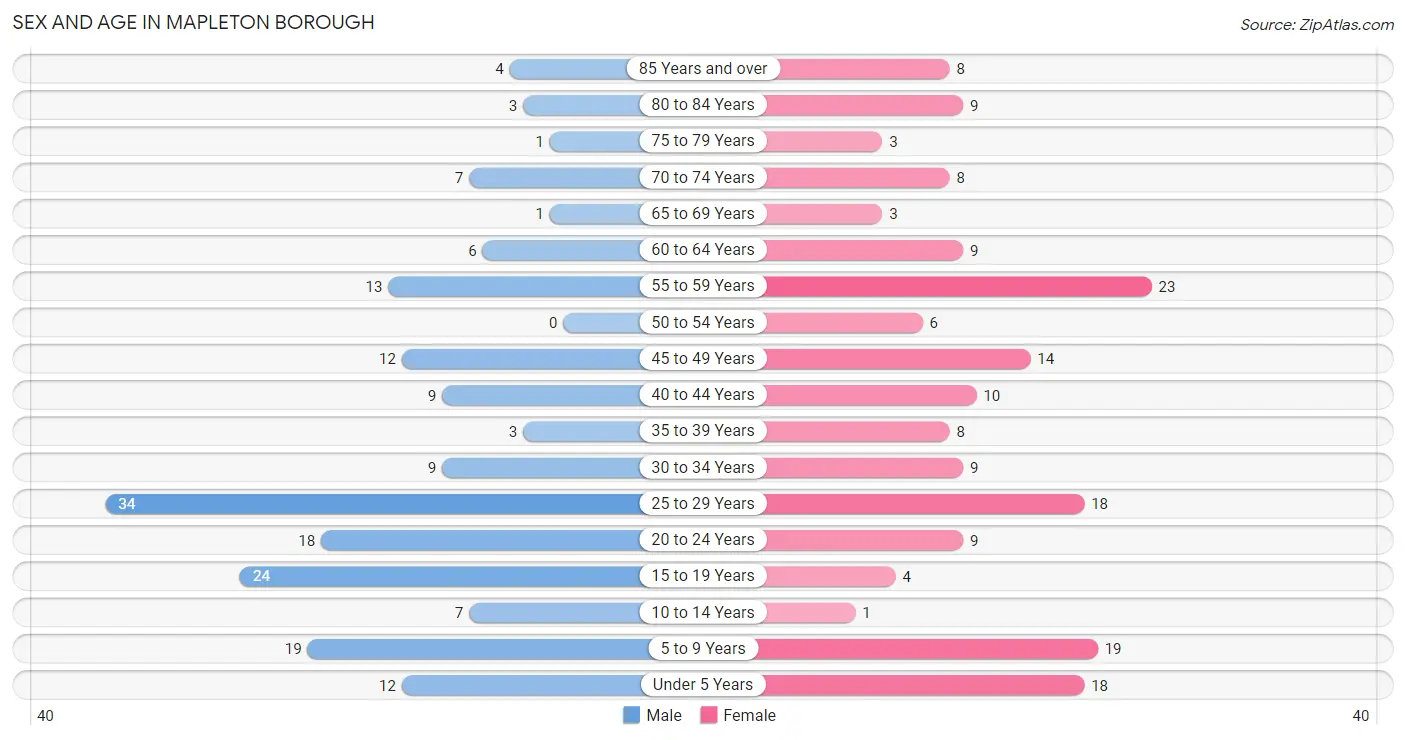
| Age Bracket | Male | Female |
| Under 5 Years | 12 (6.6%) | 18 (10.1%) |
| 5 to 9 Years | 19 (10.4%) | 19 (10.6%) |
| 10 to 14 Years | 7 (3.8%) | 1 (0.6%) |
| 15 to 19 Years | 24 (13.2%) | 4 (2.2%) |
| 20 to 24 Years | 18 (9.9%) | 9 (5.0%) |
| 25 to 29 Years | 34 (18.7%) | 18 (10.1%) |
| 30 to 34 Years | 9 (5.0%) | 9 (5.0%) |
| 35 to 39 Years | 3 (1.7%) | 8 (4.5%) |
| 40 to 44 Years | 9 (5.0%) | 10 (5.6%) |
| 45 to 49 Years | 12 (6.6%) | 14 (7.8%) |
| 50 to 54 Years | 0 (0.0%) | 6 (3.4%) |
| 55 to 59 Years | 13 (7.1%) | 23 (12.9%) |
| 60 to 64 Years | 6 (3.3%) | 9 (5.0%) |
| 65 to 69 Years | 1 (0.5%) | 3 (1.7%) |
| 70 to 74 Years | 7 (3.8%) | 8 (4.5%) |
| 75 to 79 Years | 1 (0.5%) | 3 (1.7%) |
| 80 to 84 Years | 3 (1.7%) | 9 (5.0%) |
| 85 Years and over | 4 (2.2%) | 8 (4.5%) |
| Total | 182 (100.0%) | 179 (100.0%) |
Families and Households in Mapleton borough
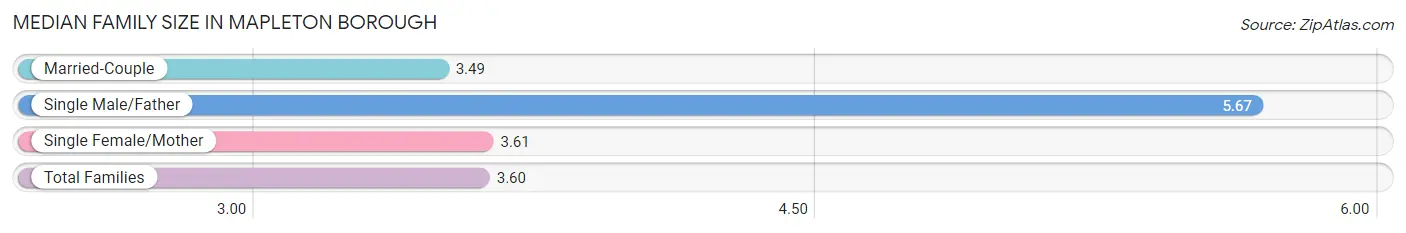
Median Family Size in Mapleton borough
The median family size in Mapleton borough is 3.60 persons per family, with single male/father families (3 | 3.7%) accounting for the largest median family size of 5.67 persons per family. On the other hand, married-couple families (61 | 74.4%) represent the smallest median family size with 3.49 persons per family.
| Family Type | # Families | Family Size |
| Married-Couple | 61 (74.4%) | 3.49 |
| Single Male/Father | 3 (3.7%) | 5.67 |
| Single Female/Mother | 18 (22.0%) | 3.61 |
| Total Families | 82 (100.0%) | 3.60 |
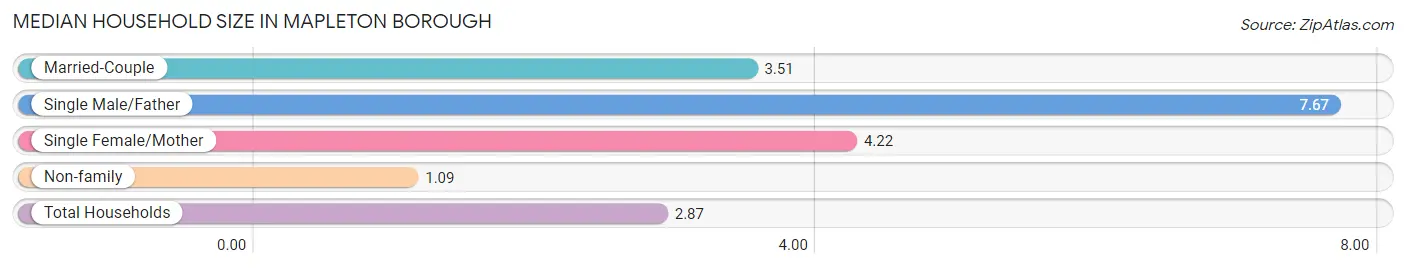
Median Household Size in Mapleton borough
The median household size in Mapleton borough is 2.87 persons per household, with single male/father households (3 | 2.4%) accounting for the largest median household size of 7.67 persons per household. non-family households (44 | 34.9%) represent the smallest median household size with 1.09 persons per household.
| Household Type | # Households | Household Size |
| Married-Couple | 61 (48.4%) | 3.51 |
| Single Male/Father | 3 (2.4%) | 7.67 |
| Single Female/Mother | 18 (14.3%) | 4.22 |
| Non-family | 44 (34.9%) | 1.09 |
| Total Households | 126 (100.0%) | 2.87 |
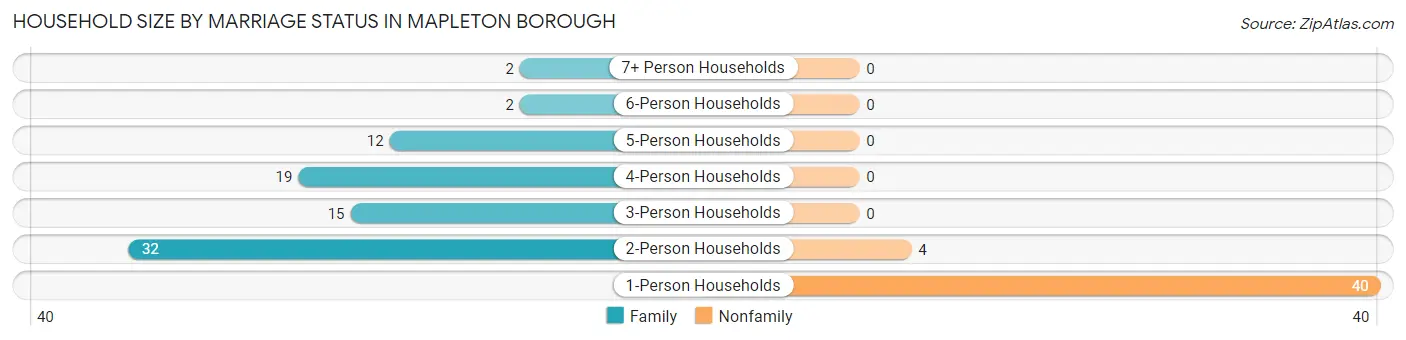
Household Size by Marriage Status in Mapleton borough
Out of a total of 126 households in Mapleton borough, 82 (65.1%) are family households, while 44 (34.9%) are nonfamily households. The most numerous type of family households are 2-person households, comprising 32, and the most common type of nonfamily households are 1-person households, comprising 40.
| Household Size | Family Households | Nonfamily Households |
| 1-Person Households | - | 40 (31.8%) |
| 2-Person Households | 32 (25.4%) | 4 (3.2%) |
| 3-Person Households | 15 (11.9%) | 0 (0.0%) |
| 4-Person Households | 19 (15.1%) | 0 (0.0%) |
| 5-Person Households | 12 (9.5%) | 0 (0.0%) |
| 6-Person Households | 2 (1.6%) | 0 (0.0%) |
| 7+ Person Households | 2 (1.6%) | 0 (0.0%) |
| Total | 82 (65.1%) | 44 (34.9%) |
Female Fertility in Mapleton borough
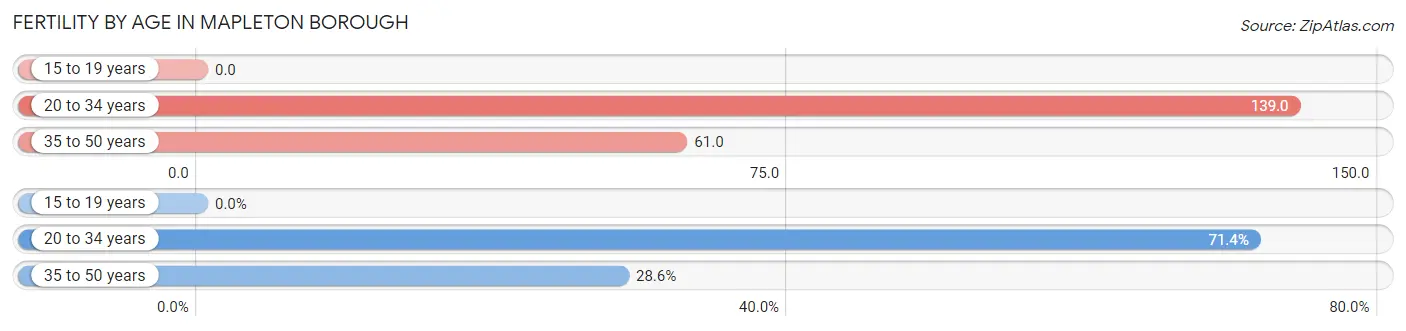
Fertility by Age in Mapleton borough
Average fertility rate in Mapleton borough is 96.0 births per 1,000 women. Women in the age bracket of 20 to 34 years have the highest fertility rate with 139.0 births per 1,000 women. Women in the age bracket of 20 to 34 years acount for 71.4% of all women with births.
| Age Bracket | Women with Births | Births / 1,000 Women |
| 15 to 19 years | 0 (0.0%) | 0.0 |
| 20 to 34 years | 5 (71.4%) | 139.0 |
| 35 to 50 years | 2 (28.6%) | 61.0 |
| Total | 7 (100.0%) | 96.0 |
Fertility by Age by Marriage Status in Mapleton borough
14.3% of women with births (7) in Mapleton borough are married. The highest percentage of unmarried women with births falls into 20 to 34 years age bracket with 100.0% of them unmarried at the time of birth, while the lowest percentage of unmarried women with births belong to 35 to 50 years age bracket with 50.0% of them unmarried.
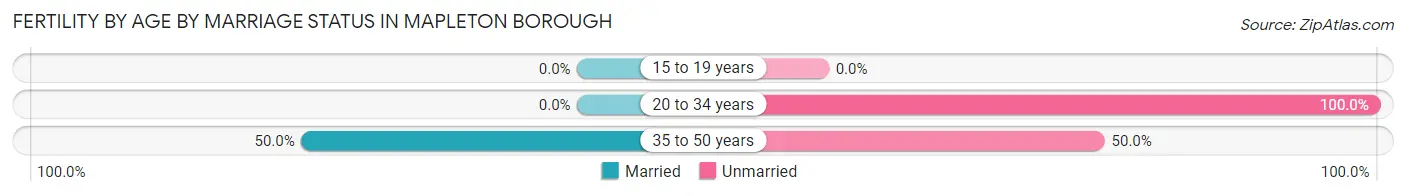
| Age Bracket | Married | Unmarried |
| 15 to 19 years | 0 (0.0%) | 0 (0.0%) |
| 20 to 34 years | 0 (0.0%) | 5 (100.0%) |
| 35 to 50 years | 1 (50.0%) | 1 (50.0%) |
| Total | 1 (14.3%) | 6 (85.7%) |
Fertility by Education in Mapleton borough
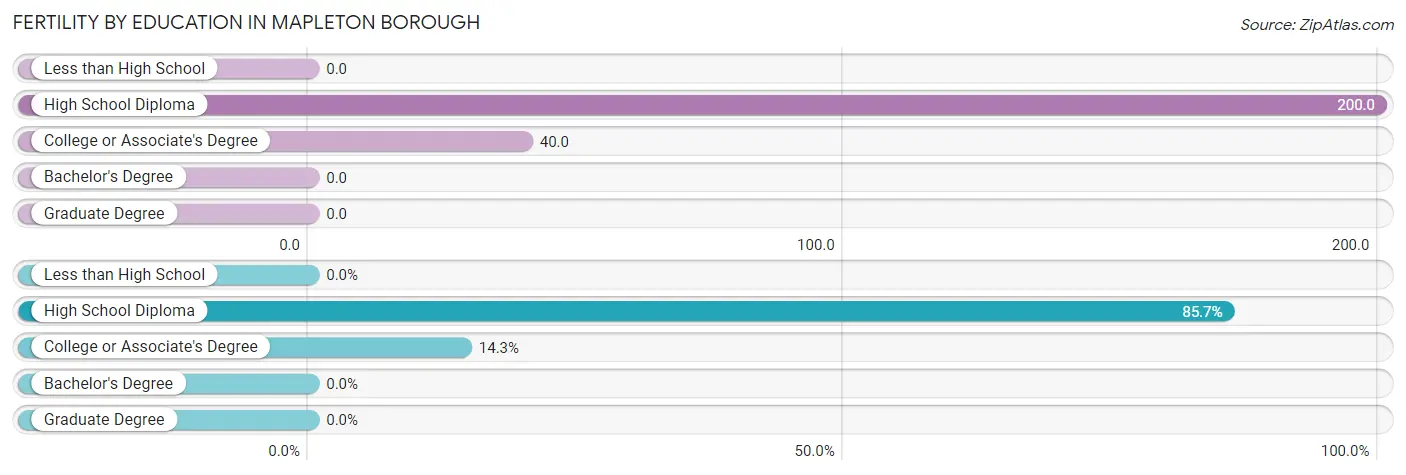
| Educational Attainment | Women with Births | Births / 1,000 Women |
| Less than High School | 0 (0.0%) | 0.0 |
| High School Diploma | 6 (85.7%) | 200.0 |
| College or Associate's Degree | 1 (14.3%) | 40.0 |
| Bachelor's Degree | 0 (0.0%) | 0.0 |
| Graduate Degree | 0 (0.0%) | 0.0 |
| Total | 7 (100.0%) | 96.0 |
Fertility by Education by Marriage Status in Mapleton borough
85.7% of women with births in Mapleton borough are unmarried. Women with the educational attainment of high school diploma are most likely to be married with 16.7% of them married at childbirth, while women with the educational attainment of college or associate's degree are least likely to be married with 100.0% of them unmarried at childbirth.
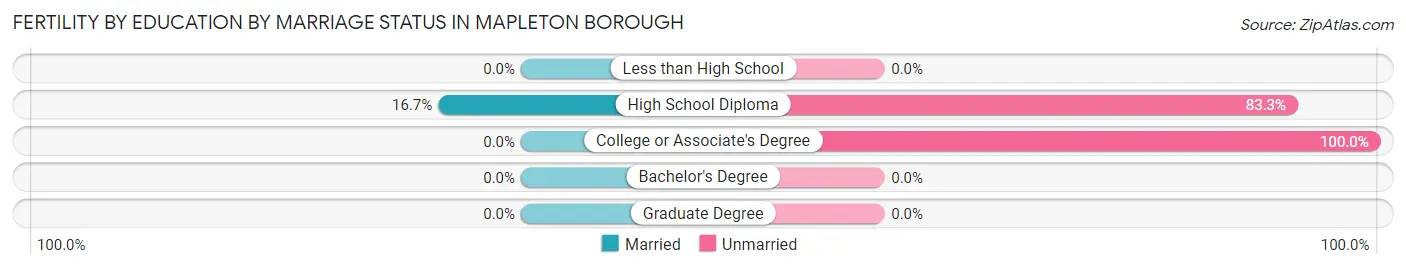
| Educational Attainment | Married | Unmarried |
| Less than High School | 0 (0.0%) | 0 (0.0%) |
| High School Diploma | 1 (16.7%) | 5 (83.3%) |
| College or Associate's Degree | 0 (0.0%) | 1 (100.0%) |
| Bachelor's Degree | 0 (0.0%) | 0 (0.0%) |
| Graduate Degree | 0 (0.0%) | 0 (0.0%) |
| Total | 1 (14.3%) | 6 (85.7%) |
Employment Characteristics in Mapleton borough
Employment by Class of Employer in Mapleton borough
Among the 173 employed individuals in Mapleton borough, private company employees (130 | 75.1%), not-for-profit organizations (19 | 11.0%), and local government employees (7 | 4.1%) make up the most common classes of employment.
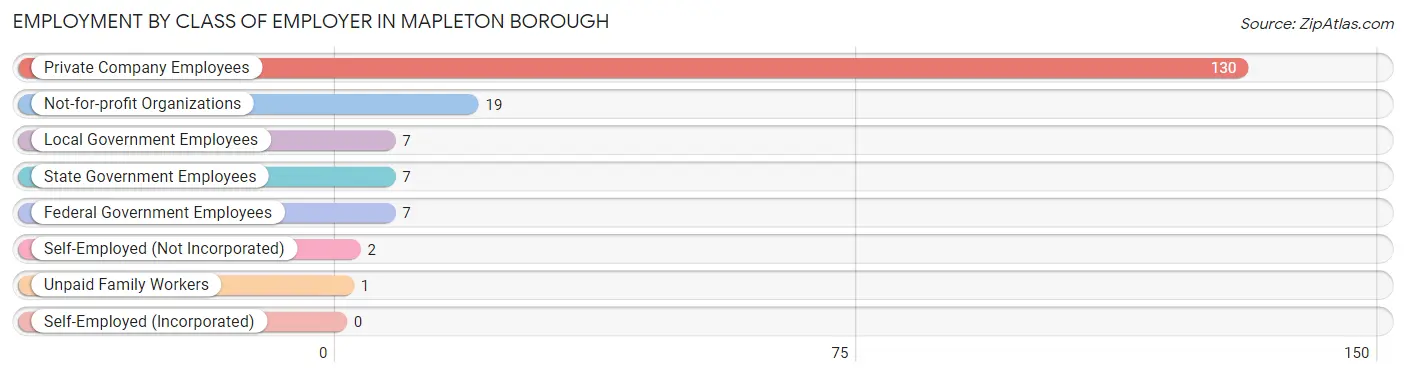
| Employer Class | # Employees | % Employees |
| Private Company Employees | 130 | 75.1% |
| Self-Employed (Incorporated) | 0 | 0.0% |
| Self-Employed (Not Incorporated) | 2 | 1.2% |
| Not-for-profit Organizations | 19 | 11.0% |
| Local Government Employees | 7 | 4.1% |
| State Government Employees | 7 | 4.1% |
| Federal Government Employees | 7 | 4.1% |
| Unpaid Family Workers | 1 | 0.6% |
| Total | 173 | 100.0% |
Employment Status by Age in Mapleton borough
According to the labor force statistics for Mapleton borough, out of the total population over 16 years of age (274), 69.7% or 191 individuals are in the labor force, with 7.3% or 14 of them unemployed. The age group with the highest labor force participation rate is 20 to 24 years, with 100.0% or 27 individuals in the labor force. Within the labor force, the 16 to 19 years age range has the highest percentage of unemployed individuals, with 81.8% or 9 of them being unemployed.
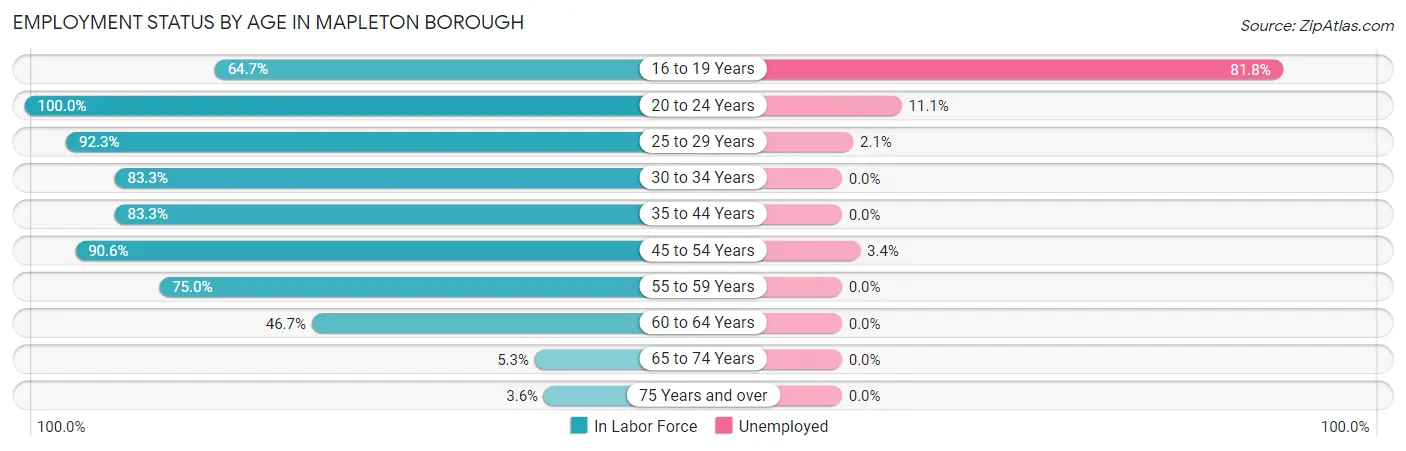
| Age Bracket | In Labor Force | Unemployed |
| 16 to 19 Years | 11 (64.7%) | 9 (81.8%) |
| 20 to 24 Years | 27 (100.0%) | 3 (11.1%) |
| 25 to 29 Years | 48 (92.3%) | 1 (2.1%) |
| 30 to 34 Years | 15 (83.3%) | 0 (0.0%) |
| 35 to 44 Years | 25 (83.3%) | 0 (0.0%) |
| 45 to 54 Years | 29 (90.6%) | 1 (3.4%) |
| 55 to 59 Years | 27 (75.0%) | 0 (0.0%) |
| 60 to 64 Years | 7 (46.7%) | 0 (0.0%) |
| 65 to 74 Years | 1 (5.3%) | 0 (0.0%) |
| 75 Years and over | 1 (3.6%) | 0 (0.0%) |
| Total | 191 (69.7%) | 14 (7.3%) |
Employment Status by Educational Attainment in Mapleton borough
According to labor force statistics for Mapleton borough, 82.5% of individuals (151) out of the total population between 25 and 64 years of age (183) are in the labor force, with 1.3% or 2 of them being unemployed. The group with the highest labor force participation rate are those with the educational attainment of bachelor's degree or higher, with 100.0% or 15 individuals in the labor force. Within the labor force, individuals with college / associate degree education have the highest percentage of unemployment, with 3.4% or 1 of them being unemployed.
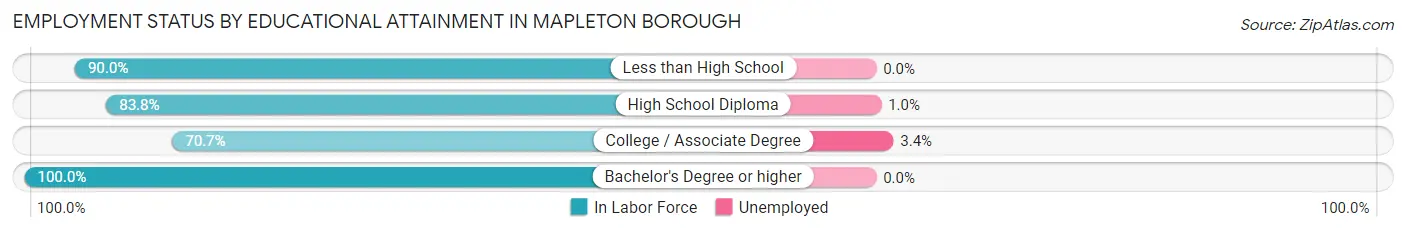
| Educational Attainment | In Labor Force | Unemployed |
| Less than High School | 9 (90.0%) | 0 (0.0%) |
| High School Diploma | 98 (83.8%) | 1 (1.0%) |
| College / Associate Degree | 29 (70.7%) | 1 (3.4%) |
| Bachelor's Degree or higher | 15 (100.0%) | 0 (0.0%) |
| Total | 151 (82.5%) | 2 (1.3%) |
Employment Occupations by Sex in Mapleton borough
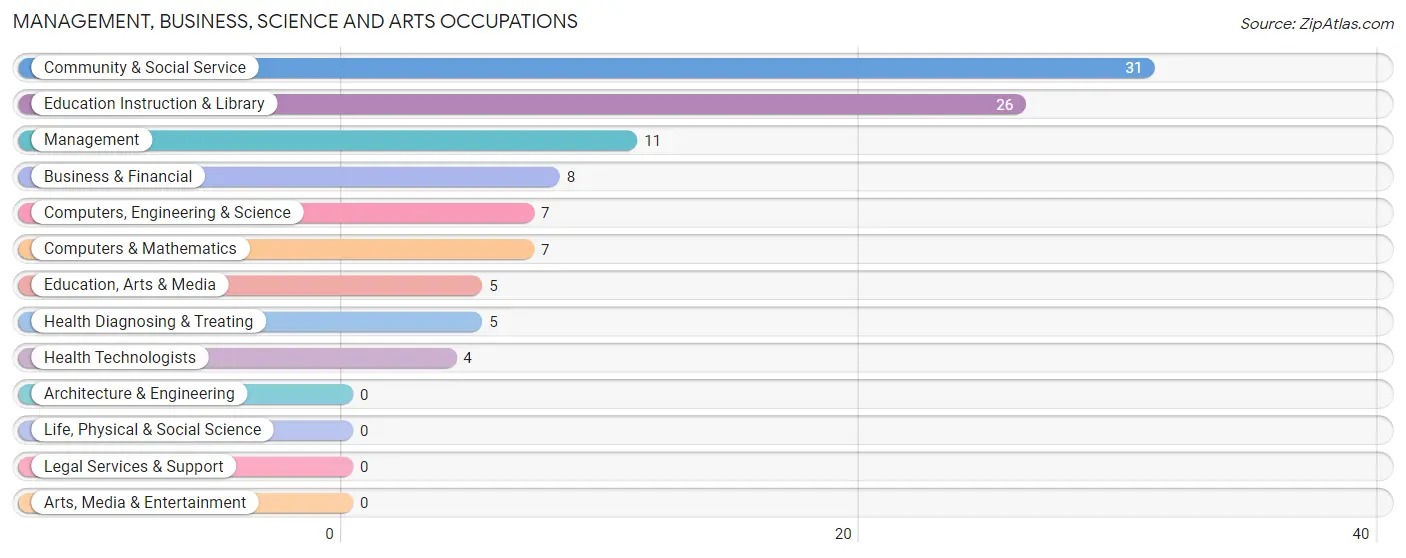
Management, Business, Science and Arts Occupations
The most common Management, Business, Science and Arts occupations in Mapleton borough are Community & Social Service (31 | 17.5%), Education Instruction & Library (26 | 14.7%), Management (11 | 6.2%), Business & Financial (8 | 4.5%), and Computers, Engineering & Science (7 | 4.0%).
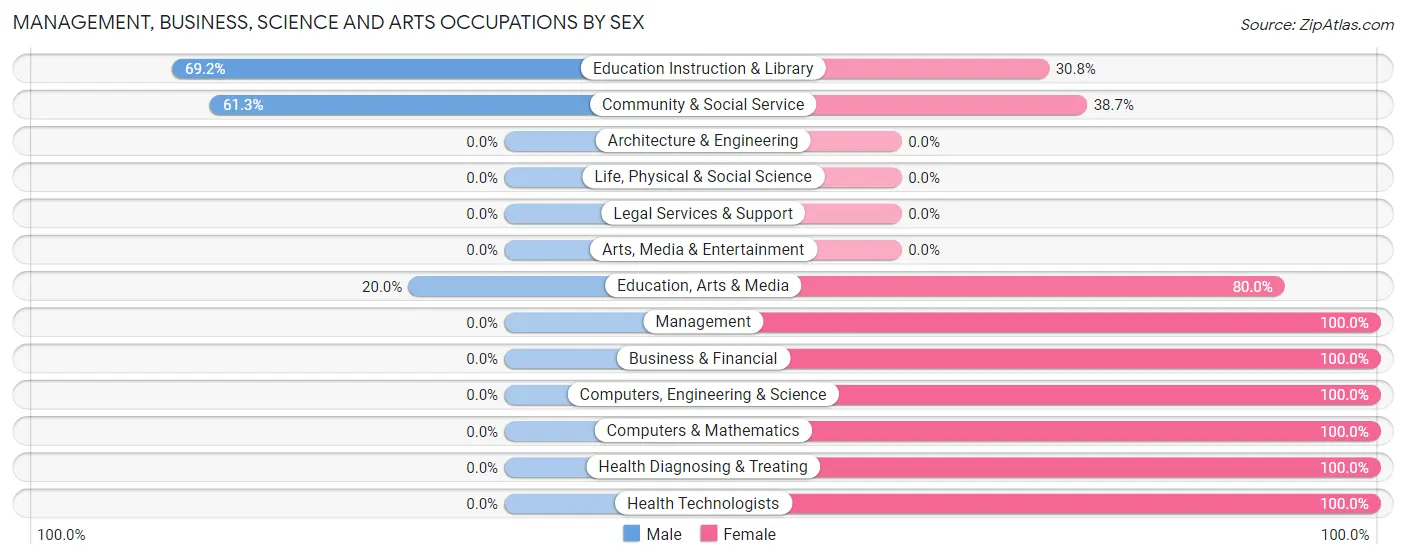
Management, Business, Science and Arts Occupations by Sex
Within the Management, Business, Science and Arts occupations in Mapleton borough, the most male-oriented occupations are Education Instruction & Library (69.2%), Community & Social Service (61.3%), and Education, Arts & Media (20.0%), while the most female-oriented occupations are Management (100.0%), Business & Financial (100.0%), and Computers, Engineering & Science (100.0%).
| Occupation | Male | Female |
| Management | 0 (0.0%) | 11 (100.0%) |
| Business & Financial | 0 (0.0%) | 8 (100.0%) |
| Computers, Engineering & Science | 0 (0.0%) | 7 (100.0%) |
| Computers & Mathematics | 0 (0.0%) | 7 (100.0%) |
| Architecture & Engineering | 0 (0.0%) | 0 (0.0%) |
| Life, Physical & Social Science | 0 (0.0%) | 0 (0.0%) |
| Community & Social Service | 19 (61.3%) | 12 (38.7%) |
| Education, Arts & Media | 1 (20.0%) | 4 (80.0%) |
| Legal Services & Support | 0 (0.0%) | 0 (0.0%) |
| Education Instruction & Library | 18 (69.2%) | 8 (30.8%) |
| Arts, Media & Entertainment | 0 (0.0%) | 0 (0.0%) |
| Health Diagnosing & Treating | 0 (0.0%) | 5 (100.0%) |
| Health Technologists | 0 (0.0%) | 4 (100.0%) |
| Total (Category) | 19 (30.6%) | 43 (69.4%) |
| Total (Overall) | 88 (49.7%) | 89 (50.3%) |
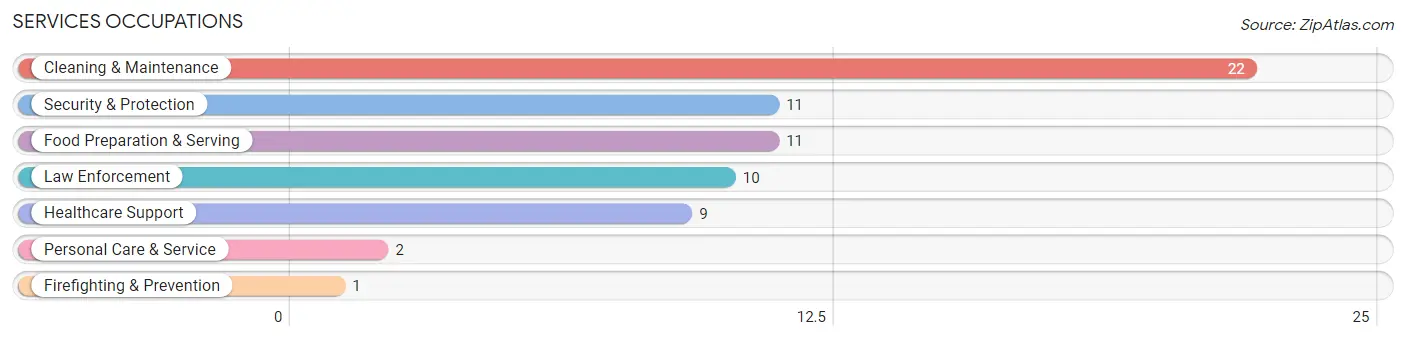
Services Occupations
The most common Services occupations in Mapleton borough are Cleaning & Maintenance (22 | 12.4%), Security & Protection (11 | 6.2%), Food Preparation & Serving (11 | 6.2%), Law Enforcement (10 | 5.7%), and Healthcare Support (9 | 5.1%).
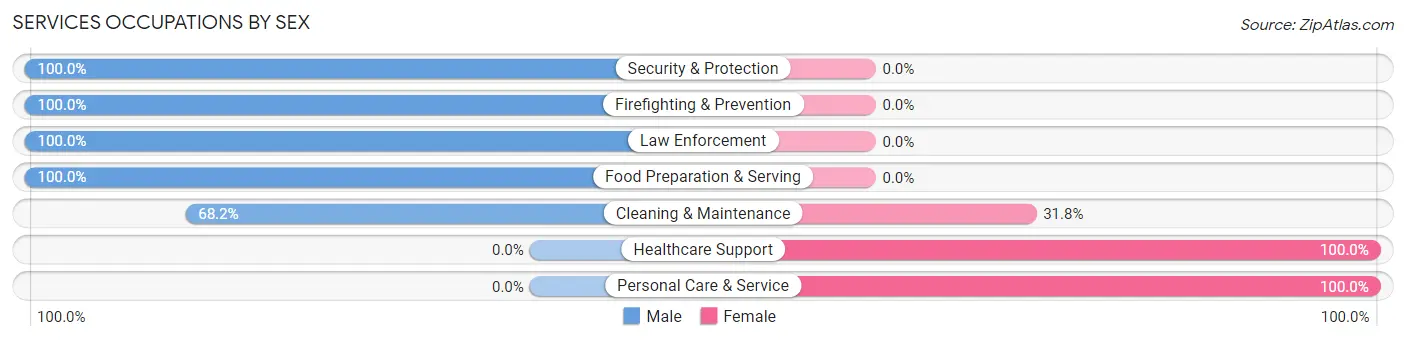
Services Occupations by Sex
Within the Services occupations in Mapleton borough, the most male-oriented occupations are Security & Protection (100.0%), Firefighting & Prevention (100.0%), and Law Enforcement (100.0%), while the most female-oriented occupations are Healthcare Support (100.0%), Personal Care & Service (100.0%), and Cleaning & Maintenance (31.8%).
| Occupation | Male | Female |
| Healthcare Support | 0 (0.0%) | 9 (100.0%) |
| Security & Protection | 11 (100.0%) | 0 (0.0%) |
| Firefighting & Prevention | 1 (100.0%) | 0 (0.0%) |
| Law Enforcement | 10 (100.0%) | 0 (0.0%) |
| Food Preparation & Serving | 11 (100.0%) | 0 (0.0%) |
| Cleaning & Maintenance | 15 (68.2%) | 7 (31.8%) |
| Personal Care & Service | 0 (0.0%) | 2 (100.0%) |
| Total (Category) | 37 (67.3%) | 18 (32.7%) |
| Total (Overall) | 88 (49.7%) | 89 (50.3%) |
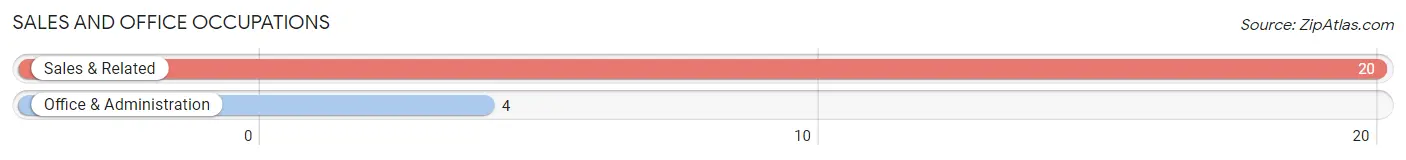
Sales and Office Occupations
The most common Sales and Office occupations in Mapleton borough are Sales & Related (20 | 11.3%), and Office & Administration (4 | 2.3%).
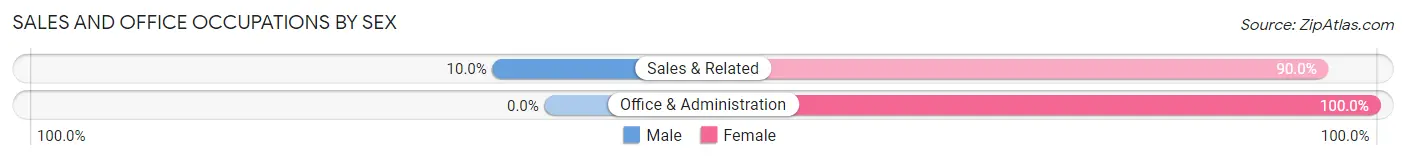
Sales and Office Occupations by Sex
| Occupation | Male | Female |
| Sales & Related | 2 (10.0%) | 18 (90.0%) |
| Office & Administration | 0 (0.0%) | 4 (100.0%) |
| Total (Category) | 2 (8.3%) | 22 (91.7%) |
| Total (Overall) | 88 (49.7%) | 89 (50.3%) |
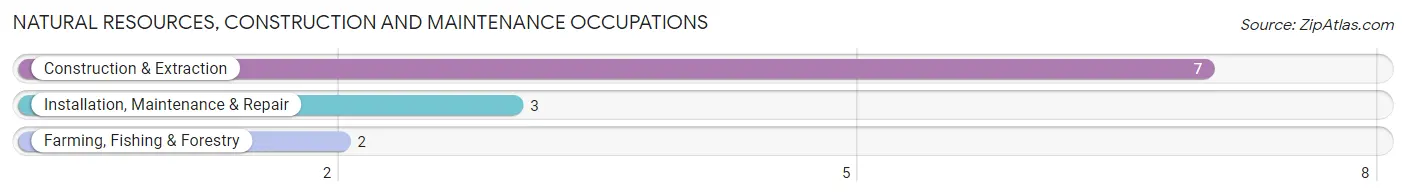
Natural Resources, Construction and Maintenance Occupations
The most common Natural Resources, Construction and Maintenance occupations in Mapleton borough are Construction & Extraction (7 | 4.0%), Installation, Maintenance & Repair (3 | 1.7%), and Farming, Fishing & Forestry (2 | 1.1%).
Natural Resources, Construction and Maintenance Occupations by Sex
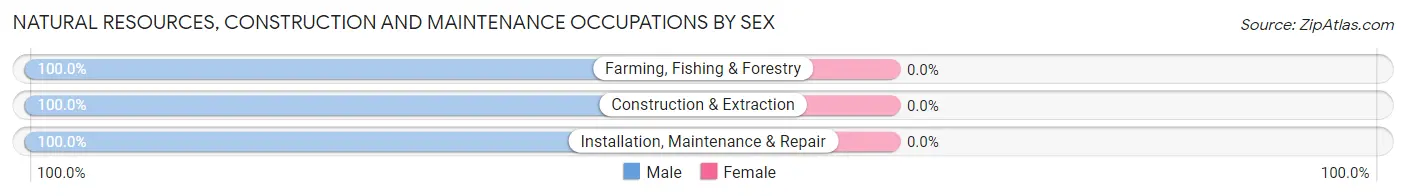
| Occupation | Male | Female |
| Farming, Fishing & Forestry | 2 (100.0%) | 0 (0.0%) |
| Construction & Extraction | 7 (100.0%) | 0 (0.0%) |
| Installation, Maintenance & Repair | 3 (100.0%) | 0 (0.0%) |
| Total (Category) | 12 (100.0%) | 0 (0.0%) |
| Total (Overall) | 88 (49.7%) | 89 (50.3%) |
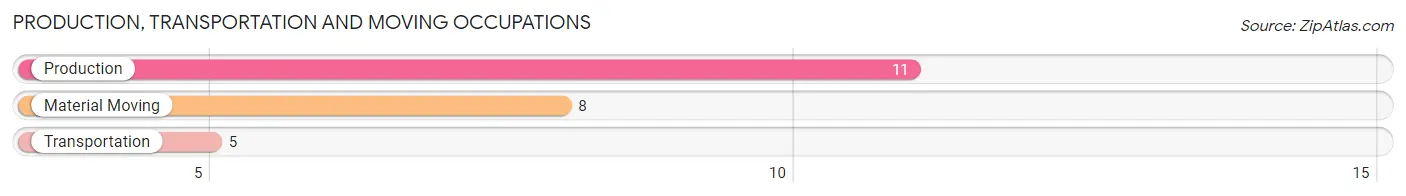
Production, Transportation and Moving Occupations
The most common Production, Transportation and Moving occupations in Mapleton borough are Production (11 | 6.2%), Material Moving (8 | 4.5%), and Transportation (5 | 2.8%).
Production, Transportation and Moving Occupations by Sex
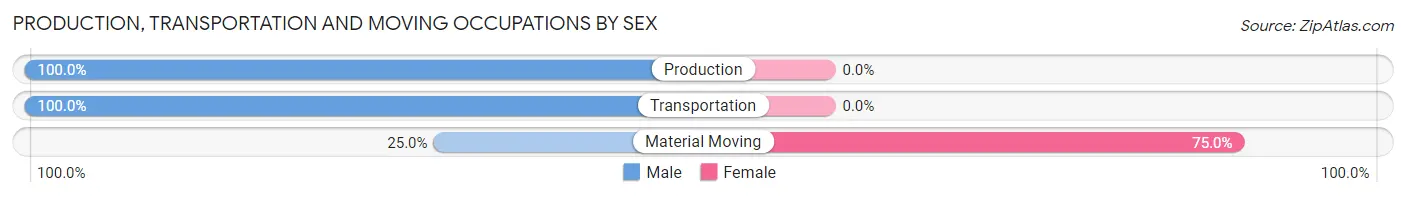
| Occupation | Male | Female |
| Production | 11 (100.0%) | 0 (0.0%) |
| Transportation | 5 (100.0%) | 0 (0.0%) |
| Material Moving | 2 (25.0%) | 6 (75.0%) |
| Total (Category) | 18 (75.0%) | 6 (25.0%) |
| Total (Overall) | 88 (49.7%) | 89 (50.3%) |
Employment Industries by Sex in Mapleton borough
Employment Industries in Mapleton borough
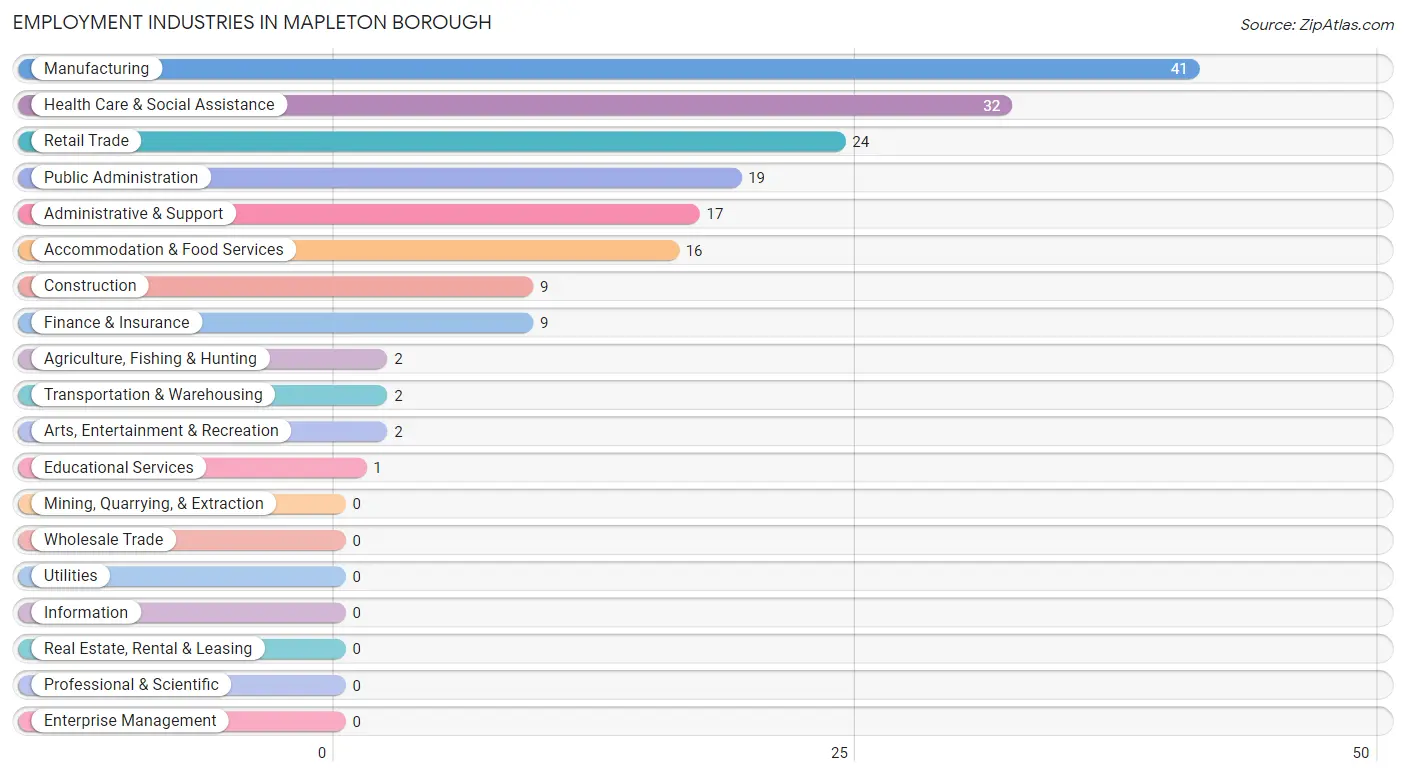
The major employment industries in Mapleton borough include Manufacturing (41 | 23.2%), Health Care & Social Assistance (32 | 18.1%), Retail Trade (24 | 13.6%), Public Administration (19 | 10.7%), and Administrative & Support (17 | 9.6%).
Employment Industries by Sex in Mapleton borough
The Mapleton borough industries that see more men than women are Agriculture, Fishing & Hunting (100.0%), Construction (100.0%), and Transportation & Warehousing (100.0%), whereas the industries that tend to have a higher number of women are Finance & Insurance (100.0%), Educational Services (100.0%), and Health Care & Social Assistance (100.0%).
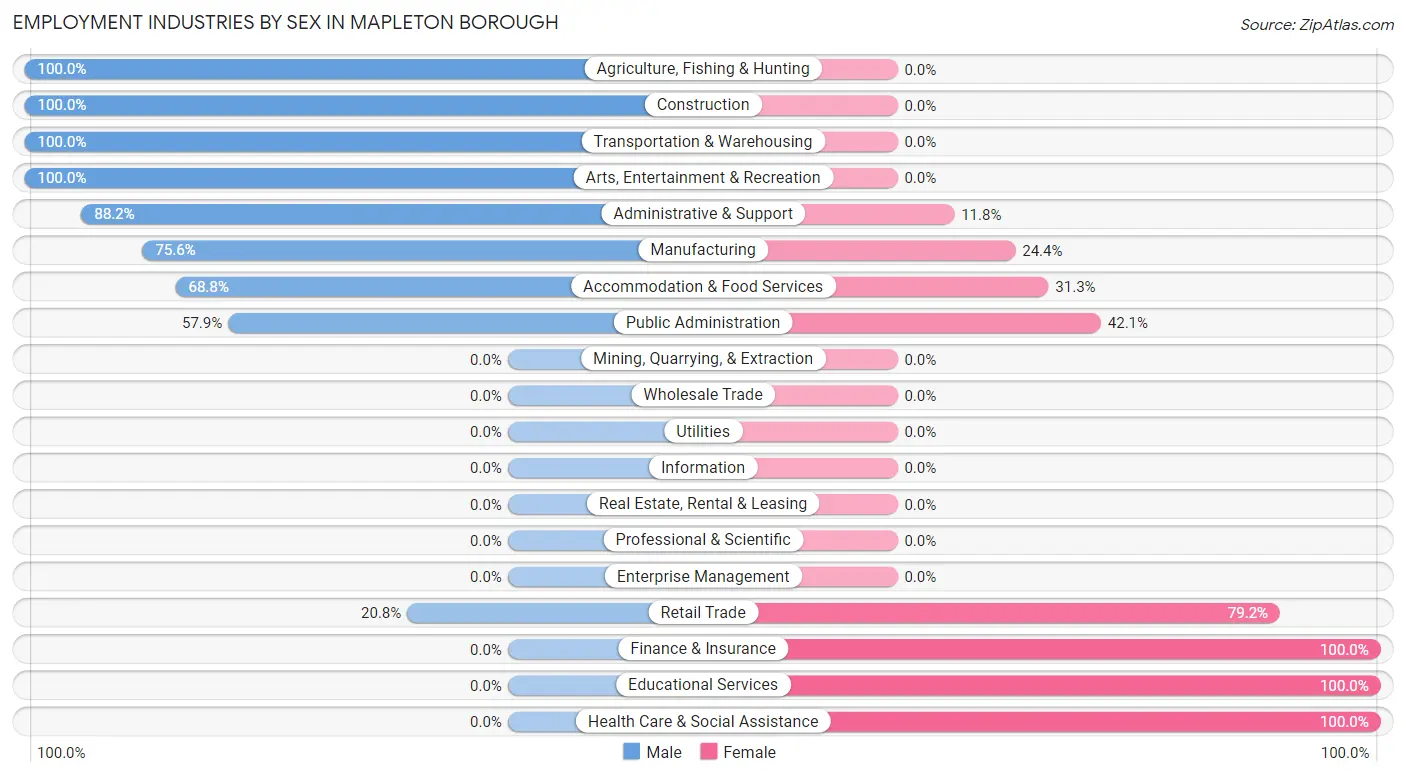
| Industry | Male | Female |
| Agriculture, Fishing & Hunting | 2 (100.0%) | 0 (0.0%) |
| Mining, Quarrying, & Extraction | 0 (0.0%) | 0 (0.0%) |
| Construction | 9 (100.0%) | 0 (0.0%) |
| Manufacturing | 31 (75.6%) | 10 (24.4%) |
| Wholesale Trade | 0 (0.0%) | 0 (0.0%) |
| Retail Trade | 5 (20.8%) | 19 (79.2%) |
| Transportation & Warehousing | 2 (100.0%) | 0 (0.0%) |
| Utilities | 0 (0.0%) | 0 (0.0%) |
| Information | 0 (0.0%) | 0 (0.0%) |
| Finance & Insurance | 0 (0.0%) | 9 (100.0%) |
| Real Estate, Rental & Leasing | 0 (0.0%) | 0 (0.0%) |
| Professional & Scientific | 0 (0.0%) | 0 (0.0%) |
| Enterprise Management | 0 (0.0%) | 0 (0.0%) |
| Administrative & Support | 15 (88.2%) | 2 (11.8%) |
| Educational Services | 0 (0.0%) | 1 (100.0%) |
| Health Care & Social Assistance | 0 (0.0%) | 32 (100.0%) |
| Arts, Entertainment & Recreation | 2 (100.0%) | 0 (0.0%) |
| Accommodation & Food Services | 11 (68.8%) | 5 (31.2%) |
| Public Administration | 11 (57.9%) | 8 (42.1%) |
| Total | 88 (49.7%) | 89 (50.3%) |
Education in Mapleton borough
School Enrollment in Mapleton borough
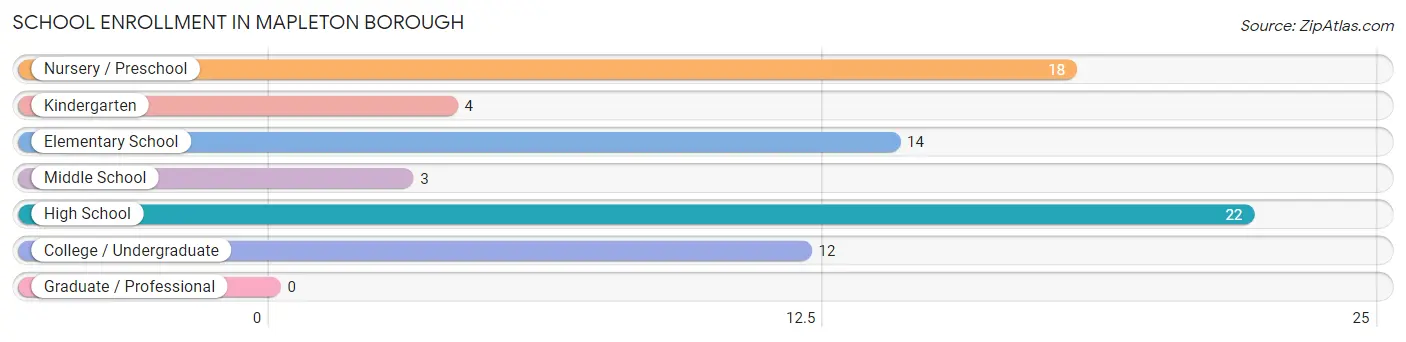
The most common levels of schooling among the 73 students in Mapleton borough are high school (22 | 30.1%), nursery / preschool (18 | 24.7%), and elementary school (14 | 19.2%).
| School Level | # Students | % Students |
| Nursery / Preschool | 18 | 24.7% |
| Kindergarten | 4 | 5.5% |
| Elementary School | 14 | 19.2% |
| Middle School | 3 | 4.1% |
| High School | 22 | 30.1% |
| College / Undergraduate | 12 | 16.4% |
| Graduate / Professional | 0 | 0.0% |
| Total | 73 | 100.0% |
School Enrollment by Age by Funding Source in Mapleton borough
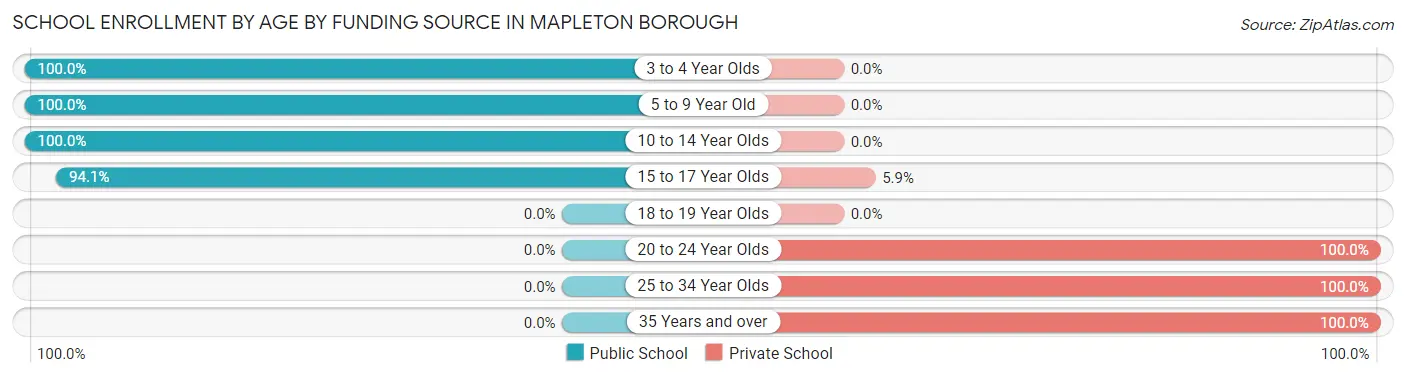
Out of a total of 73 students who are enrolled in schools in Mapleton borough, 13 (17.8%) attend a private institution, while the remaining 60 (82.2%) are enrolled in public schools. The age group of 20 to 24 year olds has the highest likelihood of being enrolled in private schools, with 6 (100.0% in the age bracket) enrolled. Conversely, the age group of 3 to 4 year olds has the lowest likelihood of being enrolled in a private school, with 12 (100.0% in the age bracket) attending a public institution.
| Age Bracket | Public School | Private School |
| 3 to 4 Year Olds | 12 (100.0%) | 0 (0.0%) |
| 5 to 9 Year Old | 24 (100.0%) | 0 (0.0%) |
| 10 to 14 Year Olds | 8 (100.0%) | 0 (0.0%) |
| 15 to 17 Year Olds | 16 (94.1%) | 1 (5.9%) |
| 18 to 19 Year Olds | 0 (0.0%) | 0 (0.0%) |
| 20 to 24 Year Olds | 0 (0.0%) | 6 (100.0%) |
| 25 to 34 Year Olds | 0 (0.0%) | 1 (100.0%) |
| 35 Years and over | 0 (0.0%) | 5 (100.0%) |
| Total | 60 (82.2%) | 13 (17.8%) |
Educational Attainment by Field of Study in Mapleton borough
Arts & humanities (7 | 46.7%), psychology (4 | 26.7%), bio, nature & agricultural (1 | 6.7%), social sciences (1 | 6.7%), and education (1 | 6.7%) are the most common fields of study among 15 individuals in Mapleton borough who have obtained a bachelor's degree or higher.
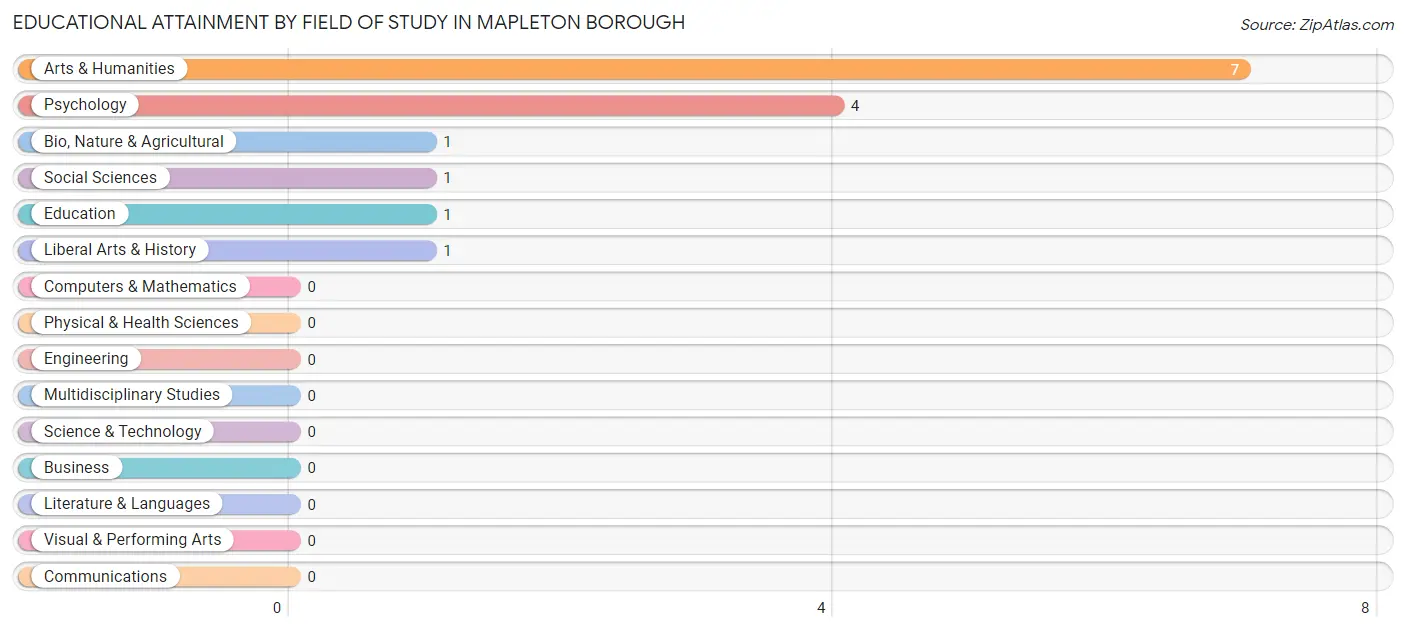
| Field of Study | # Graduates | % Graduates |
| Computers & Mathematics | 0 | 0.0% |
| Bio, Nature & Agricultural | 1 | 6.7% |
| Physical & Health Sciences | 0 | 0.0% |
| Psychology | 4 | 26.7% |
| Social Sciences | 1 | 6.7% |
| Engineering | 0 | 0.0% |
| Multidisciplinary Studies | 0 | 0.0% |
| Science & Technology | 0 | 0.0% |
| Business | 0 | 0.0% |
| Education | 1 | 6.7% |
| Literature & Languages | 0 | 0.0% |
| Liberal Arts & History | 1 | 6.7% |
| Visual & Performing Arts | 0 | 0.0% |
| Communications | 0 | 0.0% |
| Arts & Humanities | 7 | 46.7% |
| Total | 15 | 100.0% |
Transportation & Commute in Mapleton borough
Vehicle Availability by Sex in Mapleton borough
The most prevalent vehicle ownership categories in Mapleton borough are males with 3 vehicles (27, accounting for 30.7%) and females with 3 vehicles (28, making up 31.8%).
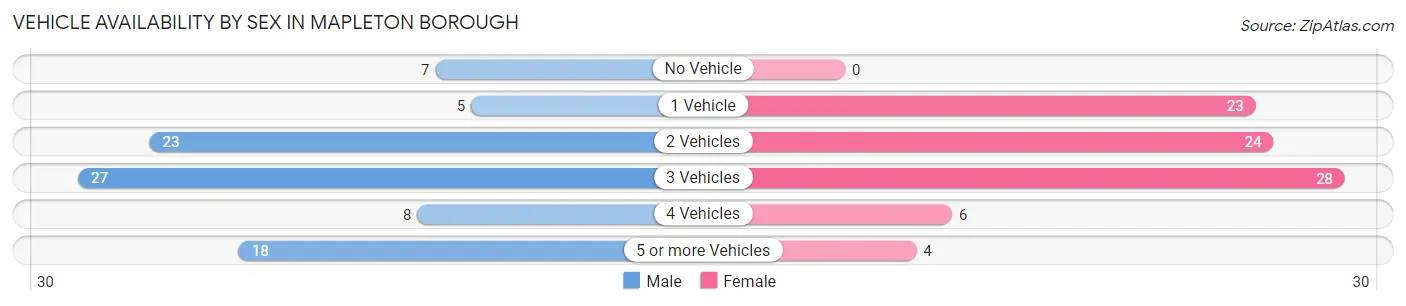
| Vehicles Available | Male | Female |
| No Vehicle | 7 (8.0%) | 0 (0.0%) |
| 1 Vehicle | 5 (5.7%) | 23 (27.1%) |
| 2 Vehicles | 23 (26.1%) | 24 (28.2%) |
| 3 Vehicles | 27 (30.7%) | 28 (32.9%) |
| 4 Vehicles | 8 (9.1%) | 6 (7.1%) |
| 5 or more Vehicles | 18 (20.4%) | 4 (4.7%) |
| Total | 88 (100.0%) | 85 (100.0%) |
Commute Time in Mapleton borough
The most frequently occuring commute durations in Mapleton borough are 30 to 34 minutes (35 commuters, 21.9%), 15 to 19 minutes (34 commuters, 21.2%), and 20 to 24 minutes (23 commuters, 14.4%).
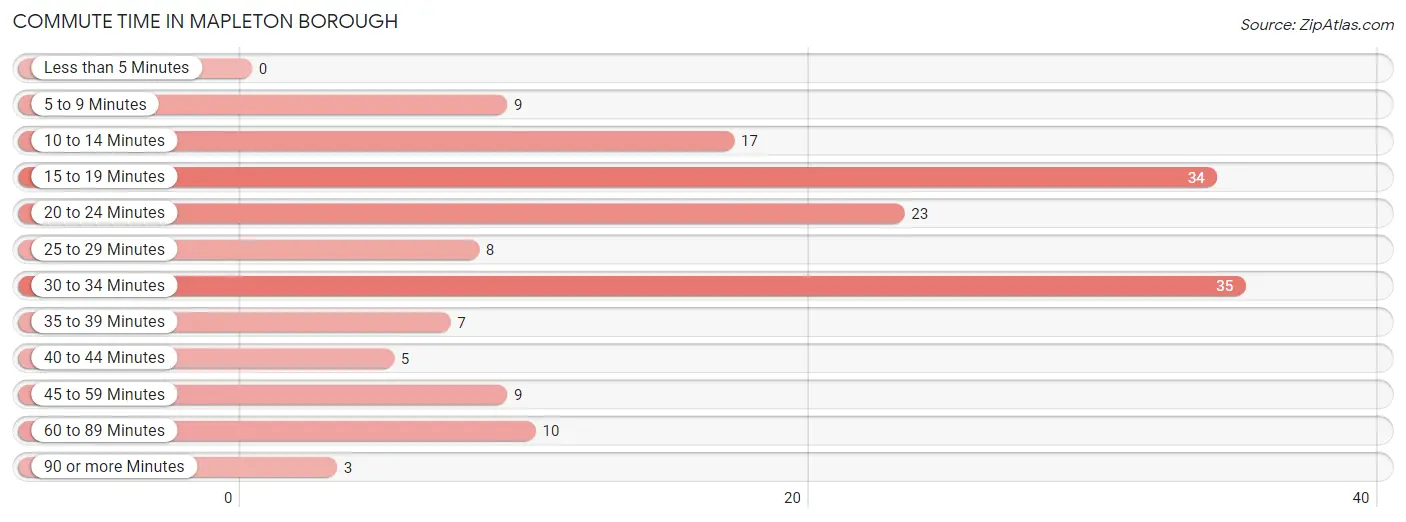
| Commute Time | # Commuters | % Commuters |
| Less than 5 Minutes | 0 | 0.0% |
| 5 to 9 Minutes | 9 | 5.6% |
| 10 to 14 Minutes | 17 | 10.6% |
| 15 to 19 Minutes | 34 | 21.2% |
| 20 to 24 Minutes | 23 | 14.4% |
| 25 to 29 Minutes | 8 | 5.0% |
| 30 to 34 Minutes | 35 | 21.9% |
| 35 to 39 Minutes | 7 | 4.4% |
| 40 to 44 Minutes | 5 | 3.1% |
| 45 to 59 Minutes | 9 | 5.6% |
| 60 to 89 Minutes | 10 | 6.2% |
| 90 or more Minutes | 3 | 1.9% |
Commute Time by Sex in Mapleton borough
The most common commute times in Mapleton borough are 30 to 34 minutes (24 commuters, 27.3%) for males and 15 to 19 minutes (20 commuters, 27.8%) for females.
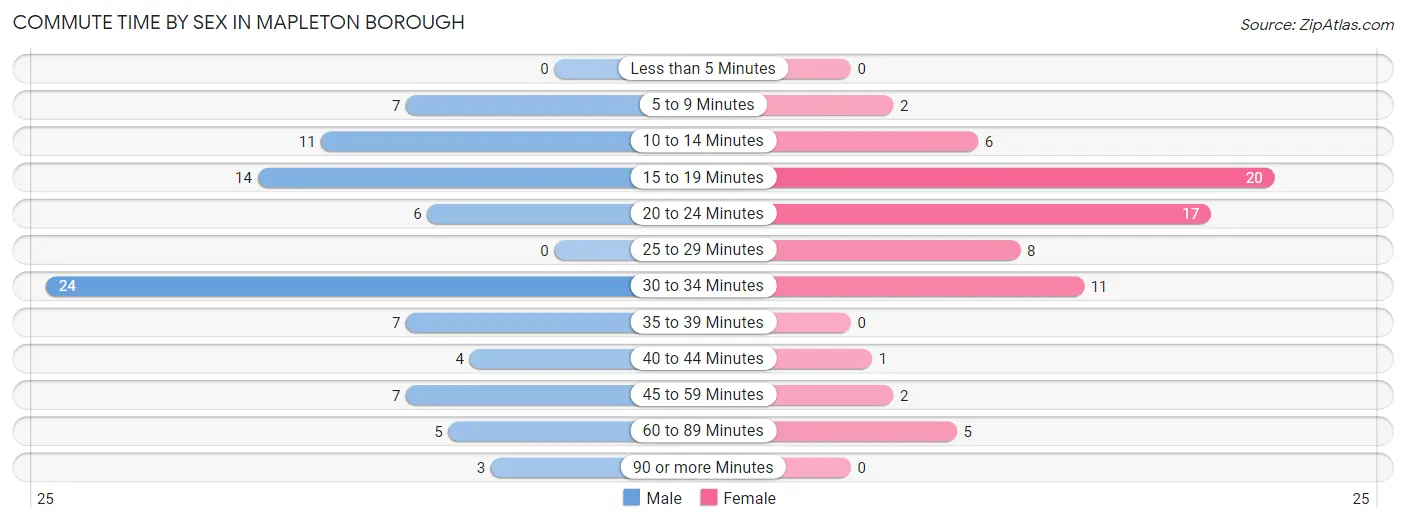
| Commute Time | Male | Female |
| Less than 5 Minutes | 0 (0.0%) | 0 (0.0%) |
| 5 to 9 Minutes | 7 (8.0%) | 2 (2.8%) |
| 10 to 14 Minutes | 11 (12.5%) | 6 (8.3%) |
| 15 to 19 Minutes | 14 (15.9%) | 20 (27.8%) |
| 20 to 24 Minutes | 6 (6.8%) | 17 (23.6%) |
| 25 to 29 Minutes | 0 (0.0%) | 8 (11.1%) |
| 30 to 34 Minutes | 24 (27.3%) | 11 (15.3%) |
| 35 to 39 Minutes | 7 (8.0%) | 0 (0.0%) |
| 40 to 44 Minutes | 4 (4.5%) | 1 (1.4%) |
| 45 to 59 Minutes | 7 (8.0%) | 2 (2.8%) |
| 60 to 89 Minutes | 5 (5.7%) | 5 (6.9%) |
| 90 or more Minutes | 3 (3.4%) | 0 (0.0%) |
Time of Departure to Work by Sex in Mapleton borough
The most frequent times of departure to work in Mapleton borough are 5:00 AM to 5:29 AM (20, 22.7%) for males and 7:30 AM to 7:59 AM (19, 26.4%) for females.
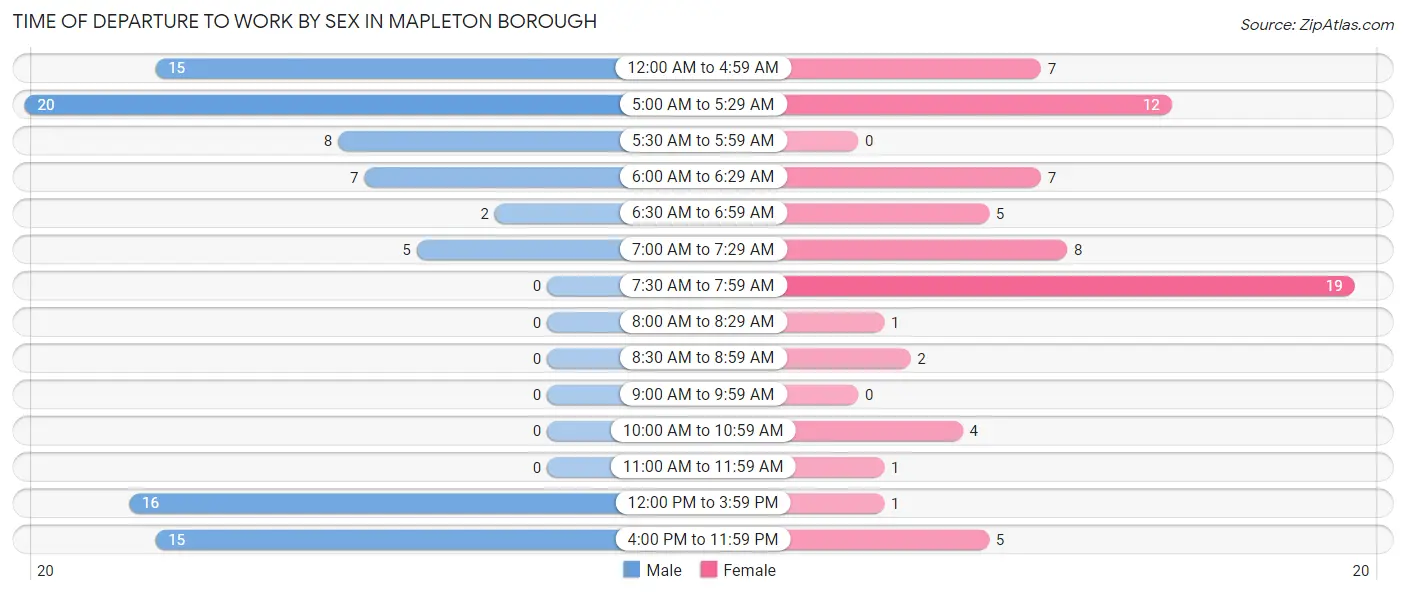
| Time of Departure | Male | Female |
| 12:00 AM to 4:59 AM | 15 (17.1%) | 7 (9.7%) |
| 5:00 AM to 5:29 AM | 20 (22.7%) | 12 (16.7%) |
| 5:30 AM to 5:59 AM | 8 (9.1%) | 0 (0.0%) |
| 6:00 AM to 6:29 AM | 7 (8.0%) | 7 (9.7%) |
| 6:30 AM to 6:59 AM | 2 (2.3%) | 5 (6.9%) |
| 7:00 AM to 7:29 AM | 5 (5.7%) | 8 (11.1%) |
| 7:30 AM to 7:59 AM | 0 (0.0%) | 19 (26.4%) |
| 8:00 AM to 8:29 AM | 0 (0.0%) | 1 (1.4%) |
| 8:30 AM to 8:59 AM | 0 (0.0%) | 2 (2.8%) |
| 9:00 AM to 9:59 AM | 0 (0.0%) | 0 (0.0%) |
| 10:00 AM to 10:59 AM | 0 (0.0%) | 4 (5.6%) |
| 11:00 AM to 11:59 AM | 0 (0.0%) | 1 (1.4%) |
| 12:00 PM to 3:59 PM | 16 (18.2%) | 1 (1.4%) |
| 4:00 PM to 11:59 PM | 15 (17.1%) | 5 (6.9%) |
| Total | 88 (100.0%) | 72 (100.0%) |
Housing Occupancy in Mapleton borough
Occupancy by Ownership in Mapleton borough
Of the total 126 dwellings in Mapleton borough, owner-occupied units account for 93 (73.8%), while renter-occupied units make up 33 (26.2%).
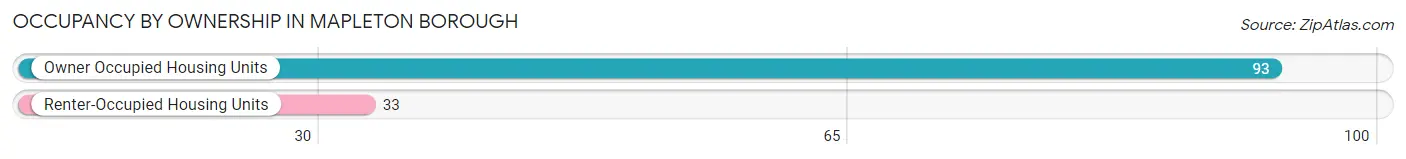
| Occupancy | # Housing Units | % Housing Units |
| Owner Occupied Housing Units | 93 | 73.8% |
| Renter-Occupied Housing Units | 33 | 26.2% |
| Total Occupied Housing Units | 126 | 100.0% |
Occupancy by Household Size in Mapleton borough
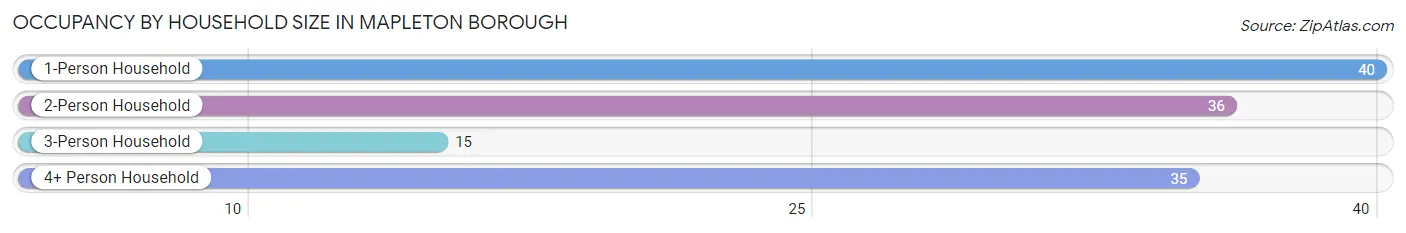
| Household Size | # Housing Units | % Housing Units |
| 1-Person Household | 40 | 31.8% |
| 2-Person Household | 36 | 28.6% |
| 3-Person Household | 15 | 11.9% |
| 4+ Person Household | 35 | 27.8% |
| Total Housing Units | 126 | 100.0% |
Occupancy by Ownership by Household Size in Mapleton borough
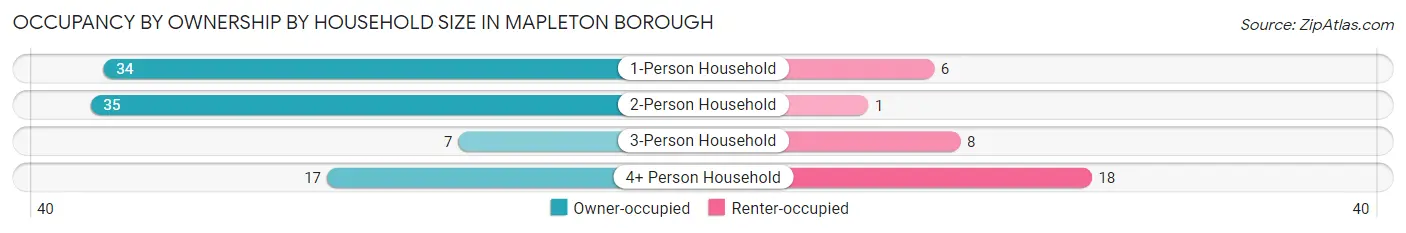
| Household Size | Owner-occupied | Renter-occupied |
| 1-Person Household | 34 (85.0%) | 6 (15.0%) |
| 2-Person Household | 35 (97.2%) | 1 (2.8%) |
| 3-Person Household | 7 (46.7%) | 8 (53.3%) |
| 4+ Person Household | 17 (48.6%) | 18 (51.4%) |
| Total Housing Units | 93 (73.8%) | 33 (26.2%) |
Occupancy by Educational Attainment in Mapleton borough
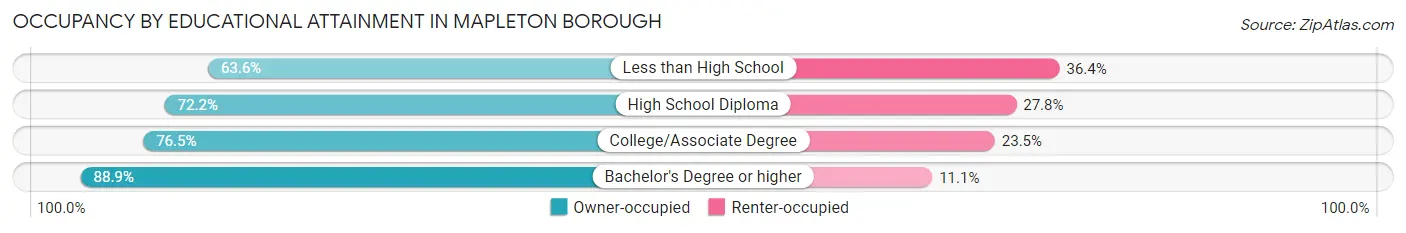
| Household Size | Owner-occupied | Renter-occupied |
| Less than High School | 7 (63.6%) | 4 (36.4%) |
| High School Diploma | 52 (72.2%) | 20 (27.8%) |
| College/Associate Degree | 26 (76.5%) | 8 (23.5%) |
| Bachelor's Degree or higher | 8 (88.9%) | 1 (11.1%) |
Occupancy by Age of Householder in Mapleton borough
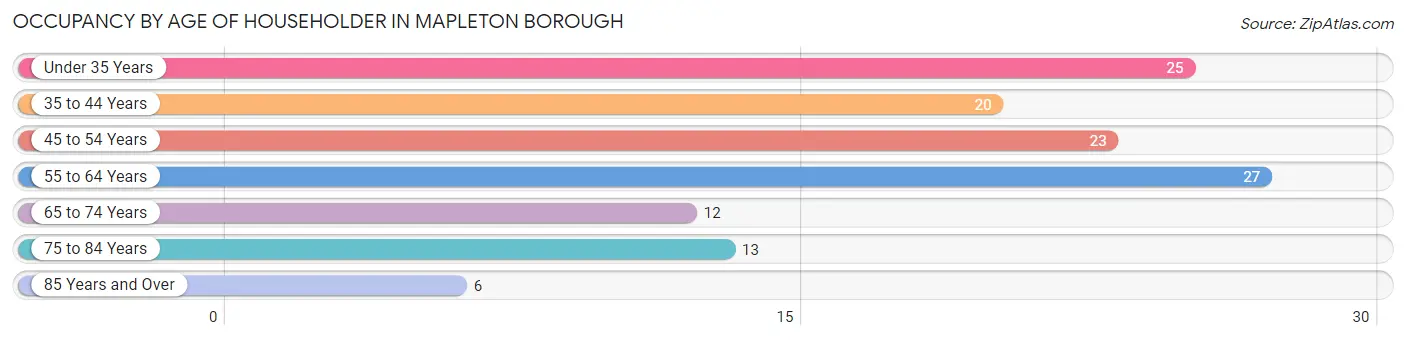
| Age Bracket | # Households | % Households |
| Under 35 Years | 25 | 19.8% |
| 35 to 44 Years | 20 | 15.9% |
| 45 to 54 Years | 23 | 18.2% |
| 55 to 64 Years | 27 | 21.4% |
| 65 to 74 Years | 12 | 9.5% |
| 75 to 84 Years | 13 | 10.3% |
| 85 Years and Over | 6 | 4.8% |
| Total | 126 | 100.0% |
Housing Finances in Mapleton borough
Median Income by Occupancy in Mapleton borough
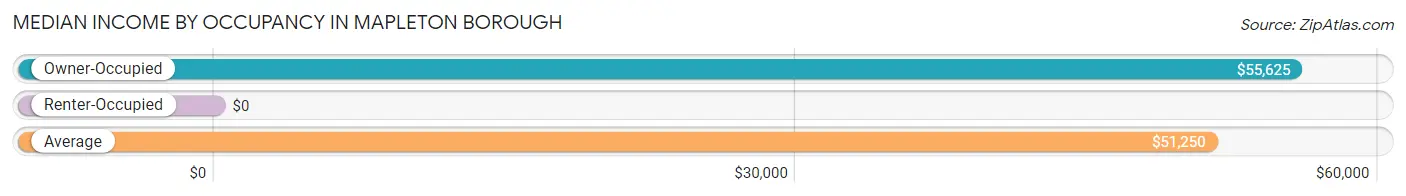
| Occupancy Type | # Households | Median Income |
| Owner-Occupied | 93 (73.8%) | $55,625 |
| Renter-Occupied | 33 (26.2%) | $0 |
| Average | 126 (100.0%) | $51,250 |
Occupancy by Householder Income Bracket in Mapleton borough
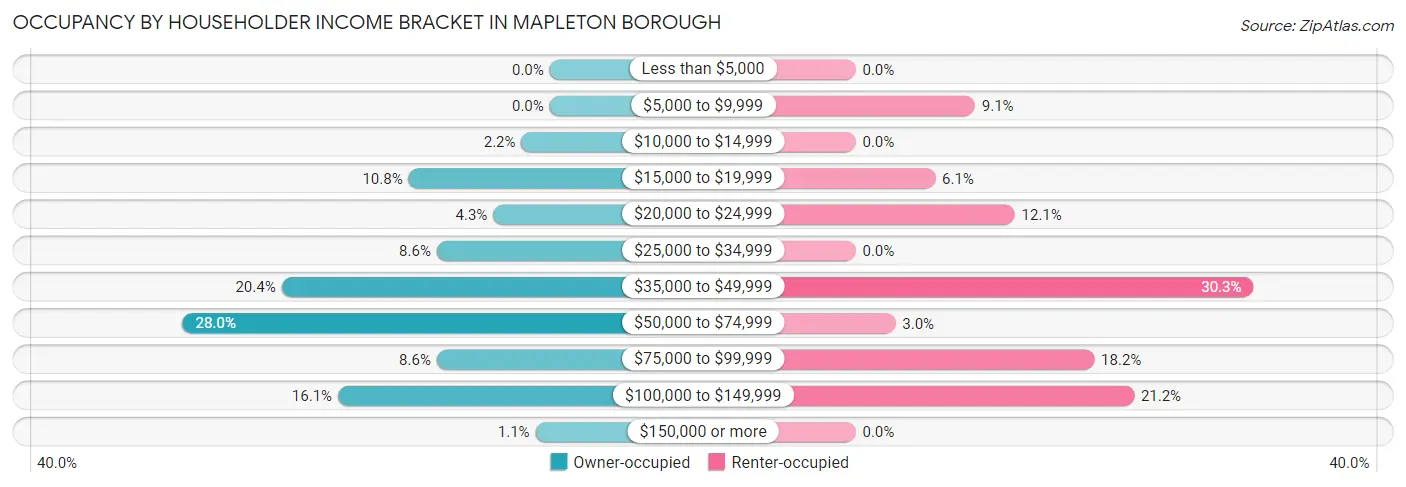
| Income Bracket | Owner-occupied | Renter-occupied |
| Less than $5,000 | 0 (0.0%) | 0 (0.0%) |
| $5,000 to $9,999 | 0 (0.0%) | 3 (9.1%) |
| $10,000 to $14,999 | 2 (2.1%) | 0 (0.0%) |
| $15,000 to $19,999 | 10 (10.7%) | 2 (6.1%) |
| $20,000 to $24,999 | 4 (4.3%) | 4 (12.1%) |
| $25,000 to $34,999 | 8 (8.6%) | 0 (0.0%) |
| $35,000 to $49,999 | 19 (20.4%) | 10 (30.3%) |
| $50,000 to $74,999 | 26 (28.0%) | 1 (3.0%) |
| $75,000 to $99,999 | 8 (8.6%) | 6 (18.2%) |
| $100,000 to $149,999 | 15 (16.1%) | 7 (21.2%) |
| $150,000 or more | 1 (1.1%) | 0 (0.0%) |
| Total | 93 (100.0%) | 33 (100.0%) |
Monthly Housing Cost Tiers in Mapleton borough
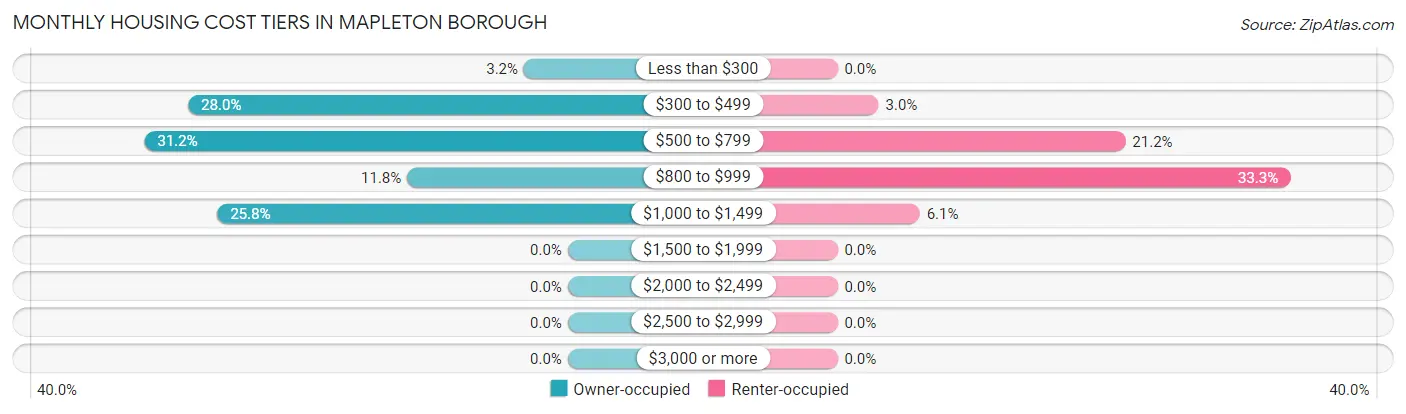
| Monthly Cost | Owner-occupied | Renter-occupied |
| Less than $300 | 3 (3.2%) | 0 (0.0%) |
| $300 to $499 | 26 (28.0%) | 1 (3.0%) |
| $500 to $799 | 29 (31.2%) | 7 (21.2%) |
| $800 to $999 | 11 (11.8%) | 11 (33.3%) |
| $1,000 to $1,499 | 24 (25.8%) | 2 (6.1%) |
| $1,500 to $1,999 | 0 (0.0%) | 0 (0.0%) |
| $2,000 to $2,499 | 0 (0.0%) | 0 (0.0%) |
| $2,500 to $2,999 | 0 (0.0%) | 0 (0.0%) |
| $3,000 or more | 0 (0.0%) | 0 (0.0%) |
| Total | 93 (100.0%) | 33 (100.0%) |
Physical Housing Characteristics in Mapleton borough
Housing Structures in Mapleton borough
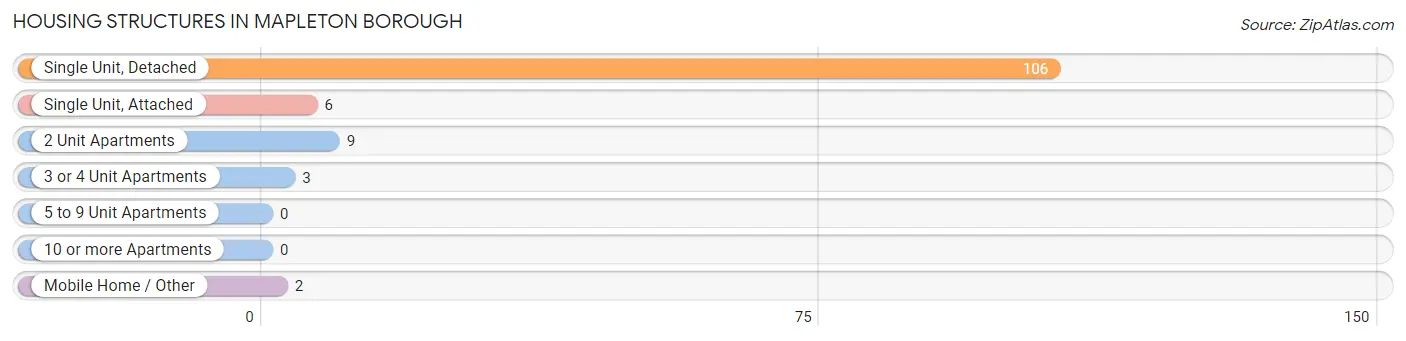
| Structure Type | # Housing Units | % Housing Units |
| Single Unit, Detached | 106 | 84.1% |
| Single Unit, Attached | 6 | 4.8% |
| 2 Unit Apartments | 9 | 7.1% |
| 3 or 4 Unit Apartments | 3 | 2.4% |
| 5 to 9 Unit Apartments | 0 | 0.0% |
| 10 or more Apartments | 0 | 0.0% |
| Mobile Home / Other | 2 | 1.6% |
| Total | 126 | 100.0% |
Housing Structures by Occupancy in Mapleton borough
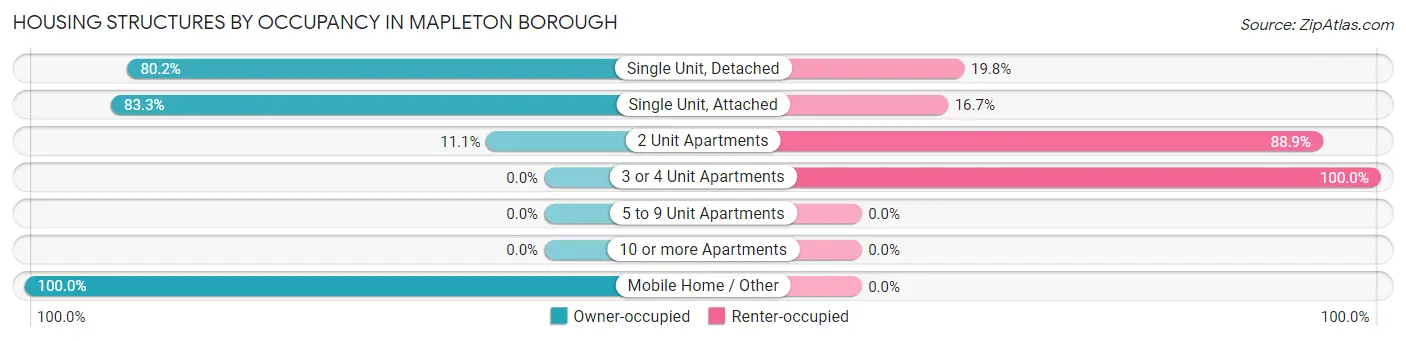
| Structure Type | Owner-occupied | Renter-occupied |
| Single Unit, Detached | 85 (80.2%) | 21 (19.8%) |
| Single Unit, Attached | 5 (83.3%) | 1 (16.7%) |
| 2 Unit Apartments | 1 (11.1%) | 8 (88.9%) |
| 3 or 4 Unit Apartments | 0 (0.0%) | 3 (100.0%) |
| 5 to 9 Unit Apartments | 0 (0.0%) | 0 (0.0%) |
| 10 or more Apartments | 0 (0.0%) | 0 (0.0%) |
| Mobile Home / Other | 2 (100.0%) | 0 (0.0%) |
| Total | 93 (73.8%) | 33 (26.2%) |
Housing Structures by Number of Rooms in Mapleton borough
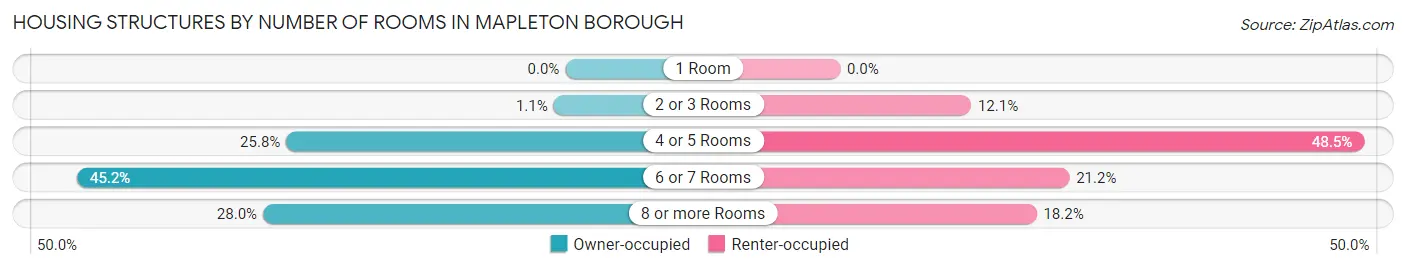
| Number of Rooms | Owner-occupied | Renter-occupied |
| 1 Room | 0 (0.0%) | 0 (0.0%) |
| 2 or 3 Rooms | 1 (1.1%) | 4 (12.1%) |
| 4 or 5 Rooms | 24 (25.8%) | 16 (48.5%) |
| 6 or 7 Rooms | 42 (45.2%) | 7 (21.2%) |
| 8 or more Rooms | 26 (28.0%) | 6 (18.2%) |
| Total | 93 (100.0%) | 33 (100.0%) |
Housing Structure by Heating Type in Mapleton borough
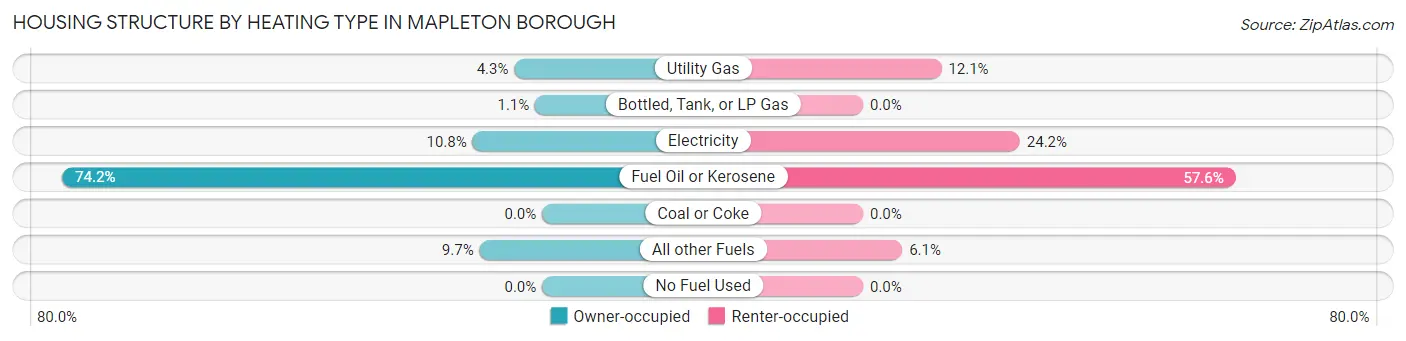
| Heating Type | Owner-occupied | Renter-occupied |
| Utility Gas | 4 (4.3%) | 4 (12.1%) |
| Bottled, Tank, or LP Gas | 1 (1.1%) | 0 (0.0%) |
| Electricity | 10 (10.7%) | 8 (24.2%) |
| Fuel Oil or Kerosene | 69 (74.2%) | 19 (57.6%) |
| Coal or Coke | 0 (0.0%) | 0 (0.0%) |
| All other Fuels | 9 (9.7%) | 2 (6.1%) |
| No Fuel Used | 0 (0.0%) | 0 (0.0%) |
| Total | 93 (100.0%) | 33 (100.0%) |
Household Vehicle Usage in Mapleton borough
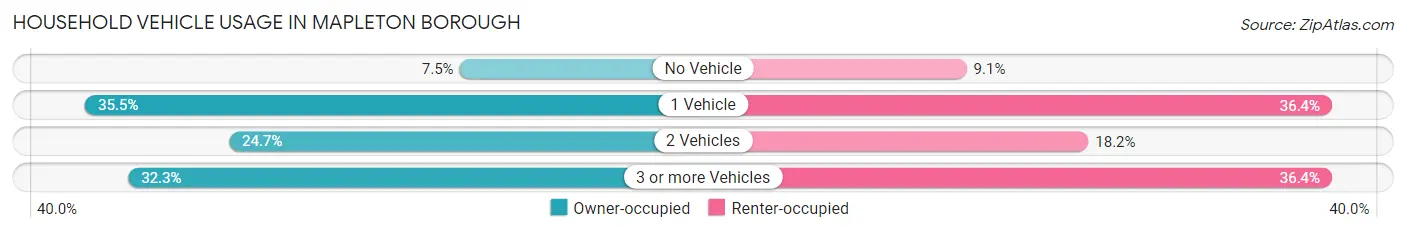
| Vehicles per Household | Owner-occupied | Renter-occupied |
| No Vehicle | 7 (7.5%) | 3 (9.1%) |
| 1 Vehicle | 33 (35.5%) | 12 (36.4%) |
| 2 Vehicles | 23 (24.7%) | 6 (18.2%) |
| 3 or more Vehicles | 30 (32.3%) | 12 (36.4%) |
| Total | 93 (100.0%) | 33 (100.0%) |
Real Estate & Mortgages in Mapleton borough
Real Estate and Mortgage Overview in Mapleton borough
| Characteristic | Without Mortgage | With Mortgage |
| Housing Units | 45 | 48 |
| Median Property Value | $64,200 | $95,000 |
| Median Household Income | $38,750 | $1 |
| Monthly Housing Costs | $428 | $0 |
| Real Estate Taxes | $875 | $0 |
Property Value by Mortgage Status in Mapleton borough
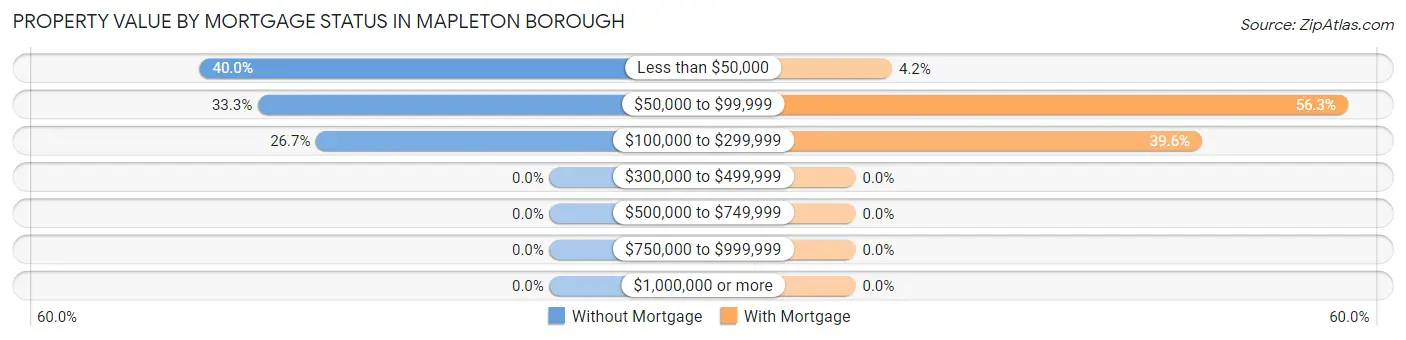
| Property Value | Without Mortgage | With Mortgage |
| Less than $50,000 | 18 (40.0%) | 2 (4.2%) |
| $50,000 to $99,999 | 15 (33.3%) | 27 (56.2%) |
| $100,000 to $299,999 | 12 (26.7%) | 19 (39.6%) |
| $300,000 to $499,999 | 0 (0.0%) | 0 (0.0%) |
| $500,000 to $749,999 | 0 (0.0%) | 0 (0.0%) |
| $750,000 to $999,999 | 0 (0.0%) | 0 (0.0%) |
| $1,000,000 or more | 0 (0.0%) | 0 (0.0%) |
| Total | 45 (100.0%) | 48 (100.0%) |
Household Income by Mortgage Status in Mapleton borough
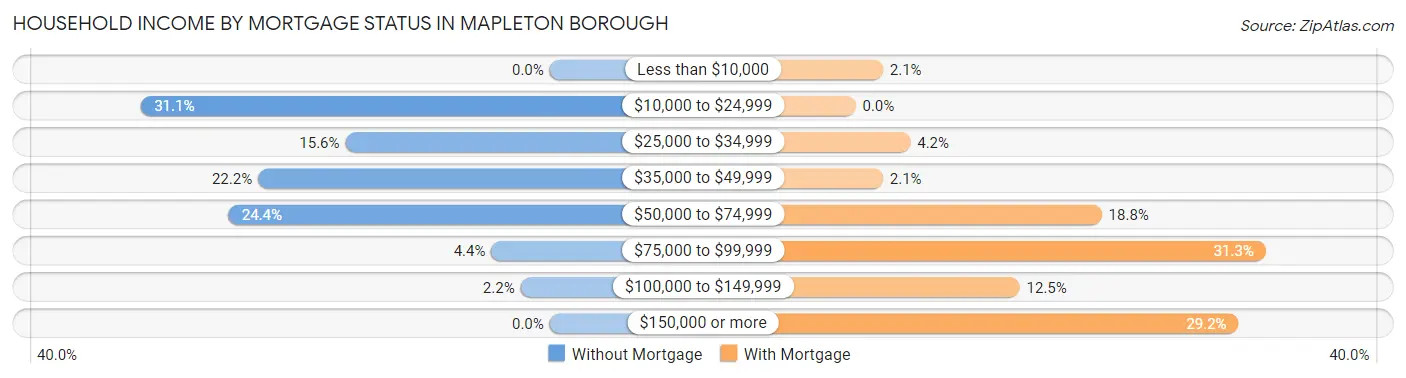
| Household Income | Without Mortgage | With Mortgage |
| Less than $10,000 | 0 (0.0%) | 1 (2.1%) |
| $10,000 to $24,999 | 14 (31.1%) | 0 (0.0%) |
| $25,000 to $34,999 | 7 (15.6%) | 2 (4.2%) |
| $35,000 to $49,999 | 10 (22.2%) | 1 (2.1%) |
| $50,000 to $74,999 | 11 (24.4%) | 9 (18.8%) |
| $75,000 to $99,999 | 2 (4.4%) | 15 (31.2%) |
| $100,000 to $149,999 | 1 (2.2%) | 6 (12.5%) |
| $150,000 or more | 0 (0.0%) | 14 (29.2%) |
| Total | 45 (100.0%) | 48 (100.0%) |
Property Value to Household Income Ratio in Mapleton borough
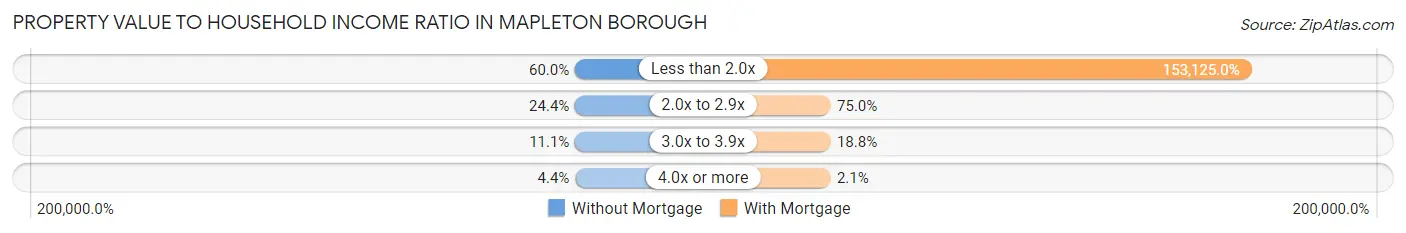
| Value-to-Income Ratio | Without Mortgage | With Mortgage |
| Less than 2.0x | 27 (60.0%) | 73,500 (153,125.0%) |
| 2.0x to 2.9x | 11 (24.4%) | 36 (75.0%) |
| 3.0x to 3.9x | 5 (11.1%) | 9 (18.8%) |
| 4.0x or more | 2 (4.4%) | 1 (2.1%) |
| Total | 45 (100.0%) | 48 (100.0%) |
Real Estate Taxes by Mortgage Status in Mapleton borough
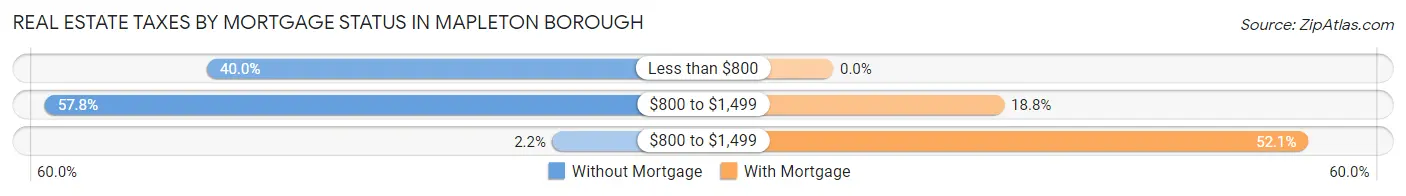
| Property Taxes | Without Mortgage | With Mortgage |
| Less than $800 | 18 (40.0%) | 0 (0.0%) |
| $800 to $1,499 | 26 (57.8%) | 9 (18.8%) |
| $800 to $1,499 | 1 (2.2%) | 25 (52.1%) |
| Total | 45 (100.0%) | 48 (100.0%) |
Health & Disability in Mapleton borough
Health Insurance Coverage by Age in Mapleton borough
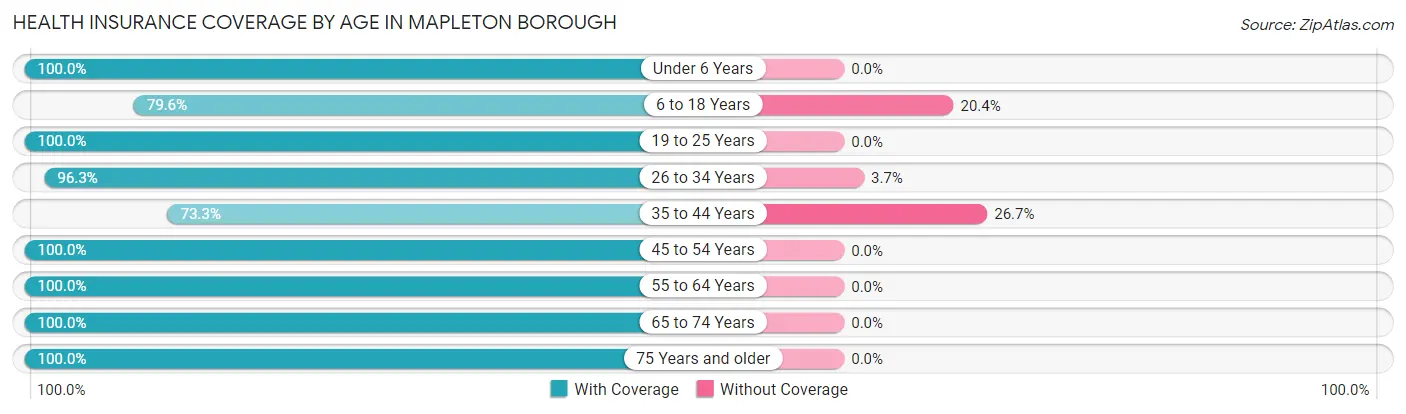
| Age Bracket | With Coverage | Without Coverage |
| Under 6 Years | 50 (100.0%) | 0 (0.0%) |
| 6 to 18 Years | 43 (79.6%) | 11 (20.4%) |
| 19 to 25 Years | 43 (100.0%) | 0 (0.0%) |
| 26 to 34 Years | 52 (96.3%) | 2 (3.7%) |
| 35 to 44 Years | 22 (73.3%) | 8 (26.7%) |
| 45 to 54 Years | 32 (100.0%) | 0 (0.0%) |
| 55 to 64 Years | 51 (100.0%) | 0 (0.0%) |
| 65 to 74 Years | 19 (100.0%) | 0 (0.0%) |
| 75 Years and older | 28 (100.0%) | 0 (0.0%) |
| Total | 340 (94.2%) | 21 (5.8%) |
Health Insurance Coverage by Citizenship Status in Mapleton borough
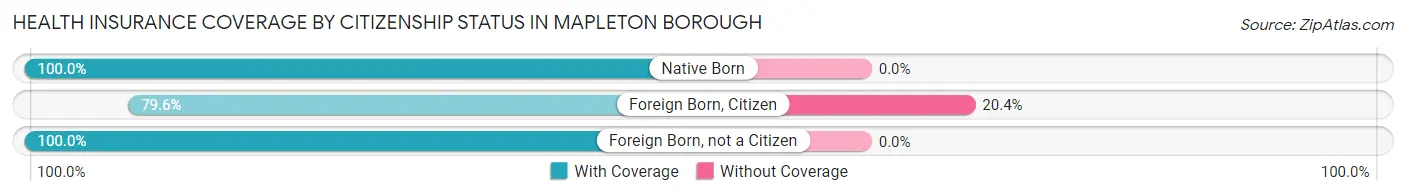
| Citizenship Status | With Coverage | Without Coverage |
| Native Born | 50 (100.0%) | 0 (0.0%) |
| Foreign Born, Citizen | 43 (79.6%) | 11 (20.4%) |
| Foreign Born, not a Citizen | 43 (100.0%) | 0 (0.0%) |
Health Insurance Coverage by Household Income in Mapleton borough
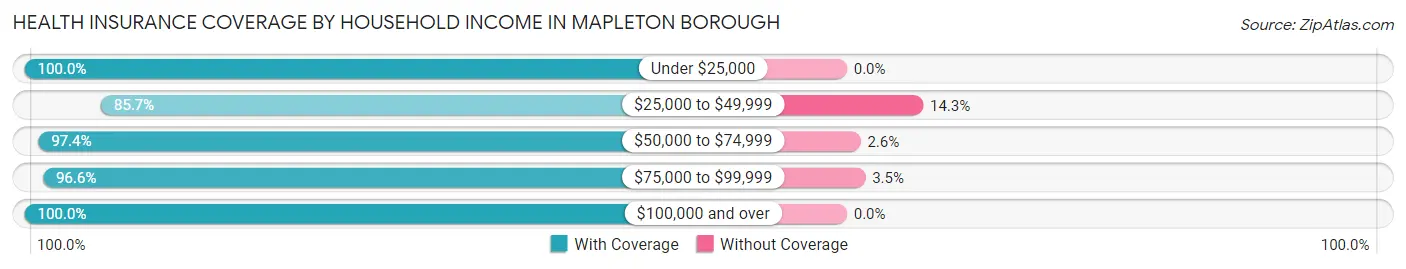
| Household Income | With Coverage | Without Coverage |
| Under $25,000 | 37 (100.0%) | 0 (0.0%) |
| $25,000 to $49,999 | 102 (85.7%) | 17 (14.3%) |
| $50,000 to $74,999 | 76 (97.4%) | 2 (2.6%) |
| $75,000 to $99,999 | 56 (96.6%) | 2 (3.5%) |
| $100,000 and over | 69 (100.0%) | 0 (0.0%) |
Public vs Private Health Insurance Coverage by Age in Mapleton borough
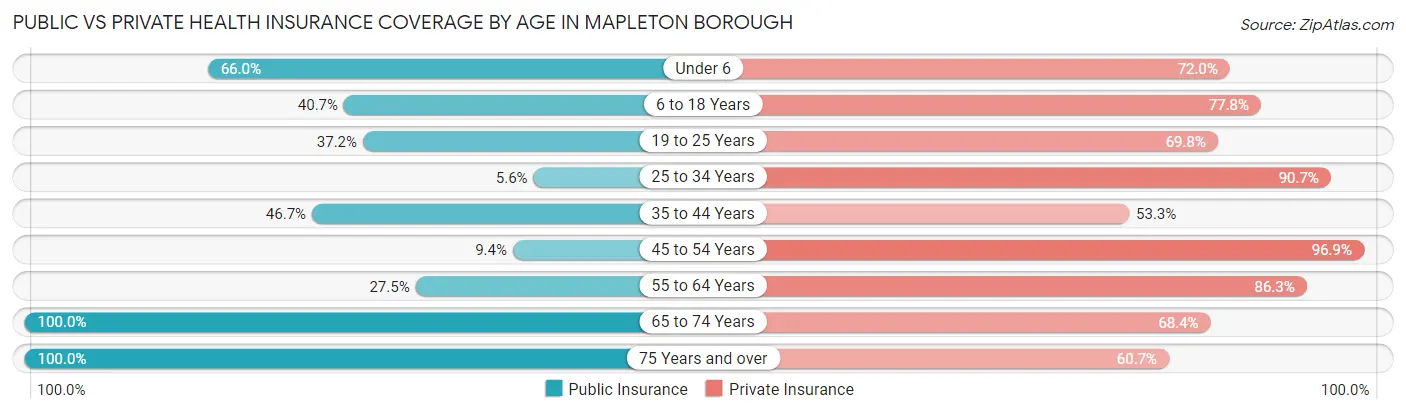
| Age Bracket | Public Insurance | Private Insurance |
| Under 6 | 33 (66.0%) | 36 (72.0%) |
| 6 to 18 Years | 22 (40.7%) | 42 (77.8%) |
| 19 to 25 Years | 16 (37.2%) | 30 (69.8%) |
| 25 to 34 Years | 3 (5.6%) | 49 (90.7%) |
| 35 to 44 Years | 14 (46.7%) | 16 (53.3%) |
| 45 to 54 Years | 3 (9.4%) | 31 (96.9%) |
| 55 to 64 Years | 14 (27.5%) | 44 (86.3%) |
| 65 to 74 Years | 19 (100.0%) | 13 (68.4%) |
| 75 Years and over | 28 (100.0%) | 17 (60.7%) |
| Total | 152 (42.1%) | 278 (77.0%) |
Disability Status by Sex by Age in Mapleton borough
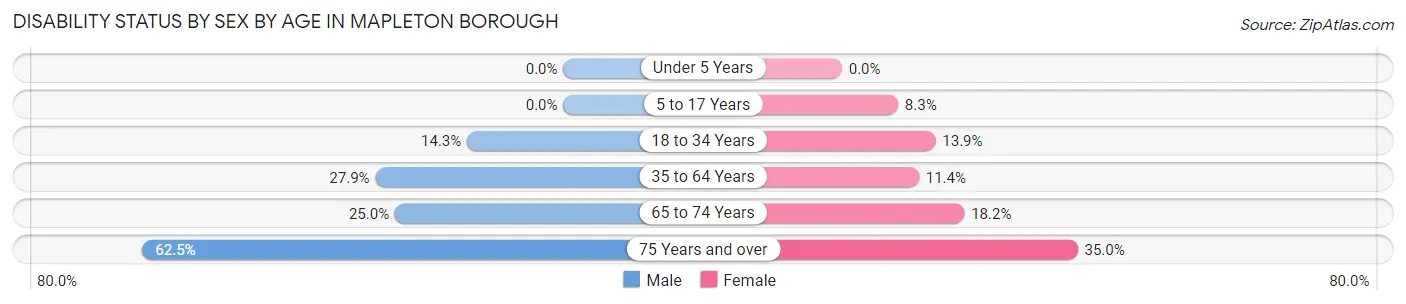
| Age Bracket | Male | Female |
| Under 5 Years | 0 (0.0%) | 0 (0.0%) |
| 5 to 17 Years | 0 (0.0%) | 2 (8.3%) |
| 18 to 34 Years | 10 (14.3%) | 5 (13.9%) |
| 35 to 64 Years | 12 (27.9%) | 8 (11.4%) |
| 65 to 74 Years | 2 (25.0%) | 2 (18.2%) |
| 75 Years and over | 5 (62.5%) | 7 (35.0%) |
Disability Class by Sex by Age in Mapleton borough
Disability Class: Hearing Difficulty
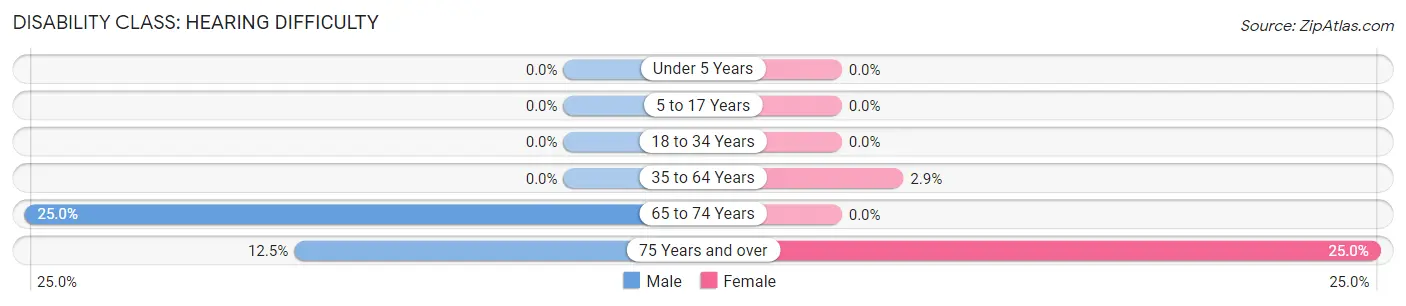
| Age Bracket | Male | Female |
| Under 5 Years | 0 (0.0%) | 0 (0.0%) |
| 5 to 17 Years | 0 (0.0%) | 0 (0.0%) |
| 18 to 34 Years | 0 (0.0%) | 0 (0.0%) |
| 35 to 64 Years | 0 (0.0%) | 2 (2.9%) |
| 65 to 74 Years | 2 (25.0%) | 0 (0.0%) |
| 75 Years and over | 1 (12.5%) | 5 (25.0%) |
Disability Class: Vision Difficulty
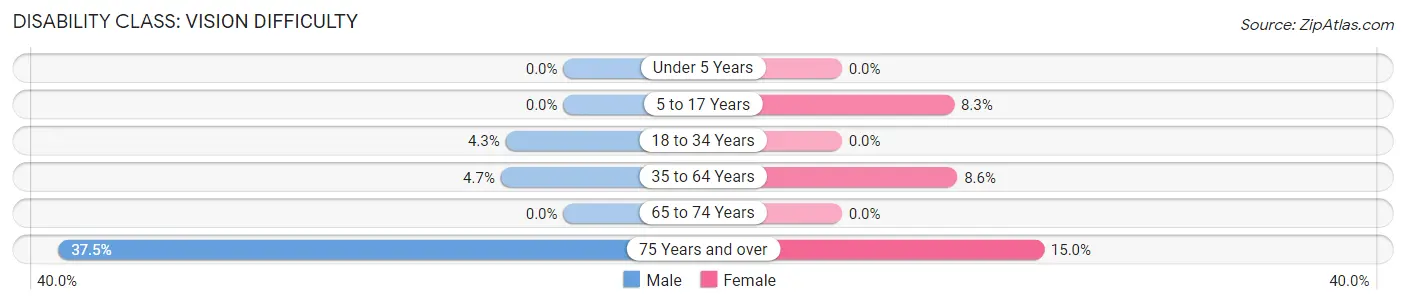
| Age Bracket | Male | Female |
| Under 5 Years | 0 (0.0%) | 0 (0.0%) |
| 5 to 17 Years | 0 (0.0%) | 2 (8.3%) |
| 18 to 34 Years | 3 (4.3%) | 0 (0.0%) |
| 35 to 64 Years | 2 (4.6%) | 6 (8.6%) |
| 65 to 74 Years | 0 (0.0%) | 0 (0.0%) |
| 75 Years and over | 3 (37.5%) | 3 (15.0%) |
Disability Class: Cognitive Difficulty
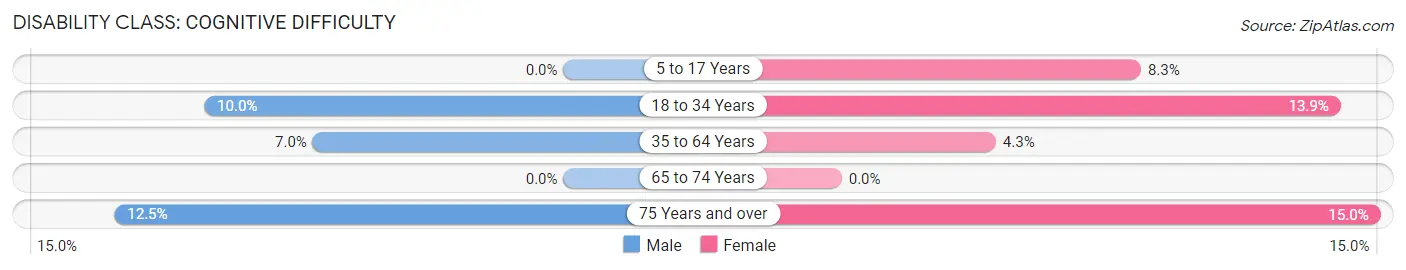
| Age Bracket | Male | Female |
| 5 to 17 Years | 0 (0.0%) | 2 (8.3%) |
| 18 to 34 Years | 7 (10.0%) | 5 (13.9%) |
| 35 to 64 Years | 3 (7.0%) | 3 (4.3%) |
| 65 to 74 Years | 0 (0.0%) | 0 (0.0%) |
| 75 Years and over | 1 (12.5%) | 3 (15.0%) |
Disability Class: Ambulatory Difficulty
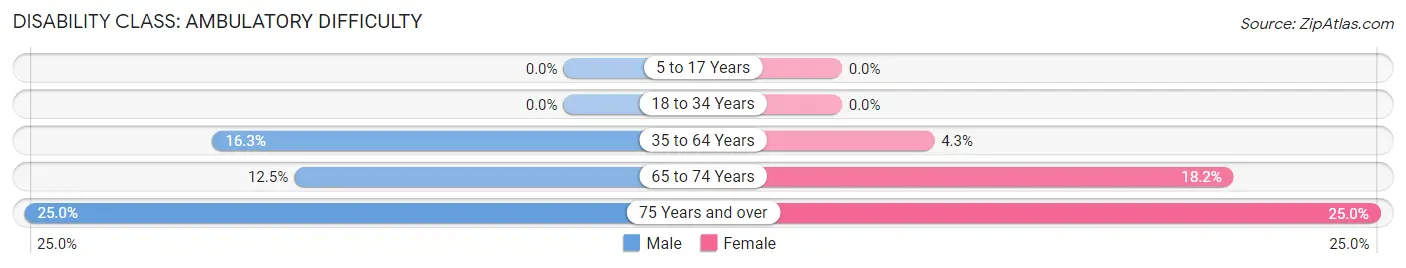
| Age Bracket | Male | Female |
| 5 to 17 Years | 0 (0.0%) | 0 (0.0%) |
| 18 to 34 Years | 0 (0.0%) | 0 (0.0%) |
| 35 to 64 Years | 7 (16.3%) | 3 (4.3%) |
| 65 to 74 Years | 1 (12.5%) | 2 (18.2%) |
| 75 Years and over | 2 (25.0%) | 5 (25.0%) |
Disability Class: Self-Care Difficulty
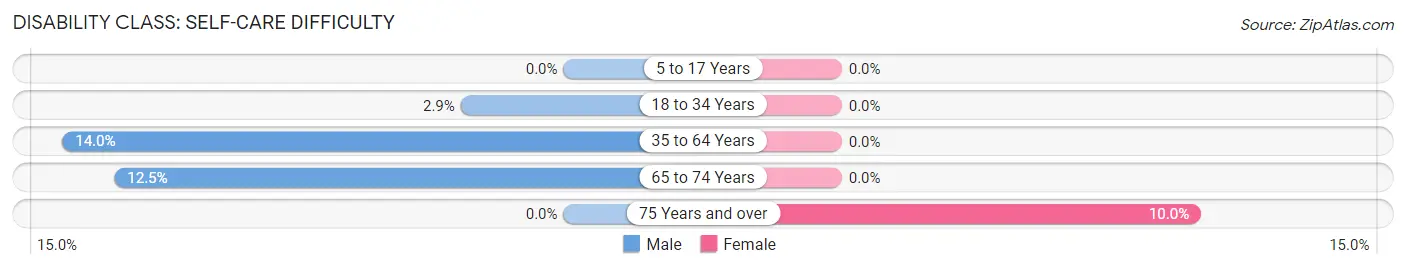
| Age Bracket | Male | Female |
| 5 to 17 Years | 0 (0.0%) | 0 (0.0%) |
| 18 to 34 Years | 2 (2.9%) | 0 (0.0%) |
| 35 to 64 Years | 6 (14.0%) | 0 (0.0%) |
| 65 to 74 Years | 1 (12.5%) | 0 (0.0%) |
| 75 Years and over | 0 (0.0%) | 2 (10.0%) |
Technology Access in Mapleton borough
Computing Device Access in Mapleton borough
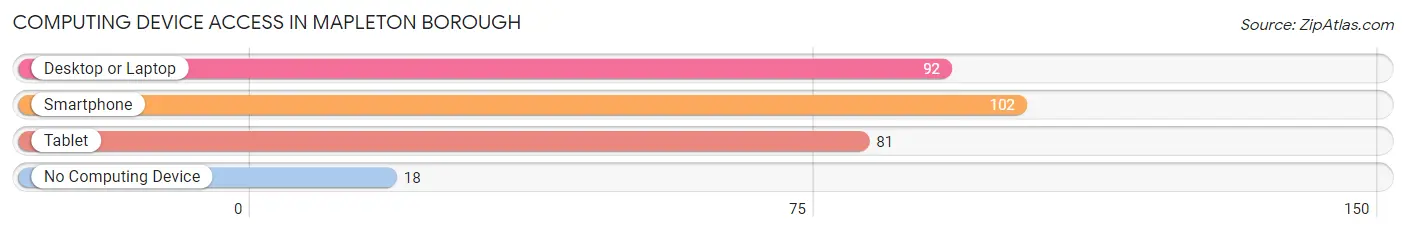
| Device Type | # Households | % Households |
| Desktop or Laptop | 92 | 73.0% |
| Smartphone | 102 | 80.9% |
| Tablet | 81 | 64.3% |
| No Computing Device | 18 | 14.3% |
| Total | 126 | 100.0% |
Internet Access in Mapleton borough
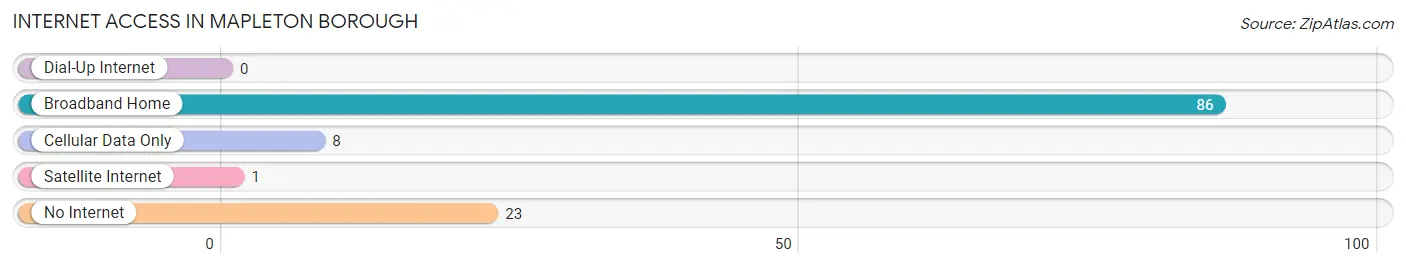
| Internet Type | # Households | % Households |
| Dial-Up Internet | 0 | 0.0% |
| Broadband Home | 86 | 68.2% |
| Cellular Data Only | 8 | 6.4% |
| Satellite Internet | 1 | 0.8% |
| No Internet | 23 | 18.2% |
| Total | 126 | 100.0% |
Mapleton borough Summary
Mapleton Borough is a small borough located in Fayette County, Pennsylvania. It is situated in the southwestern corner of the county, and is bordered by the townships of Bullskin, Connellsville, and Saltlick. The borough was incorporated in 1876 and has a population of approximately 1,000 people.
History
Mapleton Borough was first settled in the late 1700s by a group of German immigrants. The town was originally known as “Maple Grove” and was part of Bullskin Township. In 1876, the town was officially incorporated as Mapleton Borough. The town was named after the abundance of maple trees in the area.
In the late 1800s, Mapleton Borough was a thriving coal mining town. The coal industry was the main source of employment for the town’s residents. The town also had a number of small businesses, including a general store, a blacksmith shop, and a hotel.
In the early 1900s, the coal industry began to decline and many of the town’s residents moved away in search of work. The town’s population decreased significantly and the town’s economy suffered.
In the late 1900s, the town began to experience a resurgence. The town’s population began to increase and new businesses began to open. The town also began to attract tourists, who were drawn to the town’s rural charm and its proximity to the nearby Youghiogheny River.
Geography
Mapleton Borough is located in the southwestern corner of Fayette County, Pennsylvania. The borough is bordered by the townships of Bullskin, Connellsville, and Saltlick. The borough is situated in the foothills of the Allegheny Mountains and is surrounded by rolling hills and forests.
The borough is located approximately 25 miles south of Pittsburgh and is accessible via Interstate 70 and U.S. Route 40. The borough is also served by the Connellsville Area School District.
Economy
Mapleton Borough’s economy is largely based on tourism. The town is a popular destination for outdoor enthusiasts, who come to enjoy the town’s rural charm and its proximity to the nearby Youghiogheny River. The town also has a number of small businesses, including restaurants, shops, and galleries.
The town is also home to a number of small manufacturing companies, which produce a variety of products, including furniture, clothing, and electronics.
Demographics
As of the 2010 census, Mapleton Borough had a population of 1,000 people. The racial makeup of the borough was 97.2% White, 0.7% African American, 0.2% Native American, 0.2% Asian, 0.2% from other races, and 1.7% from two or more races. Hispanic or Latino of any race were 0.7% of the population.
The median household income in Mapleton Borough was $37,500, and the median family income was $45,000. The per capita income for the borough was $18,000. About 10.2% of families and 12.2% of the population were below the poverty line, including 16.7% of those under age 18 and 8.3% of those age 65 or over.
Mapleton Borough is a small, rural borough with a rich history and a vibrant economy. The town is a popular destination for outdoor enthusiasts and is home to a number of small businesses. The town’s population is diverse and the median household income is slightly above the national average.
Common Questions
What is Per Capita Income in Mapleton borough?
Per Capita income in Mapleton borough is $24,137.
What is the Median Family Income in Mapleton borough?
Median Family Income in Mapleton borough is $61,250.
What is the Median Household income in Mapleton borough?
Median Household Income in Mapleton borough is $51,250.
What is Income or Wage Gap in Mapleton borough?
Income or Wage Gap in Mapleton borough is 10.2%.
Women in Mapleton borough earn 89.8 cents for every dollar earned by a man.
What is Inequality or Gini Index in Mapleton borough?
Inequality or Gini Index in Mapleton borough is 0.35.
What is the Total Population of Mapleton borough?
Total Population of Mapleton borough is 361.
What is the Total Male Population of Mapleton borough?
Total Male Population of Mapleton borough is 182.
What is the Total Female Population of Mapleton borough?
Total Female Population of Mapleton borough is 179.
What is the Ratio of Males per 100 Females in Mapleton borough?
There are 101.68 Males per 100 Females in Mapleton borough.
What is the Ratio of Females per 100 Males in Mapleton borough?
There are 98.35 Females per 100 Males in Mapleton borough.
What is the Median Population Age in Mapleton borough?
Median Population Age in Mapleton borough is 29.9 Years.
What is the Average Family Size in Mapleton borough
Average Family Size in Mapleton borough is 3.6 People.
What is the Average Household Size in Mapleton borough
Average Household Size in Mapleton borough is 2.9 People.
How Large is the Labor Force in Mapleton borough?
There are 191 People in the Labor Forcein in Mapleton borough.
What is the Percentage of People in the Labor Force in Mapleton borough?
69.7% of People are in the Labor Force in Mapleton borough.
What is the Unemployment Rate in Mapleton borough?
Unemployment Rate in Mapleton borough is 7.3%.