Cities with the Highest Percentage of Population Employed in Administrative & Support Services in Minnesota
RELATED REPORTS & OPTIONS
Administrative & Support Services
Minnesota
Compare Cities
Map of Cities with the Highest Percentage of Population Employed in Administrative & Support Services in Minnesota
0.0%
100.0%
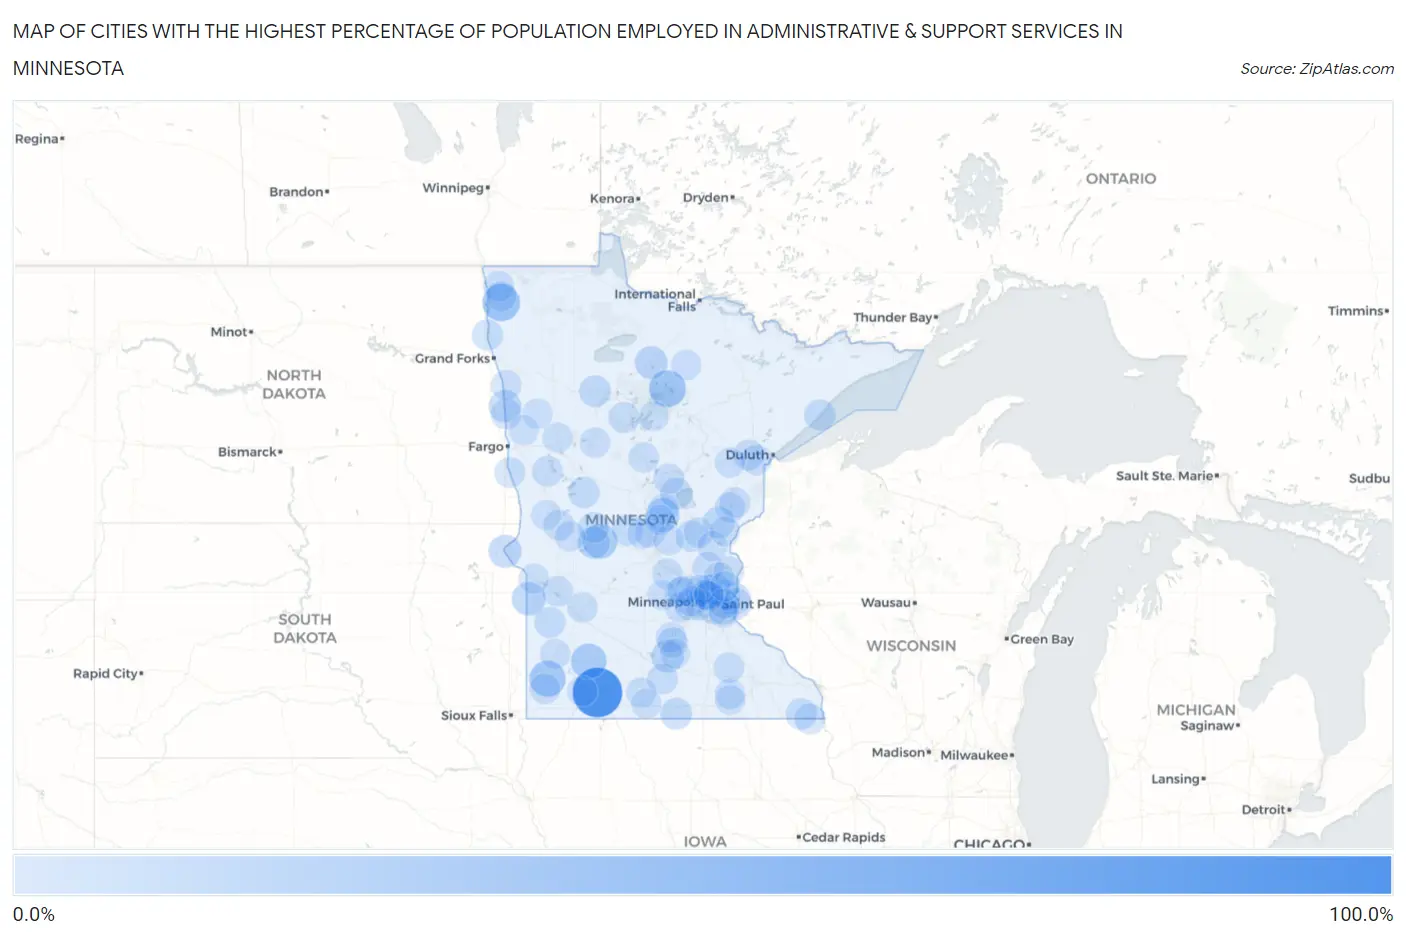
Cities with the Highest Percentage of Population Employed in Administrative & Support Services in Minnesota
| City | % Employed | vs State | vs National | |
| 1. | Wilder | 81.8% | 3.0%(+78.8)#1 | 4.1%(+77.7)#14 |
| 2. | Donaldson | 33.3% | 3.0%(+30.3)#2 | 4.1%(+29.2)#145 |
| 3. | Inger | 30.8% | 3.0%(+27.7)#3 | 4.1%(+26.6)#174 |
| 4. | Woodstock | 28.0% | 3.0%(+25.0)#4 | 4.1%(+23.9)#224 |
| 5. | Revere | 25.0% | 3.0%(+22.0)#5 | 4.1%(+20.9)#284 |
| 6. | Westport | 22.7% | 3.0%(+19.7)#6 | 4.1%(+18.6)#356 |
| 7. | Lastrup | 18.9% | 3.0%(+15.8)#7 | 4.1%(+14.7)#490 |
| 8. | Marietta | 18.2% | 3.0%(+15.1)#8 | 4.1%(+14.0)#532 |
| 9. | Browns Valley | 15.7% | 3.0%(+12.6)#9 | 4.1%(+11.5)#713 |
| 10. | Northome | 15.0% | 3.0%(+11.9)#10 | 4.1%(+10.8)#798 |
| 11. | Kasota | 13.8% | 3.0%(+10.7)#11 | 4.1%(+9.63)#972 |
| 12. | Villard | 13.7% | 3.0%(+10.6)#12 | 4.1%(+9.53)#999 |
| 13. | Halstad | 13.7% | 3.0%(+10.6)#13 | 4.1%(+9.50)#1,001 |
| 14. | Shevlin | 12.2% | 3.0%(+9.15)#14 | 4.1%(+8.05)#1,270 |
| 15. | Hilltop | 12.0% | 3.0%(+8.99)#15 | 4.1%(+7.88)#1,303 |
| 16. | Brook Park | 11.9% | 3.0%(+8.90)#16 | 4.1%(+7.79)#1,326 |
| 17. | Garrison | 11.9% | 3.0%(+8.86)#17 | 4.1%(+7.75)#1,331 |
| 18. | Bricelyn | 11.3% | 3.0%(+8.29)#18 | 4.1%(+7.18)#1,461 |
| 19. | Henning | 10.5% | 3.0%(+7.42)#19 | 4.1%(+6.31)#1,716 |
| 20. | Beaver Bay | 10.3% | 3.0%(+7.30)#20 | 4.1%(+6.20)#1,768 |
| 21. | Bayport | 9.7% | 3.0%(+6.66)#21 | 4.1%(+5.55)#2,033 |
| 22. | Burtrum | 9.5% | 3.0%(+6.48)#22 | 4.1%(+5.37)#2,116 |
| 23. | Spring Grove | 9.3% | 3.0%(+6.22)#23 | 4.1%(+5.12)#2,232 |
| 24. | Nelson | 9.3% | 3.0%(+6.22)#24 | 4.1%(+5.11)#2,235 |
| 25. | Oslo | 8.8% | 3.0%(+5.78)#25 | 4.1%(+4.67)#2,486 |
| 26. | St Leo | 8.8% | 3.0%(+5.73)#26 | 4.1%(+4.62)#2,509 |
| 27. | Bock | 8.7% | 3.0%(+5.65)#27 | 4.1%(+4.55)#2,561 |
| 28. | Circle Pines | 8.6% | 3.0%(+5.59)#28 | 4.1%(+4.48)#2,593 |
| 29. | Mendota | 8.6% | 3.0%(+5.53)#29 | 4.1%(+4.42)#2,637 |
| 30. | Eitzen | 8.5% | 3.0%(+5.48)#30 | 4.1%(+4.38)#2,664 |
| 31. | Lakeland | 8.4% | 3.0%(+5.39)#31 | 4.1%(+4.28)#2,712 |
| 32. | Hendrum | 8.3% | 3.0%(+5.29)#32 | 4.1%(+4.18)#2,790 |
| 33. | Wolverton | 8.2% | 3.0%(+5.18)#33 | 4.1%(+4.07)#2,862 |
| 34. | Henderson | 7.8% | 3.0%(+4.79)#34 | 4.1%(+3.68)#3,125 |
| 35. | Crosby | 7.8% | 3.0%(+4.76)#35 | 4.1%(+3.65)#3,147 |
| 36. | Pelican Rapids | 7.8% | 3.0%(+4.72)#36 | 4.1%(+3.61)#3,175 |
| 37. | West Concord | 7.8% | 3.0%(+4.71)#37 | 4.1%(+3.60)#3,181 |
| 38. | Bethel | 7.7% | 3.0%(+4.70)#38 | 4.1%(+3.60)#3,187 |
| 39. | Mahnomen | 7.7% | 3.0%(+4.65)#39 | 4.1%(+3.54)#3,224 |
| 40. | Laporte | 7.7% | 3.0%(+4.65)#40 | 4.1%(+3.54)#3,233 |
| 41. | Hallock | 7.7% | 3.0%(+4.63)#41 | 4.1%(+3.52)#3,249 |
| 42. | Good Thunder | 7.6% | 3.0%(+4.56)#42 | 4.1%(+3.45)#3,307 |
| 43. | Silver Creek | 7.6% | 3.0%(+4.53)#43 | 4.1%(+3.43)#3,321 |
| 44. | Edgerton | 7.5% | 3.0%(+4.48)#44 | 4.1%(+3.38)#3,363 |
| 45. | Askov | 7.5% | 3.0%(+4.48)#45 | 4.1%(+3.37)#3,372 |
| 46. | Minnetonka Beach | 7.5% | 3.0%(+4.46)#46 | 4.1%(+3.35)#3,394 |
| 47. | Milan | 7.5% | 3.0%(+4.41)#47 | 4.1%(+3.30)#3,447 |
| 48. | Barrett | 7.4% | 3.0%(+4.37)#48 | 4.1%(+3.26)#3,488 |
| 49. | Chickamaw Beach | 7.1% | 3.0%(+4.10)#49 | 4.1%(+2.99)#3,750 |
| 50. | Scanlon | 7.1% | 3.0%(+4.02)#50 | 4.1%(+2.91)#3,838 |
| 51. | Maynard | 7.1% | 3.0%(+4.01)#51 | 4.1%(+2.90)#3,853 |
| 52. | Kensington | 6.9% | 3.0%(+3.85)#52 | 4.1%(+2.75)#3,994 |
| 53. | Harding | 6.9% | 3.0%(+3.85)#53 | 4.1%(+2.75)#3,997 |
| 54. | Sandstone | 6.9% | 3.0%(+3.83)#54 | 4.1%(+2.72)#4,022 |
| 55. | Corcoran | 6.8% | 3.0%(+3.77)#55 | 4.1%(+2.66)#4,085 |
| 56. | Ogilvie | 6.8% | 3.0%(+3.74)#56 | 4.1%(+2.64)#4,106 |
| 57. | Royalton | 6.8% | 3.0%(+3.73)#57 | 4.1%(+2.62)#4,131 |
| 58. | Rockford | 6.8% | 3.0%(+3.72)#58 | 4.1%(+2.61)#4,138 |
| 59. | Willernie | 6.8% | 3.0%(+3.71)#59 | 4.1%(+2.61)#4,142 |
| 60. | Bowlus | 6.6% | 3.0%(+3.54)#60 | 4.1%(+2.43)#4,353 |
| 61. | Le Sueur | 6.5% | 3.0%(+3.47)#61 | 4.1%(+2.36)#4,433 |
| 62. | Kennedy | 6.5% | 3.0%(+3.44)#62 | 4.1%(+2.33)#4,465 |
| 63. | Gilman | 6.5% | 3.0%(+3.41)#63 | 4.1%(+2.30)#4,504 |
| 64. | Spring Lake Park | 6.4% | 3.0%(+3.37)#64 | 4.1%(+2.27)#4,551 |
| 65. | Columbus | 6.4% | 3.0%(+3.36)#65 | 4.1%(+2.26)#4,564 |
| 66. | Stanchfield | 6.4% | 3.0%(+3.34)#66 | 4.1%(+2.23)#4,586 |
| 67. | Callaway | 6.3% | 3.0%(+3.31)#67 | 4.1%(+2.20)#4,626 |
| 68. | Osage | 6.3% | 3.0%(+3.29)#68 | 4.1%(+2.18)#4,658 |
| 69. | Climax | 6.3% | 3.0%(+3.29)#69 | 4.1%(+2.18)#4,661 |
| 70. | Waltham | 6.3% | 3.0%(+3.27)#70 | 4.1%(+2.17)#4,674 |
| 71. | St Paul Park | 6.3% | 3.0%(+3.25)#71 | 4.1%(+2.14)#4,708 |
| 72. | Truman | 6.3% | 3.0%(+3.25)#72 | 4.1%(+2.14)#4,712 |
| 73. | St Anthony City Hennepin And Ramsey Counties | 6.3% | 3.0%(+3.25)#73 | 4.1%(+2.14)#4,717 |
| 74. | St Bonifacius | 6.3% | 3.0%(+3.23)#74 | 4.1%(+2.12)#4,740 |
| 75. | Russell | 6.2% | 3.0%(+3.16)#75 | 4.1%(+2.06)#4,825 |
| 76. | Pierz | 6.2% | 3.0%(+3.12)#76 | 4.1%(+2.01)#4,892 |
| 77. | Effie | 6.1% | 3.0%(+3.08)#77 | 4.1%(+1.97)#4,949 |
| 78. | Chisago City | 6.1% | 3.0%(+3.03)#78 | 4.1%(+1.92)#5,025 |
| 79. | Cromwell | 6.1% | 3.0%(+3.02)#79 | 4.1%(+1.91)#5,042 |
| 80. | Osseo | 6.0% | 3.0%(+2.98)#80 | 4.1%(+1.87)#5,110 |
| 81. | Odessa | 6.0% | 3.0%(+2.96)#81 | 4.1%(+1.85)#5,152 |
| 82. | Hopkins | 5.9% | 3.0%(+2.88)#82 | 4.1%(+1.78)#5,275 |
| 83. | Howard Lake | 5.9% | 3.0%(+2.84)#83 | 4.1%(+1.73)#5,323 |
| 84. | Newport | 5.9% | 3.0%(+2.83)#84 | 4.1%(+1.72)#5,352 |
| 85. | Fridley | 5.8% | 3.0%(+2.81)#85 | 4.1%(+1.70)#5,385 |
| 86. | Brooklyn Center | 5.8% | 3.0%(+2.76)#86 | 4.1%(+1.65)#5,457 |
| 87. | Twin Valley | 5.8% | 3.0%(+2.75)#87 | 4.1%(+1.64)#5,470 |
| 88. | Long Lake | 5.8% | 3.0%(+2.75)#88 | 4.1%(+1.64)#5,476 |
| 89. | Landfall | 5.8% | 3.0%(+2.71)#89 | 4.1%(+1.60)#5,532 |
| 90. | Felton | 5.7% | 3.0%(+2.70)#90 | 4.1%(+1.60)#5,541 |
| 91. | Pine City | 5.7% | 3.0%(+2.69)#91 | 4.1%(+1.58)#5,565 |
| 92. | Wendell | 5.7% | 3.0%(+2.67)#92 | 4.1%(+1.56)#5,600 |
| 93. | Dundee | 5.7% | 3.0%(+2.67)#93 | 4.1%(+1.56)#5,604 |
| 94. | Hugo | 5.6% | 3.0%(+2.58)#94 | 4.1%(+1.47)#5,768 |
| 95. | Granada | 5.6% | 3.0%(+2.57)#95 | 4.1%(+1.46)#5,784 |
| 96. | Brownsdale | 5.6% | 3.0%(+2.56)#96 | 4.1%(+1.46)#5,789 |
| 97. | Cleveland | 5.6% | 3.0%(+2.53)#97 | 4.1%(+1.42)#5,854 |
| 98. | Greenfield | 5.5% | 3.0%(+2.46)#98 | 4.1%(+1.36)#5,979 |
| 99. | Federal Dam | 5.5% | 3.0%(+2.41)#99 | 4.1%(+1.30)#6,089 |
| 100. | Columbia Heights | 5.4% | 3.0%(+2.35)#100 | 4.1%(+1.24)#6,203 |
Common Questions
What are the Top 10 Cities with the Highest Percentage of Population Employed in Administrative & Support Services in Minnesota?
Top 10 Cities with the Highest Percentage of Population Employed in Administrative & Support Services in Minnesota are:
What city has the Highest Percentage of Population Employed in Administrative & Support Services in Minnesota?
Wilder has the Highest Percentage of Population Employed in Administrative & Support Services in Minnesota with 81.8%.
What is the Percentage of Population Employed in Administrative & Support Services in the State of Minnesota?
Percentage of Population Employed in Administrative & Support Services in Minnesota is 3.0%.
What is the Percentage of Population Employed in Administrative & Support Services in the United States?
Percentage of Population Employed in Administrative & Support Services in the United States is 4.1%.