Cities with the Highest Percentage of Population Employed in Administrative & Support Services in North Carolina
RELATED REPORTS & OPTIONS
Administrative & Support Services
North Carolina
Compare Cities
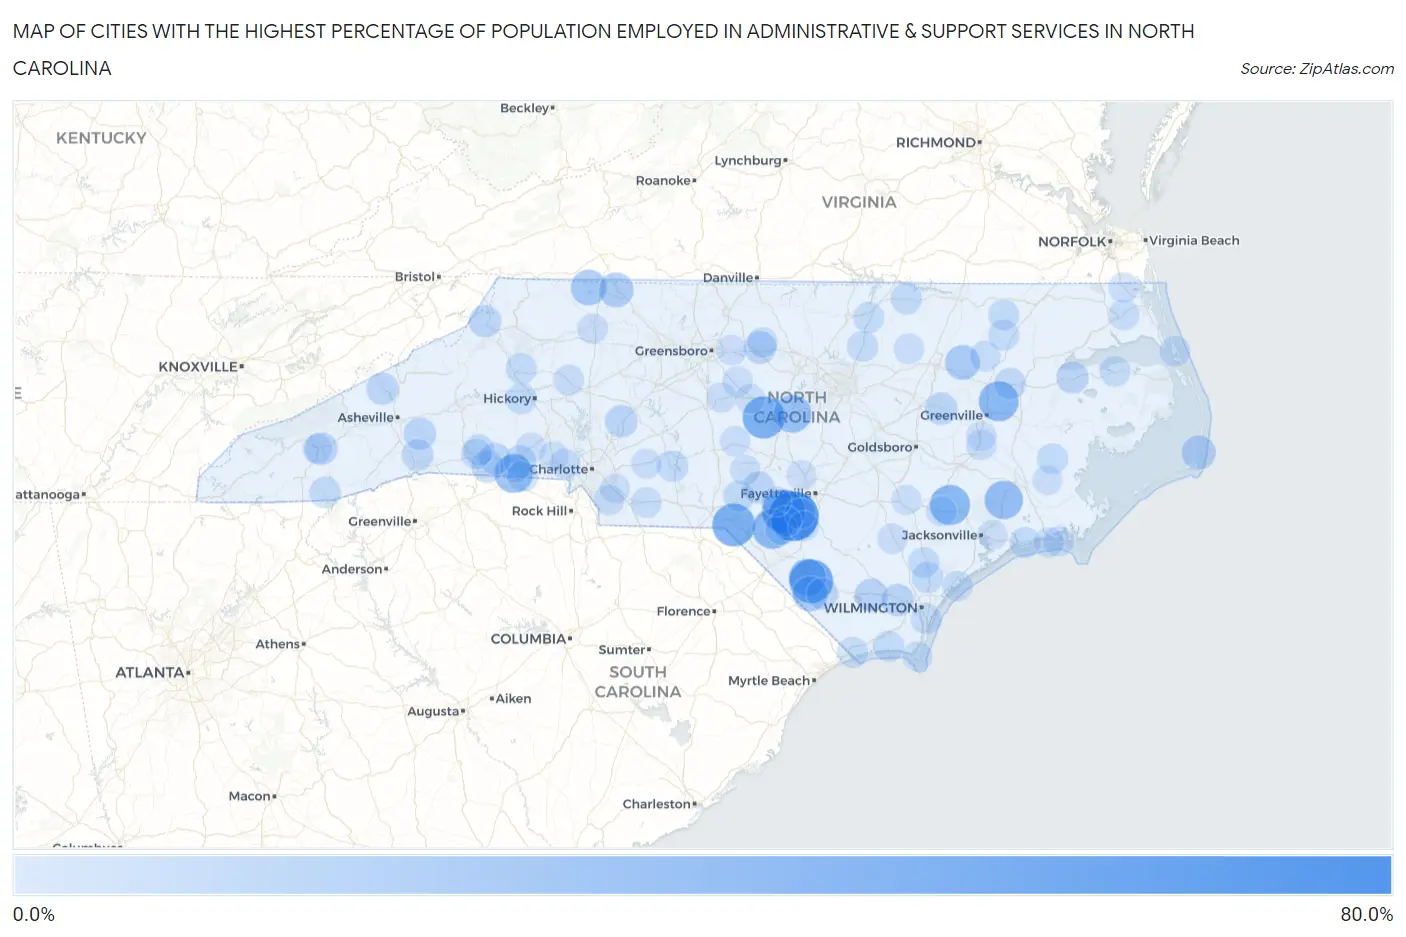
Map of Cities with the Highest Percentage of Population Employed in Administrative & Support Services in North Carolina
0.0%
80.0%
Cities with the Highest Percentage of Population Employed in Administrative & Support Services in North Carolina
| City | % Employed | vs State | vs National | |
| 1. | Lumber Bridge | 73.9% | 4.3%(+69.6)#1 | 4.1%(+69.8)#22 |
| 2. | Evergreen | 53.6% | 4.3%(+49.3)#2 | 4.1%(+49.4)#44 |
| 3. | Dundarrach | 52.9% | 4.3%(+48.7)#3 | 4.1%(+48.8)#48 |
| 4. | Old Hundred | 50.0% | 4.3%(+45.7)#4 | 4.1%(+45.9)#57 |
| 5. | Goldston | 48.2% | 4.3%(+44.0)#5 | 4.1%(+44.1)#67 |
| 6. | Potters Hill | 41.2% | 4.3%(+36.9)#6 | 4.1%(+37.0)#101 |
| 7. | Wakulla | 41.0% | 4.3%(+36.7)#7 | 4.1%(+36.8)#103 |
| 8. | Stokes | 40.2% | 4.3%(+35.9)#8 | 4.1%(+36.1)#107 |
| 9. | Earl | 35.7% | 4.3%(+31.4)#9 | 4.1%(+31.5)#126 |
| 10. | Pollocksville | 34.8% | 4.3%(+30.6)#10 | 4.1%(+30.7)#128 |
| 11. | Moncure | 33.1% | 4.3%(+28.8)#11 | 4.1%(+28.9)#146 |
| 12. | Boardman | 31.5% | 4.3%(+27.3)#12 | 4.1%(+27.4)#165 |
| 13. | Smithtown | 29.5% | 4.3%(+25.3)#13 | 4.1%(+25.4)#188 |
| 14. | Lowgap | 26.2% | 4.3%(+21.9)#14 | 4.1%(+22.0)#257 |
| 15. | Cerro Gordo | 24.5% | 4.3%(+20.2)#15 | 4.1%(+20.3)#299 |
| 16. | Leggett | 23.5% | 4.3%(+19.3)#16 | 4.1%(+19.4)#325 |
| 17. | Toast | 22.5% | 4.3%(+18.2)#17 | 4.1%(+18.4)#358 |
| 18. | Avon | 20.6% | 4.3%(+16.3)#18 | 4.1%(+16.4)#420 |
| 19. | Bolton | 16.6% | 4.3%(+12.3)#19 | 4.1%(+12.4)#643 |
| 20. | Sylva | 16.4% | 4.3%(+12.2)#20 | 4.1%(+12.3)#651 |
| 21. | Cape Colony | 16.1% | 4.3%(+11.8)#21 | 4.1%(+11.9)#681 |
| 22. | Haw River | 16.0% | 4.3%(+11.7)#22 | 4.1%(+11.9)#683 |
| 23. | China Grove | 15.7% | 4.3%(+11.4)#23 | 4.1%(+11.5)#716 |
| 24. | Saratoga | 15.4% | 4.3%(+11.2)#24 | 4.1%(+11.3)#747 |
| 25. | Gerton | 15.4% | 4.3%(+11.1)#25 | 4.1%(+11.2)#754 |
| 26. | Sandy Creek | 15.3% | 4.3%(+11.0)#26 | 4.1%(+11.1)#767 |
| 27. | Cliffside | 14.9% | 4.3%(+10.7)#27 | 4.1%(+10.8)#799 |
| 28. | Cove Creek | 14.9% | 4.3%(+10.7)#28 | 4.1%(+10.8)#801 |
| 29. | Roper | 14.5% | 4.3%(+10.3)#29 | 4.1%(+10.4)#857 |
| 30. | Red Springs | 14.4% | 4.3%(+10.2)#30 | 4.1%(+10.3)#877 |
| 31. | Light Oak | 14.0% | 4.3%(+9.76)#31 | 4.1%(+9.87)#942 |
| 32. | Mooresboro | 14.0% | 4.3%(+9.69)#32 | 4.1%(+9.80)#951 |
| 33. | Marshall | 13.9% | 4.3%(+9.67)#33 | 4.1%(+9.79)#954 |
| 34. | Ashley Heights | 13.6% | 4.3%(+9.34)#34 | 4.1%(+9.46)#1,018 |
| 35. | Dana | 13.4% | 4.3%(+9.11)#35 | 4.1%(+9.22)#1,050 |
| 36. | Everetts | 13.1% | 4.3%(+8.81)#36 | 4.1%(+8.93)#1,103 |
| 37. | Chadbourn | 12.9% | 4.3%(+8.66)#37 | 4.1%(+8.78)#1,133 |
| 38. | Cypress Landing | 12.0% | 4.3%(+7.72)#38 | 4.1%(+7.84)#1,315 |
| 39. | Macon | 11.9% | 4.3%(+7.64)#39 | 4.1%(+7.75)#1,333 |
| 40. | Norwood | 11.8% | 4.3%(+7.54)#40 | 4.1%(+7.66)#1,354 |
| 41. | Highlands | 11.7% | 4.3%(+7.44)#41 | 4.1%(+7.56)#1,378 |
| 42. | Rocky Point | 11.6% | 4.3%(+7.31)#42 | 4.1%(+7.42)#1,408 |
| 43. | Emma | 11.5% | 4.3%(+7.20)#43 | 4.1%(+7.32)#1,429 |
| 44. | Bostic | 11.3% | 4.3%(+7.00)#44 | 4.1%(+7.12)#1,470 |
| 45. | Varnamtown | 11.1% | 4.3%(+6.82)#45 | 4.1%(+6.93)#1,532 |
| 46. | Burgaw | 11.1% | 4.3%(+6.79)#46 | 4.1%(+6.91)#1,537 |
| 47. | Hoffman | 10.9% | 4.3%(+6.65)#47 | 4.1%(+6.77)#1,577 |
| 48. | Cedar Rock | 10.8% | 4.3%(+6.55)#48 | 4.1%(+6.66)#1,611 |
| 49. | Aurora | 10.7% | 4.3%(+6.47)#49 | 4.1%(+6.58)#1,631 |
| 50. | South Henderson | 10.6% | 4.3%(+6.37)#50 | 4.1%(+6.49)#1,650 |
| 51. | Icard | 10.6% | 4.3%(+6.36)#51 | 4.1%(+6.47)#1,658 |
| 52. | Calabash | 10.6% | 4.3%(+6.29)#52 | 4.1%(+6.40)#1,680 |
| 53. | Bogue | 10.4% | 4.3%(+6.12)#53 | 4.1%(+6.24)#1,747 |
| 54. | Grover | 10.4% | 4.3%(+6.10)#54 | 4.1%(+6.21)#1,756 |
| 55. | Kelford | 10.3% | 4.3%(+6.08)#55 | 4.1%(+6.20)#1,760 |
| 56. | Franklinton | 10.3% | 4.3%(+6.01)#56 | 4.1%(+6.13)#1,787 |
| 57. | Woodland | 10.3% | 4.3%(+5.99)#57 | 4.1%(+6.11)#1,793 |
| 58. | Kitty Hawk | 10.2% | 4.3%(+5.92)#58 | 4.1%(+6.04)#1,819 |
| 59. | Hobgood | 10.2% | 4.3%(+5.89)#59 | 4.1%(+6.01)#1,836 |
| 60. | Columbia | 10.1% | 4.3%(+5.79)#60 | 4.1%(+5.90)#1,880 |
| 61. | Marshville | 9.7% | 4.3%(+5.45)#61 | 4.1%(+5.57)#2,026 |
| 62. | Forest City | 9.6% | 4.3%(+5.37)#62 | 4.1%(+5.48)#2,060 |
| 63. | Parkton | 9.6% | 4.3%(+5.33)#63 | 4.1%(+5.45)#2,077 |
| 64. | Stony Point | 9.6% | 4.3%(+5.32)#64 | 4.1%(+5.43)#2,085 |
| 65. | Mcadenville | 9.5% | 4.3%(+5.21)#65 | 4.1%(+5.32)#2,133 |
| 66. | Silver Lake | 9.4% | 4.3%(+5.16)#66 | 4.1%(+5.27)#2,154 |
| 67. | Cherry Branch | 9.2% | 4.3%(+4.97)#67 | 4.1%(+5.08)#2,243 |
| 68. | Camden | 9.2% | 4.3%(+4.96)#68 | 4.1%(+5.07)#2,252 |
| 69. | Green Level | 9.0% | 4.3%(+4.76)#69 | 4.1%(+4.88)#2,363 |
| 70. | Castalia | 9.0% | 4.3%(+4.72)#70 | 4.1%(+4.84)#2,384 |
| 71. | Beulaville | 9.0% | 4.3%(+4.71)#71 | 4.1%(+4.82)#2,388 |
| 72. | Jonesville | 8.9% | 4.3%(+4.68)#72 | 4.1%(+4.80)#2,404 |
| 73. | Wesley Chapel | 8.9% | 4.3%(+4.66)#73 | 4.1%(+4.78)#2,419 |
| 74. | St Pauls | 8.9% | 4.3%(+4.64)#74 | 4.1%(+4.76)#2,425 |
| 75. | Moyock | 8.9% | 4.3%(+4.61)#75 | 4.1%(+4.73)#2,452 |
| 76. | Liberty | 8.9% | 4.3%(+4.61)#76 | 4.1%(+4.72)#2,455 |
| 77. | Topsail Beach | 8.9% | 4.3%(+4.59)#77 | 4.1%(+4.70)#2,465 |
| 78. | Harrells | 8.8% | 4.3%(+4.53)#78 | 4.1%(+4.64)#2,499 |
| 79. | Sedalia | 8.8% | 4.3%(+4.50)#79 | 4.1%(+4.62)#2,514 |
| 80. | Grifton | 8.7% | 4.3%(+4.47)#80 | 4.1%(+4.58)#2,535 |
| 81. | Robbins | 8.7% | 4.3%(+4.42)#81 | 4.1%(+4.54)#2,568 |
| 82. | Atlantic Beach | 8.7% | 4.3%(+4.39)#82 | 4.1%(+4.51)#2,584 |
| 83. | Pine Knoll Shores | 8.6% | 4.3%(+4.29)#83 | 4.1%(+4.41)#2,644 |
| 84. | Red Cross | 8.4% | 4.3%(+4.17)#84 | 4.1%(+4.28)#2,714 |
| 85. | Shannon | 8.3% | 4.3%(+4.07)#85 | 4.1%(+4.18)#2,783 |
| 86. | Franklinville | 8.2% | 4.3%(+3.97)#86 | 4.1%(+4.08)#2,847 |
| 87. | Taylortown | 8.2% | 4.3%(+3.92)#87 | 4.1%(+4.03)#2,879 |
| 88. | Piney Green | 8.0% | 4.3%(+3.70)#88 | 4.1%(+3.82)#3,011 |
| 89. | Spring Lake | 7.9% | 4.3%(+3.61)#89 | 4.1%(+3.73)#3,085 |
| 90. | Warsaw | 7.9% | 4.3%(+3.61)#90 | 4.1%(+3.72)#3,092 |
| 91. | Cherryville | 7.8% | 4.3%(+3.58)#91 | 4.1%(+3.70)#3,113 |
| 92. | Lake Park | 7.7% | 4.3%(+3.44)#92 | 4.1%(+3.56)#3,212 |
| 93. | Grantsboro | 7.7% | 4.3%(+3.43)#93 | 4.1%(+3.54)#3,218 |
| 94. | Bald Head Island | 7.7% | 4.3%(+3.43)#94 | 4.1%(+3.54)#3,227 |
| 95. | Silver City | 7.7% | 4.3%(+3.40)#95 | 4.1%(+3.52)#3,252 |
| 96. | Siler City | 7.7% | 4.3%(+3.39)#96 | 4.1%(+3.51)#3,264 |
| 97. | Ayden | 7.5% | 4.3%(+3.28)#97 | 4.1%(+3.39)#3,350 |
| 98. | Dillsboro | 7.5% | 4.3%(+3.24)#98 | 4.1%(+3.35)#3,396 |
| 99. | Dallas | 7.5% | 4.3%(+3.22)#99 | 4.1%(+3.34)#3,408 |
| 100. | Patterson Springs | 7.5% | 4.3%(+3.19)#100 | 4.1%(+3.30)#3,446 |
Common Questions
What are the Top 10 Cities with the Highest Percentage of Population Employed in Administrative & Support Services in North Carolina?
Top 10 Cities with the Highest Percentage of Population Employed in Administrative & Support Services in North Carolina are:
#1
73.9%
#2
53.6%
#3
52.9%
#4
50.0%
#5
48.2%
#6
41.2%
#7
41.0%
#8
40.2%
#9
35.7%
#10
34.8%
What city has the Highest Percentage of Population Employed in Administrative & Support Services in North Carolina?
Lumber Bridge has the Highest Percentage of Population Employed in Administrative & Support Services in North Carolina with 73.9%.
What is the Percentage of Population Employed in Administrative & Support Services in the State of North Carolina?
Percentage of Population Employed in Administrative & Support Services in North Carolina is 4.3%.
What is the Percentage of Population Employed in Administrative & Support Services in the United States?
Percentage of Population Employed in Administrative & Support Services in the United States is 4.1%.