Mount Gretna Heights, PA Map & Demographics
Mount Gretna Heights Map
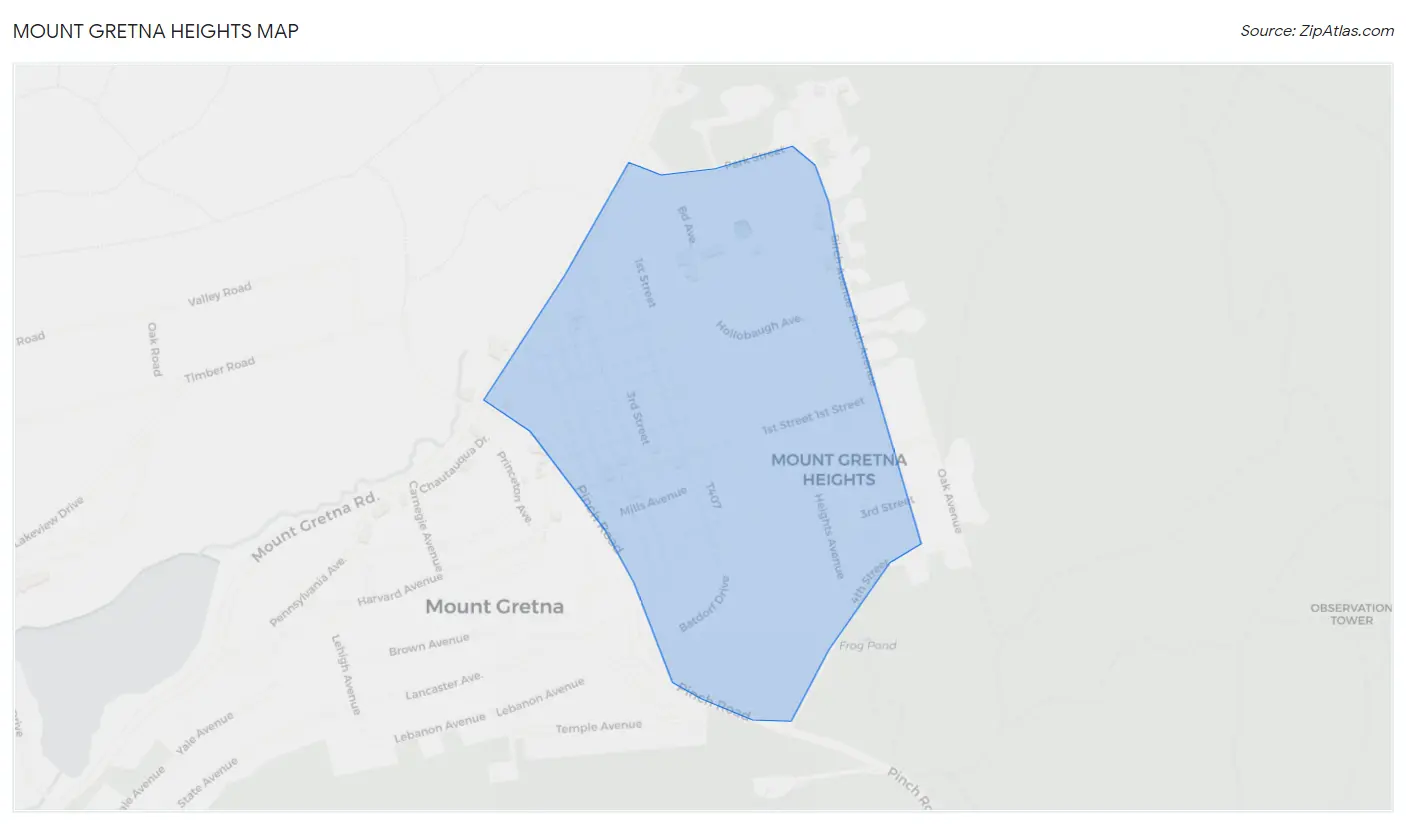
Mount Gretna Heights Overview
$44,694
PER CAPITA INCOME
$150,250
AVG FAMILY INCOME
$110,688
AVG HOUSEHOLD INCOME
0.28
INEQUALITY / GINI INDEX
237
TOTAL POPULATION
97
MALE POPULATION
140
FEMALE POPULATION
69.29
MALES / 100 FEMALES
144.33
FEMALES / 100 MALES
41.6
MEDIAN AGE
3.1
AVG FAMILY SIZE
2.4
AVG HOUSEHOLD SIZE
147
LABOR FORCE [ PEOPLE ]
75.4%
PERCENT IN LABOR FORCE
9.5%
UNEMPLOYMENT RATE
Income in Mount Gretna Heights
Income Overview in Mount Gretna Heights
Per Capita Income in Mount Gretna Heights is $44,694, while median incomes of families and households are $150,250 and $110,688 respectively.
| Characteristic | Number | Measure |
| Per Capita Income | 237 | $44,694 |
| Median Family Income | 67 | $150,250 |
| Mean Family Income | 67 | $135,152 |
| Median Household Income | 99 | $110,688 |
| Mean Household Income | 99 | $111,527 |
| Income Deficit | 67 | $0 |
| Wage / Income Gap (%) | 237 | 0.00% |
| Wage / Income Gap ($) | 237 | 100.00¢ per $1 |
| Gini / Inequality Index | 237 | 0.28 |
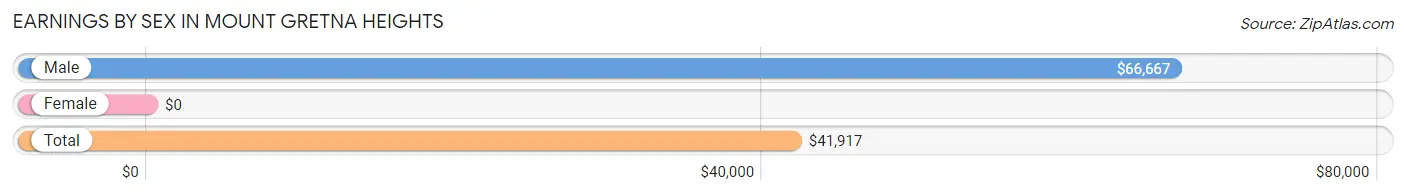
Earnings by Sex in Mount Gretna Heights
| Sex | Number | Average Earnings |
| Male | 56 (35.2%) | $66,667 |
| Female | 103 (64.8%) | $0 |
| Total | 159 (100.0%) | $41,917 |
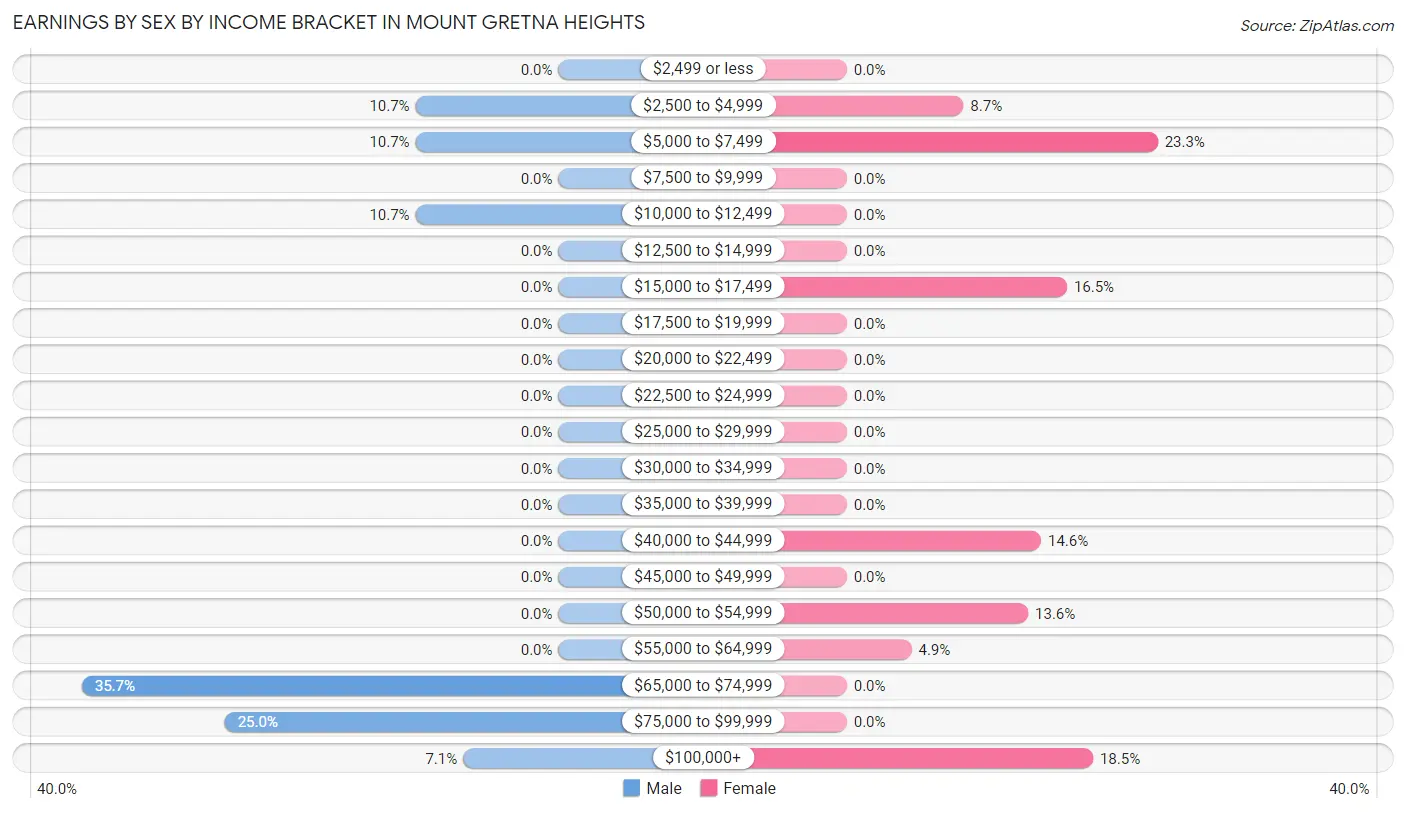
Earnings by Sex by Income Bracket in Mount Gretna Heights
The most common earnings brackets in Mount Gretna Heights are $65,000 to $74,999 for men (20 | 35.7%) and $5,000 to $7,499 for women (24 | 23.3%).
| Income | Male | Female |
| $2,499 or less | 0 (0.0%) | 0 (0.0%) |
| $2,500 to $4,999 | 6 (10.7%) | 9 (8.7%) |
| $5,000 to $7,499 | 6 (10.7%) | 24 (23.3%) |
| $7,500 to $9,999 | 0 (0.0%) | 0 (0.0%) |
| $10,000 to $12,499 | 6 (10.7%) | 0 (0.0%) |
| $12,500 to $14,999 | 0 (0.0%) | 0 (0.0%) |
| $15,000 to $17,499 | 0 (0.0%) | 17 (16.5%) |
| $17,500 to $19,999 | 0 (0.0%) | 0 (0.0%) |
| $20,000 to $22,499 | 0 (0.0%) | 0 (0.0%) |
| $22,500 to $24,999 | 0 (0.0%) | 0 (0.0%) |
| $25,000 to $29,999 | 0 (0.0%) | 0 (0.0%) |
| $30,000 to $34,999 | 0 (0.0%) | 0 (0.0%) |
| $35,000 to $39,999 | 0 (0.0%) | 0 (0.0%) |
| $40,000 to $44,999 | 0 (0.0%) | 15 (14.6%) |
| $45,000 to $49,999 | 0 (0.0%) | 0 (0.0%) |
| $50,000 to $54,999 | 0 (0.0%) | 14 (13.6%) |
| $55,000 to $64,999 | 0 (0.0%) | 5 (4.9%) |
| $65,000 to $74,999 | 20 (35.7%) | 0 (0.0%) |
| $75,000 to $99,999 | 14 (25.0%) | 0 (0.0%) |
| $100,000+ | 4 (7.1%) | 19 (18.4%) |
| Total | 56 (100.0%) | 103 (100.0%) |
Earnings by Sex by Educational Attainment in Mount Gretna Heights
| Educational Attainment | Male Income | Female Income |
| Less than High School | - | - |
| High School Diploma | - | - |
| College or Associate's Degree | - | - |
| Bachelor's Degree | - | - |
| Graduate Degree | - | - |
| Total | $73,000 | $50,893 |
Family Income in Mount Gretna Heights
Family Income Brackets in Mount Gretna Heights
According to the Mount Gretna Heights family income data, there are 30 families falling into the $150,000 to $199,999 income range, which is the most common income bracket and makes up 44.8% of all families.
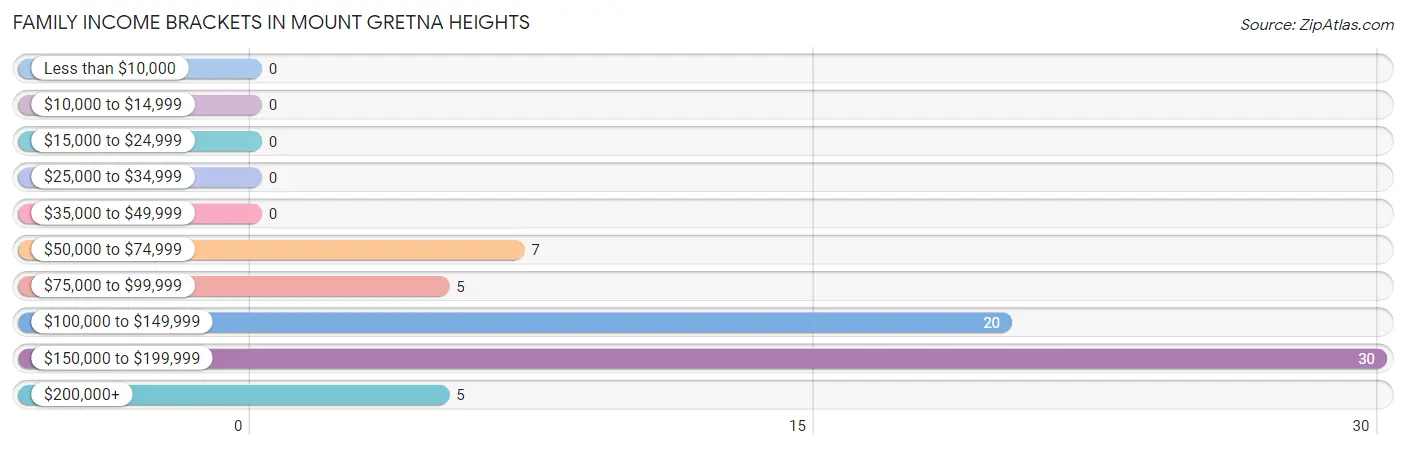
| Income Bracket | # Families | % Families |
| Less than $10,000 | 0 | 0.0% |
| $10,000 to $14,999 | 0 | 0.0% |
| $15,000 to $24,999 | 0 | 0.0% |
| $25,000 to $34,999 | 0 | 0.0% |
| $35,000 to $49,999 | 0 | 0.0% |
| $50,000 to $74,999 | 7 | 10.4% |
| $75,000 to $99,999 | 5 | 7.5% |
| $100,000 to $149,999 | 20 | 29.9% |
| $150,000 to $199,999 | 30 | 44.8% |
| $200,000+ | 5 | 7.5% |
Family Income by Famaliy Size in Mount Gretna Heights
3-person families (28 | 41.8%) account for the highest median family income in Mount Gretna Heights with $150,167 per family, while 2-person families (24 | 35.8%) have the highest median income of $55,625 per family member.
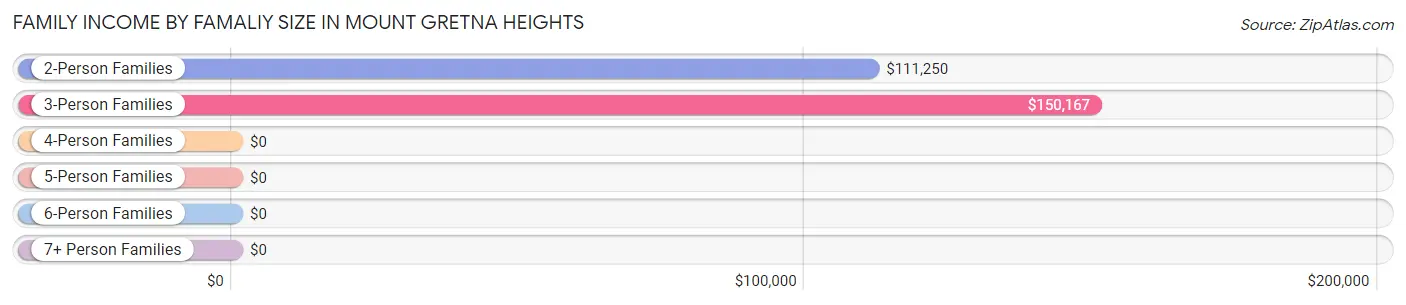
| Income Bracket | # Families | Median Income |
| 2-Person Families | 24 (35.8%) | $111,250 |
| 3-Person Families | 28 (41.8%) | $150,167 |
| 4-Person Families | 0 (0.0%) | $0 |
| 5-Person Families | 0 (0.0%) | $0 |
| 6-Person Families | 15 (22.4%) | $0 |
| 7+ Person Families | 0 (0.0%) | $0 |
| Total | 67 (100.0%) | $150,250 |
Family Income by Number of Earners in Mount Gretna Heights
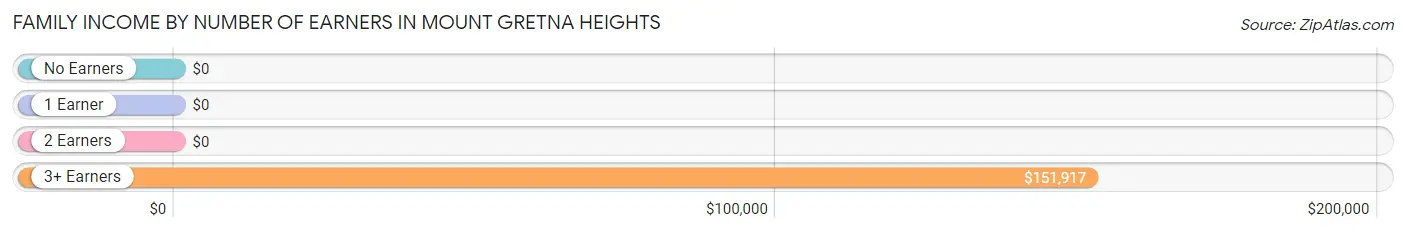
| Number of Earners | # Families | Median Income |
| No Earners | 0 (0.0%) | $0 |
| 1 Earner | 19 (28.4%) | $0 |
| 2 Earners | 11 (16.4%) | $0 |
| 3+ Earners | 37 (55.2%) | $151,917 |
| Total | 67 (100.0%) | $150,250 |
Household Income in Mount Gretna Heights
Household Income Brackets in Mount Gretna Heights
With 31 households falling in the category, the $100,000 to $149,999 income range is the most frequent in Mount Gretna Heights, accounting for 31.3% of all households.
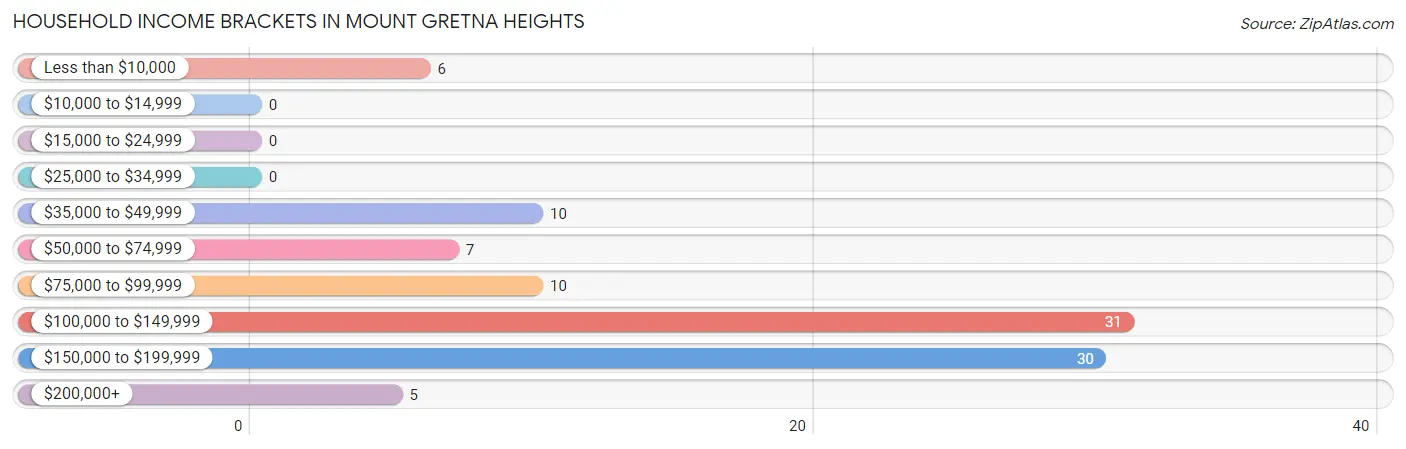
| Income Bracket | # Households | % Households |
| Less than $10,000 | 6 | 6.1% |
| $10,000 to $14,999 | 0 | 0.0% |
| $15,000 to $24,999 | 0 | 0.0% |
| $25,000 to $34,999 | 0 | 0.0% |
| $35,000 to $49,999 | 10 | 10.1% |
| $50,000 to $74,999 | 7 | 7.1% |
| $75,000 to $99,999 | 10 | 10.1% |
| $100,000 to $149,999 | 31 | 31.3% |
| $150,000 to $199,999 | 30 | 30.3% |
| $200,000+ | 5 | 5.1% |
Household Income by Householder Age in Mount Gretna Heights
The median household income in Mount Gretna Heights is $110,688, with the highest median household income of $152,000 found in the 45 to 64 years age bracket for the primary householder. A total of 46 households (46.5%) fall into this category.
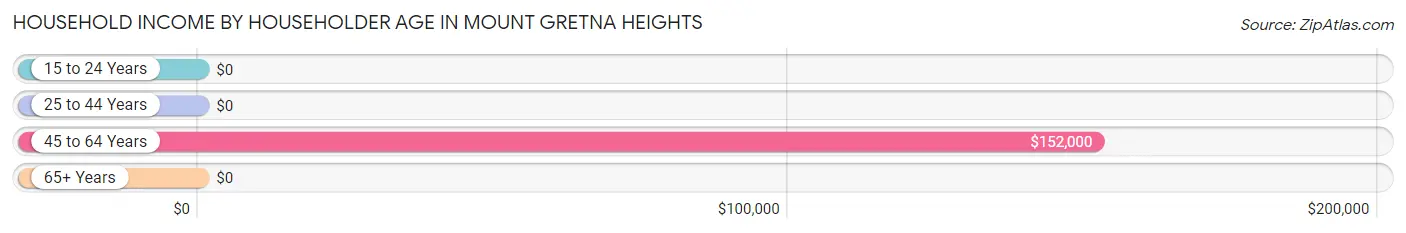
| Income Bracket | # Households | Median Income |
| 15 to 24 Years | 0 (0.0%) | $0 |
| 25 to 44 Years | 14 (14.1%) | $0 |
| 45 to 64 Years | 46 (46.5%) | $152,000 |
| 65+ Years | 39 (39.4%) | $0 |
| Total | 99 (100.0%) | $110,688 |
Poverty in Mount Gretna Heights
Income Below Poverty by Sex and Age in Mount Gretna Heights
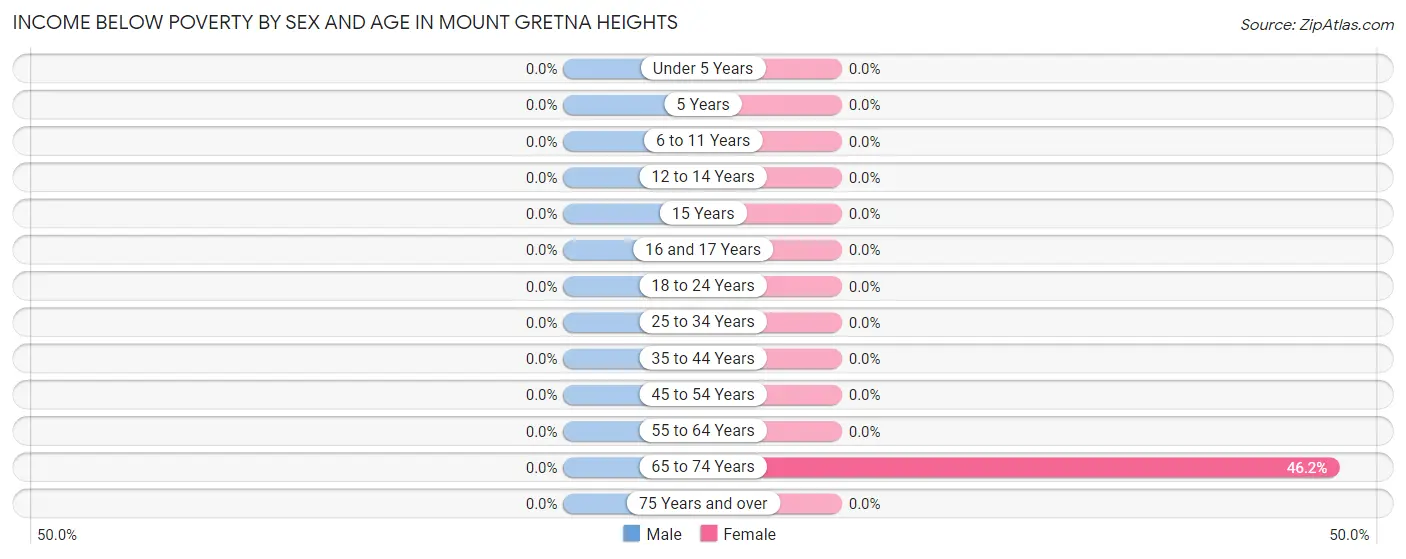
| Age Bracket | Male | Female |
| Under 5 Years | 0 (0.0%) | 0 (0.0%) |
| 5 Years | 0 (0.0%) | 0 (0.0%) |
| 6 to 11 Years | 0 (0.0%) | 0 (0.0%) |
| 12 to 14 Years | 0 (0.0%) | 0 (0.0%) |
| 15 Years | 0 (0.0%) | 0 (0.0%) |
| 16 and 17 Years | 0 (0.0%) | 0 (0.0%) |
| 18 to 24 Years | 0 (0.0%) | 0 (0.0%) |
| 25 to 34 Years | 0 (0.0%) | 0 (0.0%) |
| 35 to 44 Years | 0 (0.0%) | 0 (0.0%) |
| 45 to 54 Years | 0 (0.0%) | 0 (0.0%) |
| 55 to 64 Years | 0 (0.0%) | 0 (0.0%) |
| 65 to 74 Years | 0 (0.0%) | 6 (46.2%) |
| 75 Years and over | 0 (0.0%) | 0 (0.0%) |
| Total | 0 (0.0%) | 6 (4.3%) |
Income Above Poverty by Sex and Age in Mount Gretna Heights
According to the poverty statistics in Mount Gretna Heights, males aged 6 to 11 years and females aged 6 to 11 years are the age groups that are most secure financially, with 100.0% of males and 100.0% of females in these age groups living above the poverty line.
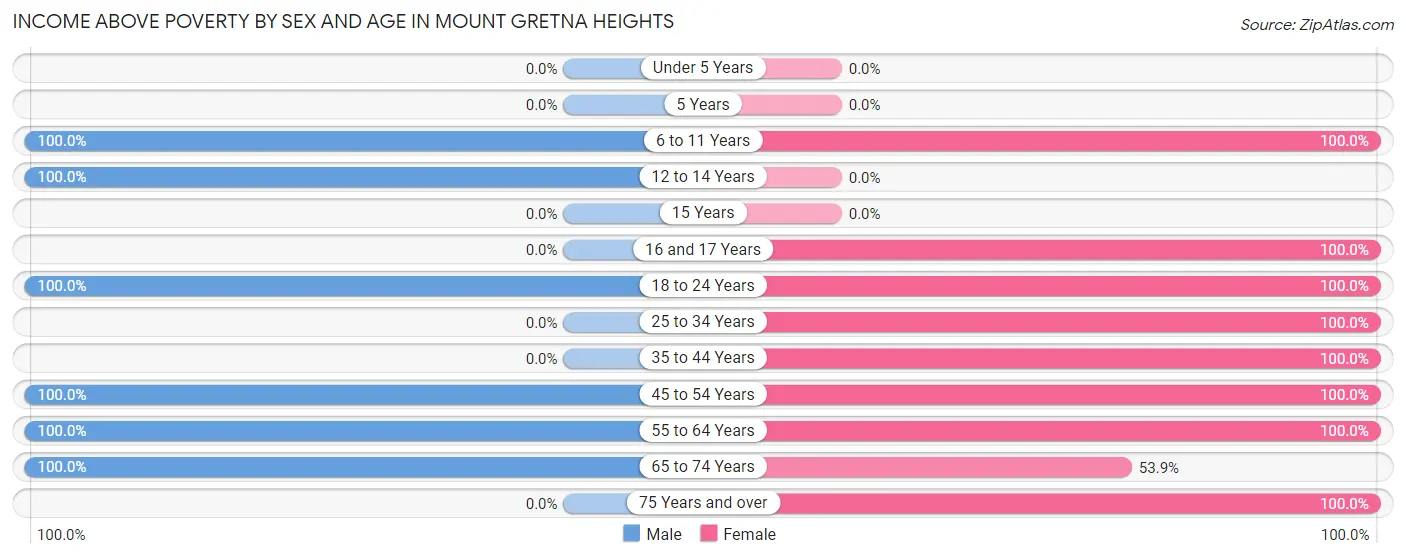
| Age Bracket | Male | Female |
| Under 5 Years | 0 (0.0%) | 0 (0.0%) |
| 5 Years | 0 (0.0%) | 0 (0.0%) |
| 6 to 11 Years | 15 (100.0%) | 11 (100.0%) |
| 12 to 14 Years | 16 (100.0%) | 0 (0.0%) |
| 15 Years | 0 (0.0%) | 0 (0.0%) |
| 16 and 17 Years | 0 (0.0%) | 11 (100.0%) |
| 18 to 24 Years | 17 (100.0%) | 26 (100.0%) |
| 25 to 34 Years | 0 (0.0%) | 14 (100.0%) |
| 35 to 44 Years | 0 (0.0%) | 14 (100.0%) |
| 45 to 54 Years | 33 (100.0%) | 6 (100.0%) |
| 55 to 64 Years | 10 (100.0%) | 25 (100.0%) |
| 65 to 74 Years | 6 (100.0%) | 7 (53.8%) |
| 75 Years and over | 0 (0.0%) | 20 (100.0%) |
| Total | 97 (100.0%) | 134 (95.7%) |
Income Below Poverty Among Married-Couple Families in Mount Gretna Heights
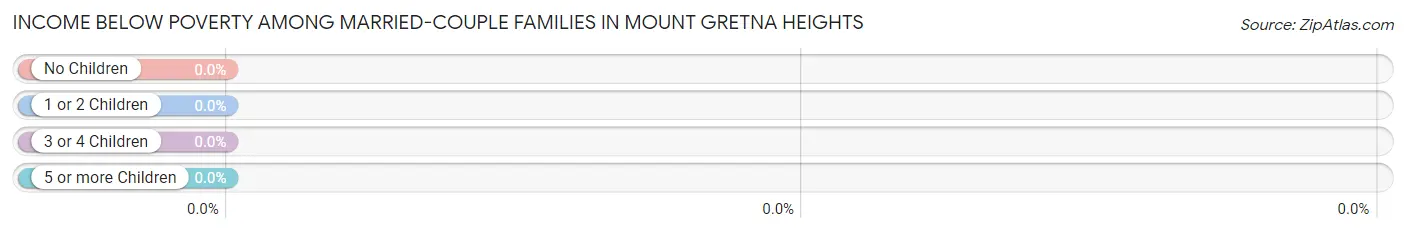
| Children | Above Poverty | Below Poverty |
| No Children | 31 (100.0%) | 0 (0.0%) |
| 1 or 2 Children | 0 (0.0%) | 0 (0.0%) |
| 3 or 4 Children | 15 (100.0%) | 0 (0.0%) |
| 5 or more Children | 0 (0.0%) | 0 (0.0%) |
| Total | 46 (100.0%) | 0 (0.0%) |
Income Below Poverty Among Single-Parent Households in Mount Gretna Heights
| Children | Single Father | Single Mother |
| No Children | 0 (0.0%) | 0 (0.0%) |
| 1 or 2 Children | 0 (0.0%) | 0 (0.0%) |
| 3 or 4 Children | 0 (0.0%) | 0 (0.0%) |
| 5 or more Children | 0 (0.0%) | 0 (0.0%) |
| Total | 0 (0.0%) | 0 (0.0%) |
Income Below Poverty Among Married-Couple vs Single-Parent Households in Mount Gretna Heights
| Children | Married-Couple Families | Single-Parent Households |
| No Children | 0 (0.0%) | 0 (0.0%) |
| 1 or 2 Children | 0 (0.0%) | 0 (0.0%) |
| 3 or 4 Children | 0 (0.0%) | 0 (0.0%) |
| 5 or more Children | 0 (0.0%) | 0 (0.0%) |
| Total | 0 (0.0%) | 0 (0.0%) |
Race in Mount Gretna Heights
The most populous races in Mount Gretna Heights are , and White / Caucasian (237 | 100.0%).
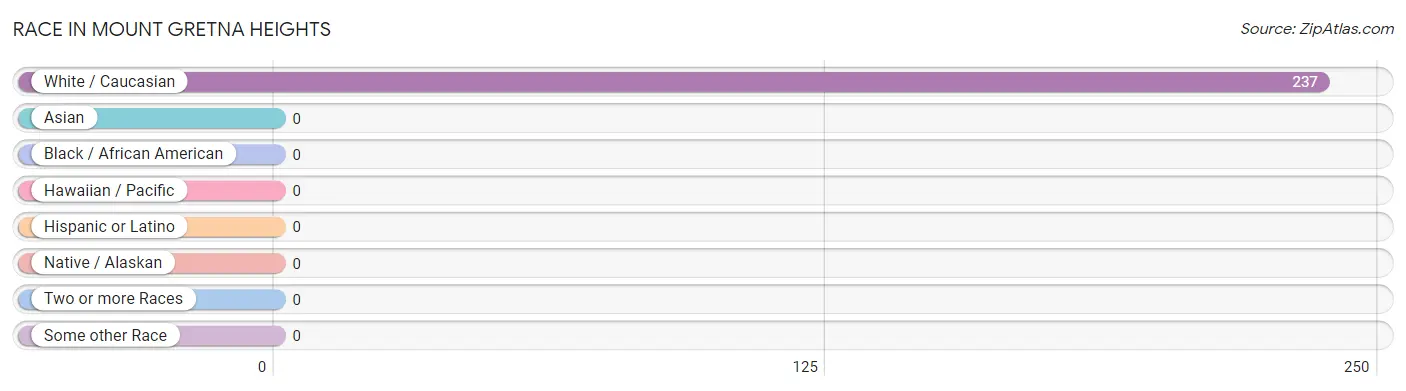
| Race | # Population | % Population |
| Asian | 0 | 0.0% |
| Black / African American | 0 | 0.0% |
| Hawaiian / Pacific | 0 | 0.0% |
| Hispanic or Latino | 0 | 0.0% |
| Native / Alaskan | 0 | 0.0% |
| White / Caucasian | 237 | 100.0% |
| Two or more Races | 0 | 0.0% |
| Some other Race | 0 | 0.0% |
| Total | 237 | 100.0% |
Ancestry in Mount Gretna Heights
The most populous ancestries reported in Mount Gretna Heights are German (50 | 21.1%), Polish (25 | 10.5%), Ukrainian (25 | 10.5%), English (11 | 4.6%), and Irish (11 | 4.6%), together accounting for 51.5% of all Mount Gretna Heights residents.
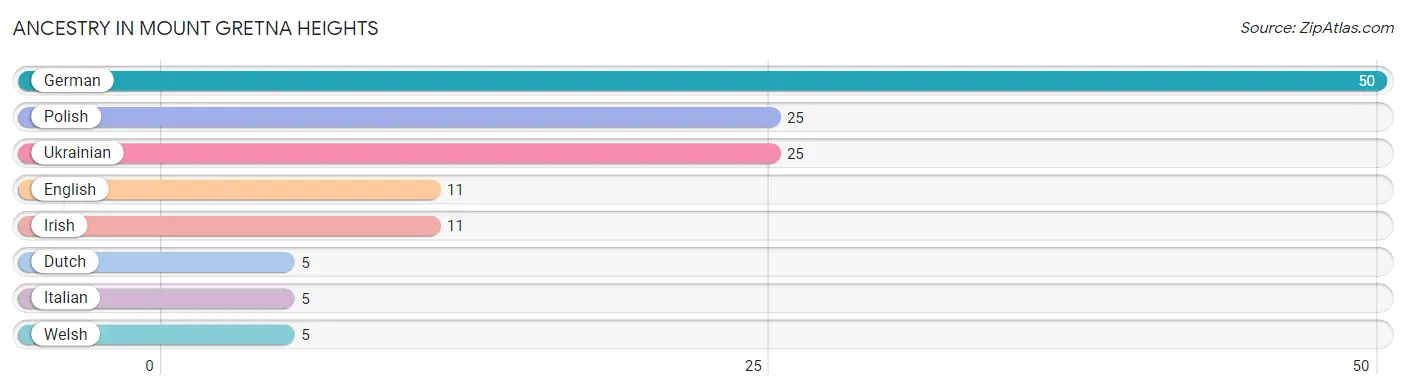
| Ancestry | # Population | % Population |
| Dutch | 5 | 2.1% |
| English | 11 | 4.6% |
| German | 50 | 21.1% |
| Irish | 11 | 4.6% |
| Italian | 5 | 2.1% |
| Polish | 25 | 10.5% |
| Ukrainian | 25 | 10.5% |
| Welsh | 5 | 2.1% | View All 8 Rows |
Immigrants in Mount Gretna Heights

| Immigration Origin | # Population | % Population | View All 0 Rows |
Sex and Age in Mount Gretna Heights
Sex and Age in Mount Gretna Heights
The most populous age groups in Mount Gretna Heights are 10 to 14 Years (31 | 32.0%) for men and 60 to 64 Years (25 | 17.9%) for women.
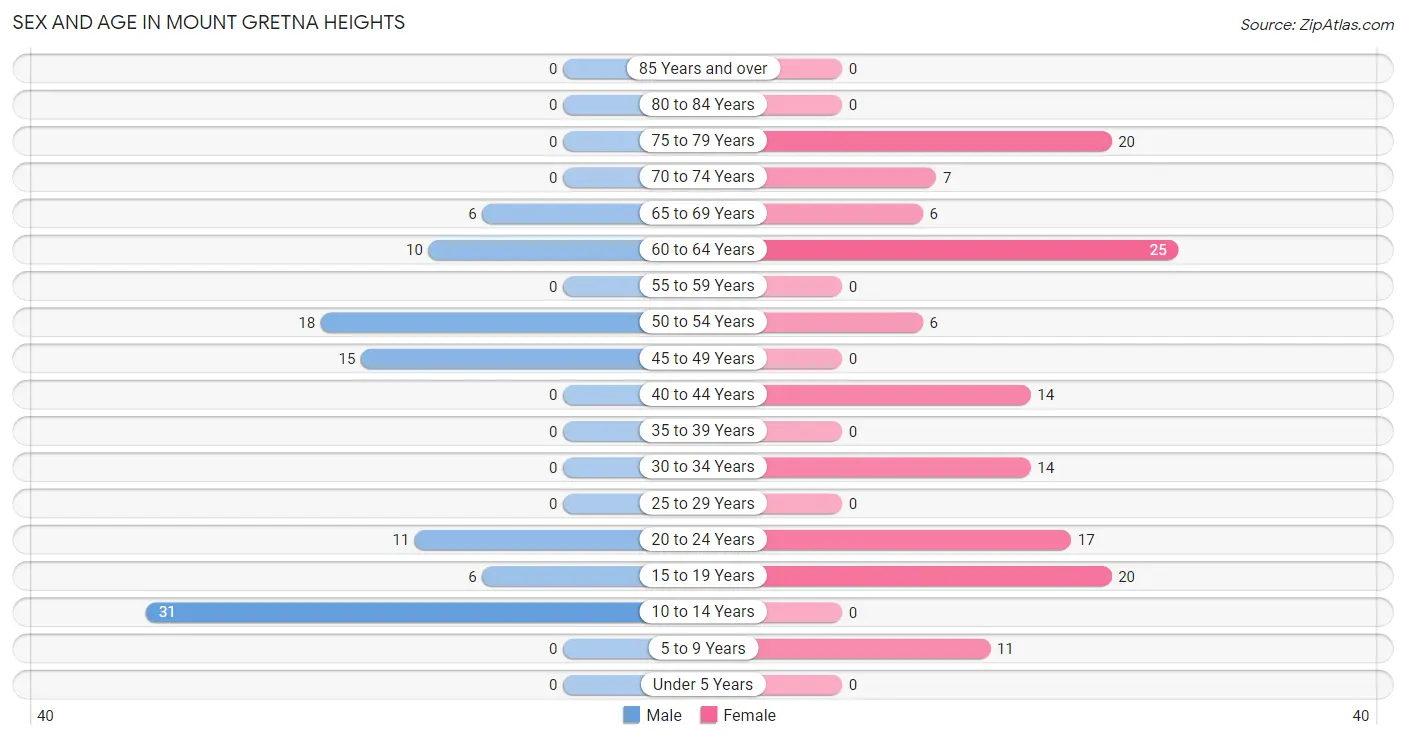
| Age Bracket | Male | Female |
| Under 5 Years | 0 (0.0%) | 0 (0.0%) |
| 5 to 9 Years | 0 (0.0%) | 11 (7.9%) |
| 10 to 14 Years | 31 (32.0%) | 0 (0.0%) |
| 15 to 19 Years | 6 (6.2%) | 20 (14.3%) |
| 20 to 24 Years | 11 (11.3%) | 17 (12.1%) |
| 25 to 29 Years | 0 (0.0%) | 0 (0.0%) |
| 30 to 34 Years | 0 (0.0%) | 14 (10.0%) |
| 35 to 39 Years | 0 (0.0%) | 0 (0.0%) |
| 40 to 44 Years | 0 (0.0%) | 14 (10.0%) |
| 45 to 49 Years | 15 (15.5%) | 0 (0.0%) |
| 50 to 54 Years | 18 (18.6%) | 6 (4.3%) |
| 55 to 59 Years | 0 (0.0%) | 0 (0.0%) |
| 60 to 64 Years | 10 (10.3%) | 25 (17.9%) |
| 65 to 69 Years | 6 (6.2%) | 6 (4.3%) |
| 70 to 74 Years | 0 (0.0%) | 7 (5.0%) |
| 75 to 79 Years | 0 (0.0%) | 20 (14.3%) |
| 80 to 84 Years | 0 (0.0%) | 0 (0.0%) |
| 85 Years and over | 0 (0.0%) | 0 (0.0%) |
| Total | 97 (100.0%) | 140 (100.0%) |
Families and Households in Mount Gretna Heights
Median Family Size in Mount Gretna Heights
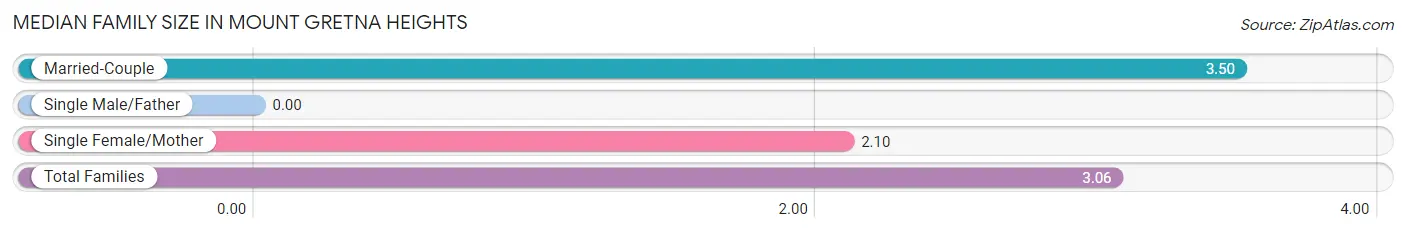
| Family Type | # Families | Family Size |
| Married-Couple | 46 (68.7%) | 3.50 |
| Single Male/Father | 0 (0.0%) | - |
| Single Female/Mother | 21 (31.3%) | 2.10 |
| Total Families | 67 (100.0%) | 3.06 |
Median Household Size in Mount Gretna Heights
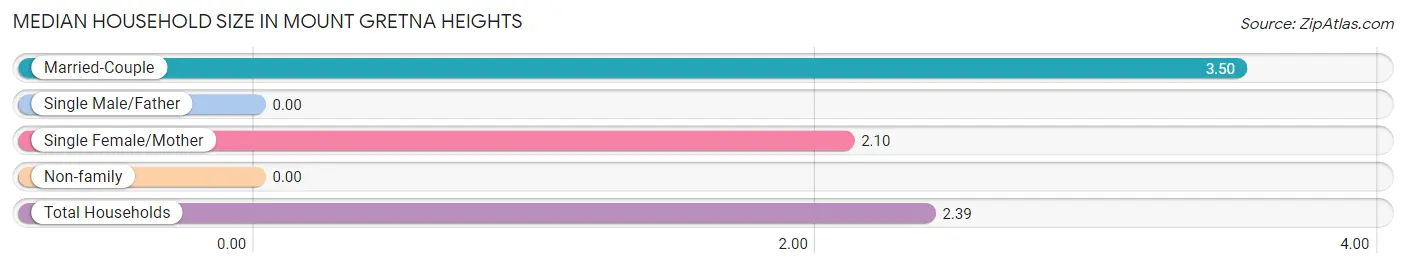
| Household Type | # Households | Household Size |
| Married-Couple | 46 (46.5%) | 3.50 |
| Single Male/Father | 0 (0.0%) | - |
| Single Female/Mother | 21 (21.2%) | 2.10 |
| Non-family | 32 (32.3%) | - |
| Total Households | 99 (100.0%) | 2.39 |
Household Size by Marriage Status in Mount Gretna Heights
Out of a total of 99 households in Mount Gretna Heights, 67 (67.7%) are family households, while 32 (32.3%) are nonfamily households. The most numerous type of family households are 3-person households, comprising 28, and the most common type of nonfamily households are 1-person households, comprising 32.
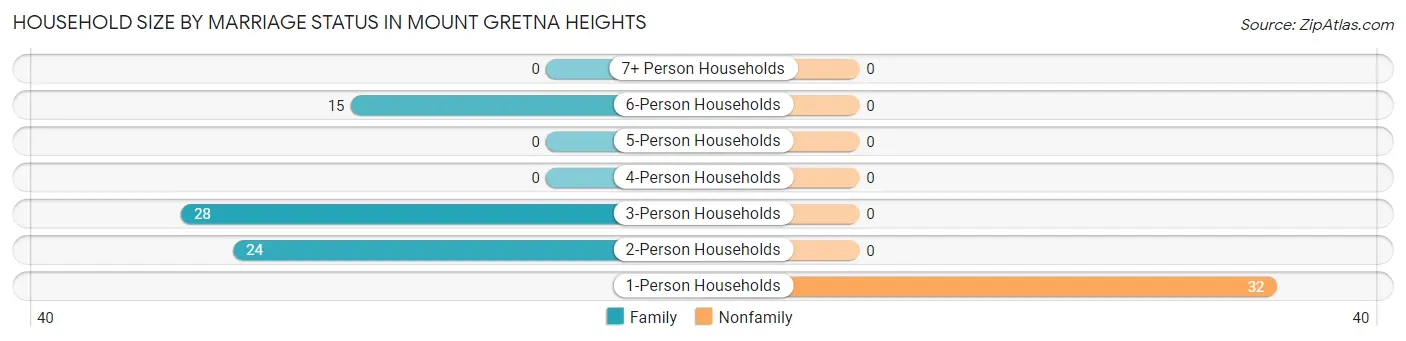
| Household Size | Family Households | Nonfamily Households |
| 1-Person Households | - | 32 (32.3%) |
| 2-Person Households | 24 (24.2%) | 0 (0.0%) |
| 3-Person Households | 28 (28.3%) | 0 (0.0%) |
| 4-Person Households | 0 (0.0%) | 0 (0.0%) |
| 5-Person Households | 0 (0.0%) | 0 (0.0%) |
| 6-Person Households | 15 (15.1%) | 0 (0.0%) |
| 7+ Person Households | 0 (0.0%) | 0 (0.0%) |
| Total | 67 (67.7%) | 32 (32.3%) |
Female Fertility in Mount Gretna Heights
Fertility by Age in Mount Gretna Heights
| Age Bracket | Women with Births | Births / 1,000 Women |
| 15 to 19 years | 0 (0.0%) | 0.0 |
| 20 to 34 years | 0 (0.0%) | 0.0 |
| 35 to 50 years | 0 (0.0%) | 0.0 |
| Total | 0 (0.0%) | 0.0 |
Fertility by Age by Marriage Status in Mount Gretna Heights
| Age Bracket | Married | Unmarried |
| 15 to 19 years | 0 (0.0%) | 0 (0.0%) |
| 20 to 34 years | 0 (0.0%) | 0 (0.0%) |
| 35 to 50 years | 0 (0.0%) | 0 (0.0%) |
| Total | 0 (0.0%) | 0 (0.0%) |
Fertility by Education in Mount Gretna Heights
| Educational Attainment | Women with Births | Births / 1,000 Women |
| Less than High School | 0 (0.0%) | 0.0 |
| High School Diploma | 0 (0.0%) | 0.0 |
| College or Associate's Degree | 0 (0.0%) | 0.0 |
| Bachelor's Degree | 0 (0.0%) | 0.0 |
| Graduate Degree | 0 (0.0%) | 0.0 |
| Total | 0 (0.0%) | 0.0 |
Fertility by Education by Marriage Status in Mount Gretna Heights
| Educational Attainment | Married | Unmarried |
| Less than High School | 0 (0.0%) | 0 (0.0%) |
| High School Diploma | 0 (0.0%) | 0 (0.0%) |
| College or Associate's Degree | 0 (0.0%) | 0 (0.0%) |
| Bachelor's Degree | 0 (0.0%) | 0 (0.0%) |
| Graduate Degree | 0 (0.0%) | 0 (0.0%) |
| Total | 0 (0.0%) | 0 (0.0%) |
Employment Characteristics in Mount Gretna Heights
Employment by Class of Employer in Mount Gretna Heights
Among the 133 employed individuals in Mount Gretna Heights, private company employees (84 | 63.2%), not-for-profit organizations (20 | 15.0%), and self-employed (incorporated) (17 | 12.8%) make up the most common classes of employment.
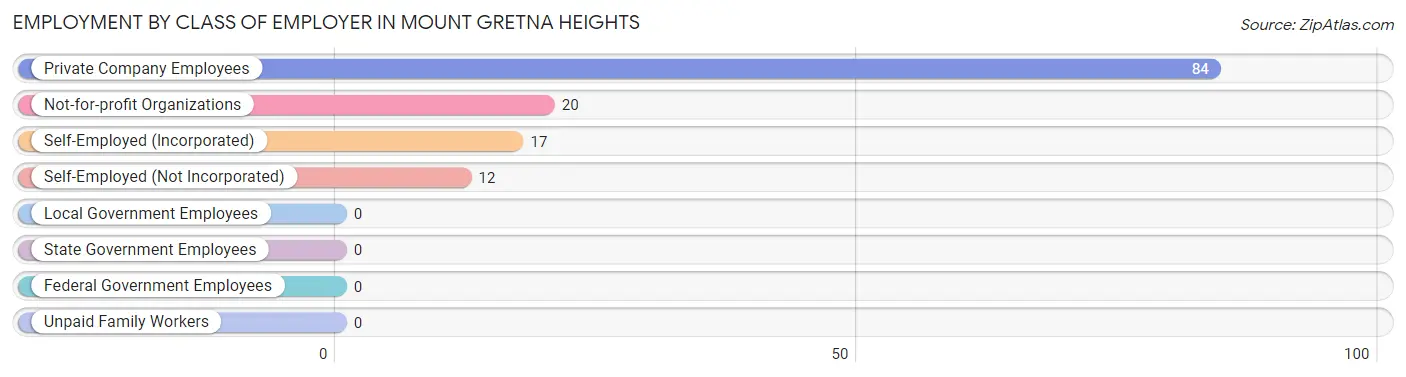
| Employer Class | # Employees | % Employees |
| Private Company Employees | 84 | 63.2% |
| Self-Employed (Incorporated) | 17 | 12.8% |
| Self-Employed (Not Incorporated) | 12 | 9.0% |
| Not-for-profit Organizations | 20 | 15.0% |
| Local Government Employees | 0 | 0.0% |
| State Government Employees | 0 | 0.0% |
| Federal Government Employees | 0 | 0.0% |
| Unpaid Family Workers | 0 | 0.0% |
| Total | 133 | 100.0% |
Employment Status by Age in Mount Gretna Heights
According to the labor force statistics for Mount Gretna Heights, out of the total population over 16 years of age (195), 75.4% or 147 individuals are in the labor force, with 9.5% or 14 of them unemployed. The age group with the highest labor force participation rate is 30 to 34 years, with 100.0% or 14 individuals in the labor force. Within the labor force, the 35 to 44 years age range has the highest percentage of unemployed individuals, with 100.0% or 14 of them being unemployed.
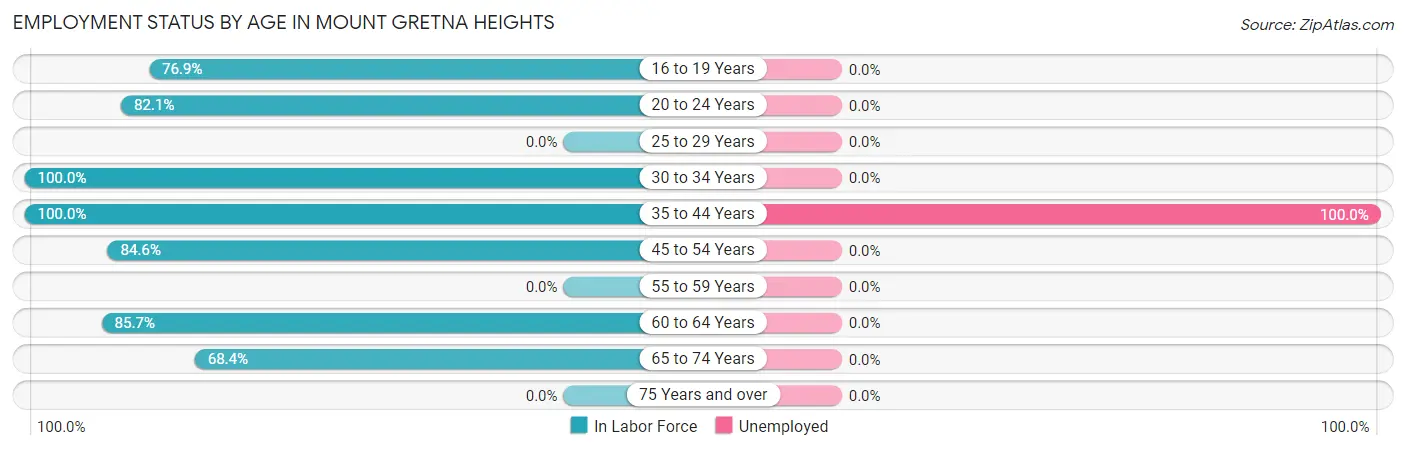
| Age Bracket | In Labor Force | Unemployed |
| 16 to 19 Years | 20 (76.9%) | 0 (0.0%) |
| 20 to 24 Years | 23 (82.1%) | 0 (0.0%) |
| 25 to 29 Years | 0 (0.0%) | 0 (0.0%) |
| 30 to 34 Years | 14 (100.0%) | 0 (0.0%) |
| 35 to 44 Years | 14 (100.0%) | 14 (100.0%) |
| 45 to 54 Years | 33 (84.6%) | 0 (0.0%) |
| 55 to 59 Years | 0 (0.0%) | 0 (0.0%) |
| 60 to 64 Years | 30 (85.7%) | 0 (0.0%) |
| 65 to 74 Years | 13 (68.4%) | 0 (0.0%) |
| 75 Years and over | 0 (0.0%) | 0 (0.0%) |
| Total | 147 (75.4%) | 14 (9.5%) |
Employment Status by Educational Attainment in Mount Gretna Heights
According to labor force statistics for Mount Gretna Heights, 89.2% of individuals (91) out of the total population between 25 and 64 years of age (102) are in the labor force, with 15.4% or 14 of them being unemployed. The group with the highest labor force participation rate are those with the educational attainment of less than high school, with 100.0% or 19 individuals in the labor force. Within the labor force, individuals with bachelor's degree or higher education have the highest percentage of unemployment, with 33.3% or 14 of them being unemployed.
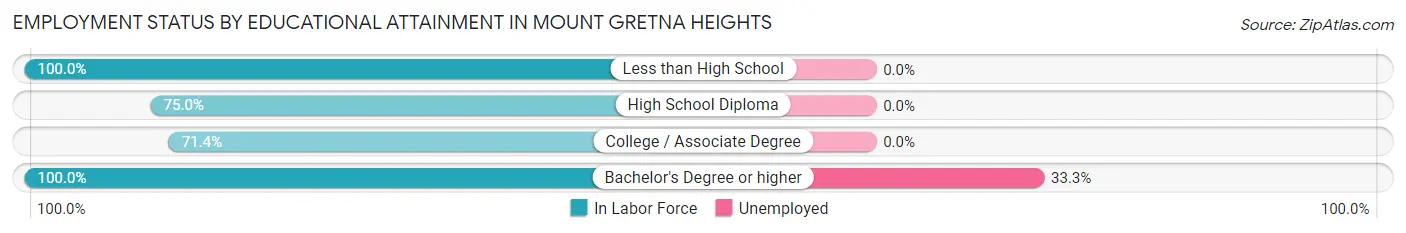
| Educational Attainment | In Labor Force | Unemployed |
| Less than High School | 19 (100.0%) | 0 (0.0%) |
| High School Diploma | 15 (75.0%) | 0 (0.0%) |
| College / Associate Degree | 15 (71.4%) | 0 (0.0%) |
| Bachelor's Degree or higher | 42 (100.0%) | 14 (33.3%) |
| Total | 91 (89.2%) | 16 (15.4%) |
Employment Occupations by Sex in Mount Gretna Heights
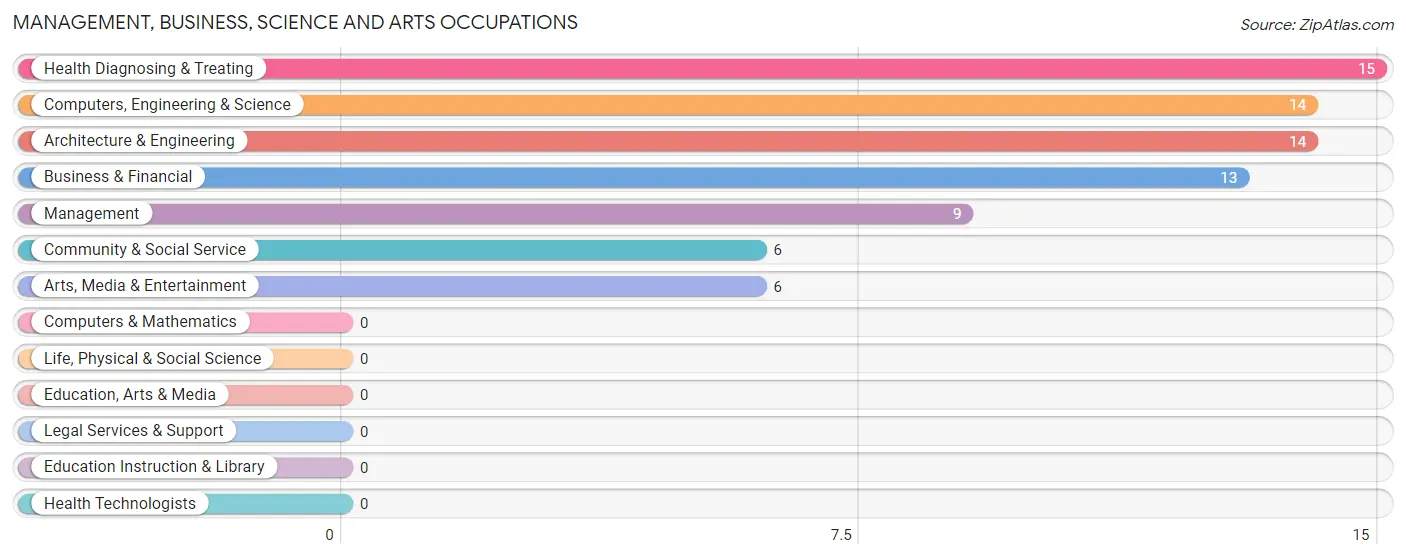
Management, Business, Science and Arts Occupations
The most common Management, Business, Science and Arts occupations in Mount Gretna Heights are Health Diagnosing & Treating (15 | 11.3%), Computers, Engineering & Science (14 | 10.5%), Architecture & Engineering (14 | 10.5%), Business & Financial (13 | 9.8%), and Management (9 | 6.8%).
Management, Business, Science and Arts Occupations by Sex
Within the Management, Business, Science and Arts occupations in Mount Gretna Heights, the most male-oriented occupations are Community & Social Service (100.0%), Arts, Media & Entertainment (100.0%), and Business & Financial (46.2%), while the most female-oriented occupations are Computers, Engineering & Science (100.0%), Architecture & Engineering (100.0%), and Health Diagnosing & Treating (100.0%).
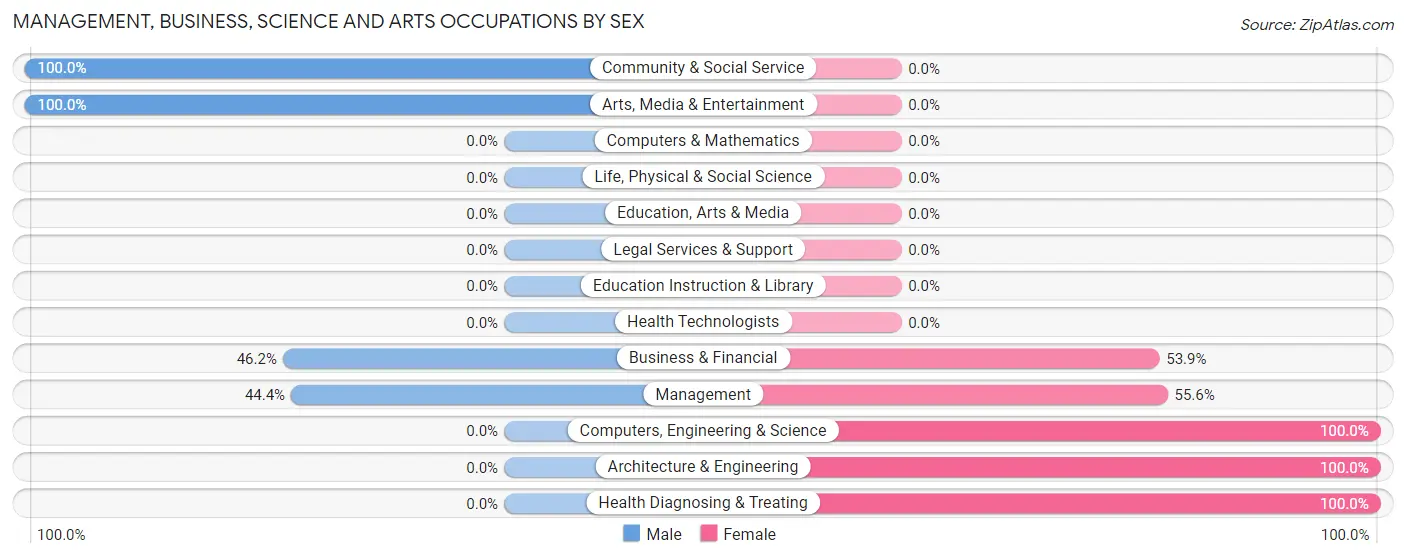
| Occupation | Male | Female |
| Management | 4 (44.4%) | 5 (55.6%) |
| Business & Financial | 6 (46.2%) | 7 (53.8%) |
| Computers, Engineering & Science | 0 (0.0%) | 14 (100.0%) |
| Computers & Mathematics | 0 (0.0%) | 0 (0.0%) |
| Architecture & Engineering | 0 (0.0%) | 14 (100.0%) |
| Life, Physical & Social Science | 0 (0.0%) | 0 (0.0%) |
| Community & Social Service | 6 (100.0%) | 0 (0.0%) |
| Education, Arts & Media | 0 (0.0%) | 0 (0.0%) |
| Legal Services & Support | 0 (0.0%) | 0 (0.0%) |
| Education Instruction & Library | 0 (0.0%) | 0 (0.0%) |
| Arts, Media & Entertainment | 6 (100.0%) | 0 (0.0%) |
| Health Diagnosing & Treating | 0 (0.0%) | 15 (100.0%) |
| Health Technologists | 0 (0.0%) | 0 (0.0%) |
| Total (Category) | 16 (28.1%) | 41 (71.9%) |
| Total (Overall) | 50 (37.6%) | 83 (62.4%) |
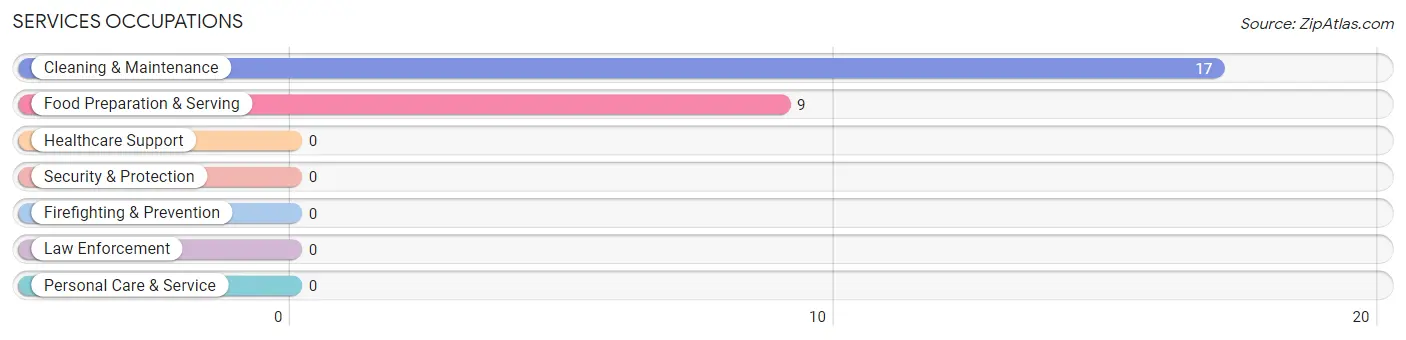
Services Occupations
The most common Services occupations in Mount Gretna Heights are Cleaning & Maintenance (17 | 12.8%), and Food Preparation & Serving (9 | 6.8%).
Services Occupations by Sex
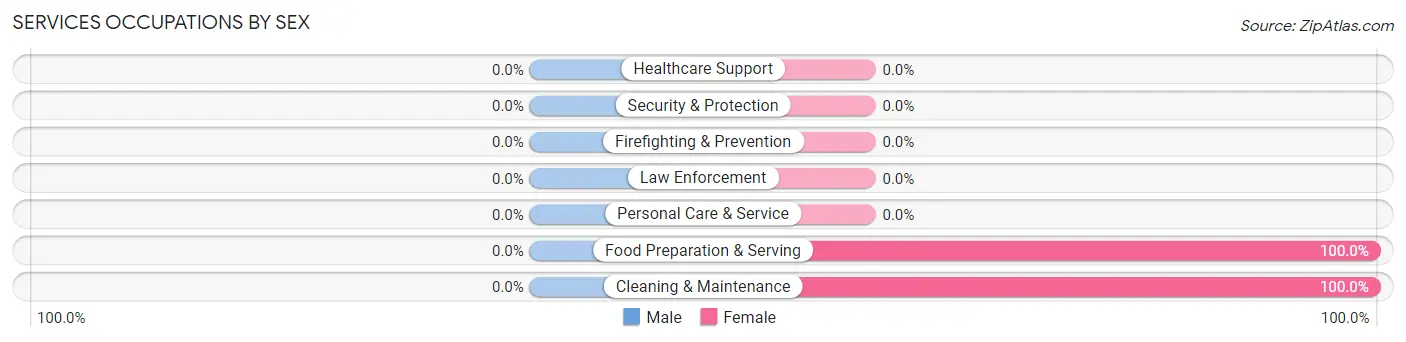
| Occupation | Male | Female |
| Healthcare Support | 0 (0.0%) | 0 (0.0%) |
| Security & Protection | 0 (0.0%) | 0 (0.0%) |
| Firefighting & Prevention | 0 (0.0%) | 0 (0.0%) |
| Law Enforcement | 0 (0.0%) | 0 (0.0%) |
| Food Preparation & Serving | 0 (0.0%) | 9 (100.0%) |
| Cleaning & Maintenance | 0 (0.0%) | 17 (100.0%) |
| Personal Care & Service | 0 (0.0%) | 0 (0.0%) |
| Total (Category) | 0 (0.0%) | 26 (100.0%) |
| Total (Overall) | 50 (37.6%) | 83 (62.4%) |
Sales and Office Occupations
The most common Sales and Office occupations in Mount Gretna Heights are , and Sales & Related (16 | 12.0%).
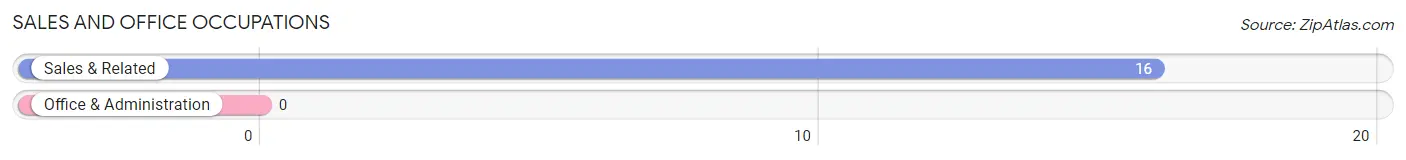
Sales and Office Occupations by Sex
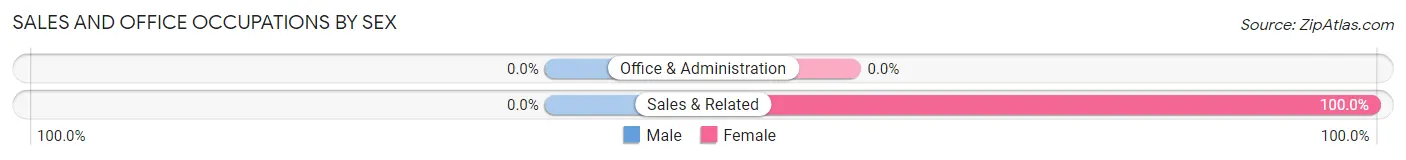
| Occupation | Male | Female |
| Sales & Related | 0 (0.0%) | 16 (100.0%) |
| Office & Administration | 0 (0.0%) | 0 (0.0%) |
| Total (Category) | 0 (0.0%) | 16 (100.0%) |
| Total (Overall) | 50 (37.6%) | 83 (62.4%) |
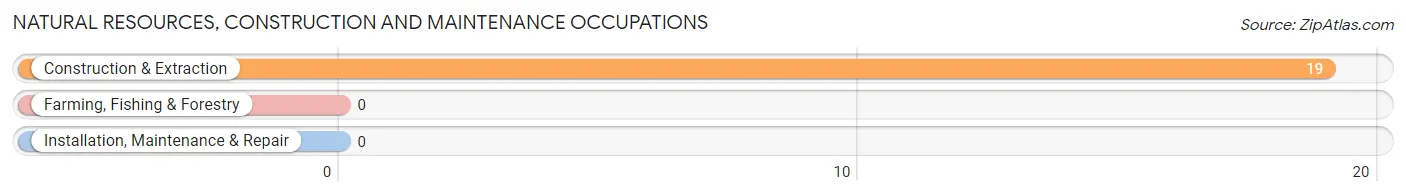
Natural Resources, Construction and Maintenance Occupations
The most common Natural Resources, Construction and Maintenance occupations in Mount Gretna Heights are , and Construction & Extraction (19 | 14.3%).
Natural Resources, Construction and Maintenance Occupations by Sex
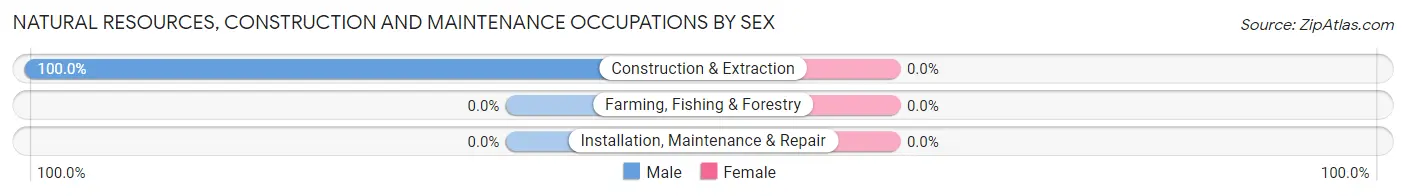
| Occupation | Male | Female |
| Farming, Fishing & Forestry | 0 (0.0%) | 0 (0.0%) |
| Construction & Extraction | 19 (100.0%) | 0 (0.0%) |
| Installation, Maintenance & Repair | 0 (0.0%) | 0 (0.0%) |
| Total (Category) | 19 (100.0%) | 0 (0.0%) |
| Total (Overall) | 50 (37.6%) | 83 (62.4%) |
Production, Transportation and Moving Occupations
The most common Production, Transportation and Moving occupations in Mount Gretna Heights are , and Material Moving (15 | 11.3%).
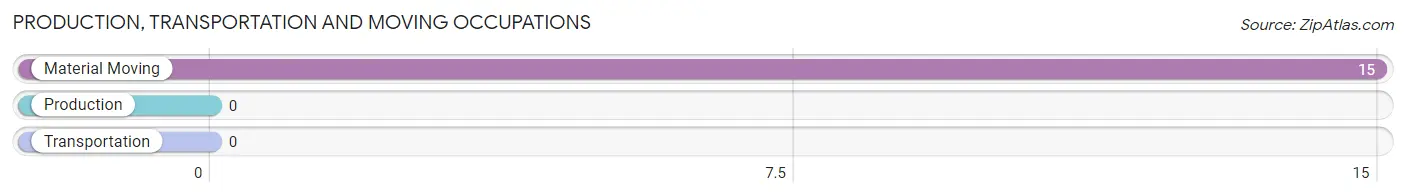
Production, Transportation and Moving Occupations by Sex
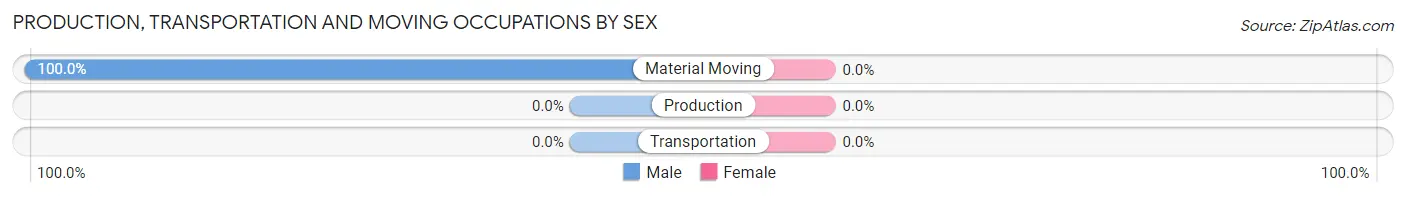
| Occupation | Male | Female |
| Production | 0 (0.0%) | 0 (0.0%) |
| Transportation | 0 (0.0%) | 0 (0.0%) |
| Material Moving | 15 (100.0%) | 0 (0.0%) |
| Total (Category) | 15 (100.0%) | 0 (0.0%) |
| Total (Overall) | 50 (37.6%) | 83 (62.4%) |
Employment Industries by Sex in Mount Gretna Heights
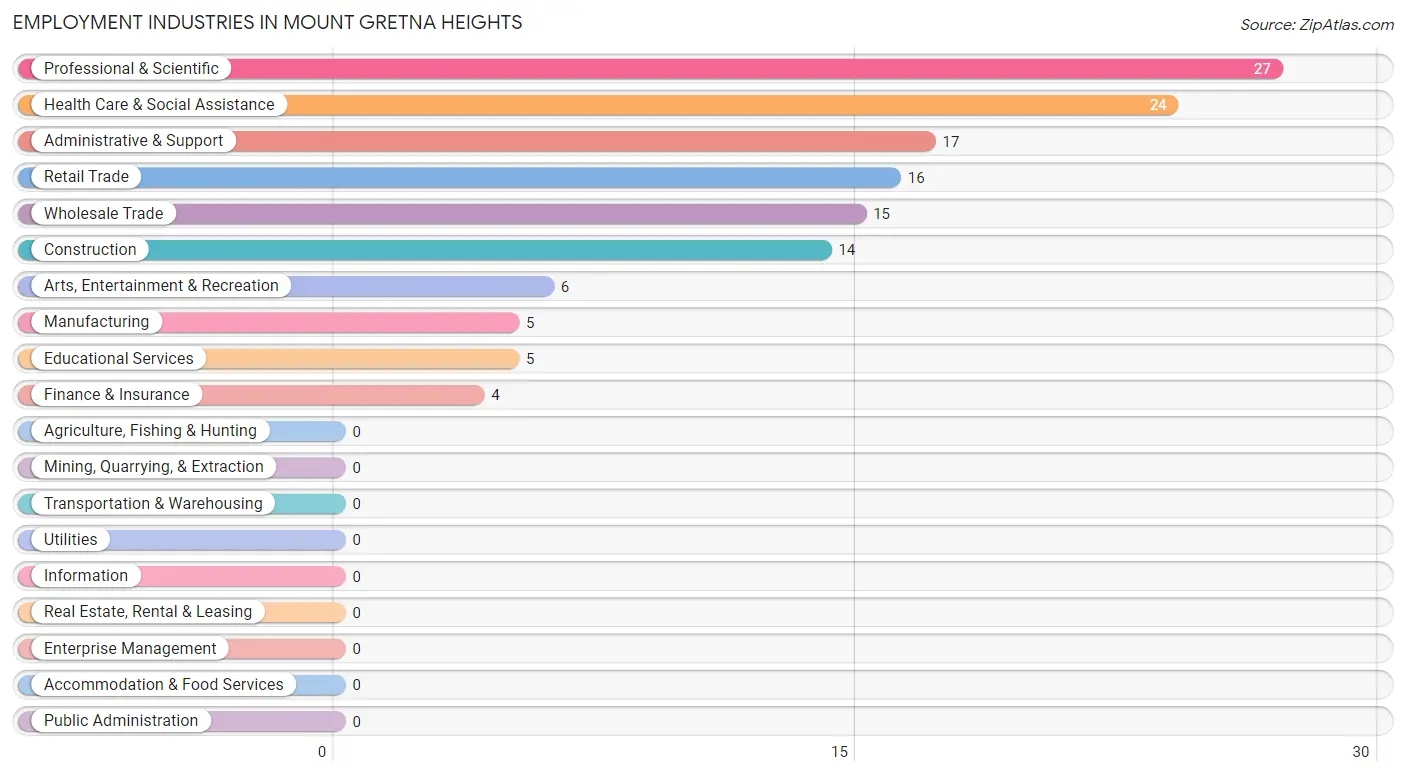
Employment Industries in Mount Gretna Heights
The major employment industries in Mount Gretna Heights include Professional & Scientific (27 | 20.3%), Health Care & Social Assistance (24 | 18.0%), Administrative & Support (17 | 12.8%), Retail Trade (16 | 12.0%), and Wholesale Trade (15 | 11.3%).
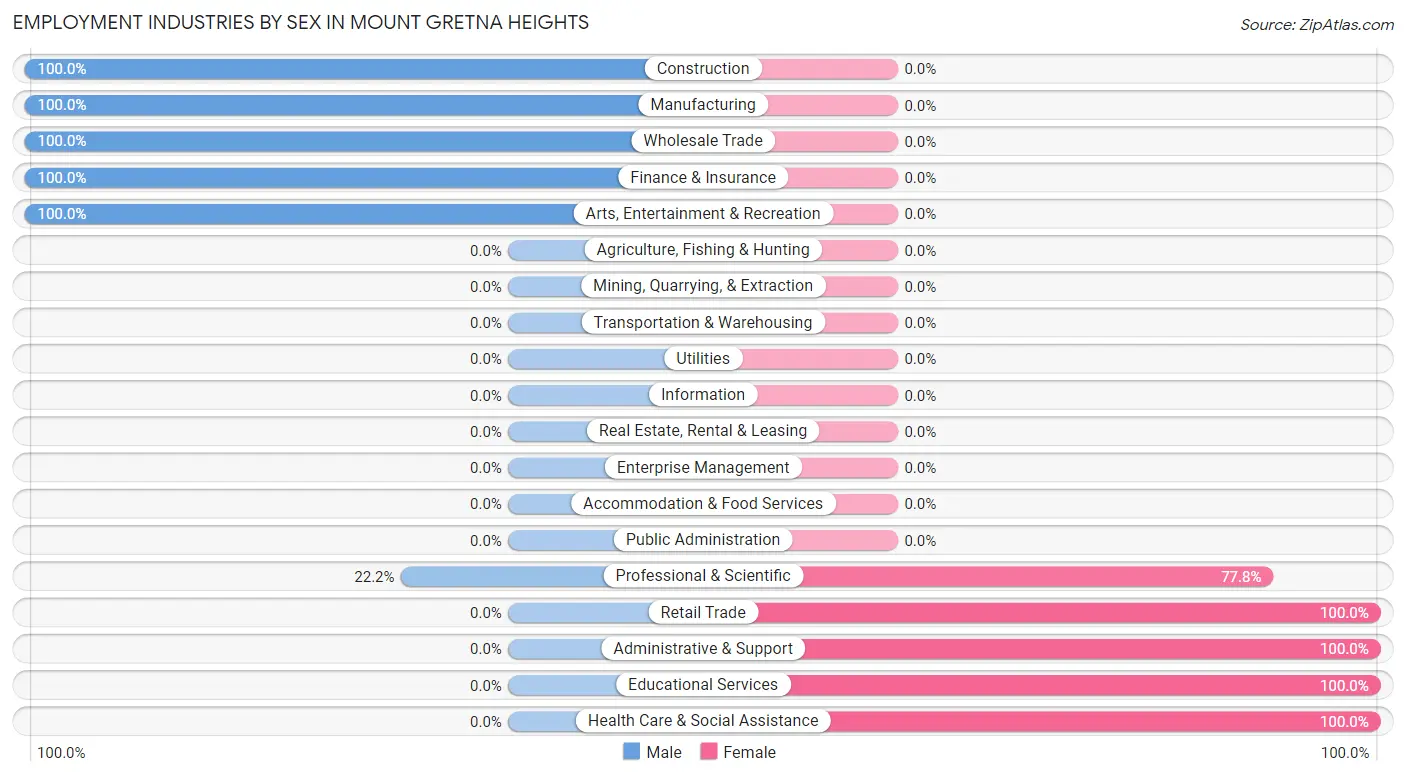
Employment Industries by Sex in Mount Gretna Heights
The Mount Gretna Heights industries that see more men than women are Construction (100.0%), Manufacturing (100.0%), and Wholesale Trade (100.0%), whereas the industries that tend to have a higher number of women are Retail Trade (100.0%), Administrative & Support (100.0%), and Educational Services (100.0%).
| Industry | Male | Female |
| Agriculture, Fishing & Hunting | 0 (0.0%) | 0 (0.0%) |
| Mining, Quarrying, & Extraction | 0 (0.0%) | 0 (0.0%) |
| Construction | 14 (100.0%) | 0 (0.0%) |
| Manufacturing | 5 (100.0%) | 0 (0.0%) |
| Wholesale Trade | 15 (100.0%) | 0 (0.0%) |
| Retail Trade | 0 (0.0%) | 16 (100.0%) |
| Transportation & Warehousing | 0 (0.0%) | 0 (0.0%) |
| Utilities | 0 (0.0%) | 0 (0.0%) |
| Information | 0 (0.0%) | 0 (0.0%) |
| Finance & Insurance | 4 (100.0%) | 0 (0.0%) |
| Real Estate, Rental & Leasing | 0 (0.0%) | 0 (0.0%) |
| Professional & Scientific | 6 (22.2%) | 21 (77.8%) |
| Enterprise Management | 0 (0.0%) | 0 (0.0%) |
| Administrative & Support | 0 (0.0%) | 17 (100.0%) |
| Educational Services | 0 (0.0%) | 5 (100.0%) |
| Health Care & Social Assistance | 0 (0.0%) | 24 (100.0%) |
| Arts, Entertainment & Recreation | 6 (100.0%) | 0 (0.0%) |
| Accommodation & Food Services | 0 (0.0%) | 0 (0.0%) |
| Public Administration | 0 (0.0%) | 0 (0.0%) |
| Total | 50 (37.6%) | 83 (62.4%) |
Education in Mount Gretna Heights
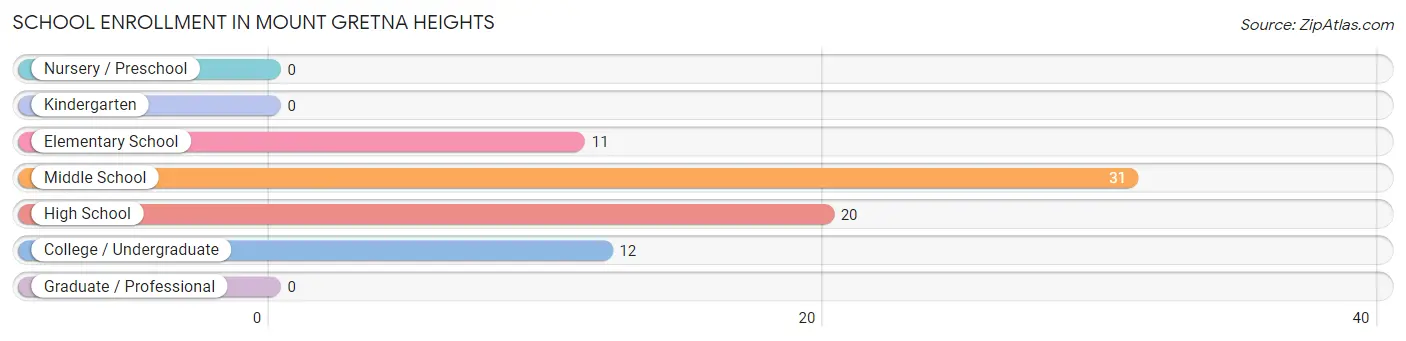
School Enrollment in Mount Gretna Heights
The most common levels of schooling among the 74 students in Mount Gretna Heights are middle school (31 | 41.9%), high school (20 | 27.0%), and college / undergraduate (12 | 16.2%).
| School Level | # Students | % Students |
| Nursery / Preschool | 0 | 0.0% |
| Kindergarten | 0 | 0.0% |
| Elementary School | 11 | 14.9% |
| Middle School | 31 | 41.9% |
| High School | 20 | 27.0% |
| College / Undergraduate | 12 | 16.2% |
| Graduate / Professional | 0 | 0.0% |
| Total | 74 | 100.0% |
School Enrollment by Age by Funding Source in Mount Gretna Heights
Out of a total of 74 students who are enrolled in schools in Mount Gretna Heights, 11 (14.9%) attend a private institution, while the remaining 63 (85.1%) are enrolled in public schools. The age group of 5 to 9 year old has the highest likelihood of being enrolled in private schools, with 11 (100.0% in the age bracket) enrolled. Conversely, the age group of 10 to 14 year olds has the lowest likelihood of being enrolled in a private school, with 31 (100.0% in the age bracket) attending a public institution.
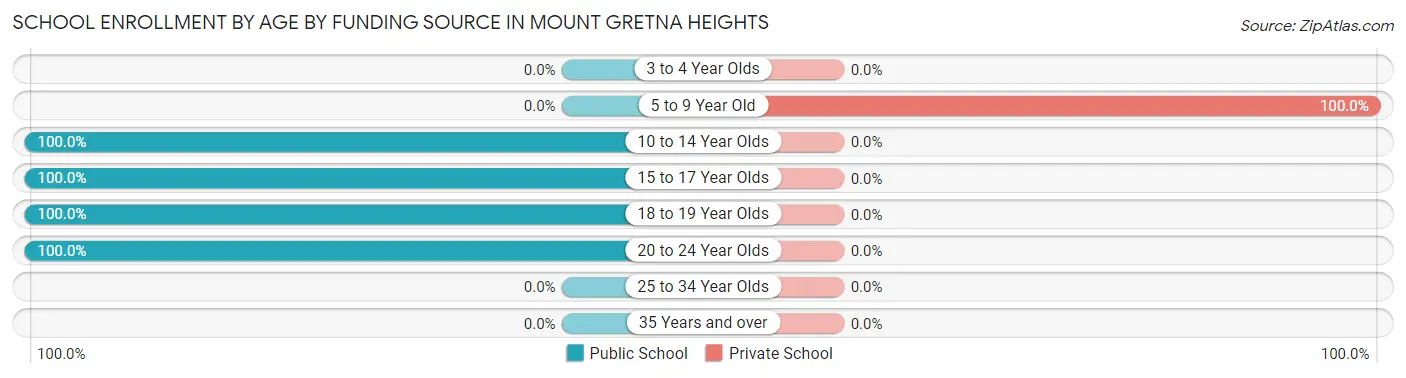
| Age Bracket | Public School | Private School |
| 3 to 4 Year Olds | 0 (0.0%) | 0 (0.0%) |
| 5 to 9 Year Old | 0 (0.0%) | 11 (100.0%) |
| 10 to 14 Year Olds | 31 (100.0%) | 0 (0.0%) |
| 15 to 17 Year Olds | 11 (100.0%) | 0 (0.0%) |
| 18 to 19 Year Olds | 15 (100.0%) | 0 (0.0%) |
| 20 to 24 Year Olds | 6 (100.0%) | 0 (0.0%) |
| 25 to 34 Year Olds | 0 (0.0%) | 0 (0.0%) |
| 35 Years and over | 0 (0.0%) | 0 (0.0%) |
| Total | 63 (85.1%) | 11 (14.9%) |
Educational Attainment by Field of Study in Mount Gretna Heights
Education (20 | 25.3%), science & technology (18 | 22.8%), engineering (14 | 17.7%), literature & languages (11 | 13.9%), and arts & humanities (10 | 12.7%) are the most common fields of study among 79 individuals in Mount Gretna Heights who have obtained a bachelor's degree or higher.
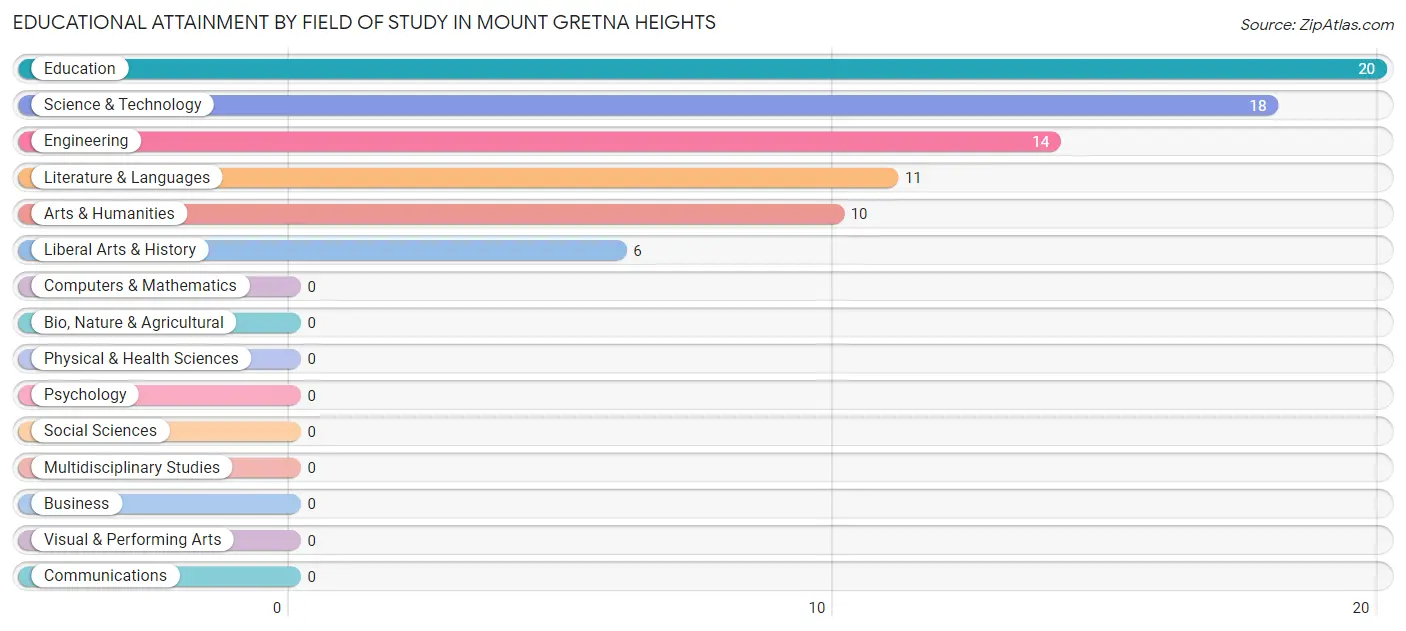
| Field of Study | # Graduates | % Graduates |
| Computers & Mathematics | 0 | 0.0% |
| Bio, Nature & Agricultural | 0 | 0.0% |
| Physical & Health Sciences | 0 | 0.0% |
| Psychology | 0 | 0.0% |
| Social Sciences | 0 | 0.0% |
| Engineering | 14 | 17.7% |
| Multidisciplinary Studies | 0 | 0.0% |
| Science & Technology | 18 | 22.8% |
| Business | 0 | 0.0% |
| Education | 20 | 25.3% |
| Literature & Languages | 11 | 13.9% |
| Liberal Arts & History | 6 | 7.6% |
| Visual & Performing Arts | 0 | 0.0% |
| Communications | 0 | 0.0% |
| Arts & Humanities | 10 | 12.7% |
| Total | 79 | 100.0% |
Transportation & Commute in Mount Gretna Heights
Vehicle Availability by Sex in Mount Gretna Heights
The most prevalent vehicle ownership categories in Mount Gretna Heights are males with 1 vehicle (21, accounting for 42.0%) and females with 1 vehicle (34, making up 25.3%).
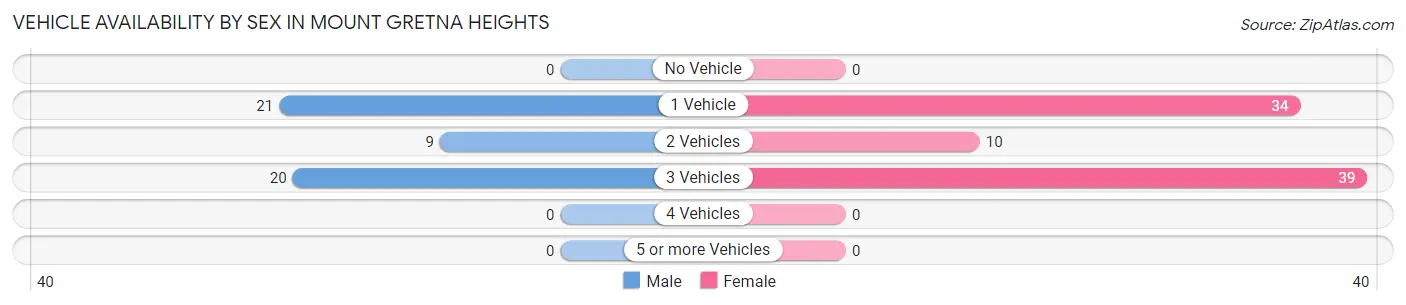
| Vehicles Available | Male | Female |
| No Vehicle | 0 (0.0%) | 0 (0.0%) |
| 1 Vehicle | 21 (42.0%) | 34 (41.0%) |
| 2 Vehicles | 9 (18.0%) | 10 (12.0%) |
| 3 Vehicles | 20 (40.0%) | 39 (47.0%) |
| 4 Vehicles | 0 (0.0%) | 0 (0.0%) |
| 5 or more Vehicles | 0 (0.0%) | 0 (0.0%) |
| Total | 50 (100.0%) | 83 (100.0%) |
Commute Time in Mount Gretna Heights
The most frequently occuring commute durations in Mount Gretna Heights are 30 to 34 minutes (31 commuters, 30.7%), 60 to 89 minutes (29 commuters, 28.7%), and 25 to 29 minutes (14 commuters, 13.9%).
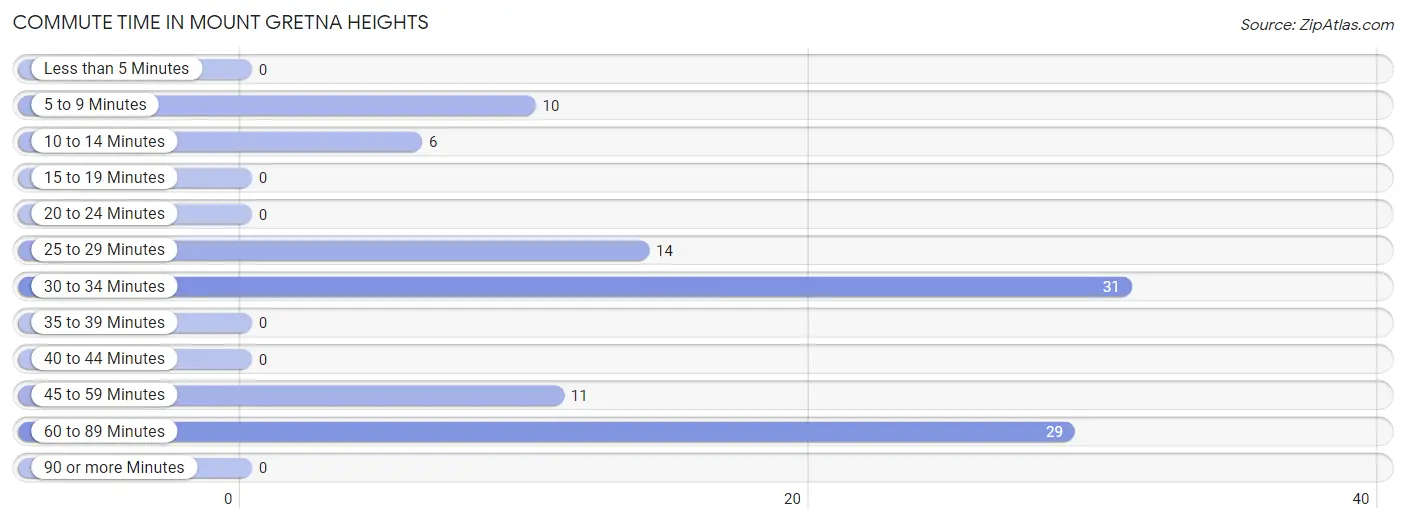
| Commute Time | # Commuters | % Commuters |
| Less than 5 Minutes | 0 | 0.0% |
| 5 to 9 Minutes | 10 | 9.9% |
| 10 to 14 Minutes | 6 | 5.9% |
| 15 to 19 Minutes | 0 | 0.0% |
| 20 to 24 Minutes | 0 | 0.0% |
| 25 to 29 Minutes | 14 | 13.9% |
| 30 to 34 Minutes | 31 | 30.7% |
| 35 to 39 Minutes | 0 | 0.0% |
| 40 to 44 Minutes | 0 | 0.0% |
| 45 to 59 Minutes | 11 | 10.9% |
| 60 to 89 Minutes | 29 | 28.7% |
| 90 or more Minutes | 0 | 0.0% |
Commute Time by Sex in Mount Gretna Heights
The most common commute times in Mount Gretna Heights are 30 to 34 minutes (14 commuters, 56.0%) for males and 60 to 89 minutes (29 commuters, 38.2%) for females.
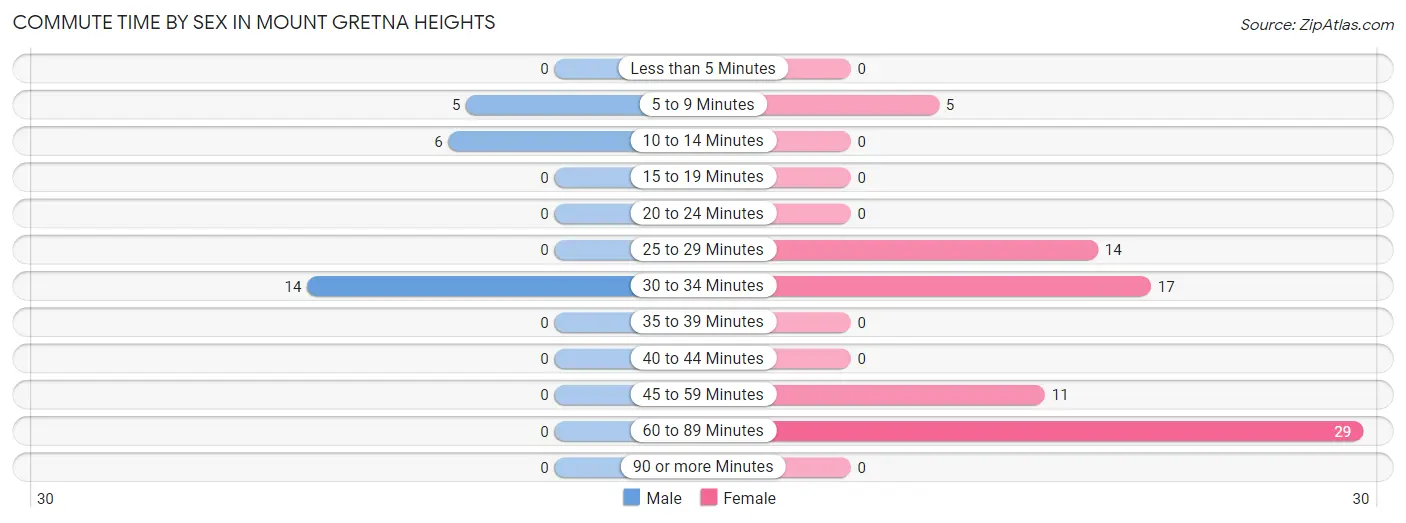
| Commute Time | Male | Female |
| Less than 5 Minutes | 0 (0.0%) | 0 (0.0%) |
| 5 to 9 Minutes | 5 (20.0%) | 5 (6.6%) |
| 10 to 14 Minutes | 6 (24.0%) | 0 (0.0%) |
| 15 to 19 Minutes | 0 (0.0%) | 0 (0.0%) |
| 20 to 24 Minutes | 0 (0.0%) | 0 (0.0%) |
| 25 to 29 Minutes | 0 (0.0%) | 14 (18.4%) |
| 30 to 34 Minutes | 14 (56.0%) | 17 (22.4%) |
| 35 to 39 Minutes | 0 (0.0%) | 0 (0.0%) |
| 40 to 44 Minutes | 0 (0.0%) | 0 (0.0%) |
| 45 to 59 Minutes | 0 (0.0%) | 11 (14.5%) |
| 60 to 89 Minutes | 0 (0.0%) | 29 (38.2%) |
| 90 or more Minutes | 0 (0.0%) | 0 (0.0%) |
Time of Departure to Work by Sex in Mount Gretna Heights
The most frequent times of departure to work in Mount Gretna Heights are 7:00 AM to 7:29 AM (14, 56.0%) for males and 7:00 AM to 7:29 AM (46, 60.5%) for females.
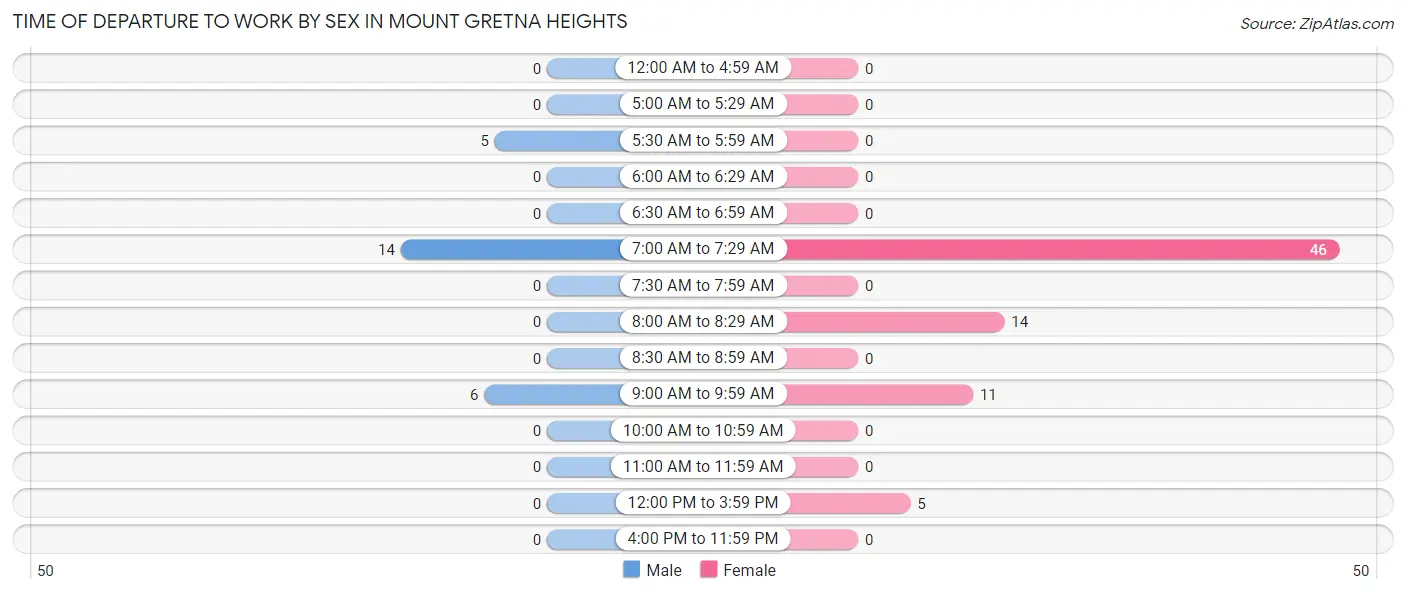
| Time of Departure | Male | Female |
| 12:00 AM to 4:59 AM | 0 (0.0%) | 0 (0.0%) |
| 5:00 AM to 5:29 AM | 0 (0.0%) | 0 (0.0%) |
| 5:30 AM to 5:59 AM | 5 (20.0%) | 0 (0.0%) |
| 6:00 AM to 6:29 AM | 0 (0.0%) | 0 (0.0%) |
| 6:30 AM to 6:59 AM | 0 (0.0%) | 0 (0.0%) |
| 7:00 AM to 7:29 AM | 14 (56.0%) | 46 (60.5%) |
| 7:30 AM to 7:59 AM | 0 (0.0%) | 0 (0.0%) |
| 8:00 AM to 8:29 AM | 0 (0.0%) | 14 (18.4%) |
| 8:30 AM to 8:59 AM | 0 (0.0%) | 0 (0.0%) |
| 9:00 AM to 9:59 AM | 6 (24.0%) | 11 (14.5%) |
| 10:00 AM to 10:59 AM | 0 (0.0%) | 0 (0.0%) |
| 11:00 AM to 11:59 AM | 0 (0.0%) | 0 (0.0%) |
| 12:00 PM to 3:59 PM | 0 (0.0%) | 5 (6.6%) |
| 4:00 PM to 11:59 PM | 0 (0.0%) | 0 (0.0%) |
| Total | 25 (100.0%) | 76 (100.0%) |
Housing Occupancy in Mount Gretna Heights
Occupancy by Ownership in Mount Gretna Heights
Of the total 99 dwellings in Mount Gretna Heights, owner-occupied units account for 93 (93.9%), while renter-occupied units make up 6 (6.1%).
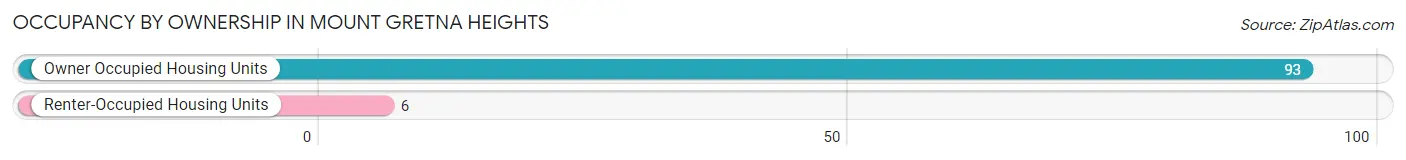
| Occupancy | # Housing Units | % Housing Units |
| Owner Occupied Housing Units | 93 | 93.9% |
| Renter-Occupied Housing Units | 6 | 6.1% |
| Total Occupied Housing Units | 99 | 100.0% |
Occupancy by Household Size in Mount Gretna Heights
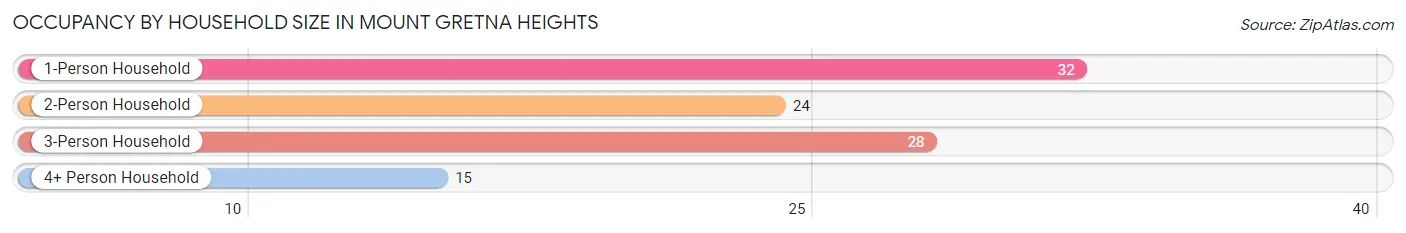
| Household Size | # Housing Units | % Housing Units |
| 1-Person Household | 32 | 32.3% |
| 2-Person Household | 24 | 24.2% |
| 3-Person Household | 28 | 28.3% |
| 4+ Person Household | 15 | 15.1% |
| Total Housing Units | 99 | 100.0% |
Occupancy by Ownership by Household Size in Mount Gretna Heights
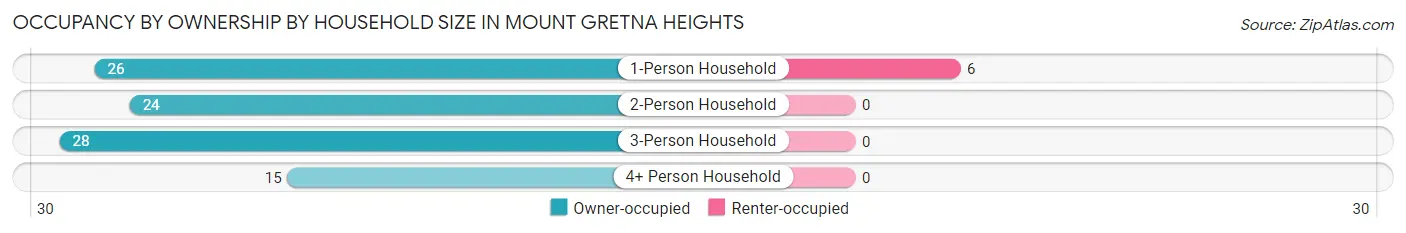
| Household Size | Owner-occupied | Renter-occupied |
| 1-Person Household | 26 (81.2%) | 6 (18.8%) |
| 2-Person Household | 24 (100.0%) | 0 (0.0%) |
| 3-Person Household | 28 (100.0%) | 0 (0.0%) |
| 4+ Person Household | 15 (100.0%) | 0 (0.0%) |
| Total Housing Units | 93 (93.9%) | 6 (6.1%) |
Occupancy by Educational Attainment in Mount Gretna Heights
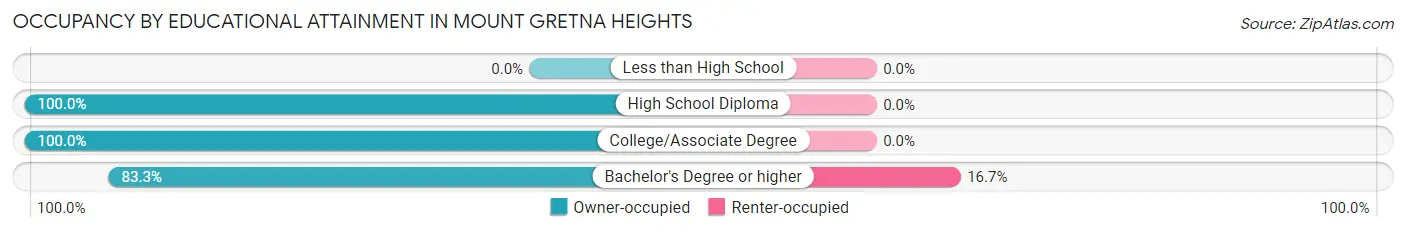
| Household Size | Owner-occupied | Renter-occupied |
| Less than High School | 0 (0.0%) | 0 (0.0%) |
| High School Diploma | 20 (100.0%) | 0 (0.0%) |
| College/Associate Degree | 43 (100.0%) | 0 (0.0%) |
| Bachelor's Degree or higher | 30 (83.3%) | 6 (16.7%) |
Occupancy by Age of Householder in Mount Gretna Heights
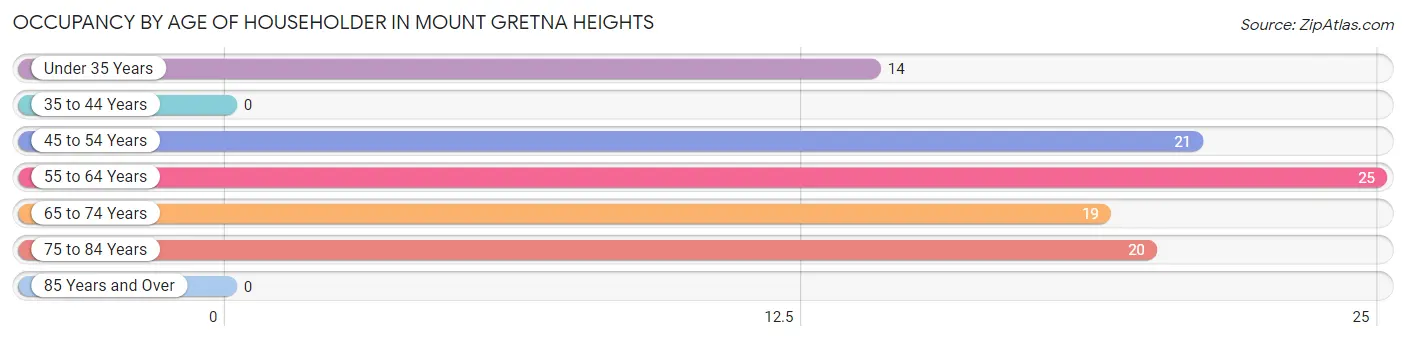
| Age Bracket | # Households | % Households |
| Under 35 Years | 14 | 14.1% |
| 35 to 44 Years | 0 | 0.0% |
| 45 to 54 Years | 21 | 21.2% |
| 55 to 64 Years | 25 | 25.3% |
| 65 to 74 Years | 19 | 19.2% |
| 75 to 84 Years | 20 | 20.2% |
| 85 Years and Over | 0 | 0.0% |
| Total | 99 | 100.0% |
Housing Finances in Mount Gretna Heights
Median Income by Occupancy in Mount Gretna Heights
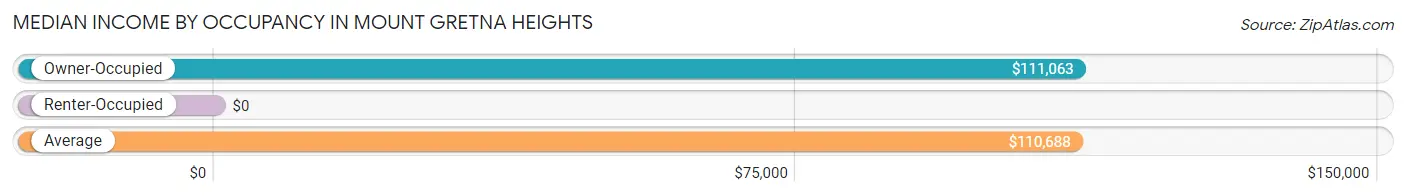
| Occupancy Type | # Households | Median Income |
| Owner-Occupied | 93 (93.9%) | $111,063 |
| Renter-Occupied | 6 (6.1%) | $0 |
| Average | 99 (100.0%) | $110,688 |
Occupancy by Householder Income Bracket in Mount Gretna Heights
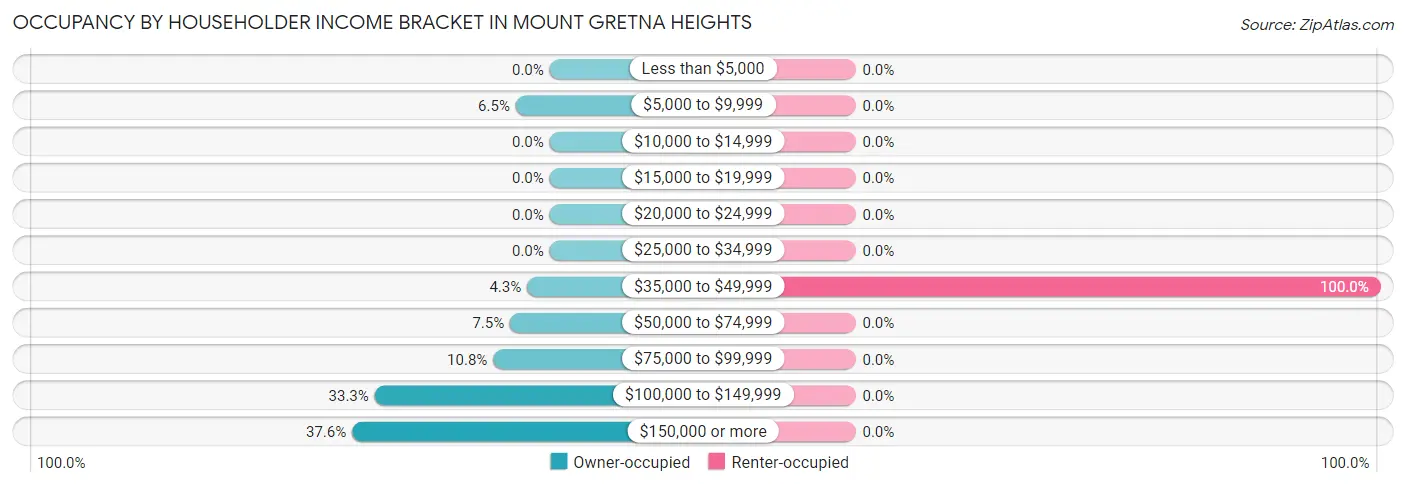
| Income Bracket | Owner-occupied | Renter-occupied |
| Less than $5,000 | 0 (0.0%) | 0 (0.0%) |
| $5,000 to $9,999 | 6 (6.5%) | 0 (0.0%) |
| $10,000 to $14,999 | 0 (0.0%) | 0 (0.0%) |
| $15,000 to $19,999 | 0 (0.0%) | 0 (0.0%) |
| $20,000 to $24,999 | 0 (0.0%) | 0 (0.0%) |
| $25,000 to $34,999 | 0 (0.0%) | 0 (0.0%) |
| $35,000 to $49,999 | 4 (4.3%) | 6 (100.0%) |
| $50,000 to $74,999 | 7 (7.5%) | 0 (0.0%) |
| $75,000 to $99,999 | 10 (10.7%) | 0 (0.0%) |
| $100,000 to $149,999 | 31 (33.3%) | 0 (0.0%) |
| $150,000 or more | 35 (37.6%) | 0 (0.0%) |
| Total | 93 (100.0%) | 6 (100.0%) |
Monthly Housing Cost Tiers in Mount Gretna Heights
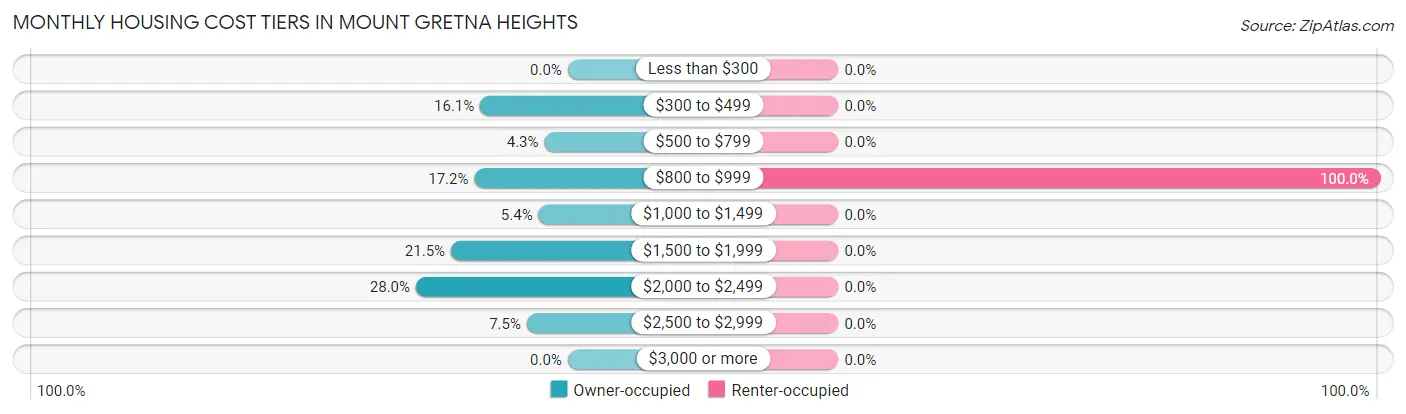
| Monthly Cost | Owner-occupied | Renter-occupied |
| Less than $300 | 0 (0.0%) | 0 (0.0%) |
| $300 to $499 | 15 (16.1%) | 0 (0.0%) |
| $500 to $799 | 4 (4.3%) | 0 (0.0%) |
| $800 to $999 | 16 (17.2%) | 6 (100.0%) |
| $1,000 to $1,499 | 5 (5.4%) | 0 (0.0%) |
| $1,500 to $1,999 | 20 (21.5%) | 0 (0.0%) |
| $2,000 to $2,499 | 26 (28.0%) | 0 (0.0%) |
| $2,500 to $2,999 | 7 (7.5%) | 0 (0.0%) |
| $3,000 or more | 0 (0.0%) | 0 (0.0%) |
| Total | 93 (100.0%) | 6 (100.0%) |
Physical Housing Characteristics in Mount Gretna Heights
Housing Structures in Mount Gretna Heights
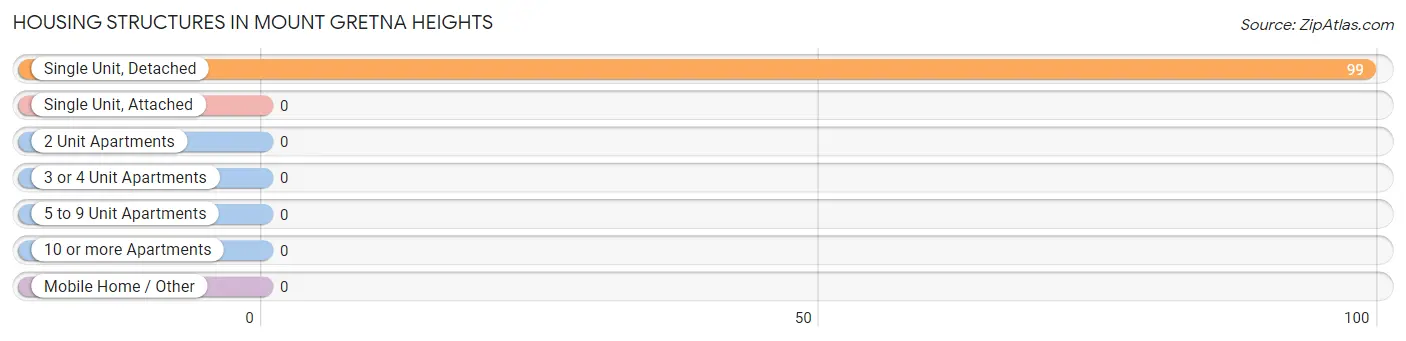
| Structure Type | # Housing Units | % Housing Units |
| Single Unit, Detached | 99 | 100.0% |
| Single Unit, Attached | 0 | 0.0% |
| 2 Unit Apartments | 0 | 0.0% |
| 3 or 4 Unit Apartments | 0 | 0.0% |
| 5 to 9 Unit Apartments | 0 | 0.0% |
| 10 or more Apartments | 0 | 0.0% |
| Mobile Home / Other | 0 | 0.0% |
| Total | 99 | 100.0% |
Housing Structures by Occupancy in Mount Gretna Heights
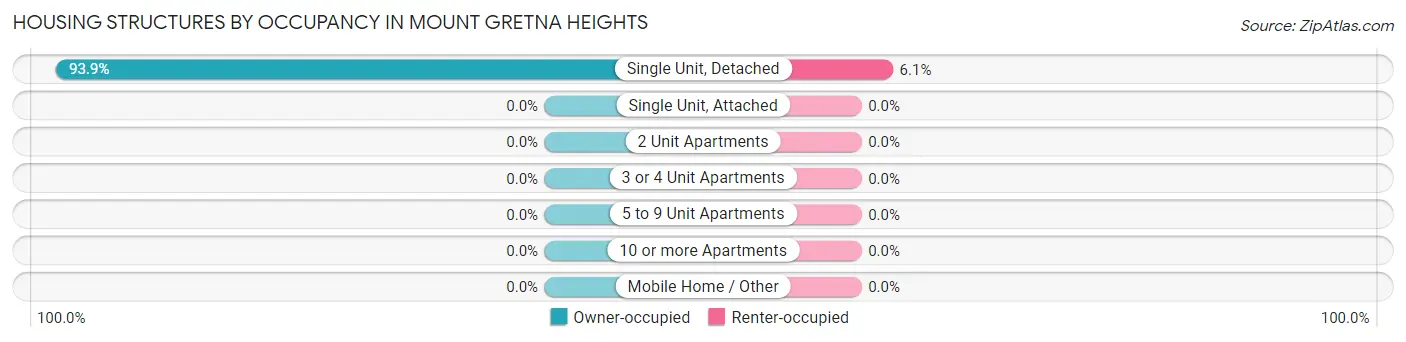
| Structure Type | Owner-occupied | Renter-occupied |
| Single Unit, Detached | 93 (93.9%) | 6 (6.1%) |
| Single Unit, Attached | 0 (0.0%) | 0 (0.0%) |
| 2 Unit Apartments | 0 (0.0%) | 0 (0.0%) |
| 3 or 4 Unit Apartments | 0 (0.0%) | 0 (0.0%) |
| 5 to 9 Unit Apartments | 0 (0.0%) | 0 (0.0%) |
| 10 or more Apartments | 0 (0.0%) | 0 (0.0%) |
| Mobile Home / Other | 0 (0.0%) | 0 (0.0%) |
| Total | 93 (93.9%) | 6 (6.1%) |
Housing Structures by Number of Rooms in Mount Gretna Heights
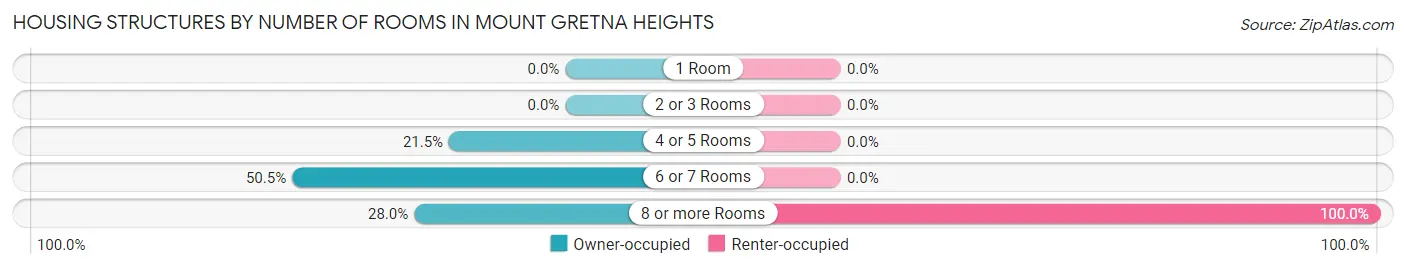
| Number of Rooms | Owner-occupied | Renter-occupied |
| 1 Room | 0 (0.0%) | 0 (0.0%) |
| 2 or 3 Rooms | 0 (0.0%) | 0 (0.0%) |
| 4 or 5 Rooms | 20 (21.5%) | 0 (0.0%) |
| 6 or 7 Rooms | 47 (50.5%) | 0 (0.0%) |
| 8 or more Rooms | 26 (28.0%) | 6 (100.0%) |
| Total | 93 (100.0%) | 6 (100.0%) |
Housing Structure by Heating Type in Mount Gretna Heights
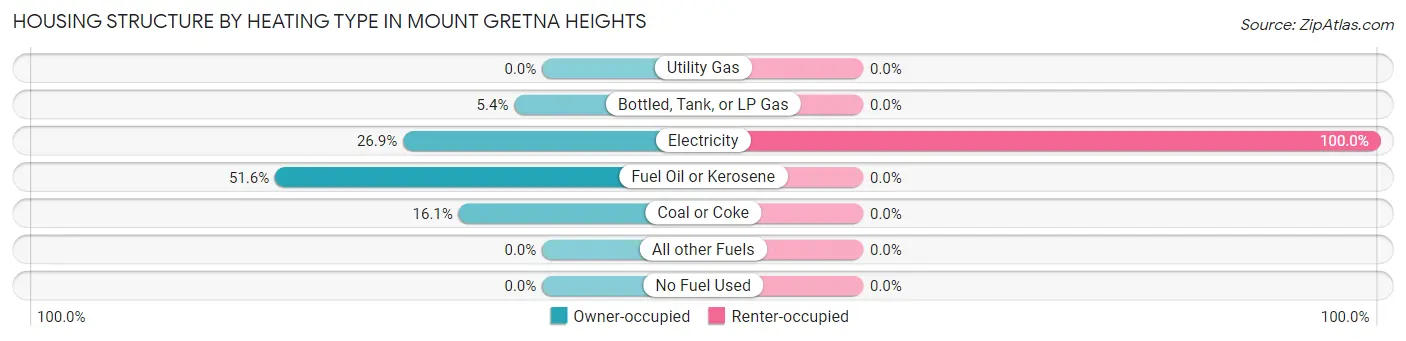
| Heating Type | Owner-occupied | Renter-occupied |
| Utility Gas | 0 (0.0%) | 0 (0.0%) |
| Bottled, Tank, or LP Gas | 5 (5.4%) | 0 (0.0%) |
| Electricity | 25 (26.9%) | 6 (100.0%) |
| Fuel Oil or Kerosene | 48 (51.6%) | 0 (0.0%) |
| Coal or Coke | 15 (16.1%) | 0 (0.0%) |
| All other Fuels | 0 (0.0%) | 0 (0.0%) |
| No Fuel Used | 0 (0.0%) | 0 (0.0%) |
| Total | 93 (100.0%) | 6 (100.0%) |
Household Vehicle Usage in Mount Gretna Heights
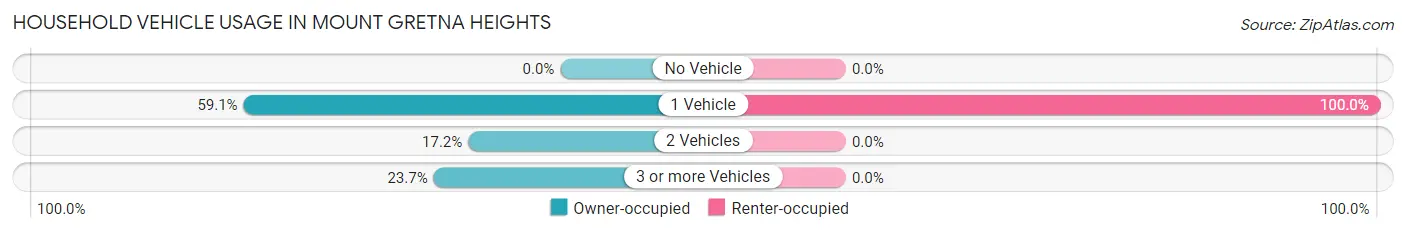
| Vehicles per Household | Owner-occupied | Renter-occupied |
| No Vehicle | 0 (0.0%) | 0 (0.0%) |
| 1 Vehicle | 55 (59.1%) | 6 (100.0%) |
| 2 Vehicles | 16 (17.2%) | 0 (0.0%) |
| 3 or more Vehicles | 22 (23.7%) | 0 (0.0%) |
| Total | 93 (100.0%) | 6 (100.0%) |
Real Estate & Mortgages in Mount Gretna Heights
Real Estate and Mortgage Overview in Mount Gretna Heights
| Characteristic | Without Mortgage | With Mortgage |
| Housing Units | 42 | 51 |
| Median Property Value | $270,000 | $305,600 |
| Median Household Income | $101,136 | $20 |
| Monthly Housing Costs | $813 | $0 |
| Real Estate Taxes | $3,808 | $0 |
Property Value by Mortgage Status in Mount Gretna Heights
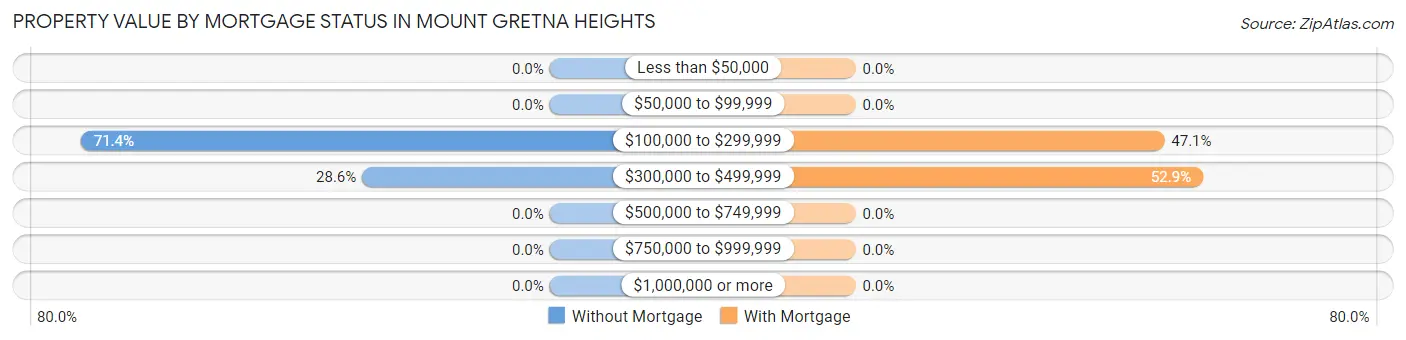
| Property Value | Without Mortgage | With Mortgage |
| Less than $50,000 | 0 (0.0%) | 0 (0.0%) |
| $50,000 to $99,999 | 0 (0.0%) | 0 (0.0%) |
| $100,000 to $299,999 | 30 (71.4%) | 24 (47.1%) |
| $300,000 to $499,999 | 12 (28.6%) | 27 (52.9%) |
| $500,000 to $749,999 | 0 (0.0%) | 0 (0.0%) |
| $750,000 to $999,999 | 0 (0.0%) | 0 (0.0%) |
| $1,000,000 or more | 0 (0.0%) | 0 (0.0%) |
| Total | 42 (100.0%) | 51 (100.0%) |
Household Income by Mortgage Status in Mount Gretna Heights
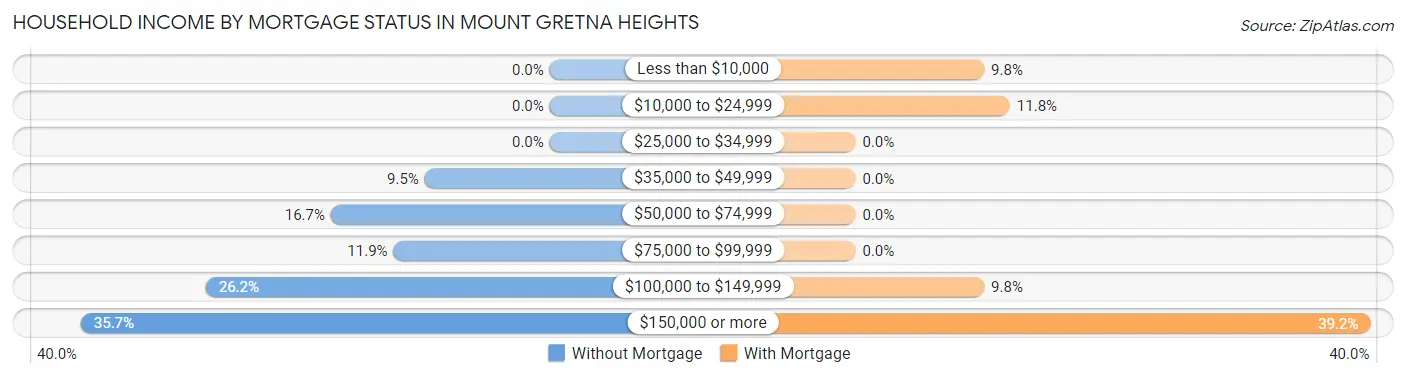
| Household Income | Without Mortgage | With Mortgage |
| Less than $10,000 | 0 (0.0%) | 5 (9.8%) |
| $10,000 to $24,999 | 0 (0.0%) | 6 (11.8%) |
| $25,000 to $34,999 | 0 (0.0%) | 0 (0.0%) |
| $35,000 to $49,999 | 4 (9.5%) | 0 (0.0%) |
| $50,000 to $74,999 | 7 (16.7%) | 0 (0.0%) |
| $75,000 to $99,999 | 5 (11.9%) | 0 (0.0%) |
| $100,000 to $149,999 | 11 (26.2%) | 5 (9.8%) |
| $150,000 or more | 15 (35.7%) | 20 (39.2%) |
| Total | 42 (100.0%) | 51 (100.0%) |
Property Value to Household Income Ratio in Mount Gretna Heights
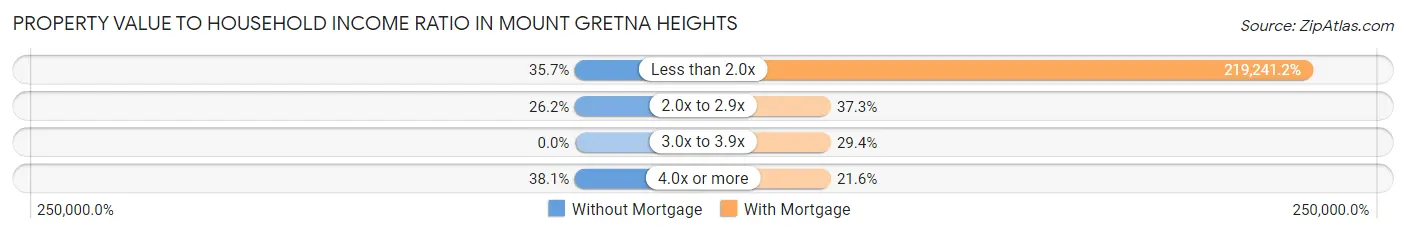
| Value-to-Income Ratio | Without Mortgage | With Mortgage |
| Less than 2.0x | 15 (35.7%) | 111,813 (219,241.2%) |
| 2.0x to 2.9x | 11 (26.2%) | 19 (37.2%) |
| 3.0x to 3.9x | 0 (0.0%) | 15 (29.4%) |
| 4.0x or more | 16 (38.1%) | 11 (21.6%) |
| Total | 42 (100.0%) | 51 (100.0%) |
Real Estate Taxes by Mortgage Status in Mount Gretna Heights
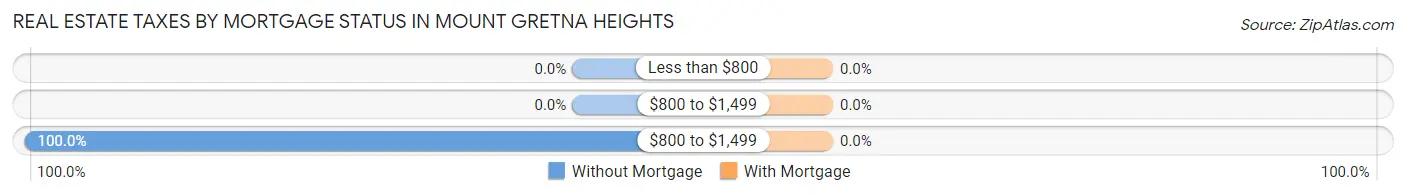
| Property Taxes | Without Mortgage | With Mortgage |
| Less than $800 | 0 (0.0%) | 0 (0.0%) |
| $800 to $1,499 | 0 (0.0%) | 0 (0.0%) |
| $800 to $1,499 | 42 (100.0%) | 0 (0.0%) |
| Total | 42 (100.0%) | 51 (100.0%) |
Health & Disability in Mount Gretna Heights
Health Insurance Coverage by Age in Mount Gretna Heights
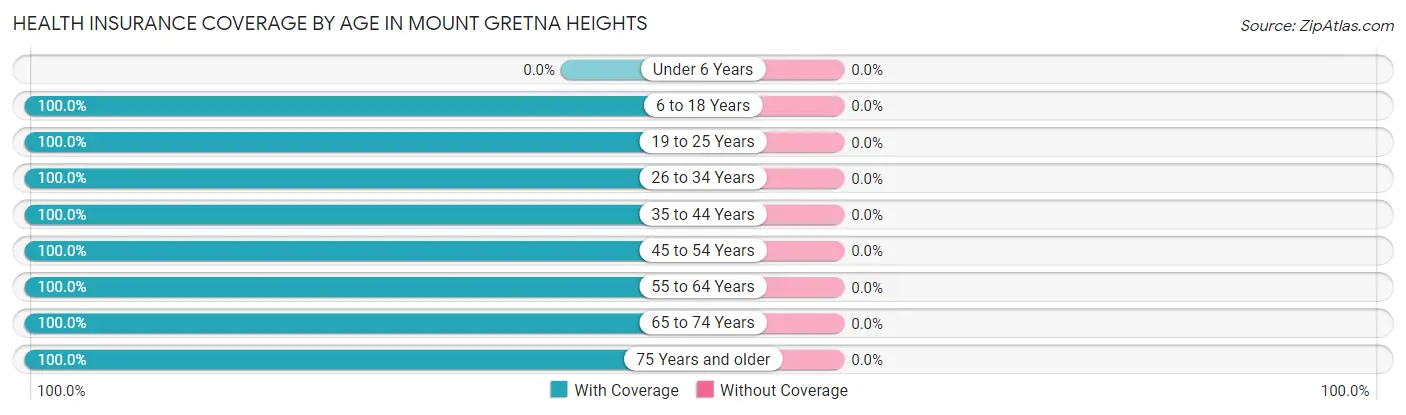
| Age Bracket | With Coverage | Without Coverage |
| Under 6 Years | 0 (0.0%) | 0 (0.0%) |
| 6 to 18 Years | 62 (100.0%) | 0 (0.0%) |
| 19 to 25 Years | 34 (100.0%) | 0 (0.0%) |
| 26 to 34 Years | 14 (100.0%) | 0 (0.0%) |
| 35 to 44 Years | 14 (100.0%) | 0 (0.0%) |
| 45 to 54 Years | 39 (100.0%) | 0 (0.0%) |
| 55 to 64 Years | 35 (100.0%) | 0 (0.0%) |
| 65 to 74 Years | 19 (100.0%) | 0 (0.0%) |
| 75 Years and older | 20 (100.0%) | 0 (0.0%) |
| Total | 237 (100.0%) | 0 (0.0%) |
Health Insurance Coverage by Citizenship Status in Mount Gretna Heights
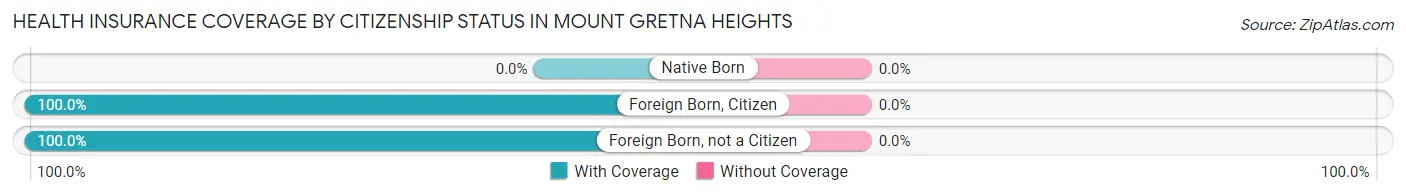
| Citizenship Status | With Coverage | Without Coverage |
| Native Born | 0 (0.0%) | 0 (0.0%) |
| Foreign Born, Citizen | 62 (100.0%) | 0 (0.0%) |
| Foreign Born, not a Citizen | 34 (100.0%) | 0 (0.0%) |
Health Insurance Coverage by Household Income in Mount Gretna Heights
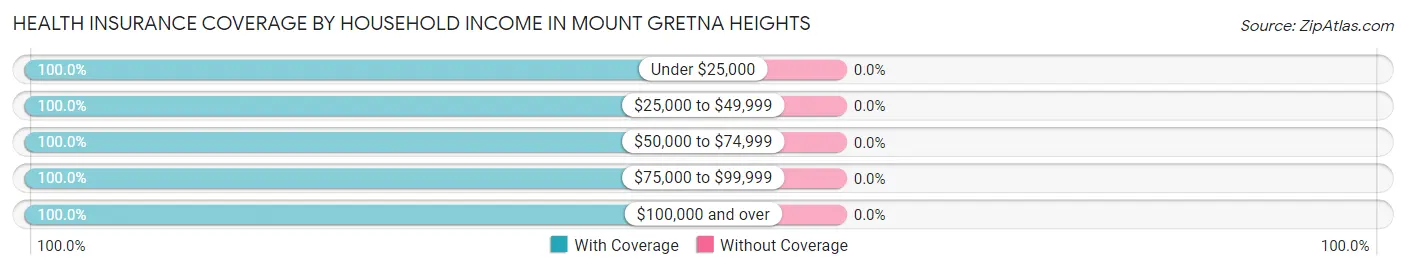
| Household Income | With Coverage | Without Coverage |
| Under $25,000 | 6 (100.0%) | 0 (0.0%) |
| $25,000 to $49,999 | 10 (100.0%) | 0 (0.0%) |
| $50,000 to $74,999 | 19 (100.0%) | 0 (0.0%) |
| $75,000 to $99,999 | 15 (100.0%) | 0 (0.0%) |
| $100,000 and over | 187 (100.0%) | 0 (0.0%) |
Public vs Private Health Insurance Coverage by Age in Mount Gretna Heights
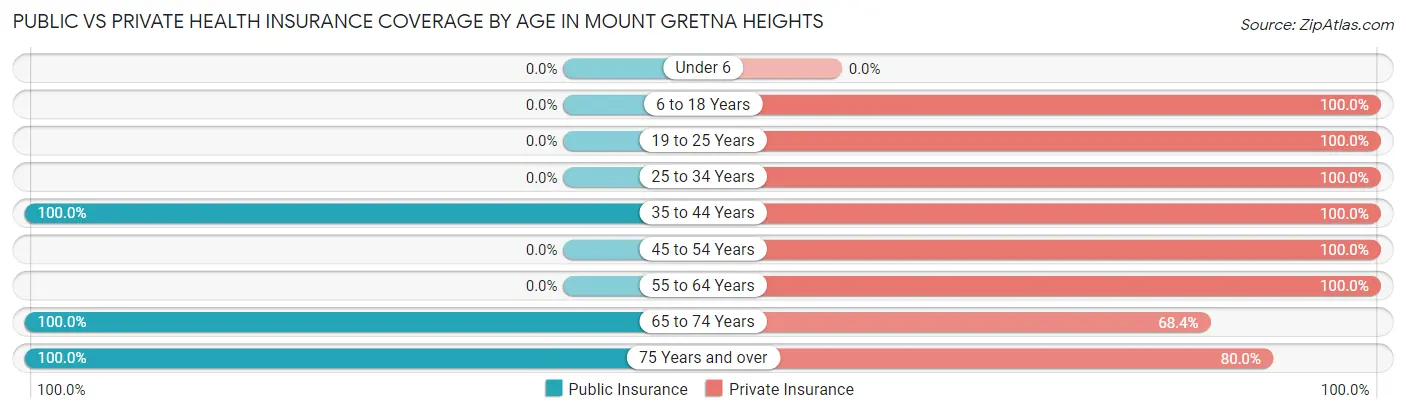
| Age Bracket | Public Insurance | Private Insurance |
| Under 6 | 0 (0.0%) | 0 (0.0%) |
| 6 to 18 Years | 0 (0.0%) | 62 (100.0%) |
| 19 to 25 Years | 0 (0.0%) | 34 (100.0%) |
| 25 to 34 Years | 0 (0.0%) | 14 (100.0%) |
| 35 to 44 Years | 14 (100.0%) | 14 (100.0%) |
| 45 to 54 Years | 0 (0.0%) | 39 (100.0%) |
| 55 to 64 Years | 0 (0.0%) | 35 (100.0%) |
| 65 to 74 Years | 19 (100.0%) | 13 (68.4%) |
| 75 Years and over | 20 (100.0%) | 16 (80.0%) |
| Total | 53 (22.4%) | 227 (95.8%) |
Disability Status by Sex by Age in Mount Gretna Heights
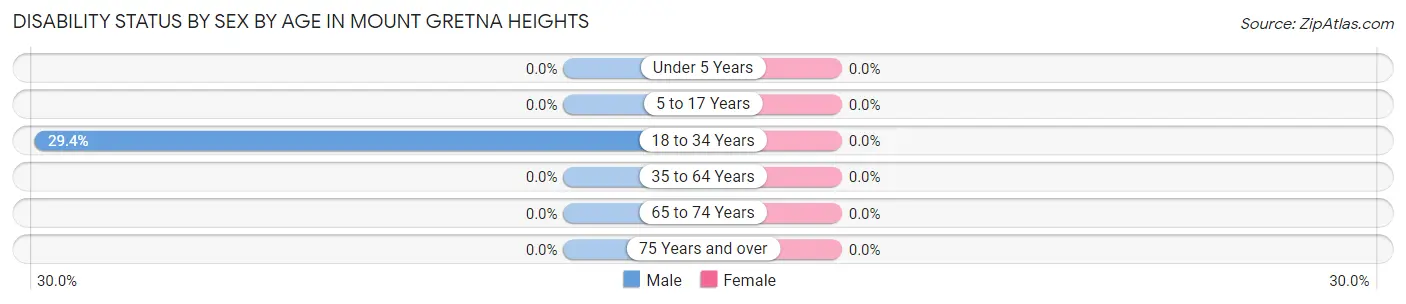
| Age Bracket | Male | Female |
| Under 5 Years | 0 (0.0%) | 0 (0.0%) |
| 5 to 17 Years | 0 (0.0%) | 0 (0.0%) |
| 18 to 34 Years | 5 (29.4%) | 0 (0.0%) |
| 35 to 64 Years | 0 (0.0%) | 0 (0.0%) |
| 65 to 74 Years | 0 (0.0%) | 0 (0.0%) |
| 75 Years and over | 0 (0.0%) | 0 (0.0%) |
Disability Class by Sex by Age in Mount Gretna Heights
Disability Class: Hearing Difficulty
| Age Bracket | Male | Female |
| Under 5 Years | 0 (0.0%) | 0 (0.0%) |
| 5 to 17 Years | 0 (0.0%) | 0 (0.0%) |
| 18 to 34 Years | 0 (0.0%) | 0 (0.0%) |
| 35 to 64 Years | 0 (0.0%) | 0 (0.0%) |
| 65 to 74 Years | 0 (0.0%) | 0 (0.0%) |
| 75 Years and over | 0 (0.0%) | 0 (0.0%) |
Disability Class: Vision Difficulty
| Age Bracket | Male | Female |
| Under 5 Years | 0 (0.0%) | 0 (0.0%) |
| 5 to 17 Years | 0 (0.0%) | 0 (0.0%) |
| 18 to 34 Years | 0 (0.0%) | 0 (0.0%) |
| 35 to 64 Years | 0 (0.0%) | 0 (0.0%) |
| 65 to 74 Years | 0 (0.0%) | 0 (0.0%) |
| 75 Years and over | 0 (0.0%) | 0 (0.0%) |
Disability Class: Cognitive Difficulty

| Age Bracket | Male | Female |
| 5 to 17 Years | 0 (0.0%) | 0 (0.0%) |
| 18 to 34 Years | 0 (0.0%) | 0 (0.0%) |
| 35 to 64 Years | 0 (0.0%) | 0 (0.0%) |
| 65 to 74 Years | 0 (0.0%) | 0 (0.0%) |
| 75 Years and over | 0 (0.0%) | 0 (0.0%) |
Disability Class: Ambulatory Difficulty
| Age Bracket | Male | Female |
| 5 to 17 Years | 0 (0.0%) | 0 (0.0%) |
| 18 to 34 Years | 0 (0.0%) | 0 (0.0%) |
| 35 to 64 Years | 0 (0.0%) | 0 (0.0%) |
| 65 to 74 Years | 0 (0.0%) | 0 (0.0%) |
| 75 Years and over | 0 (0.0%) | 0 (0.0%) |
Disability Class: Self-Care Difficulty
| Age Bracket | Male | Female |
| 5 to 17 Years | 0 (0.0%) | 0 (0.0%) |
| 18 to 34 Years | 0 (0.0%) | 0 (0.0%) |
| 35 to 64 Years | 0 (0.0%) | 0 (0.0%) |
| 65 to 74 Years | 0 (0.0%) | 0 (0.0%) |
| 75 Years and over | 0 (0.0%) | 0 (0.0%) |
Technology Access in Mount Gretna Heights
Computing Device Access in Mount Gretna Heights
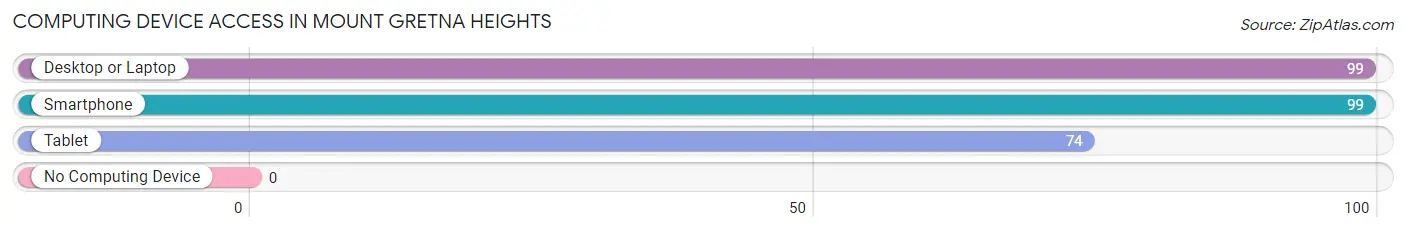
| Device Type | # Households | % Households |
| Desktop or Laptop | 99 | 100.0% |
| Smartphone | 99 | 100.0% |
| Tablet | 74 | 74.8% |
| No Computing Device | 0 | 0.0% |
| Total | 99 | 100.0% |
Internet Access in Mount Gretna Heights
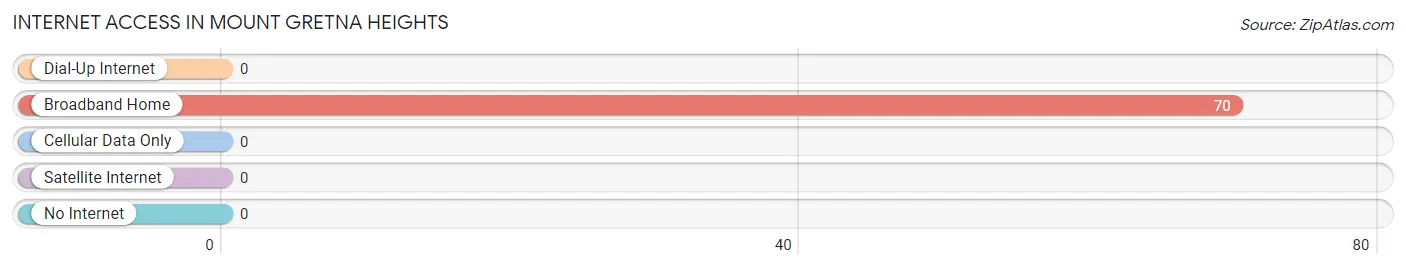
| Internet Type | # Households | % Households |
| Dial-Up Internet | 0 | 0.0% |
| Broadband Home | 70 | 70.7% |
| Cellular Data Only | 0 | 0.0% |
| Satellite Internet | 0 | 0.0% |
| No Internet | 0 | 0.0% |
| Total | 99 | 100.0% |
Mount Gretna Heights Summary
History
Mount Gretna Heights is a small borough located in Lebanon County, Pennsylvania. It is situated in the southeastern part of the state, about 10 miles east of the city of Harrisburg. The borough was founded in 1891 by a group of entrepreneurs who wanted to create a summer resort community. The area was originally known as “Gretna Heights” and was named after the nearby town of Gretna, which was founded in 1790.
The area was first settled in the late 1700s by German immigrants who were attracted to the area’s natural beauty and abundant resources. The first settlers built log cabins and cleared the land for farming. In the early 1800s, the area was known as “Gretna Heights” and was a popular destination for summer vacationers. The area was also home to a number of resorts, including the Mount Gretna Hotel, which was built in 1891.
In the late 1800s, the area began to attract more permanent residents. The population grew steadily throughout the early 1900s, and by the 1950s, the borough had become a popular summer destination for families. The area was also home to a number of summer camps, including Camp Mount Gretna, which was founded in 1921.
Geography
Mount Gretna Heights is located in the southeastern part of Lebanon County, Pennsylvania. It is situated in the Appalachian Mountains, about 10 miles east of the city of Harrisburg. The borough is bordered by the townships of South Londonderry, East Hanover, and North Annville. The area is characterized by rolling hills and lush forests. The borough is home to a number of lakes, including Lake Conewago, which is the largest lake in the area.
The climate in Mount Gretna Heights is humid continental, with hot summers and cold winters. The average annual temperature is around 50 degrees Fahrenheit. The area receives an average of 40 inches of precipitation per year, with most of it falling in the form of snow during the winter months.
Economy
The economy of Mount Gretna Heights is largely based on tourism. The area is home to a number of resorts, campgrounds, and other recreational facilities. The borough is also home to a number of small businesses, including restaurants, shops, and galleries.
The area is also home to a number of manufacturing companies, including a paper mill and a furniture factory. The borough is also home to a number of farms, which produce a variety of crops, including corn, soybeans, and hay.
Demographics
As of the 2010 census, the population of Mount Gretna Heights was 1,845. The racial makeup of the borough was 97.3% White, 0.7% African American, 0.2% Native American, 0.3% Asian, and 1.5% from other races. The median household income was $50,938, and the median family income was $60,938.
The population of Mount Gretna Heights is largely made up of families. The median age of the population is 43.7 years, and the majority of the population is married. The borough is home to a number of churches, including the Mount Gretna United Methodist Church and the Mount Gretna Presbyterian Church.
Conclusion
Mount Gretna Heights is a small borough located in Lebanon County, Pennsylvania. It is situated in the Appalachian Mountains, about 10 miles east of the city of Harrisburg. The area was first settled in the late 1700s by German immigrants and was later developed into a summer resort community. The economy of the borough is largely based on tourism, and the population is largely made up of families. The median age of the population is 43.7 years, and the median household income is $50,938.
Common Questions
What is Per Capita Income in Mount Gretna Heights?
Per Capita income in Mount Gretna Heights is $44,694.
What is the Median Family Income in Mount Gretna Heights?
Median Family Income in Mount Gretna Heights is $150,250.
What is the Median Household income in Mount Gretna Heights?
Median Household Income in Mount Gretna Heights is $110,688.
What is Inequality or Gini Index in Mount Gretna Heights?
Inequality or Gini Index in Mount Gretna Heights is 0.28.
What is the Total Population of Mount Gretna Heights?
Total Population of Mount Gretna Heights is 237.
What is the Total Male Population of Mount Gretna Heights?
Total Male Population of Mount Gretna Heights is 97.
What is the Total Female Population of Mount Gretna Heights?
Total Female Population of Mount Gretna Heights is 140.
What is the Ratio of Males per 100 Females in Mount Gretna Heights?
There are 69.29 Males per 100 Females in Mount Gretna Heights.
What is the Ratio of Females per 100 Males in Mount Gretna Heights?
There are 144.33 Females per 100 Males in Mount Gretna Heights.
What is the Median Population Age in Mount Gretna Heights?
Median Population Age in Mount Gretna Heights is 41.6 Years.
What is the Average Family Size in Mount Gretna Heights
Average Family Size in Mount Gretna Heights is 3.1 People.
What is the Average Household Size in Mount Gretna Heights
Average Household Size in Mount Gretna Heights is 2.4 People.
How Large is the Labor Force in Mount Gretna Heights?
There are 147 People in the Labor Forcein in Mount Gretna Heights.
What is the Percentage of People in the Labor Force in Mount Gretna Heights?
75.4% of People are in the Labor Force in Mount Gretna Heights.
What is the Unemployment Rate in Mount Gretna Heights?
Unemployment Rate in Mount Gretna Heights is 9.5%.