Galeton borough, PA Map & Demographics
Galeton borough Overview
$29,530
PER CAPITA INCOME
$66,633
AVG FAMILY INCOME
$47,554
AVG HOUSEHOLD INCOME
8.1%
WAGE / INCOME GAP [ % ]
91.9¢/ $1
WAGE / INCOME GAP [ $ ]
0.45
INEQUALITY / GINI INDEX
844
TOTAL POPULATION
370
MALE POPULATION
474
FEMALE POPULATION
78.06
MALES / 100 FEMALES
128.11
FEMALES / 100 MALES
44.7
MEDIAN AGE
2.5
AVG FAMILY SIZE
2.0
AVG HOUSEHOLD SIZE
388
LABOR FORCE [ PEOPLE ]
54.3%
PERCENT IN LABOR FORCE
2.8%
UNEMPLOYMENT RATE
Income in Galeton borough
Income Overview in Galeton borough
Per Capita Income in Galeton borough is $29,530, while median incomes of families and households are $66,633 and $47,554 respectively.
| Characteristic | Number | Measure |
| Per Capita Income | 844 | $29,530 |
| Median Family Income | 234 | $66,633 |
| Mean Family Income | 234 | $78,058 |
| Median Household Income | 419 | $47,554 |
| Mean Household Income | 419 | $57,890 |
| Income Deficit | 234 | $0 |
| Wage / Income Gap (%) | 844 | 8.14% |
| Wage / Income Gap ($) | 844 | 91.86¢ per $1 |
| Gini / Inequality Index | 844 | 0.45 |
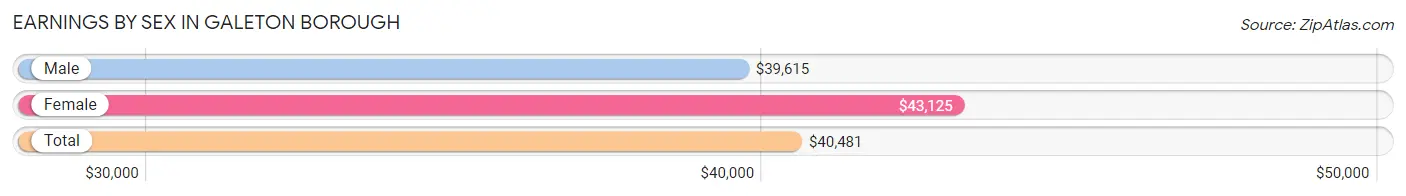
Earnings by Sex in Galeton borough
Average Earnings in Galeton borough are $40,481, $39,615 for men and $43,125 for women, a difference of 8.1%.
| Sex | Number | Average Earnings |
| Male | 188 (45.5%) | $39,615 |
| Female | 225 (54.5%) | $43,125 |
| Total | 413 (100.0%) | $40,481 |
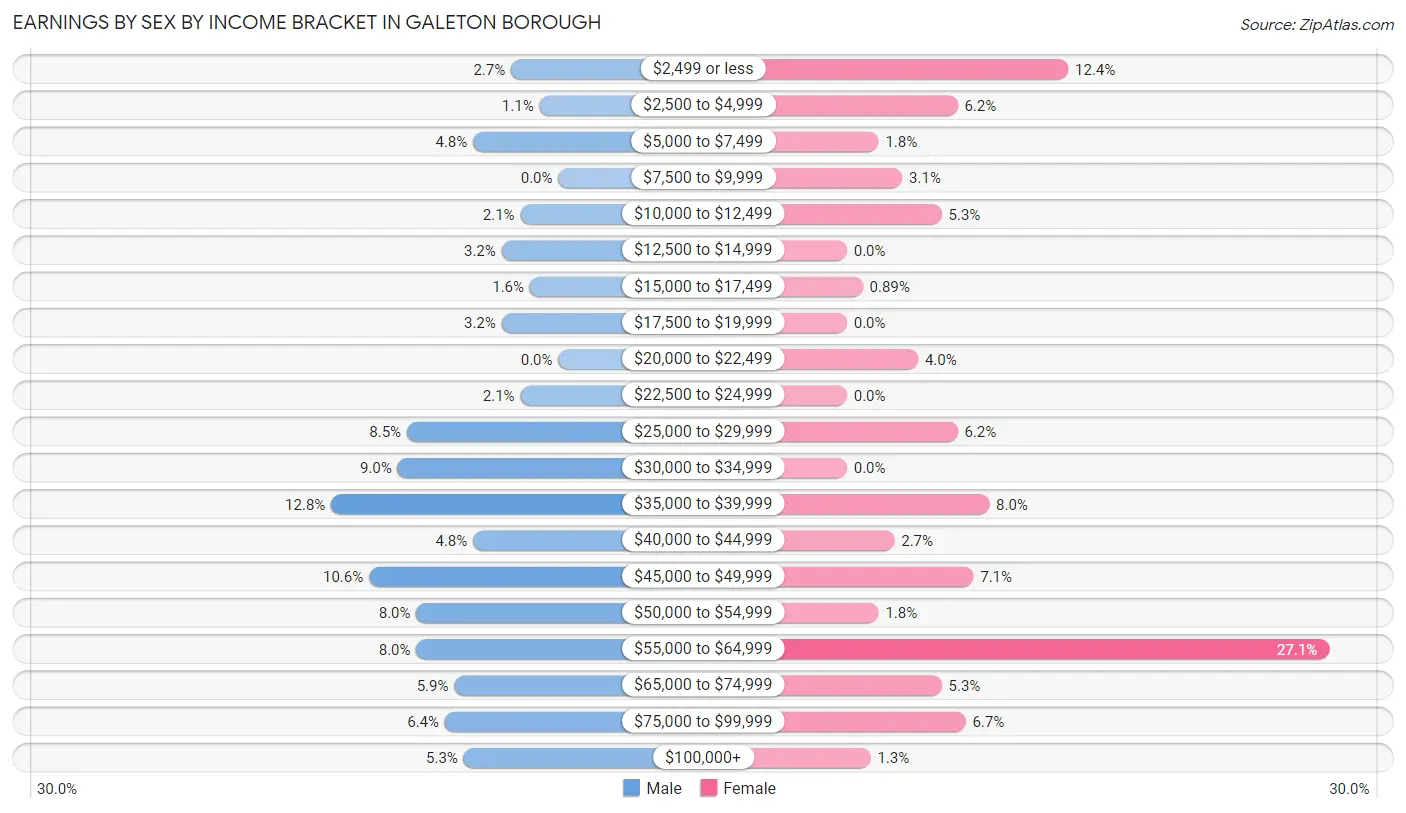
Earnings by Sex by Income Bracket in Galeton borough
The most common earnings brackets in Galeton borough are $35,000 to $39,999 for men (24 | 12.8%) and $55,000 to $64,999 for women (61 | 27.1%).
| Income | Male | Female |
| $2,499 or less | 5 (2.7%) | 28 (12.4%) |
| $2,500 to $4,999 | 2 (1.1%) | 14 (6.2%) |
| $5,000 to $7,499 | 9 (4.8%) | 4 (1.8%) |
| $7,500 to $9,999 | 0 (0.0%) | 7 (3.1%) |
| $10,000 to $12,499 | 4 (2.1%) | 12 (5.3%) |
| $12,500 to $14,999 | 6 (3.2%) | 0 (0.0%) |
| $15,000 to $17,499 | 3 (1.6%) | 2 (0.9%) |
| $17,500 to $19,999 | 6 (3.2%) | 0 (0.0%) |
| $20,000 to $22,499 | 0 (0.0%) | 9 (4.0%) |
| $22,500 to $24,999 | 4 (2.1%) | 0 (0.0%) |
| $25,000 to $29,999 | 16 (8.5%) | 14 (6.2%) |
| $30,000 to $34,999 | 17 (9.0%) | 0 (0.0%) |
| $35,000 to $39,999 | 24 (12.8%) | 18 (8.0%) |
| $40,000 to $44,999 | 9 (4.8%) | 6 (2.7%) |
| $45,000 to $49,999 | 20 (10.6%) | 16 (7.1%) |
| $50,000 to $54,999 | 15 (8.0%) | 4 (1.8%) |
| $55,000 to $64,999 | 15 (8.0%) | 61 (27.1%) |
| $65,000 to $74,999 | 11 (5.9%) | 12 (5.3%) |
| $75,000 to $99,999 | 12 (6.4%) | 15 (6.7%) |
| $100,000+ | 10 (5.3%) | 3 (1.3%) |
| Total | 188 (100.0%) | 225 (100.0%) |
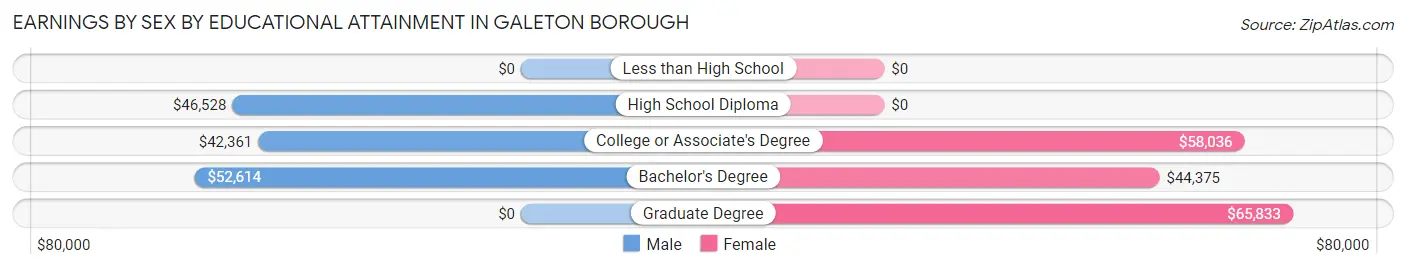
Earnings by Sex by Educational Attainment in Galeton borough
Average earnings in Galeton borough are $45,333 for men and $50,000 for women, a difference of 9.3%. Men with an educational attainment of bachelor's degree enjoy the highest average annual earnings of $52,614, while those with college or associate's degree education earn the least with $42,361. Women with an educational attainment of graduate degree earn the most with the average annual earnings of $65,833, while those with bachelor's degree education have the smallest earnings of $44,375.
| Educational Attainment | Male Income | Female Income |
| Less than High School | - | - |
| High School Diploma | $46,528 | $0 |
| College or Associate's Degree | $42,361 | $58,036 |
| Bachelor's Degree | $52,614 | $44,375 |
| Graduate Degree | - | - |
| Total | $45,333 | $50,000 |
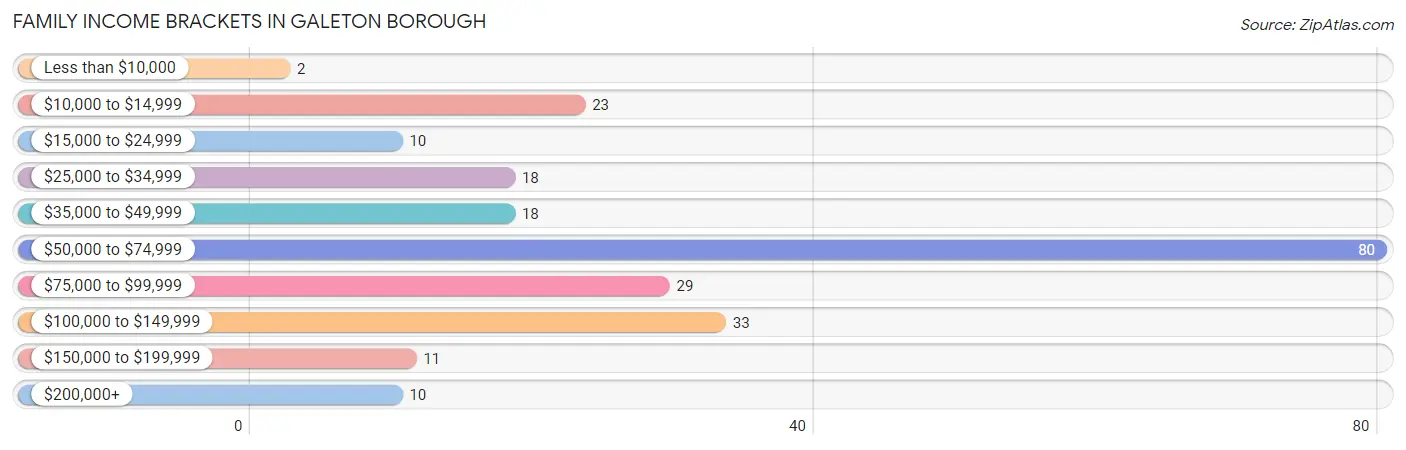
Family Income in Galeton borough
Family Income Brackets in Galeton borough
According to the Galeton borough family income data, there are 80 families falling into the $50,000 to $74,999 income range, which is the most common income bracket and makes up 34.2% of all families. Conversely, the less than $10,000 income bracket is the least frequent group with only 2 families (0.9%) belonging to this category.
| Income Bracket | # Families | % Families |
| Less than $10,000 | 2 | 0.9% |
| $10,000 to $14,999 | 23 | 9.8% |
| $15,000 to $24,999 | 10 | 4.3% |
| $25,000 to $34,999 | 18 | 7.7% |
| $35,000 to $49,999 | 18 | 7.7% |
| $50,000 to $74,999 | 80 | 34.2% |
| $75,000 to $99,999 | 29 | 12.4% |
| $100,000 to $149,999 | 33 | 14.1% |
| $150,000 to $199,999 | 11 | 4.7% |
| $200,000+ | 10 | 4.3% |
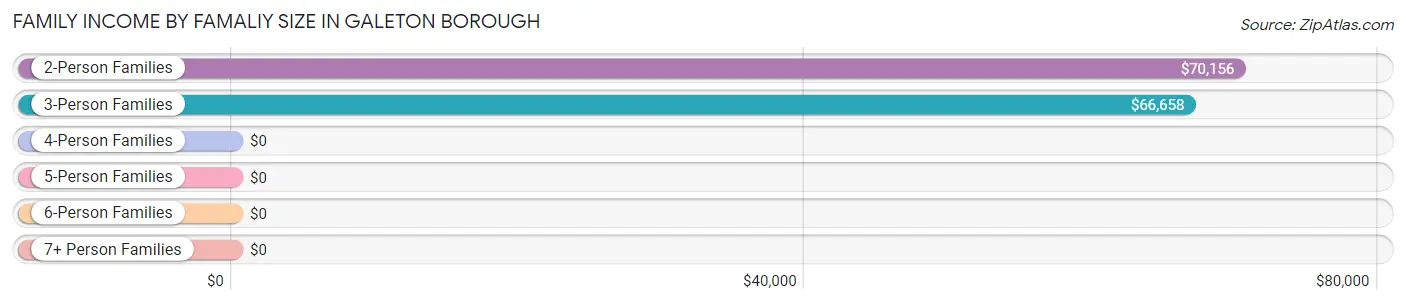
Family Income by Famaliy Size in Galeton borough
2-person families (135 | 57.7%) account for the highest median family income in Galeton borough with $70,156 per family, while 2-person families (135 | 57.7%) have the highest median income of $35,078 per family member.
| Income Bracket | # Families | Median Income |
| 2-Person Families | 135 (57.7%) | $70,156 |
| 3-Person Families | 85 (36.3%) | $66,658 |
| 4-Person Families | 8 (3.4%) | $0 |
| 5-Person Families | 6 (2.6%) | $0 |
| 6-Person Families | 0 (0.0%) | $0 |
| 7+ Person Families | 0 (0.0%) | $0 |
| Total | 234 (100.0%) | $66,633 |
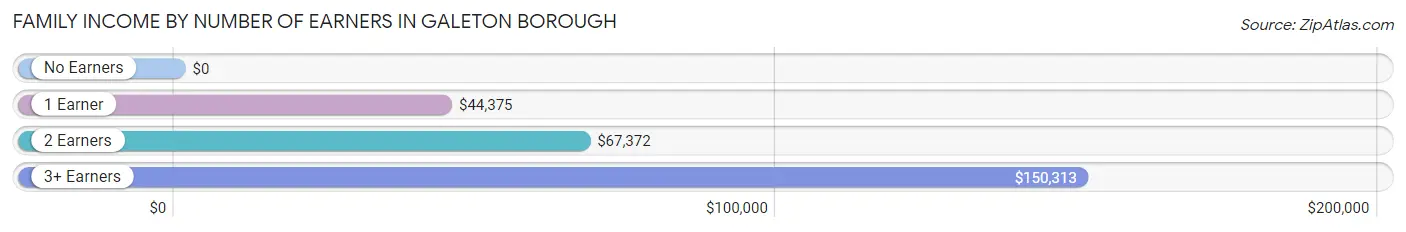
Family Income by Number of Earners in Galeton borough
| Number of Earners | # Families | Median Income |
| No Earners | 42 (17.9%) | $0 |
| 1 Earner | 54 (23.1%) | $44,375 |
| 2 Earners | 127 (54.3%) | $67,372 |
| 3+ Earners | 11 (4.7%) | $150,313 |
| Total | 234 (100.0%) | $66,633 |
Household Income in Galeton borough
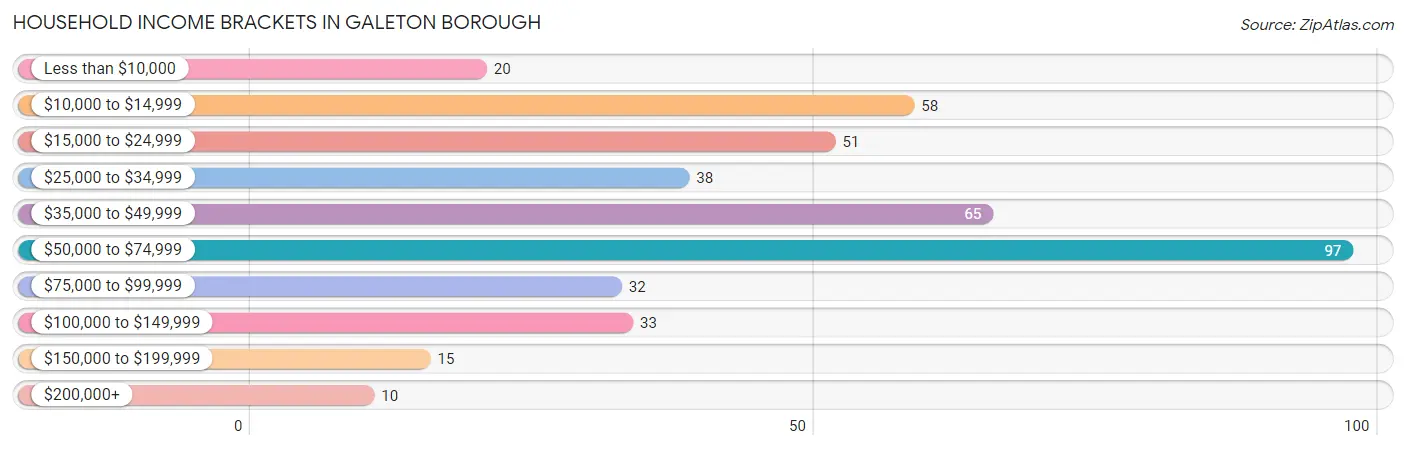
Household Income Brackets in Galeton borough
With 97 households falling in the category, the $50,000 to $74,999 income range is the most frequent in Galeton borough, accounting for 23.2% of all households. In contrast, only 10 households (2.4%) fall into the $200,000+ income bracket, making it the least populous group.
| Income Bracket | # Households | % Households |
| Less than $10,000 | 20 | 4.8% |
| $10,000 to $14,999 | 58 | 13.8% |
| $15,000 to $24,999 | 51 | 12.2% |
| $25,000 to $34,999 | 38 | 9.1% |
| $35,000 to $49,999 | 65 | 15.5% |
| $50,000 to $74,999 | 97 | 23.2% |
| $75,000 to $99,999 | 32 | 7.6% |
| $100,000 to $149,999 | 33 | 7.9% |
| $150,000 to $199,999 | 15 | 3.6% |
| $200,000+ | 10 | 2.4% |
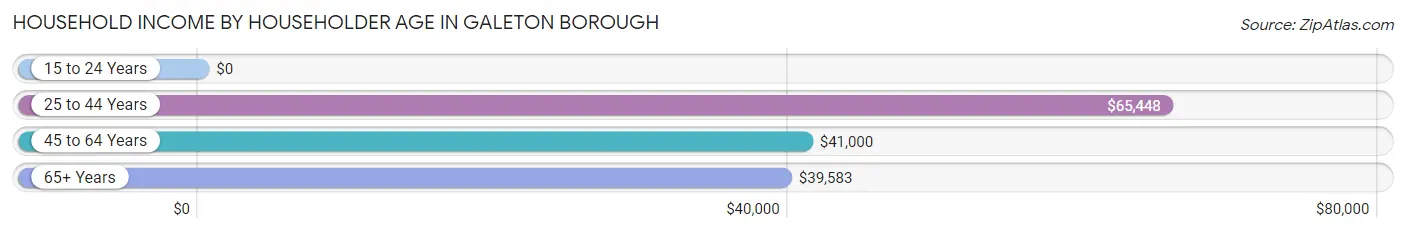
Household Income by Householder Age in Galeton borough
The median household income in Galeton borough is $47,554, with the highest median household income of $65,448 found in the 25 to 44 years age bracket for the primary householder. A total of 127 households (30.3%) fall into this category. Meanwhile, the 15 to 24 years age bracket for the primary householder has the lowest median household income of $0, with 11 households (2.6%) in this group.
| Income Bracket | # Households | Median Income |
| 15 to 24 Years | 11 (2.6%) | $0 |
| 25 to 44 Years | 127 (30.3%) | $65,448 |
| 45 to 64 Years | 154 (36.7%) | $41,000 |
| 65+ Years | 127 (30.3%) | $39,583 |
| Total | 419 (100.0%) | $47,554 |
Poverty in Galeton borough
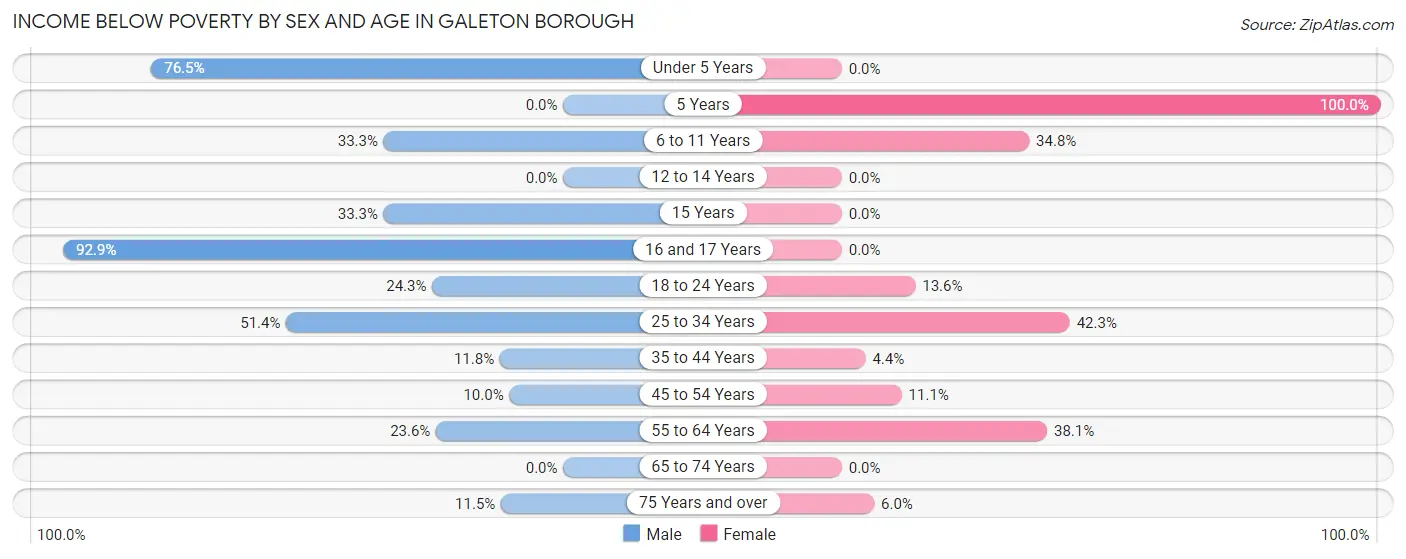
Income Below Poverty by Sex and Age in Galeton borough
With 27.6% poverty level for males and 16.2% for females among the residents of Galeton borough, 16 and 17 year old males and 5 year old females are the most vulnerable to poverty, with 26 males (92.9%) and 3 females (100.0%) in their respective age groups living below the poverty level.
| Age Bracket | Male | Female |
| Under 5 Years | 13 (76.5%) | 0 (0.0%) |
| 5 Years | 0 (0.0%) | 3 (100.0%) |
| 6 to 11 Years | 3 (33.3%) | 8 (34.8%) |
| 12 to 14 Years | 0 (0.0%) | 0 (0.0%) |
| 15 Years | 2 (33.3%) | 0 (0.0%) |
| 16 and 17 Years | 26 (92.9%) | 0 (0.0%) |
| 18 to 24 Years | 9 (24.3%) | 6 (13.6%) |
| 25 to 34 Years | 18 (51.4%) | 11 (42.3%) |
| 35 to 44 Years | 4 (11.8%) | 4 (4.4%) |
| 45 to 54 Years | 3 (10.0%) | 2 (11.1%) |
| 55 to 64 Years | 21 (23.6%) | 40 (38.1%) |
| 65 to 74 Years | 0 (0.0%) | 0 (0.0%) |
| 75 Years and over | 3 (11.5%) | 3 (6.0%) |
| Total | 102 (27.6%) | 77 (16.2%) |
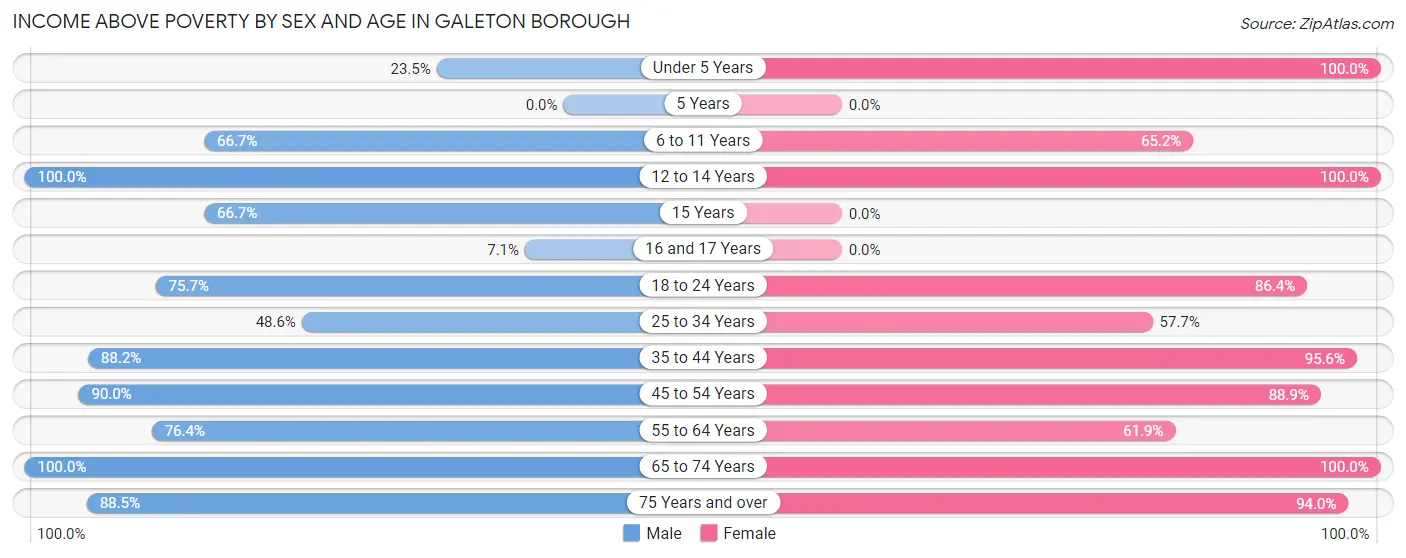
Income Above Poverty by Sex and Age in Galeton borough
According to the poverty statistics in Galeton borough, males aged 12 to 14 years and females aged under 5 years are the age groups that are most secure financially, with 100.0% of males and 100.0% of females in these age groups living above the poverty line.
| Age Bracket | Male | Female |
| Under 5 Years | 4 (23.5%) | 13 (100.0%) |
| 5 Years | 0 (0.0%) | 0 (0.0%) |
| 6 to 11 Years | 6 (66.7%) | 15 (65.2%) |
| 12 to 14 Years | 3 (100.0%) | 55 (100.0%) |
| 15 Years | 4 (66.7%) | 0 (0.0%) |
| 16 and 17 Years | 2 (7.1%) | 0 (0.0%) |
| 18 to 24 Years | 28 (75.7%) | 38 (86.4%) |
| 25 to 34 Years | 17 (48.6%) | 15 (57.7%) |
| 35 to 44 Years | 30 (88.2%) | 87 (95.6%) |
| 45 to 54 Years | 27 (90.0%) | 16 (88.9%) |
| 55 to 64 Years | 68 (76.4%) | 65 (61.9%) |
| 65 to 74 Years | 56 (100.0%) | 46 (100.0%) |
| 75 Years and over | 23 (88.5%) | 47 (94.0%) |
| Total | 268 (72.4%) | 397 (83.8%) |
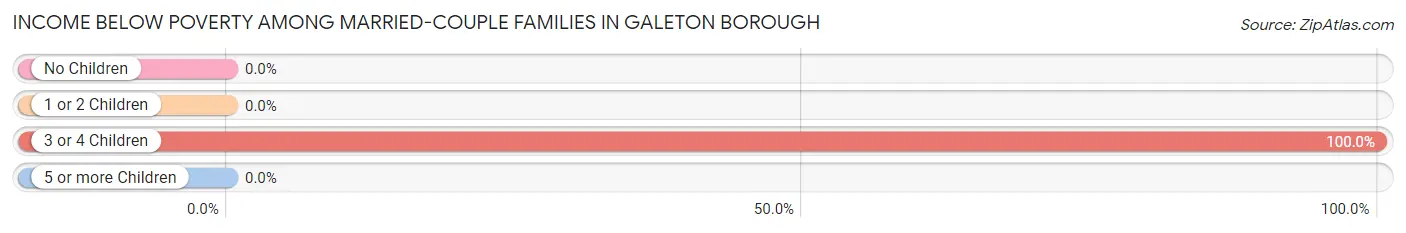
Income Below Poverty Among Married-Couple Families in Galeton borough
The poverty statistics for married-couple families in Galeton borough show that 3.3% or 4 of the total 122 families live below the poverty line. Families with 3 or 4 children have the highest poverty rate of 100.0%, comprising of 4 families. On the other hand, families with no children have the lowest poverty rate of 0.0%, which includes 0 families.
| Children | Above Poverty | Below Poverty |
| No Children | 97 (100.0%) | 0 (0.0%) |
| 1 or 2 Children | 21 (100.0%) | 0 (0.0%) |
| 3 or 4 Children | 0 (0.0%) | 4 (100.0%) |
| 5 or more Children | 0 (0.0%) | 0 (0.0%) |
| Total | 118 (96.7%) | 4 (3.3%) |
Income Below Poverty Among Single-Parent Households in Galeton borough
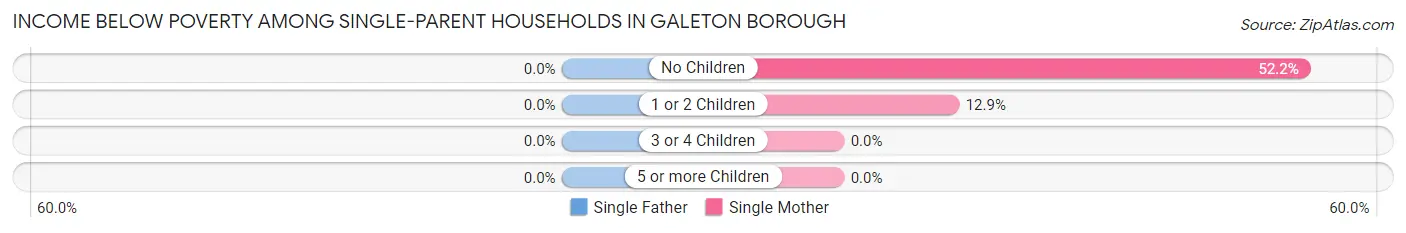
| Children | Single Father | Single Mother |
| No Children | 0 (0.0%) | 12 (52.2%) |
| 1 or 2 Children | 0 (0.0%) | 9 (12.9%) |
| 3 or 4 Children | 0 (0.0%) | 0 (0.0%) |
| 5 or more Children | 0 (0.0%) | 0 (0.0%) |
| Total | 0 (0.0%) | 21 (22.6%) |
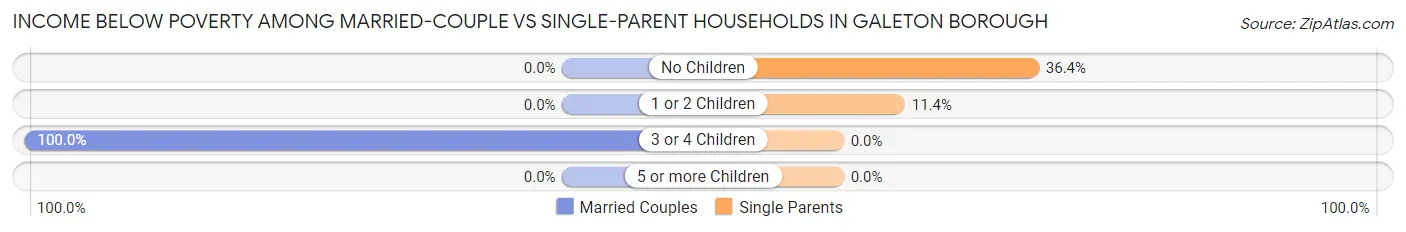
Income Below Poverty Among Married-Couple vs Single-Parent Households in Galeton borough
The poverty data for Galeton borough shows that 4 of the married-couple family households (3.3%) and 21 of the single-parent households (18.8%) are living below the poverty level. Within the married-couple family households, those with 3 or 4 children have the highest poverty rate, with 4 households (100.0%) falling below the poverty line. Among the single-parent households, those with no children have the highest poverty rate, with 12 household (36.4%) living below poverty.
| Children | Married-Couple Families | Single-Parent Households |
| No Children | 0 (0.0%) | 12 (36.4%) |
| 1 or 2 Children | 0 (0.0%) | 9 (11.4%) |
| 3 or 4 Children | 4 (100.0%) | 0 (0.0%) |
| 5 or more Children | 0 (0.0%) | 0 (0.0%) |
| Total | 4 (3.3%) | 21 (18.8%) |
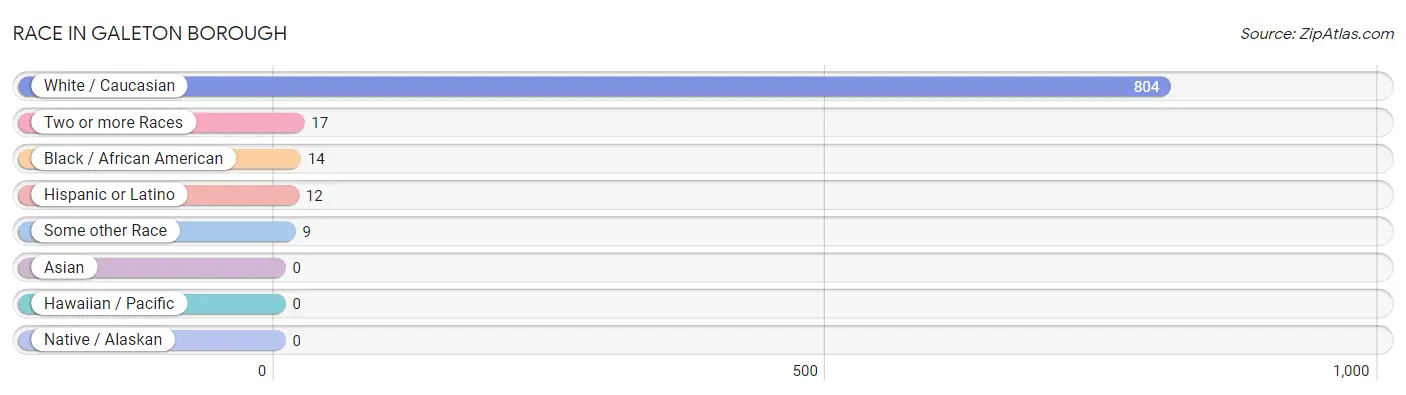
Race in Galeton borough
The most populous races in Galeton borough are White / Caucasian (804 | 95.3%), Two or more Races (17 | 2.0%), and Black / African American (14 | 1.7%).
| Race | # Population | % Population |
| Asian | 0 | 0.0% |
| Black / African American | 14 | 1.7% |
| Hawaiian / Pacific | 0 | 0.0% |
| Hispanic or Latino | 12 | 1.4% |
| Native / Alaskan | 0 | 0.0% |
| White / Caucasian | 804 | 95.3% |
| Two or more Races | 17 | 2.0% |
| Some other Race | 9 | 1.1% |
| Total | 844 | 100.0% |
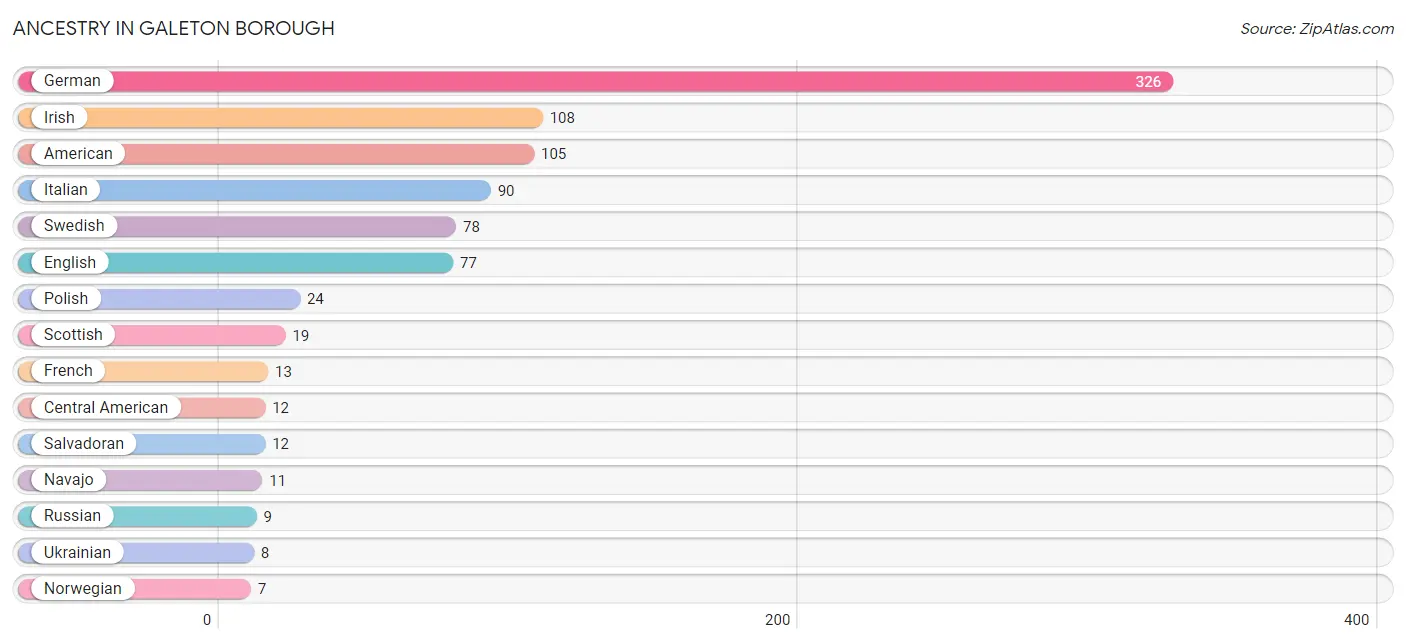
Ancestry in Galeton borough
The most populous ancestries reported in Galeton borough are German (326 | 38.6%), Irish (108 | 12.8%), American (105 | 12.4%), Italian (90 | 10.7%), and Swedish (78 | 9.2%), together accounting for 83.8% of all Galeton borough residents.
| Ancestry | # Population | % Population |
| American | 105 | 12.4% |
| British | 3 | 0.4% |
| Central American | 12 | 1.4% |
| English | 77 | 9.1% |
| French | 13 | 1.5% |
| German | 326 | 38.6% |
| Irish | 108 | 12.8% |
| Italian | 90 | 10.7% |
| Navajo | 11 | 1.3% |
| Northern European | 2 | 0.2% |
| Norwegian | 7 | 0.8% |
| Pennsylvania German | 3 | 0.4% |
| Polish | 24 | 2.8% |
| Russian | 9 | 1.1% |
| Salvadoran | 12 | 1.4% |
| Scandinavian | 2 | 0.2% |
| Scotch-Irish | 5 | 0.6% |
| Scottish | 19 | 2.2% |
| Swedish | 78 | 9.2% |
| Swiss | 2 | 0.2% |
| Ukrainian | 8 | 0.9% |
| Welsh | 6 | 0.7% | View All 22 Rows |
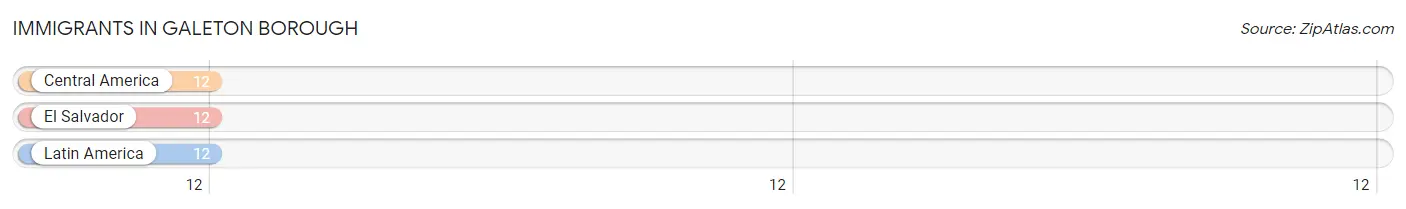
Immigrants in Galeton borough
The most numerous immigrant groups reported in Galeton borough came from Central America (12 | 1.4%), El Salvador (12 | 1.4%), and Latin America (12 | 1.4%), together accounting for 4.3% of all Galeton borough residents.
| Immigration Origin | # Population | % Population |
| Central America | 12 | 1.4% |
| El Salvador | 12 | 1.4% |
| Latin America | 12 | 1.4% | View All 3 Rows |
Sex and Age in Galeton borough
Sex and Age in Galeton borough
The most populous age groups in Galeton borough are 55 to 59 Years (55 | 14.9%) for men and 40 to 44 Years (70 | 14.8%) for women.
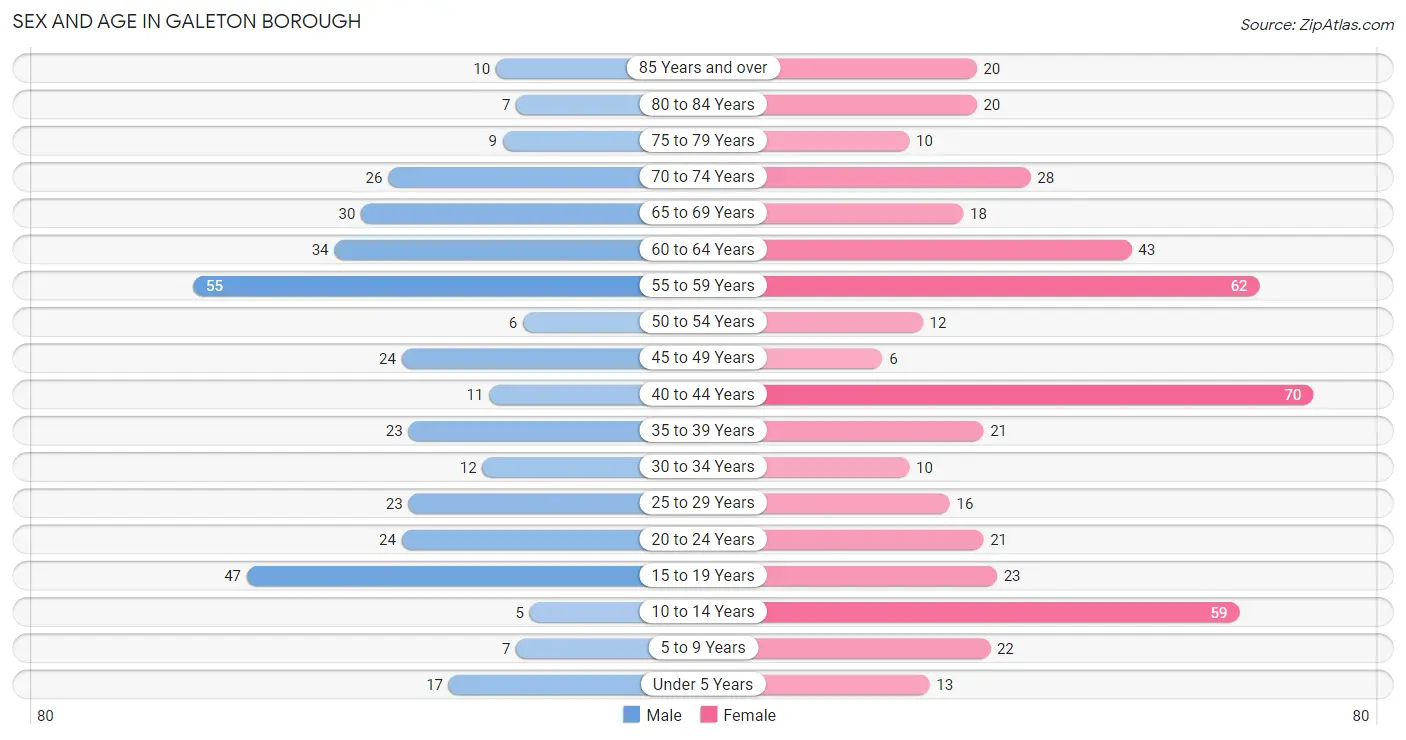
| Age Bracket | Male | Female |
| Under 5 Years | 17 (4.6%) | 13 (2.7%) |
| 5 to 9 Years | 7 (1.9%) | 22 (4.6%) |
| 10 to 14 Years | 5 (1.3%) | 59 (12.4%) |
| 15 to 19 Years | 47 (12.7%) | 23 (4.9%) |
| 20 to 24 Years | 24 (6.5%) | 21 (4.4%) |
| 25 to 29 Years | 23 (6.2%) | 16 (3.4%) |
| 30 to 34 Years | 12 (3.2%) | 10 (2.1%) |
| 35 to 39 Years | 23 (6.2%) | 21 (4.4%) |
| 40 to 44 Years | 11 (3.0%) | 70 (14.8%) |
| 45 to 49 Years | 24 (6.5%) | 6 (1.3%) |
| 50 to 54 Years | 6 (1.6%) | 12 (2.5%) |
| 55 to 59 Years | 55 (14.9%) | 62 (13.1%) |
| 60 to 64 Years | 34 (9.2%) | 43 (9.1%) |
| 65 to 69 Years | 30 (8.1%) | 18 (3.8%) |
| 70 to 74 Years | 26 (7.0%) | 28 (5.9%) |
| 75 to 79 Years | 9 (2.4%) | 10 (2.1%) |
| 80 to 84 Years | 7 (1.9%) | 20 (4.2%) |
| 85 Years and over | 10 (2.7%) | 20 (4.2%) |
| Total | 370 (100.0%) | 474 (100.0%) |
Families and Households in Galeton borough
Median Family Size in Galeton borough
The median family size in Galeton borough is 2.53 persons per family, with single male/father families (19 | 8.1%) accounting for the largest median family size of 2.95 persons per family. On the other hand, married-couple families (122 | 52.1%) represent the smallest median family size with 2.46 persons per family.
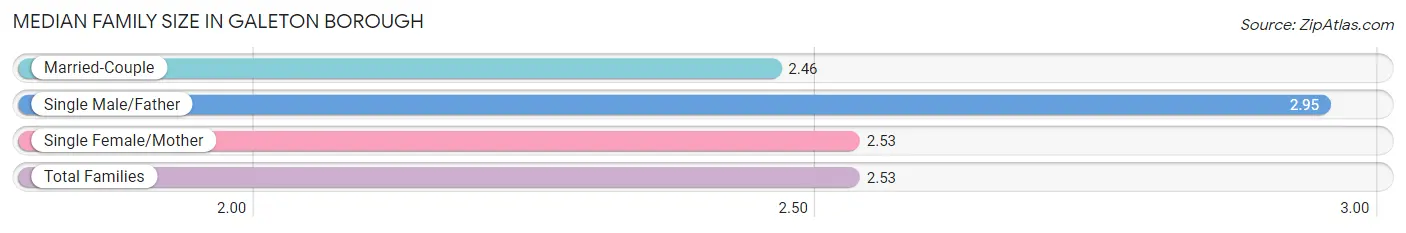
| Family Type | # Families | Family Size |
| Married-Couple | 122 (52.1%) | 2.46 |
| Single Male/Father | 19 (8.1%) | 2.95 |
| Single Female/Mother | 93 (39.7%) | 2.53 |
| Total Families | 234 (100.0%) | 2.53 |
Median Household Size in Galeton borough
The median household size in Galeton borough is 2.01 persons per household, with single male/father households (19 | 4.5%) accounting for the largest median household size of 3.53 persons per household. non-family households (185 | 44.2%) represent the smallest median household size with 1.14 persons per household.
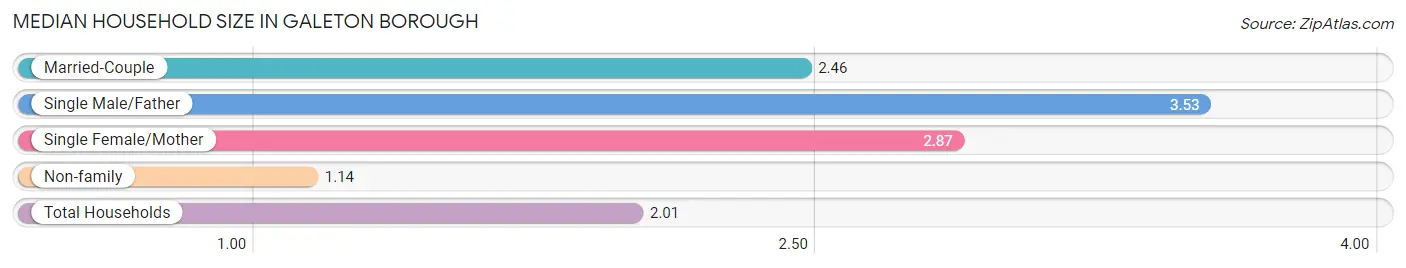
| Household Type | # Households | Household Size |
| Married-Couple | 122 (29.1%) | 2.46 |
| Single Male/Father | 19 (4.5%) | 3.53 |
| Single Female/Mother | 93 (22.2%) | 2.87 |
| Non-family | 185 (44.2%) | 1.14 |
| Total Households | 419 (100.0%) | 2.01 |
Household Size by Marriage Status in Galeton borough
Out of a total of 419 households in Galeton borough, 234 (55.8%) are family households, while 185 (44.2%) are nonfamily households. The most numerous type of family households are 2-person households, comprising 123, and the most common type of nonfamily households are 1-person households, comprising 165.
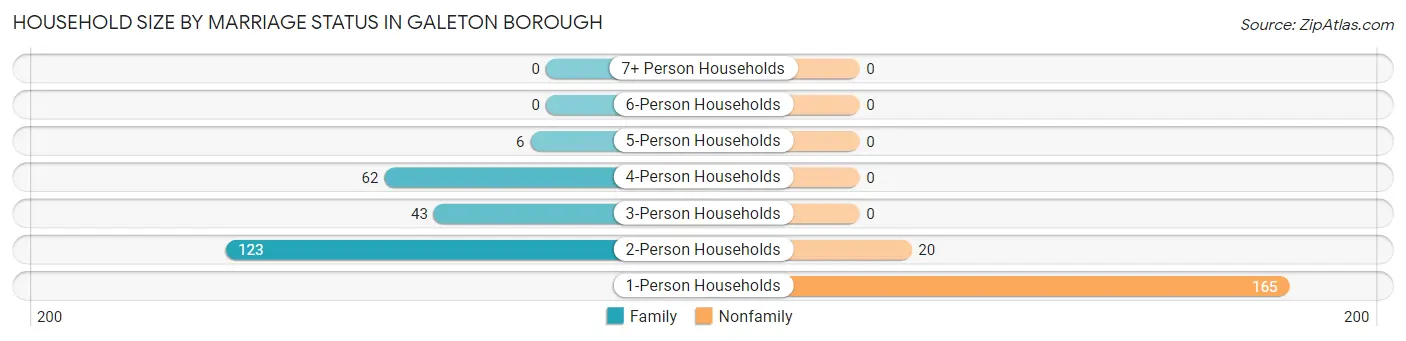
| Household Size | Family Households | Nonfamily Households |
| 1-Person Households | - | 165 (39.4%) |
| 2-Person Households | 123 (29.4%) | 20 (4.8%) |
| 3-Person Households | 43 (10.3%) | 0 (0.0%) |
| 4-Person Households | 62 (14.8%) | 0 (0.0%) |
| 5-Person Households | 6 (1.4%) | 0 (0.0%) |
| 6-Person Households | 0 (0.0%) | 0 (0.0%) |
| 7+ Person Households | 0 (0.0%) | 0 (0.0%) |
| Total | 234 (55.8%) | 185 (44.2%) |
Female Fertility in Galeton borough
Fertility by Age in Galeton borough
Average fertility rate in Galeton borough is 24.0 births per 1,000 women. Women in the age bracket of 35 to 50 years have the highest fertility rate with 41.0 births per 1,000 women. Women in the age bracket of 35 to 50 years acount for 100.0% of all women with births.
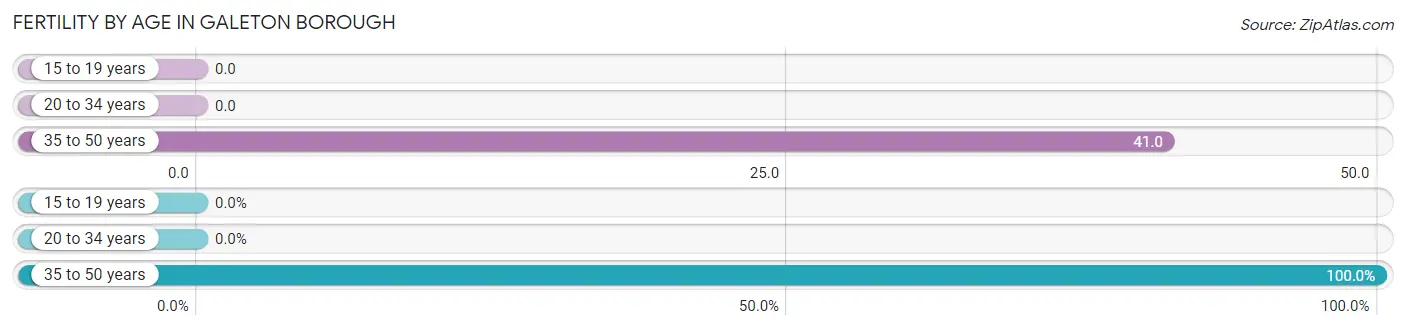
| Age Bracket | Women with Births | Births / 1,000 Women |
| 15 to 19 years | 0 (0.0%) | 0.0 |
| 20 to 34 years | 0 (0.0%) | 0.0 |
| 35 to 50 years | 4 (100.0%) | 41.0 |
| Total | 4 (100.0%) | 24.0 |
Fertility by Age by Marriage Status in Galeton borough
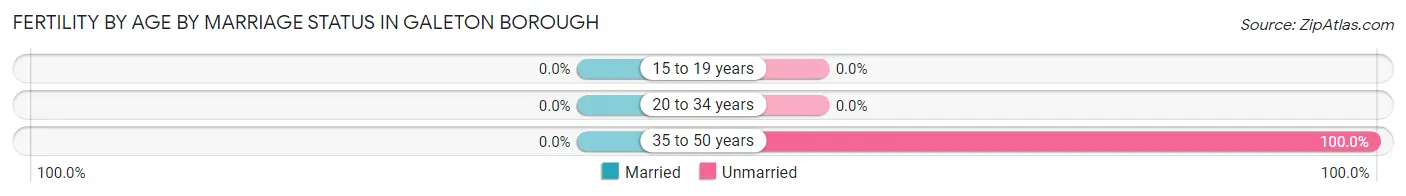
| Age Bracket | Married | Unmarried |
| 15 to 19 years | 0 (0.0%) | 0 (0.0%) |
| 20 to 34 years | 0 (0.0%) | 0 (0.0%) |
| 35 to 50 years | 0 (0.0%) | 4 (100.0%) |
| Total | 0 (0.0%) | 4 (100.0%) |
Fertility by Education in Galeton borough
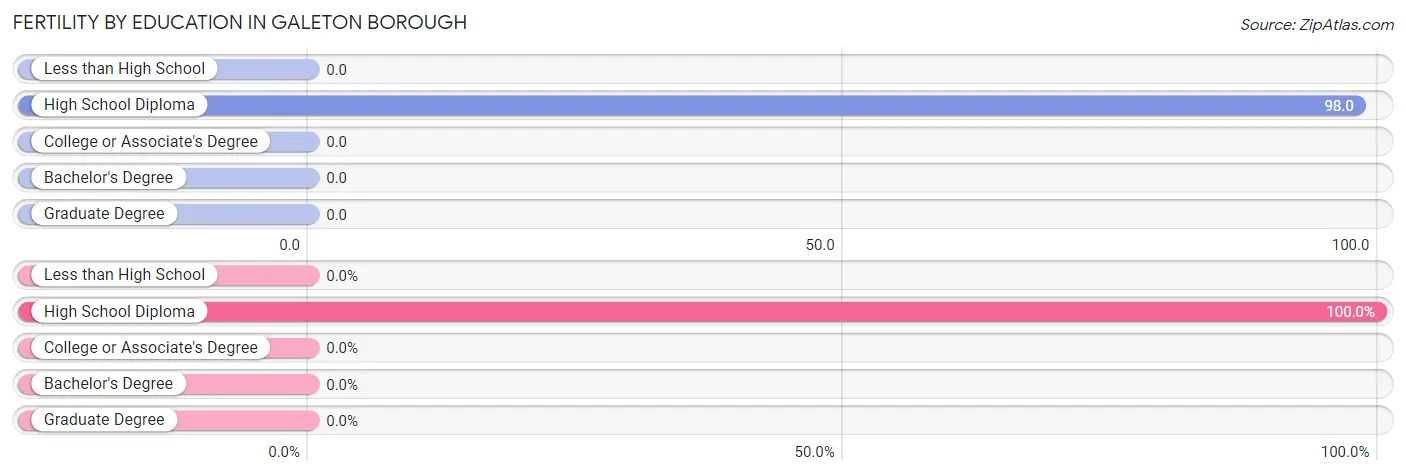
| Educational Attainment | Women with Births | Births / 1,000 Women |
| Less than High School | 0 (0.0%) | 0.0 |
| High School Diploma | 4 (100.0%) | 98.0 |
| College or Associate's Degree | 0 (0.0%) | 0.0 |
| Bachelor's Degree | 0 (0.0%) | 0.0 |
| Graduate Degree | 0 (0.0%) | 0.0 |
| Total | 4 (100.0%) | 24.0 |
Fertility by Education by Marriage Status in Galeton borough
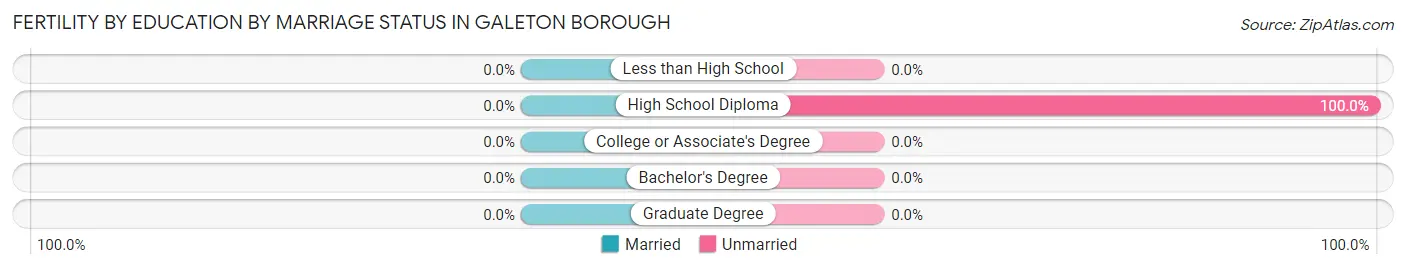
| Educational Attainment | Married | Unmarried |
| Less than High School | 0 (0.0%) | 0 (0.0%) |
| High School Diploma | 0 (0.0%) | 4 (100.0%) |
| College or Associate's Degree | 0 (0.0%) | 0 (0.0%) |
| Bachelor's Degree | 0 (0.0%) | 0 (0.0%) |
| Graduate Degree | 0 (0.0%) | 0 (0.0%) |
| Total | 0 (0.0%) | 4 (100.0%) |
Employment Characteristics in Galeton borough
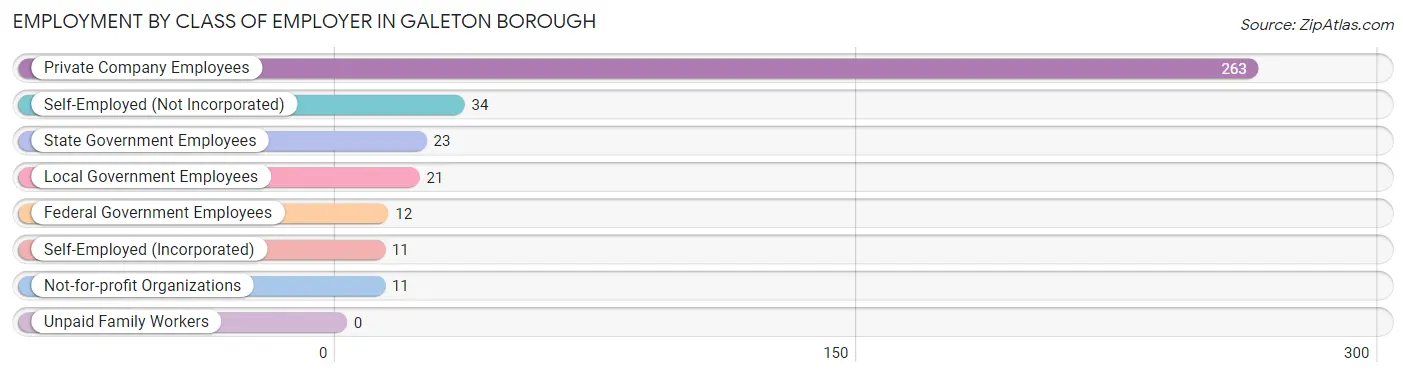
Employment by Class of Employer in Galeton borough
Among the 375 employed individuals in Galeton borough, private company employees (263 | 70.1%), self-employed (not incorporated) (34 | 9.1%), and state government employees (23 | 6.1%) make up the most common classes of employment.
| Employer Class | # Employees | % Employees |
| Private Company Employees | 263 | 70.1% |
| Self-Employed (Incorporated) | 11 | 2.9% |
| Self-Employed (Not Incorporated) | 34 | 9.1% |
| Not-for-profit Organizations | 11 | 2.9% |
| Local Government Employees | 21 | 5.6% |
| State Government Employees | 23 | 6.1% |
| Federal Government Employees | 12 | 3.2% |
| Unpaid Family Workers | 0 | 0.0% |
| Total | 375 | 100.0% |
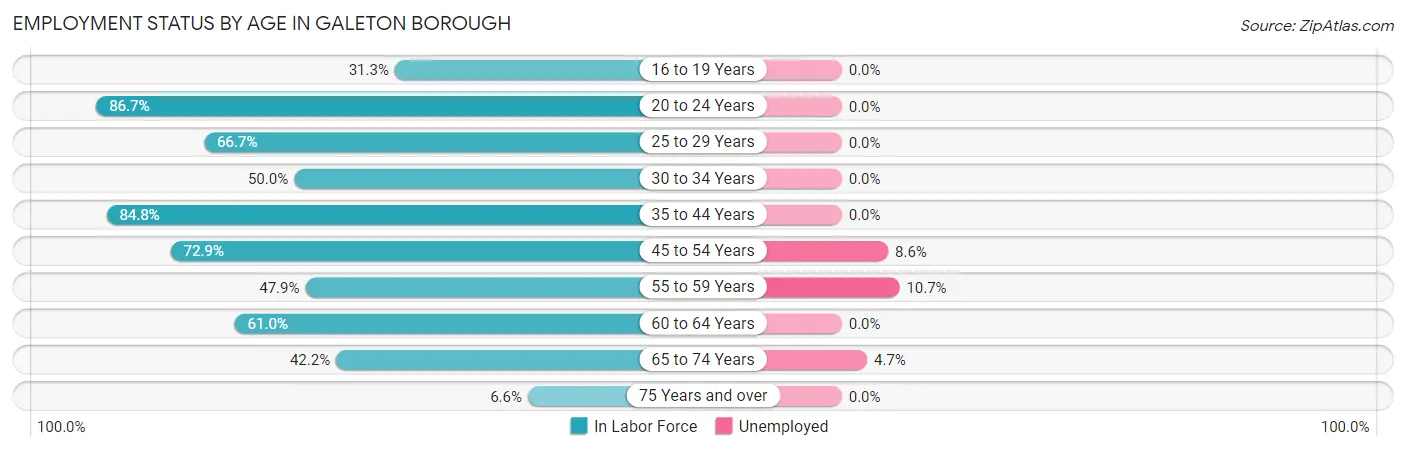
Employment Status by Age in Galeton borough
According to the labor force statistics for Galeton borough, out of the total population over 16 years of age (715), 54.3% or 388 individuals are in the labor force, with 2.8% or 11 of them unemployed. The age group with the highest labor force participation rate is 20 to 24 years, with 86.7% or 39 individuals in the labor force. Within the labor force, the 55 to 59 years age range has the highest percentage of unemployed individuals, with 10.7% or 6 of them being unemployed.
| Age Bracket | In Labor Force | Unemployed |
| 16 to 19 Years | 20 (31.3%) | 0 (0.0%) |
| 20 to 24 Years | 39 (86.7%) | 0 (0.0%) |
| 25 to 29 Years | 26 (66.7%) | 0 (0.0%) |
| 30 to 34 Years | 11 (50.0%) | 0 (0.0%) |
| 35 to 44 Years | 106 (84.8%) | 0 (0.0%) |
| 45 to 54 Years | 35 (72.9%) | 3 (8.6%) |
| 55 to 59 Years | 56 (47.9%) | 6 (10.7%) |
| 60 to 64 Years | 47 (61.0%) | 0 (0.0%) |
| 65 to 74 Years | 43 (42.2%) | 2 (4.7%) |
| 75 Years and over | 5 (6.6%) | 0 (0.0%) |
| Total | 388 (54.3%) | 11 (2.8%) |
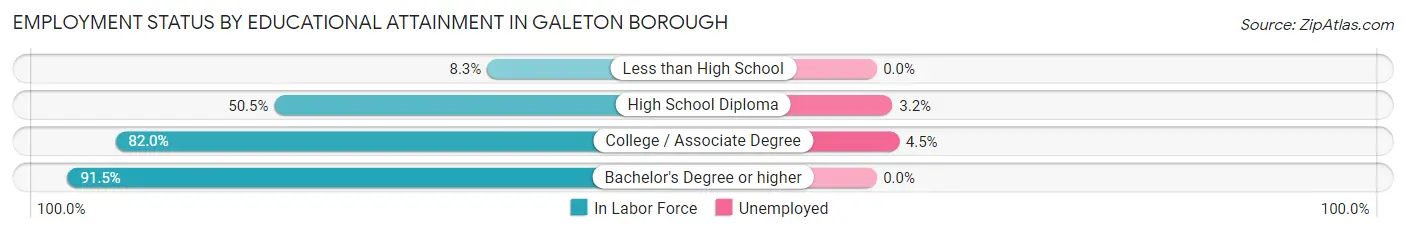
Employment Status by Educational Attainment in Galeton borough
According to labor force statistics for Galeton borough, 65.7% of individuals (281) out of the total population between 25 and 64 years of age (428) are in the labor force, with 3.2% or 9 of them being unemployed. The group with the highest labor force participation rate are those with the educational attainment of bachelor's degree or higher, with 91.5% or 54 individuals in the labor force. Within the labor force, individuals with college / associate degree education have the highest percentage of unemployment, with 4.5% or 6 of them being unemployed.
| Educational Attainment | In Labor Force | Unemployed |
| Less than High School | 2 (8.3%) | 0 (0.0%) |
| High School Diploma | 93 (50.5%) | 6 (3.2%) |
| College / Associate Degree | 132 (82.0%) | 7 (4.5%) |
| Bachelor's Degree or higher | 54 (91.5%) | 0 (0.0%) |
| Total | 281 (65.7%) | 14 (3.2%) |
Employment Occupations by Sex in Galeton borough
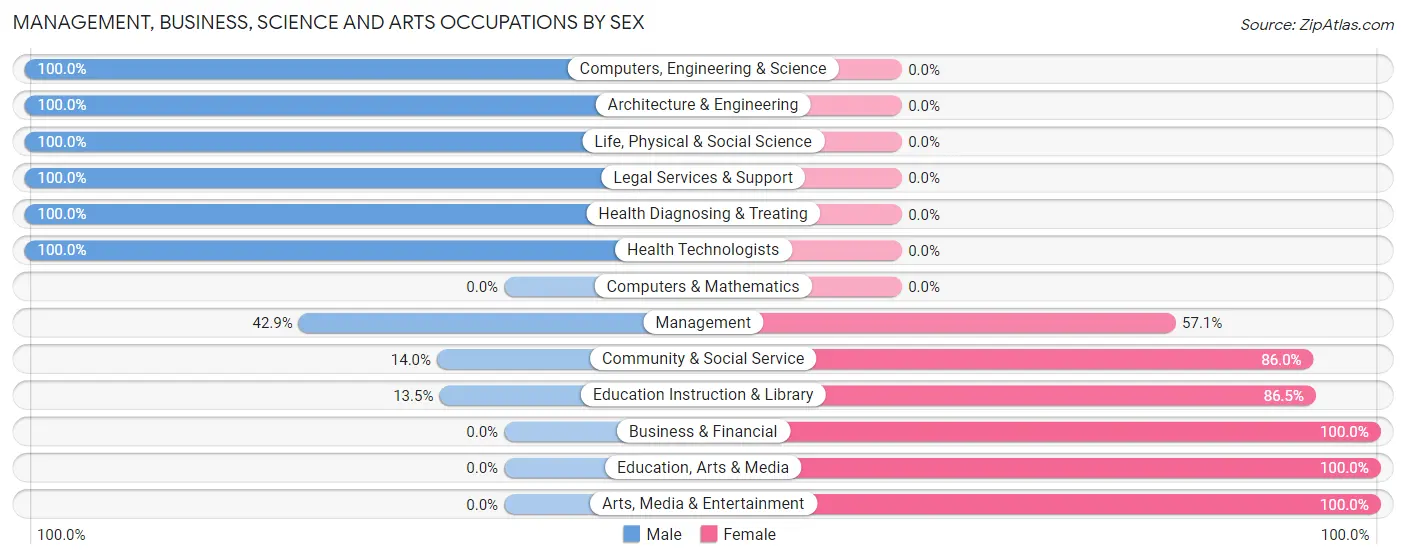
Management, Business, Science and Arts Occupations
The most common Management, Business, Science and Arts occupations in Galeton borough are Community & Social Service (50 | 13.3%), Education Instruction & Library (37 | 9.8%), Management (28 | 7.4%), Education, Arts & Media (8 | 2.1%), and Computers, Engineering & Science (4 | 1.1%).
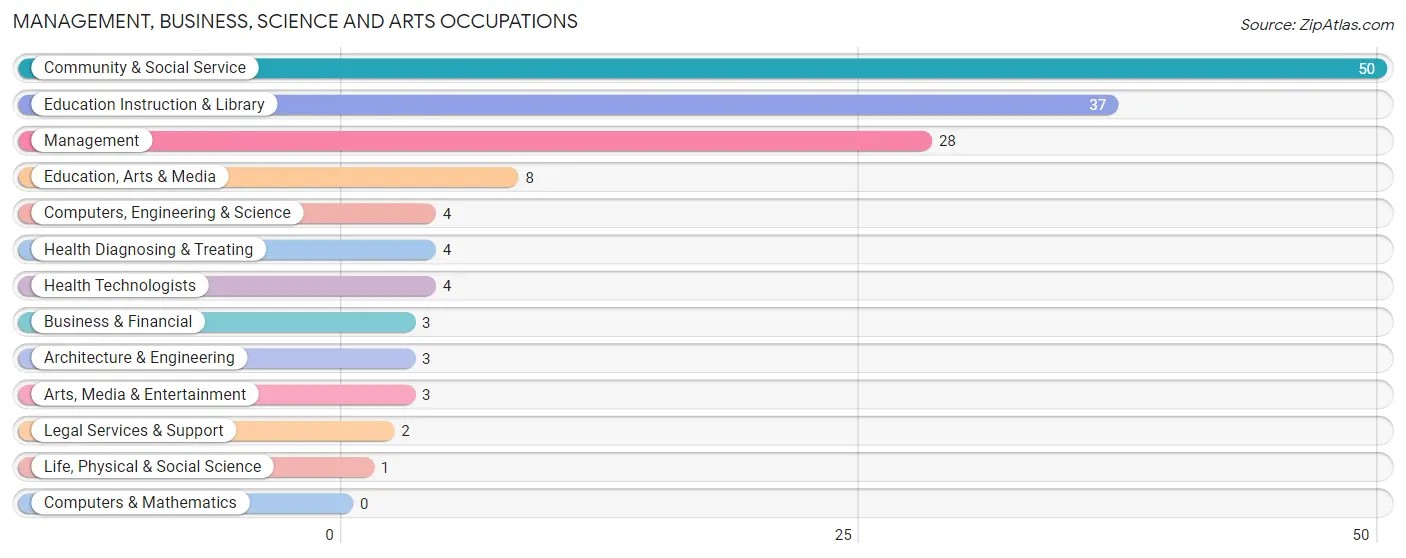
Management, Business, Science and Arts Occupations by Sex
Within the Management, Business, Science and Arts occupations in Galeton borough, the most male-oriented occupations are Computers, Engineering & Science (100.0%), Architecture & Engineering (100.0%), and Life, Physical & Social Science (100.0%), while the most female-oriented occupations are Business & Financial (100.0%), Education, Arts & Media (100.0%), and Arts, Media & Entertainment (100.0%).
| Occupation | Male | Female |
| Management | 12 (42.9%) | 16 (57.1%) |
| Business & Financial | 0 (0.0%) | 3 (100.0%) |
| Computers, Engineering & Science | 4 (100.0%) | 0 (0.0%) |
| Computers & Mathematics | 0 (0.0%) | 0 (0.0%) |
| Architecture & Engineering | 3 (100.0%) | 0 (0.0%) |
| Life, Physical & Social Science | 1 (100.0%) | 0 (0.0%) |
| Community & Social Service | 7 (14.0%) | 43 (86.0%) |
| Education, Arts & Media | 0 (0.0%) | 8 (100.0%) |
| Legal Services & Support | 2 (100.0%) | 0 (0.0%) |
| Education Instruction & Library | 5 (13.5%) | 32 (86.5%) |
| Arts, Media & Entertainment | 0 (0.0%) | 3 (100.0%) |
| Health Diagnosing & Treating | 4 (100.0%) | 0 (0.0%) |
| Health Technologists | 4 (100.0%) | 0 (0.0%) |
| Total (Category) | 27 (30.3%) | 62 (69.7%) |
| Total (Overall) | 172 (45.6%) | 205 (54.4%) |
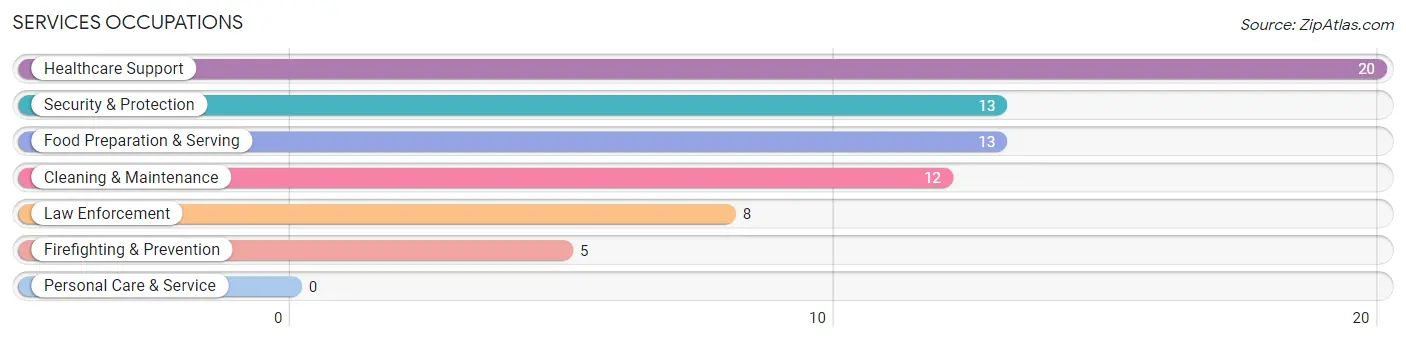
Services Occupations
The most common Services occupations in Galeton borough are Healthcare Support (20 | 5.3%), Security & Protection (13 | 3.5%), Food Preparation & Serving (13 | 3.5%), Cleaning & Maintenance (12 | 3.2%), and Law Enforcement (8 | 2.1%).
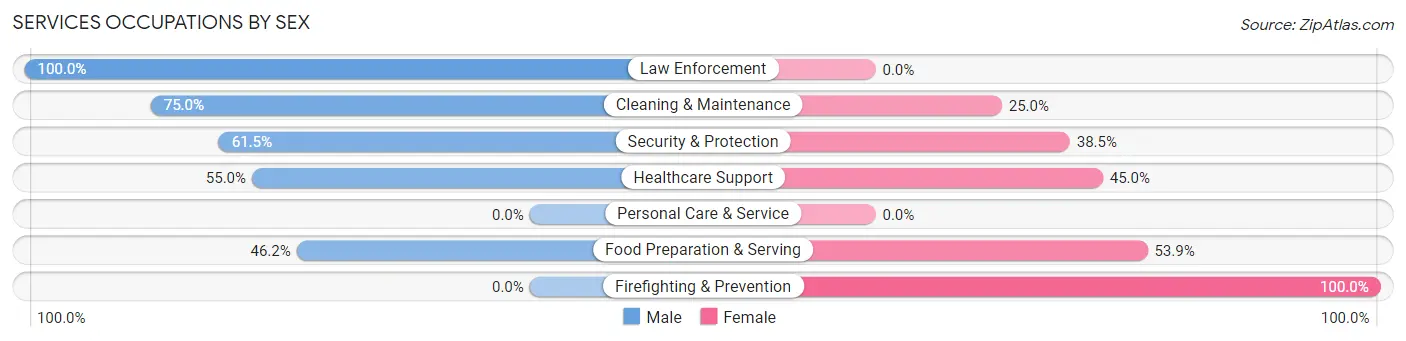
Services Occupations by Sex
Within the Services occupations in Galeton borough, the most male-oriented occupations are Law Enforcement (100.0%), Cleaning & Maintenance (75.0%), and Security & Protection (61.5%), while the most female-oriented occupations are Firefighting & Prevention (100.0%), Food Preparation & Serving (53.8%), and Healthcare Support (45.0%).
| Occupation | Male | Female |
| Healthcare Support | 11 (55.0%) | 9 (45.0%) |
| Security & Protection | 8 (61.5%) | 5 (38.5%) |
| Firefighting & Prevention | 0 (0.0%) | 5 (100.0%) |
| Law Enforcement | 8 (100.0%) | 0 (0.0%) |
| Food Preparation & Serving | 6 (46.2%) | 7 (53.8%) |
| Cleaning & Maintenance | 9 (75.0%) | 3 (25.0%) |
| Personal Care & Service | 0 (0.0%) | 0 (0.0%) |
| Total (Category) | 34 (58.6%) | 24 (41.4%) |
| Total (Overall) | 172 (45.6%) | 205 (54.4%) |
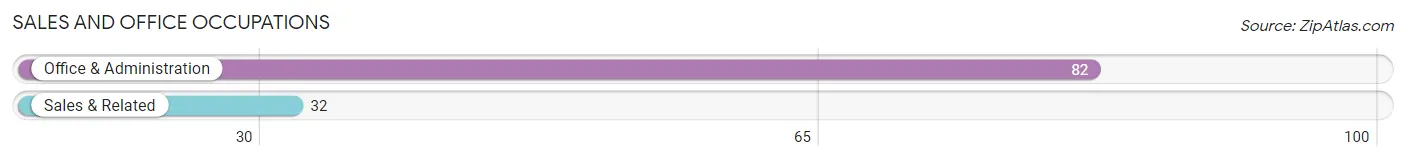
Sales and Office Occupations
The most common Sales and Office occupations in Galeton borough are Office & Administration (82 | 21.7%), and Sales & Related (32 | 8.5%).
Sales and Office Occupations by Sex
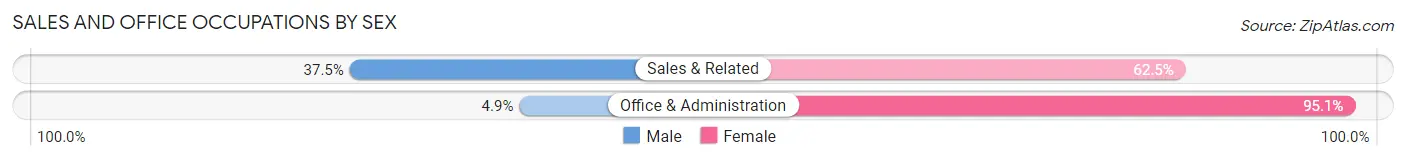
| Occupation | Male | Female |
| Sales & Related | 12 (37.5%) | 20 (62.5%) |
| Office & Administration | 4 (4.9%) | 78 (95.1%) |
| Total (Category) | 16 (14.0%) | 98 (86.0%) |
| Total (Overall) | 172 (45.6%) | 205 (54.4%) |
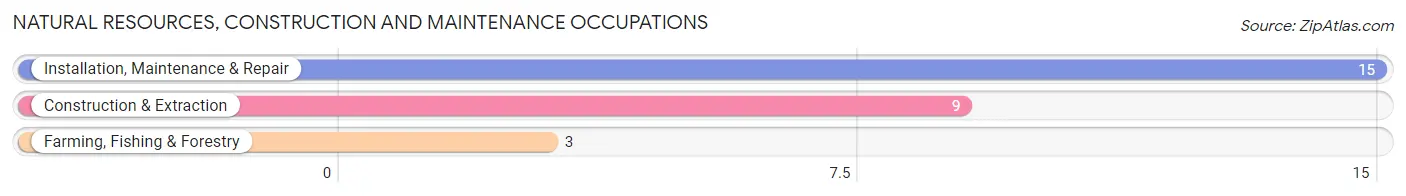
Natural Resources, Construction and Maintenance Occupations
The most common Natural Resources, Construction and Maintenance occupations in Galeton borough are Installation, Maintenance & Repair (15 | 4.0%), Construction & Extraction (9 | 2.4%), and Farming, Fishing & Forestry (3 | 0.8%).
Natural Resources, Construction and Maintenance Occupations by Sex
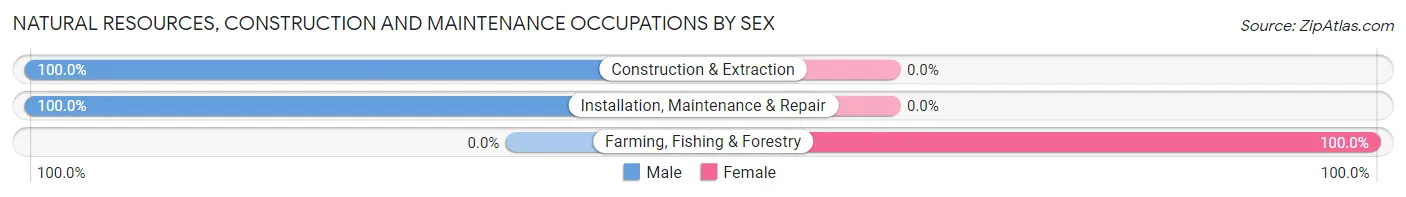
| Occupation | Male | Female |
| Farming, Fishing & Forestry | 0 (0.0%) | 3 (100.0%) |
| Construction & Extraction | 9 (100.0%) | 0 (0.0%) |
| Installation, Maintenance & Repair | 15 (100.0%) | 0 (0.0%) |
| Total (Category) | 24 (88.9%) | 3 (11.1%) |
| Total (Overall) | 172 (45.6%) | 205 (54.4%) |
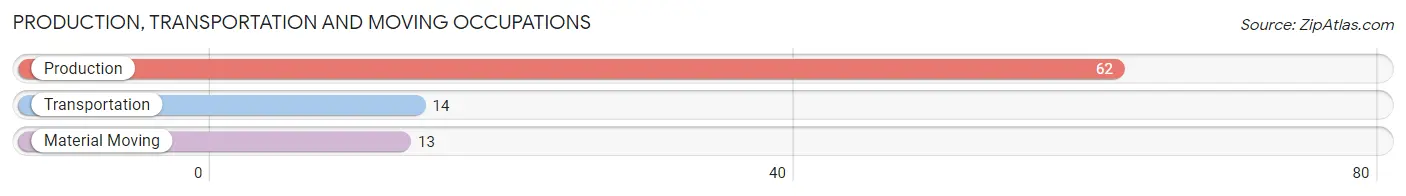
Production, Transportation and Moving Occupations
The most common Production, Transportation and Moving occupations in Galeton borough are Production (62 | 16.5%), Transportation (14 | 3.7%), and Material Moving (13 | 3.5%).
Production, Transportation and Moving Occupations by Sex
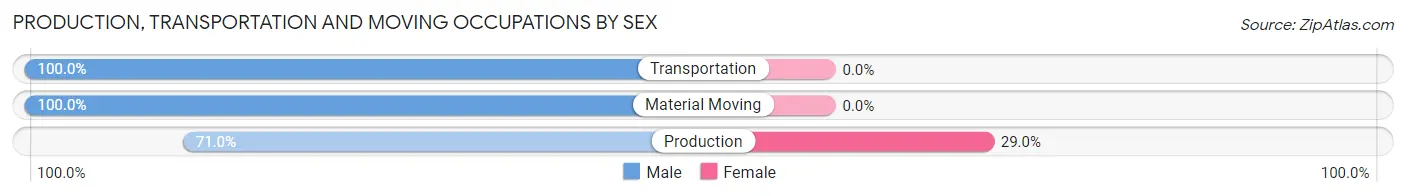
| Occupation | Male | Female |
| Production | 44 (71.0%) | 18 (29.0%) |
| Transportation | 14 (100.0%) | 0 (0.0%) |
| Material Moving | 13 (100.0%) | 0 (0.0%) |
| Total (Category) | 71 (79.8%) | 18 (20.2%) |
| Total (Overall) | 172 (45.6%) | 205 (54.4%) |
Employment Industries by Sex in Galeton borough
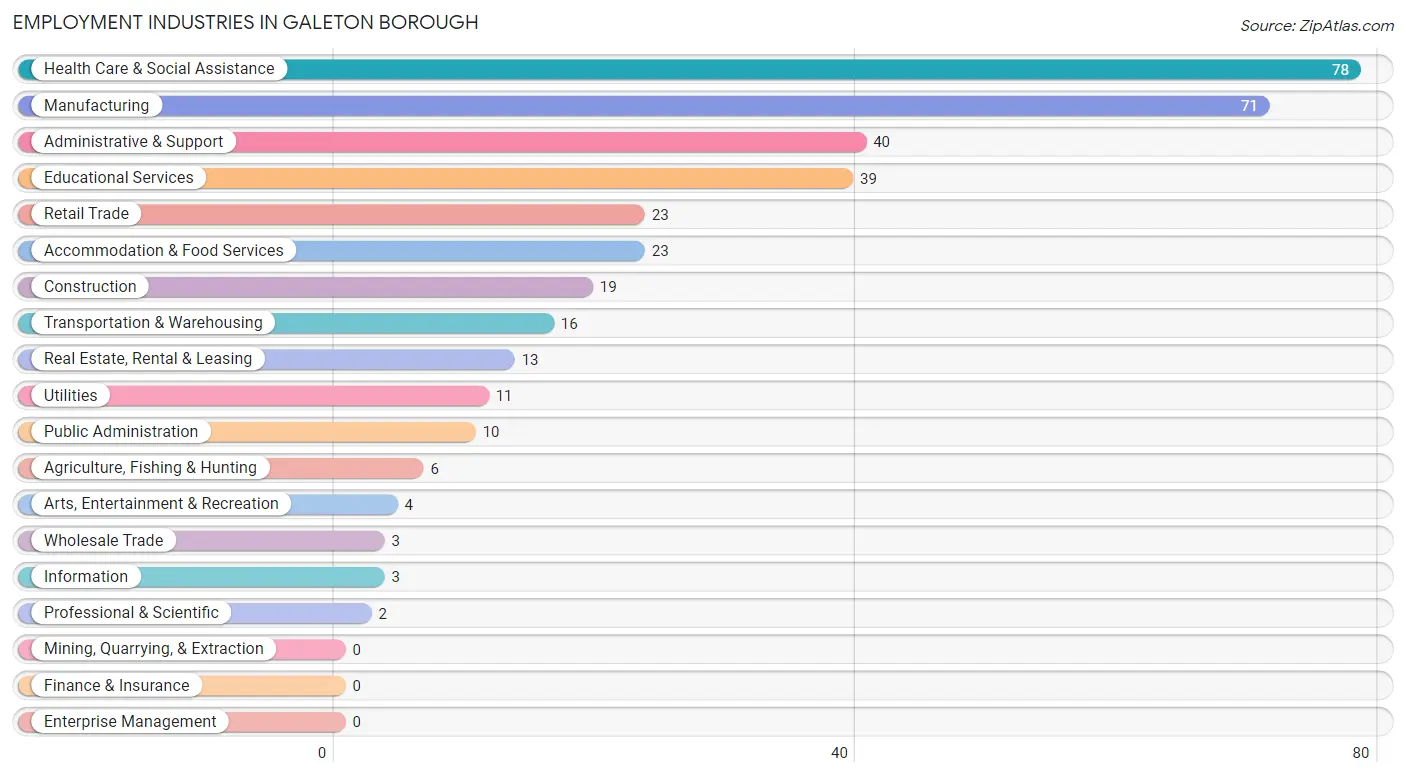
Employment Industries in Galeton borough
The major employment industries in Galeton borough include Health Care & Social Assistance (78 | 20.7%), Manufacturing (71 | 18.8%), Administrative & Support (40 | 10.6%), Educational Services (39 | 10.3%), and Retail Trade (23 | 6.1%).
Employment Industries by Sex in Galeton borough
The Galeton borough industries that see more men than women are Construction (100.0%), Real Estate, Rental & Leasing (100.0%), and Professional & Scientific (100.0%), whereas the industries that tend to have a higher number of women are Wholesale Trade (100.0%), Information (100.0%), and Educational Services (100.0%).
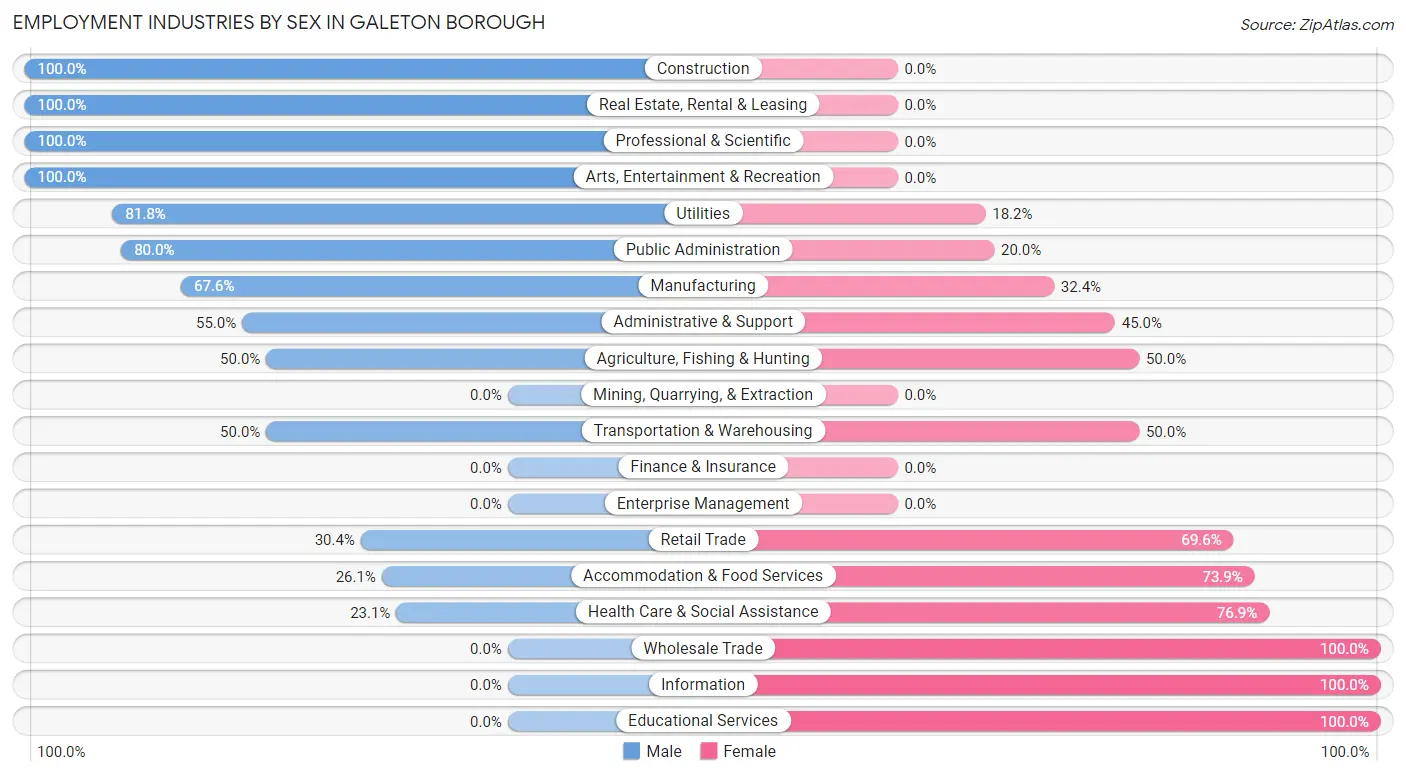
| Industry | Male | Female |
| Agriculture, Fishing & Hunting | 3 (50.0%) | 3 (50.0%) |
| Mining, Quarrying, & Extraction | 0 (0.0%) | 0 (0.0%) |
| Construction | 19 (100.0%) | 0 (0.0%) |
| Manufacturing | 48 (67.6%) | 23 (32.4%) |
| Wholesale Trade | 0 (0.0%) | 3 (100.0%) |
| Retail Trade | 7 (30.4%) | 16 (69.6%) |
| Transportation & Warehousing | 8 (50.0%) | 8 (50.0%) |
| Utilities | 9 (81.8%) | 2 (18.2%) |
| Information | 0 (0.0%) | 3 (100.0%) |
| Finance & Insurance | 0 (0.0%) | 0 (0.0%) |
| Real Estate, Rental & Leasing | 13 (100.0%) | 0 (0.0%) |
| Professional & Scientific | 2 (100.0%) | 0 (0.0%) |
| Enterprise Management | 0 (0.0%) | 0 (0.0%) |
| Administrative & Support | 22 (55.0%) | 18 (45.0%) |
| Educational Services | 0 (0.0%) | 39 (100.0%) |
| Health Care & Social Assistance | 18 (23.1%) | 60 (76.9%) |
| Arts, Entertainment & Recreation | 4 (100.0%) | 0 (0.0%) |
| Accommodation & Food Services | 6 (26.1%) | 17 (73.9%) |
| Public Administration | 8 (80.0%) | 2 (20.0%) |
| Total | 172 (45.6%) | 205 (54.4%) |
Education in Galeton borough
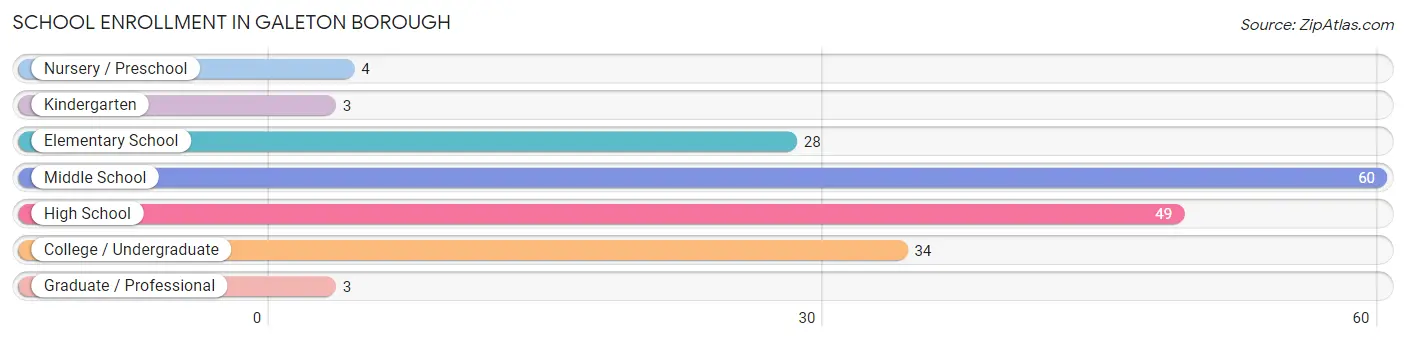
School Enrollment in Galeton borough
The most common levels of schooling among the 181 students in Galeton borough are middle school (60 | 33.2%), high school (49 | 27.1%), and college / undergraduate (34 | 18.8%).
| School Level | # Students | % Students |
| Nursery / Preschool | 4 | 2.2% |
| Kindergarten | 3 | 1.7% |
| Elementary School | 28 | 15.5% |
| Middle School | 60 | 33.2% |
| High School | 49 | 27.1% |
| College / Undergraduate | 34 | 18.8% |
| Graduate / Professional | 3 | 1.7% |
| Total | 181 | 100.0% |
School Enrollment by Age by Funding Source in Galeton borough
Out of a total of 181 students who are enrolled in schools in Galeton borough, 9 (5.0%) attend a private institution, while the remaining 172 (95.0%) are enrolled in public schools. The age group of 15 to 17 year olds has the highest likelihood of being enrolled in private schools, with 4 (11.8% in the age bracket) enrolled. Conversely, the age group of 3 to 4 year olds has the lowest likelihood of being enrolled in a private school, with 4 (100.0% in the age bracket) attending a public institution.
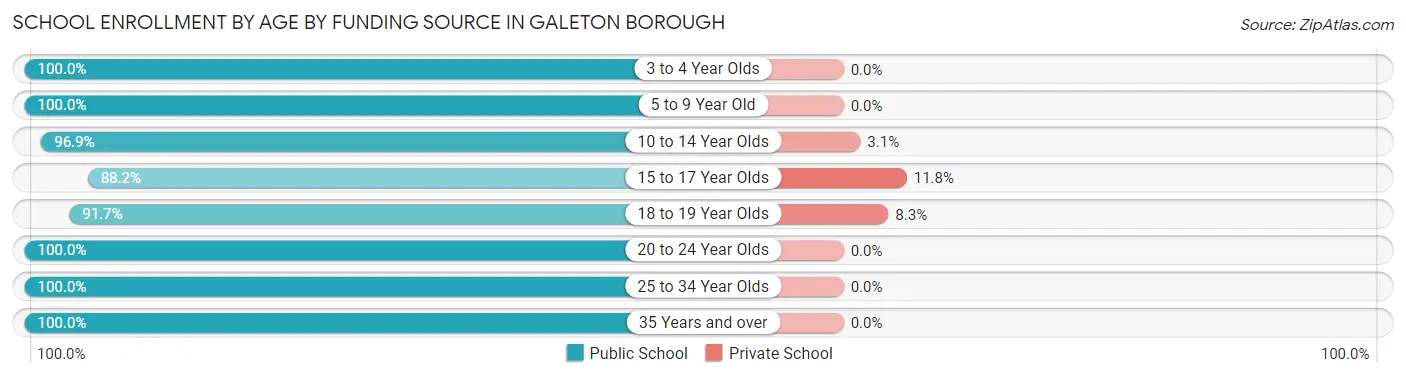
| Age Bracket | Public School | Private School |
| 3 to 4 Year Olds | 4 (100.0%) | 0 (0.0%) |
| 5 to 9 Year Old | 29 (100.0%) | 0 (0.0%) |
| 10 to 14 Year Olds | 62 (96.9%) | 2 (3.1%) |
| 15 to 17 Year Olds | 30 (88.2%) | 4 (11.8%) |
| 18 to 19 Year Olds | 33 (91.7%) | 3 (8.3%) |
| 20 to 24 Year Olds | 8 (100.0%) | 0 (0.0%) |
| 25 to 34 Year Olds | 4 (100.0%) | 0 (0.0%) |
| 35 Years and over | 2 (100.0%) | 0 (0.0%) |
| Total | 172 (95.0%) | 9 (5.0%) |
Educational Attainment by Field of Study in Galeton borough
Education (37 | 34.3%), business (17 | 15.7%), liberal arts & history (10 | 9.3%), arts & humanities (8 | 7.4%), and bio, nature & agricultural (7 | 6.5%) are the most common fields of study among 108 individuals in Galeton borough who have obtained a bachelor's degree or higher.
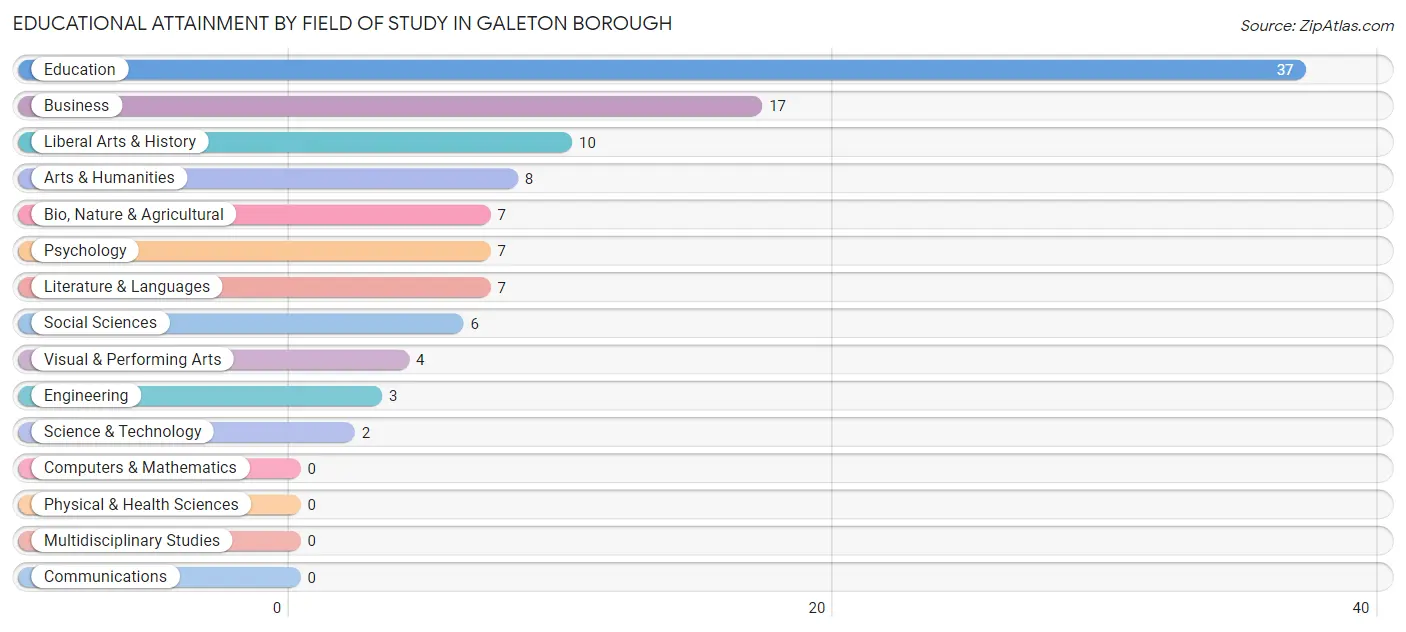
| Field of Study | # Graduates | % Graduates |
| Computers & Mathematics | 0 | 0.0% |
| Bio, Nature & Agricultural | 7 | 6.5% |
| Physical & Health Sciences | 0 | 0.0% |
| Psychology | 7 | 6.5% |
| Social Sciences | 6 | 5.6% |
| Engineering | 3 | 2.8% |
| Multidisciplinary Studies | 0 | 0.0% |
| Science & Technology | 2 | 1.8% |
| Business | 17 | 15.7% |
| Education | 37 | 34.3% |
| Literature & Languages | 7 | 6.5% |
| Liberal Arts & History | 10 | 9.3% |
| Visual & Performing Arts | 4 | 3.7% |
| Communications | 0 | 0.0% |
| Arts & Humanities | 8 | 7.4% |
| Total | 108 | 100.0% |
Transportation & Commute in Galeton borough
Vehicle Availability by Sex in Galeton borough
The most prevalent vehicle ownership categories in Galeton borough are males with 2 vehicles (72, accounting for 41.9%) and females with 2 vehicles (129, making up 35.5%).
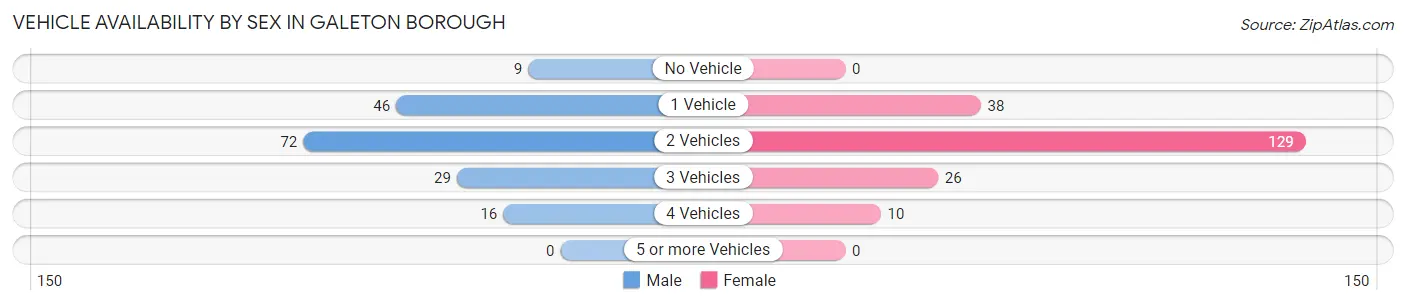
| Vehicles Available | Male | Female |
| No Vehicle | 9 (5.2%) | 0 (0.0%) |
| 1 Vehicle | 46 (26.7%) | 38 (18.7%) |
| 2 Vehicles | 72 (41.9%) | 129 (63.5%) |
| 3 Vehicles | 29 (16.9%) | 26 (12.8%) |
| 4 Vehicles | 16 (9.3%) | 10 (4.9%) |
| 5 or more Vehicles | 0 (0.0%) | 0 (0.0%) |
| Total | 172 (100.0%) | 203 (100.0%) |
Commute Time in Galeton borough
The most frequently occuring commute durations in Galeton borough are 90 or more minutes (65 commuters, 19.2%), 5 to 9 minutes (63 commuters, 18.6%), and 15 to 19 minutes (54 commuters, 16.0%).
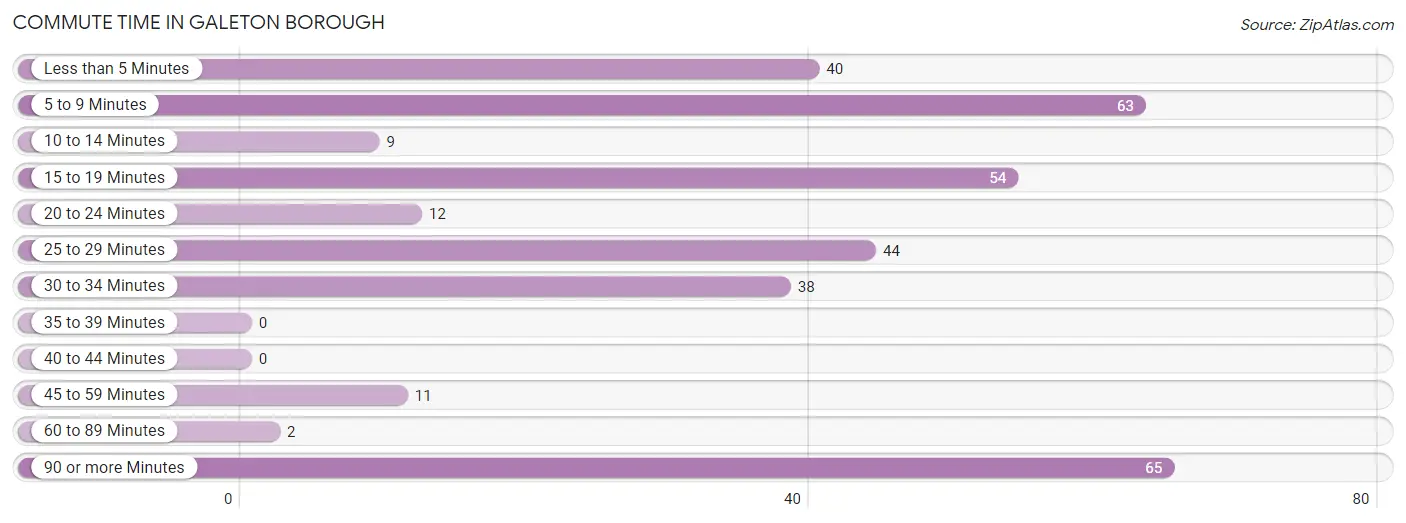
| Commute Time | # Commuters | % Commuters |
| Less than 5 Minutes | 40 | 11.8% |
| 5 to 9 Minutes | 63 | 18.6% |
| 10 to 14 Minutes | 9 | 2.7% |
| 15 to 19 Minutes | 54 | 16.0% |
| 20 to 24 Minutes | 12 | 3.5% |
| 25 to 29 Minutes | 44 | 13.0% |
| 30 to 34 Minutes | 38 | 11.2% |
| 35 to 39 Minutes | 0 | 0.0% |
| 40 to 44 Minutes | 0 | 0.0% |
| 45 to 59 Minutes | 11 | 3.3% |
| 60 to 89 Minutes | 2 | 0.6% |
| 90 or more Minutes | 65 | 19.2% |
Commute Time by Sex in Galeton borough
The most common commute times in Galeton borough are 15 to 19 minutes (34 commuters, 21.8%) for males and 90 or more minutes (54 commuters, 29.7%) for females.
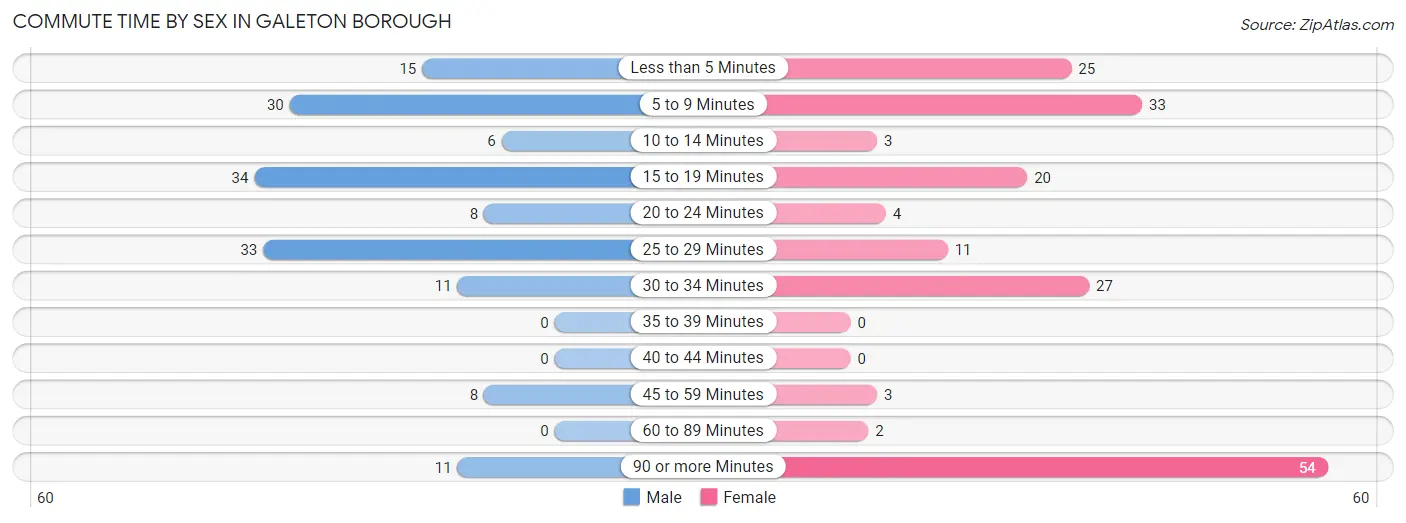
| Commute Time | Male | Female |
| Less than 5 Minutes | 15 (9.6%) | 25 (13.7%) |
| 5 to 9 Minutes | 30 (19.2%) | 33 (18.1%) |
| 10 to 14 Minutes | 6 (3.8%) | 3 (1.7%) |
| 15 to 19 Minutes | 34 (21.8%) | 20 (11.0%) |
| 20 to 24 Minutes | 8 (5.1%) | 4 (2.2%) |
| 25 to 29 Minutes | 33 (21.1%) | 11 (6.0%) |
| 30 to 34 Minutes | 11 (7.0%) | 27 (14.8%) |
| 35 to 39 Minutes | 0 (0.0%) | 0 (0.0%) |
| 40 to 44 Minutes | 0 (0.0%) | 0 (0.0%) |
| 45 to 59 Minutes | 8 (5.1%) | 3 (1.7%) |
| 60 to 89 Minutes | 0 (0.0%) | 2 (1.1%) |
| 90 or more Minutes | 11 (7.0%) | 54 (29.7%) |
Time of Departure to Work by Sex in Galeton borough
The most frequent times of departure to work in Galeton borough are 6:30 AM to 6:59 AM (28, 17.9%) for males and 12:00 AM to 4:59 AM (49, 26.9%) for females.
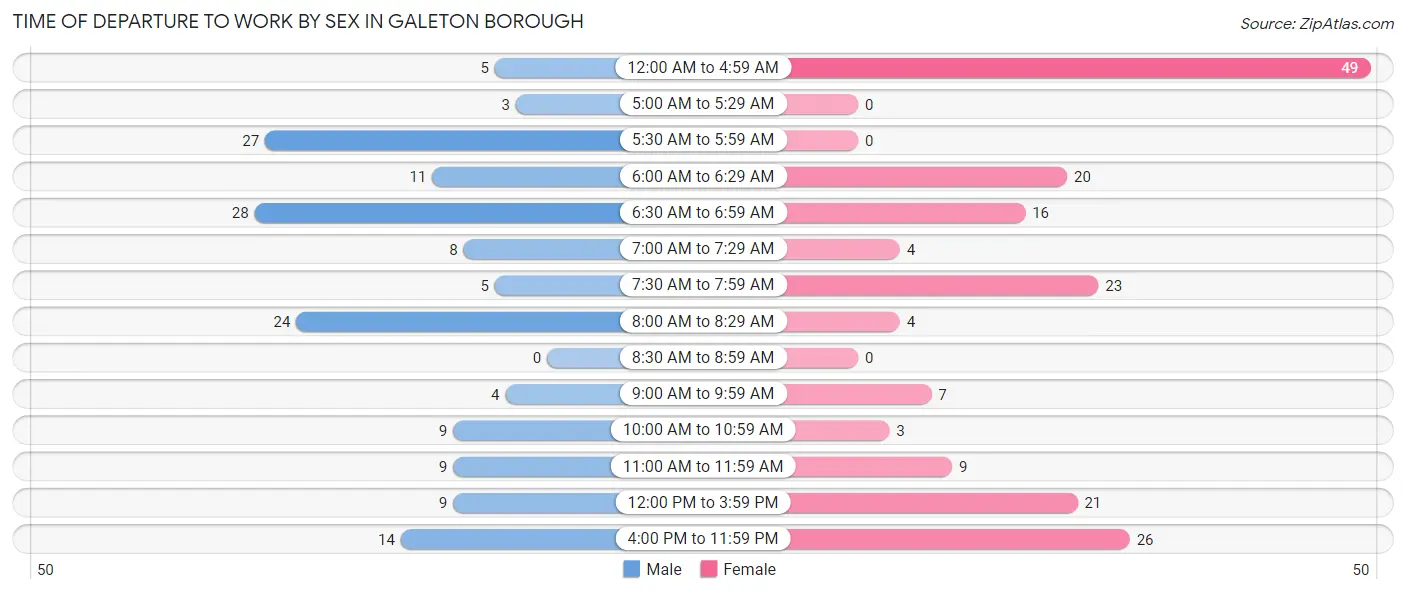
| Time of Departure | Male | Female |
| 12:00 AM to 4:59 AM | 5 (3.2%) | 49 (26.9%) |
| 5:00 AM to 5:29 AM | 3 (1.9%) | 0 (0.0%) |
| 5:30 AM to 5:59 AM | 27 (17.3%) | 0 (0.0%) |
| 6:00 AM to 6:29 AM | 11 (7.0%) | 20 (11.0%) |
| 6:30 AM to 6:59 AM | 28 (17.9%) | 16 (8.8%) |
| 7:00 AM to 7:29 AM | 8 (5.1%) | 4 (2.2%) |
| 7:30 AM to 7:59 AM | 5 (3.2%) | 23 (12.6%) |
| 8:00 AM to 8:29 AM | 24 (15.4%) | 4 (2.2%) |
| 8:30 AM to 8:59 AM | 0 (0.0%) | 0 (0.0%) |
| 9:00 AM to 9:59 AM | 4 (2.6%) | 7 (3.8%) |
| 10:00 AM to 10:59 AM | 9 (5.8%) | 3 (1.7%) |
| 11:00 AM to 11:59 AM | 9 (5.8%) | 9 (5.0%) |
| 12:00 PM to 3:59 PM | 9 (5.8%) | 21 (11.5%) |
| 4:00 PM to 11:59 PM | 14 (9.0%) | 26 (14.3%) |
| Total | 156 (100.0%) | 182 (100.0%) |
Housing Occupancy in Galeton borough
Occupancy by Ownership in Galeton borough
Of the total 419 dwellings in Galeton borough, owner-occupied units account for 270 (64.4%), while renter-occupied units make up 149 (35.6%).
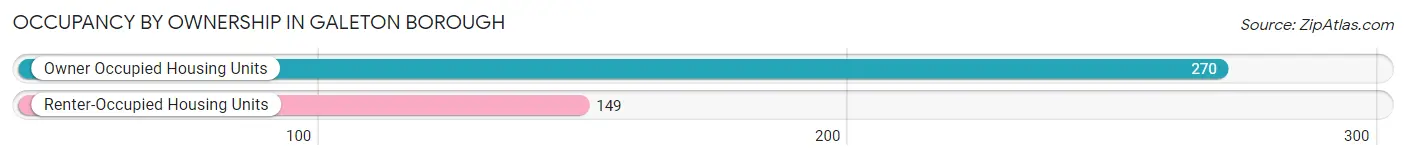
| Occupancy | # Housing Units | % Housing Units |
| Owner Occupied Housing Units | 270 | 64.4% |
| Renter-Occupied Housing Units | 149 | 35.6% |
| Total Occupied Housing Units | 419 | 100.0% |
Occupancy by Household Size in Galeton borough
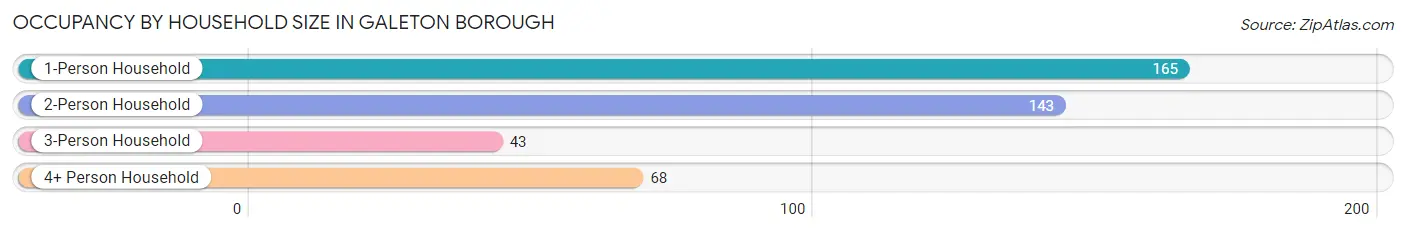
| Household Size | # Housing Units | % Housing Units |
| 1-Person Household | 165 | 39.4% |
| 2-Person Household | 143 | 34.1% |
| 3-Person Household | 43 | 10.3% |
| 4+ Person Household | 68 | 16.2% |
| Total Housing Units | 419 | 100.0% |
Occupancy by Ownership by Household Size in Galeton borough
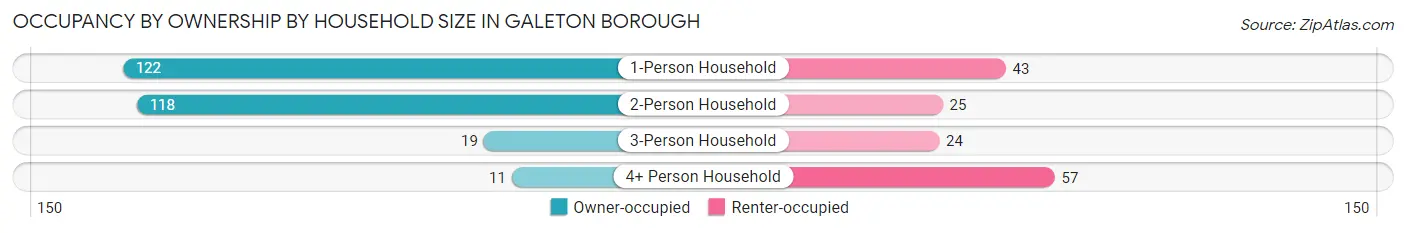
| Household Size | Owner-occupied | Renter-occupied |
| 1-Person Household | 122 (73.9%) | 43 (26.1%) |
| 2-Person Household | 118 (82.5%) | 25 (17.5%) |
| 3-Person Household | 19 (44.2%) | 24 (55.8%) |
| 4+ Person Household | 11 (16.2%) | 57 (83.8%) |
| Total Housing Units | 270 (64.4%) | 149 (35.6%) |
Occupancy by Educational Attainment in Galeton borough
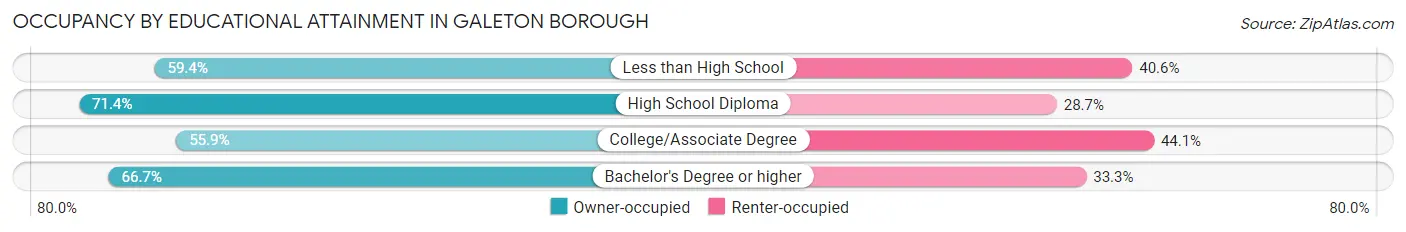
| Household Size | Owner-occupied | Renter-occupied |
| Less than High School | 19 (59.4%) | 13 (40.6%) |
| High School Diploma | 127 (71.4%) | 51 (28.6%) |
| College/Associate Degree | 80 (55.9%) | 63 (44.1%) |
| Bachelor's Degree or higher | 44 (66.7%) | 22 (33.3%) |
Occupancy by Age of Householder in Galeton borough
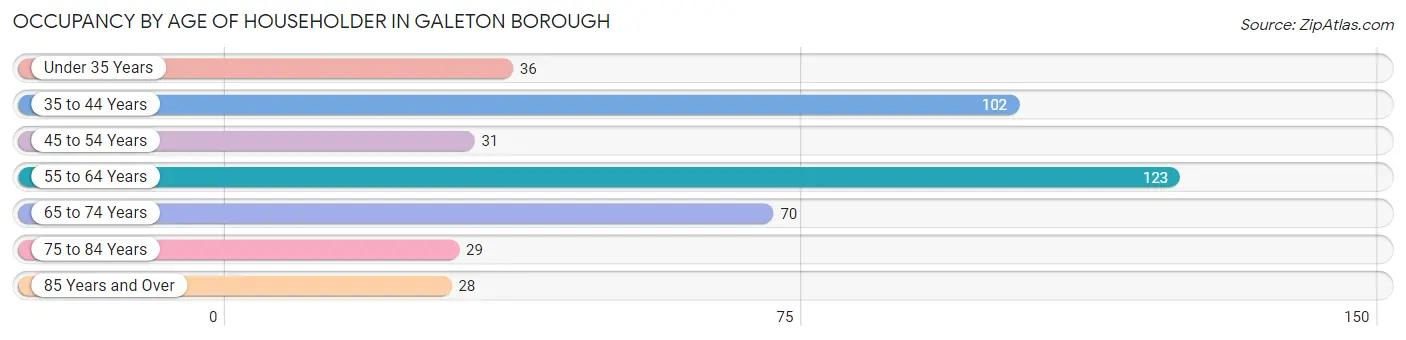
| Age Bracket | # Households | % Households |
| Under 35 Years | 36 | 8.6% |
| 35 to 44 Years | 102 | 24.3% |
| 45 to 54 Years | 31 | 7.4% |
| 55 to 64 Years | 123 | 29.4% |
| 65 to 74 Years | 70 | 16.7% |
| 75 to 84 Years | 29 | 6.9% |
| 85 Years and Over | 28 | 6.7% |
| Total | 419 | 100.0% |
Housing Finances in Galeton borough
Median Income by Occupancy in Galeton borough
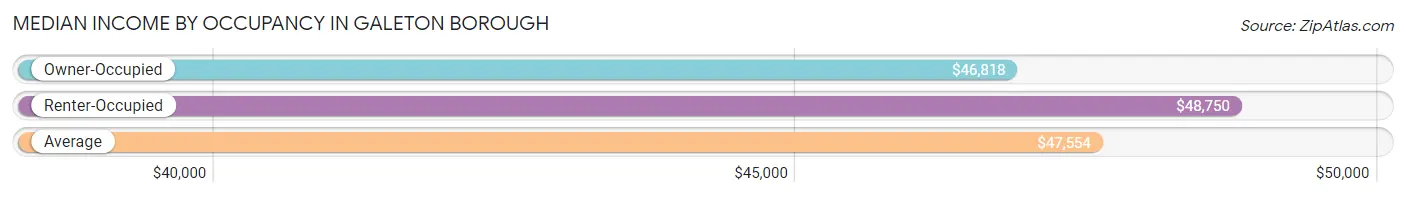
| Occupancy Type | # Households | Median Income |
| Owner-Occupied | 270 (64.4%) | $46,818 |
| Renter-Occupied | 149 (35.6%) | $48,750 |
| Average | 419 (100.0%) | $47,554 |
Occupancy by Householder Income Bracket in Galeton borough
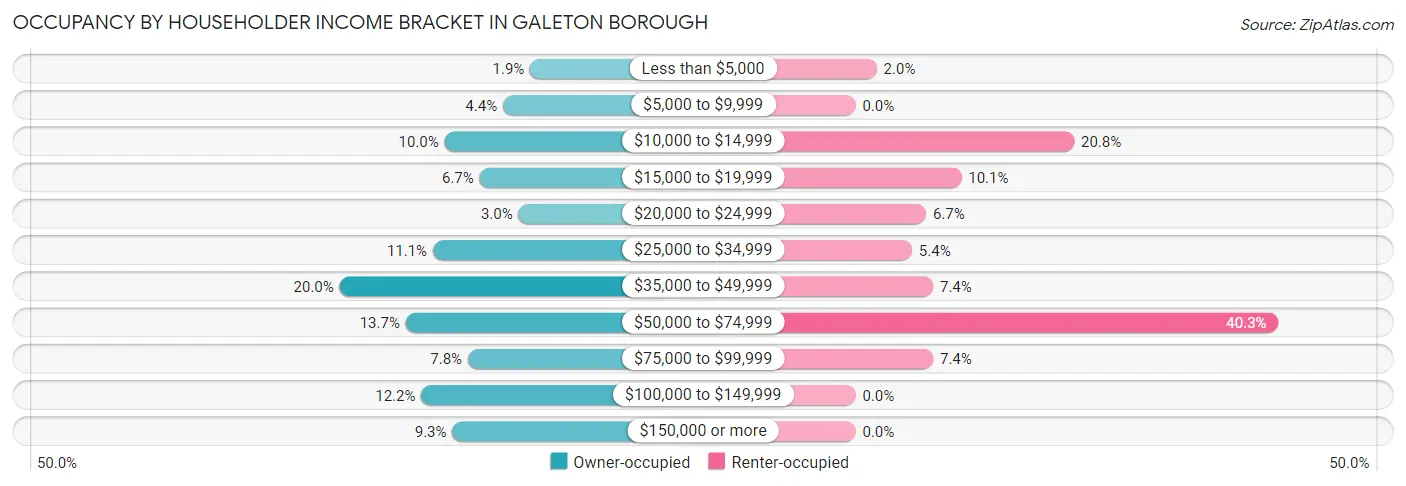
| Income Bracket | Owner-occupied | Renter-occupied |
| Less than $5,000 | 5 (1.8%) | 3 (2.0%) |
| $5,000 to $9,999 | 12 (4.4%) | 0 (0.0%) |
| $10,000 to $14,999 | 27 (10.0%) | 31 (20.8%) |
| $15,000 to $19,999 | 18 (6.7%) | 15 (10.1%) |
| $20,000 to $24,999 | 8 (3.0%) | 10 (6.7%) |
| $25,000 to $34,999 | 30 (11.1%) | 8 (5.4%) |
| $35,000 to $49,999 | 54 (20.0%) | 11 (7.4%) |
| $50,000 to $74,999 | 37 (13.7%) | 60 (40.3%) |
| $75,000 to $99,999 | 21 (7.8%) | 11 (7.4%) |
| $100,000 to $149,999 | 33 (12.2%) | 0 (0.0%) |
| $150,000 or more | 25 (9.3%) | 0 (0.0%) |
| Total | 270 (100.0%) | 149 (100.0%) |
Monthly Housing Cost Tiers in Galeton borough
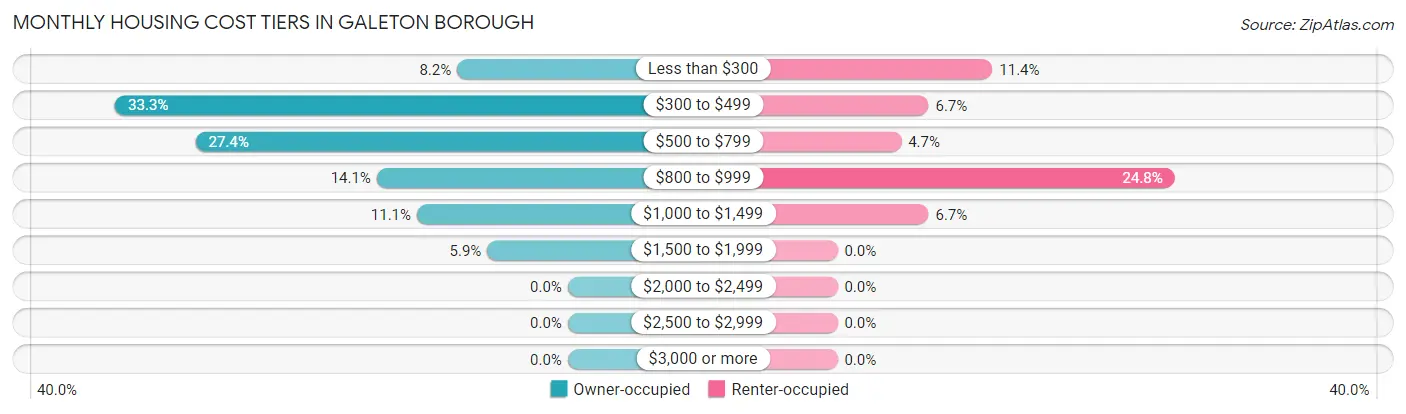
| Monthly Cost | Owner-occupied | Renter-occupied |
| Less than $300 | 22 (8.2%) | 17 (11.4%) |
| $300 to $499 | 90 (33.3%) | 10 (6.7%) |
| $500 to $799 | 74 (27.4%) | 7 (4.7%) |
| $800 to $999 | 38 (14.1%) | 37 (24.8%) |
| $1,000 to $1,499 | 30 (11.1%) | 10 (6.7%) |
| $1,500 to $1,999 | 16 (5.9%) | 0 (0.0%) |
| $2,000 to $2,499 | 0 (0.0%) | 0 (0.0%) |
| $2,500 to $2,999 | 0 (0.0%) | 0 (0.0%) |
| $3,000 or more | 0 (0.0%) | 0 (0.0%) |
| Total | 270 (100.0%) | 149 (100.0%) |
Physical Housing Characteristics in Galeton borough
Housing Structures in Galeton borough
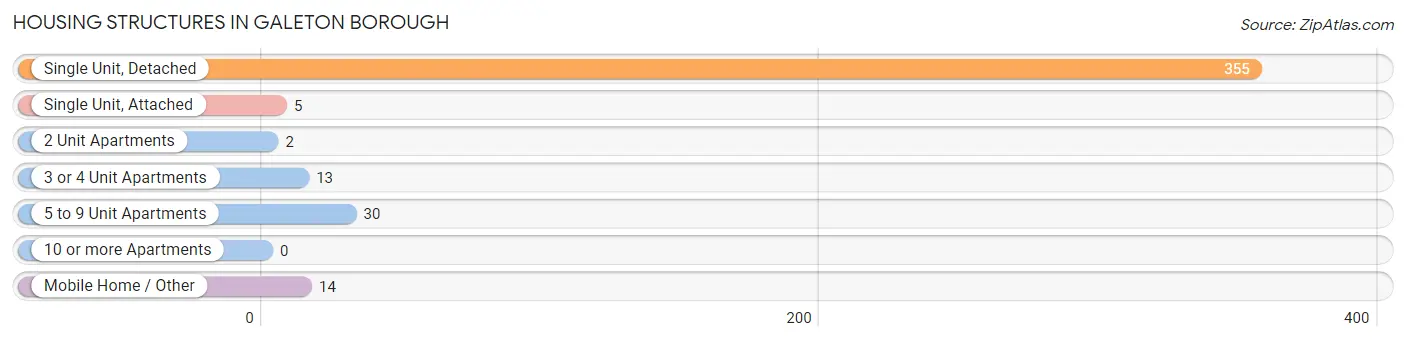
| Structure Type | # Housing Units | % Housing Units |
| Single Unit, Detached | 355 | 84.7% |
| Single Unit, Attached | 5 | 1.2% |
| 2 Unit Apartments | 2 | 0.5% |
| 3 or 4 Unit Apartments | 13 | 3.1% |
| 5 to 9 Unit Apartments | 30 | 7.2% |
| 10 or more Apartments | 0 | 0.0% |
| Mobile Home / Other | 14 | 3.3% |
| Total | 419 | 100.0% |
Housing Structures by Occupancy in Galeton borough
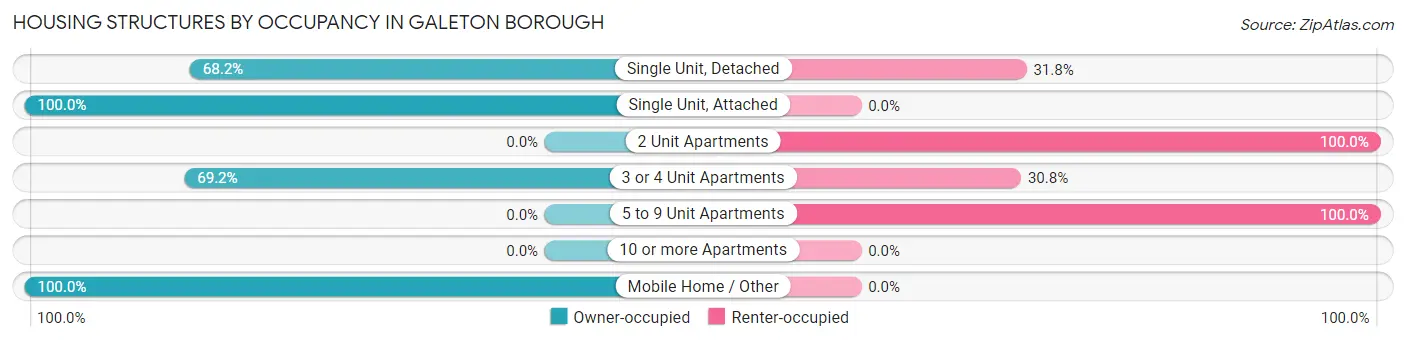
| Structure Type | Owner-occupied | Renter-occupied |
| Single Unit, Detached | 242 (68.2%) | 113 (31.8%) |
| Single Unit, Attached | 5 (100.0%) | 0 (0.0%) |
| 2 Unit Apartments | 0 (0.0%) | 2 (100.0%) |
| 3 or 4 Unit Apartments | 9 (69.2%) | 4 (30.8%) |
| 5 to 9 Unit Apartments | 0 (0.0%) | 30 (100.0%) |
| 10 or more Apartments | 0 (0.0%) | 0 (0.0%) |
| Mobile Home / Other | 14 (100.0%) | 0 (0.0%) |
| Total | 270 (64.4%) | 149 (35.6%) |
Housing Structures by Number of Rooms in Galeton borough
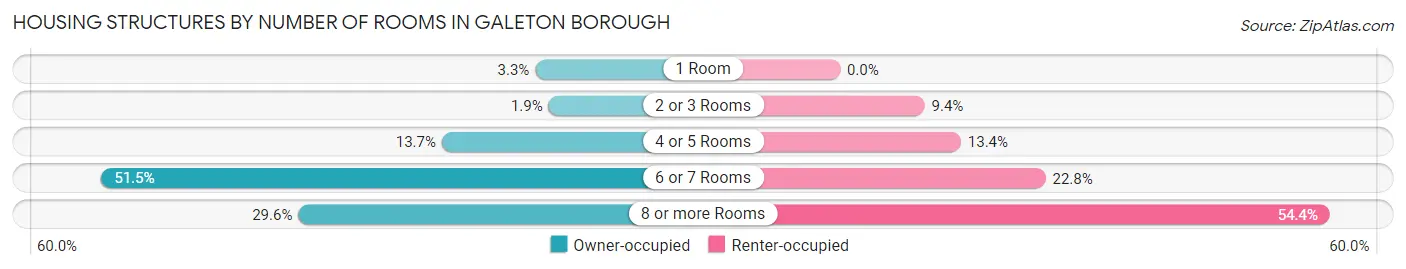
| Number of Rooms | Owner-occupied | Renter-occupied |
| 1 Room | 9 (3.3%) | 0 (0.0%) |
| 2 or 3 Rooms | 5 (1.8%) | 14 (9.4%) |
| 4 or 5 Rooms | 37 (13.7%) | 20 (13.4%) |
| 6 or 7 Rooms | 139 (51.5%) | 34 (22.8%) |
| 8 or more Rooms | 80 (29.6%) | 81 (54.4%) |
| Total | 270 (100.0%) | 149 (100.0%) |
Housing Structure by Heating Type in Galeton borough
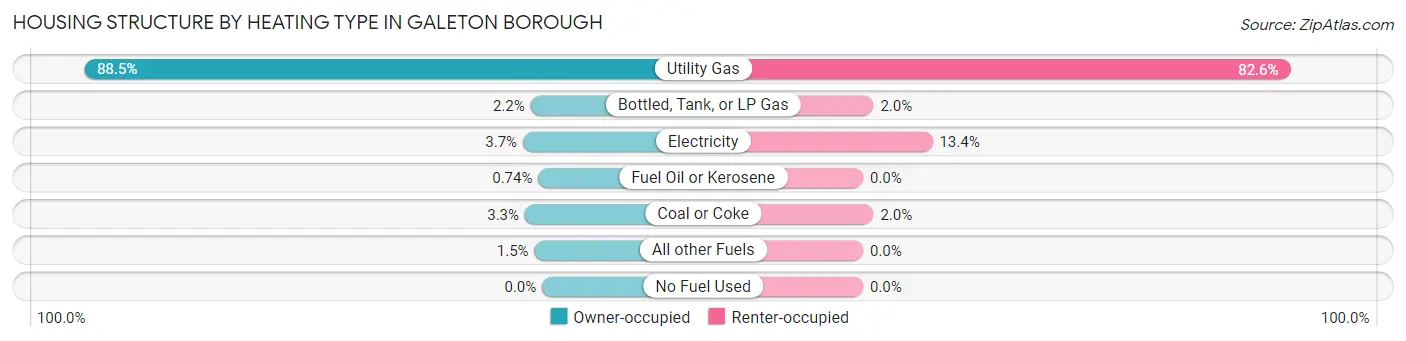
| Heating Type | Owner-occupied | Renter-occupied |
| Utility Gas | 239 (88.5%) | 123 (82.6%) |
| Bottled, Tank, or LP Gas | 6 (2.2%) | 3 (2.0%) |
| Electricity | 10 (3.7%) | 20 (13.4%) |
| Fuel Oil or Kerosene | 2 (0.7%) | 0 (0.0%) |
| Coal or Coke | 9 (3.3%) | 3 (2.0%) |
| All other Fuels | 4 (1.5%) | 0 (0.0%) |
| No Fuel Used | 0 (0.0%) | 0 (0.0%) |
| Total | 270 (100.0%) | 149 (100.0%) |
Household Vehicle Usage in Galeton borough
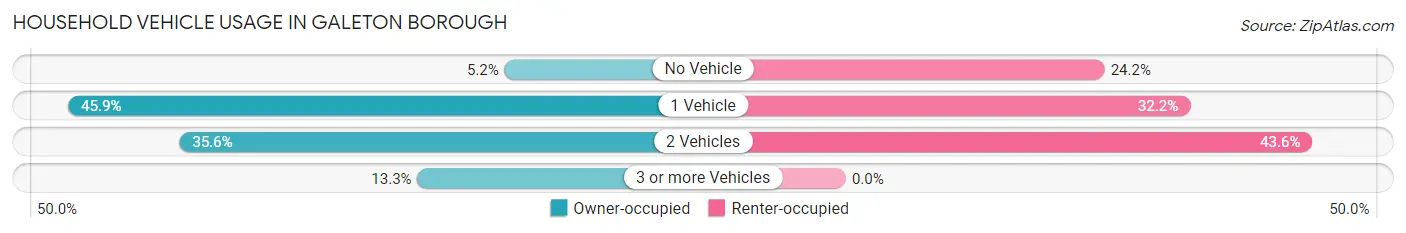
| Vehicles per Household | Owner-occupied | Renter-occupied |
| No Vehicle | 14 (5.2%) | 36 (24.2%) |
| 1 Vehicle | 124 (45.9%) | 48 (32.2%) |
| 2 Vehicles | 96 (35.6%) | 65 (43.6%) |
| 3 or more Vehicles | 36 (13.3%) | 0 (0.0%) |
| Total | 270 (100.0%) | 149 (100.0%) |
Real Estate & Mortgages in Galeton borough
Real Estate and Mortgage Overview in Galeton borough
| Characteristic | Without Mortgage | With Mortgage |
| Housing Units | 173 | 97 |
| Median Property Value | $83,000 | $98,800 |
| Median Household Income | $38,750 | $0 |
| Monthly Housing Costs | $425 | $0 |
| Real Estate Taxes | $1,035 | $3 |
Property Value by Mortgage Status in Galeton borough
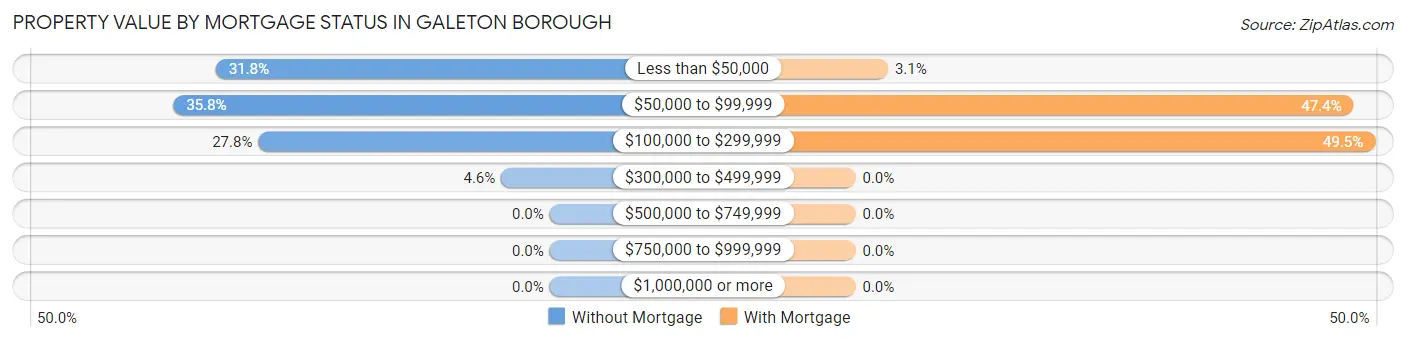
| Property Value | Without Mortgage | With Mortgage |
| Less than $50,000 | 55 (31.8%) | 3 (3.1%) |
| $50,000 to $99,999 | 62 (35.8%) | 46 (47.4%) |
| $100,000 to $299,999 | 48 (27.8%) | 48 (49.5%) |
| $300,000 to $499,999 | 8 (4.6%) | 0 (0.0%) |
| $500,000 to $749,999 | 0 (0.0%) | 0 (0.0%) |
| $750,000 to $999,999 | 0 (0.0%) | 0 (0.0%) |
| $1,000,000 or more | 0 (0.0%) | 0 (0.0%) |
| Total | 173 (100.0%) | 97 (100.0%) |
Household Income by Mortgage Status in Galeton borough
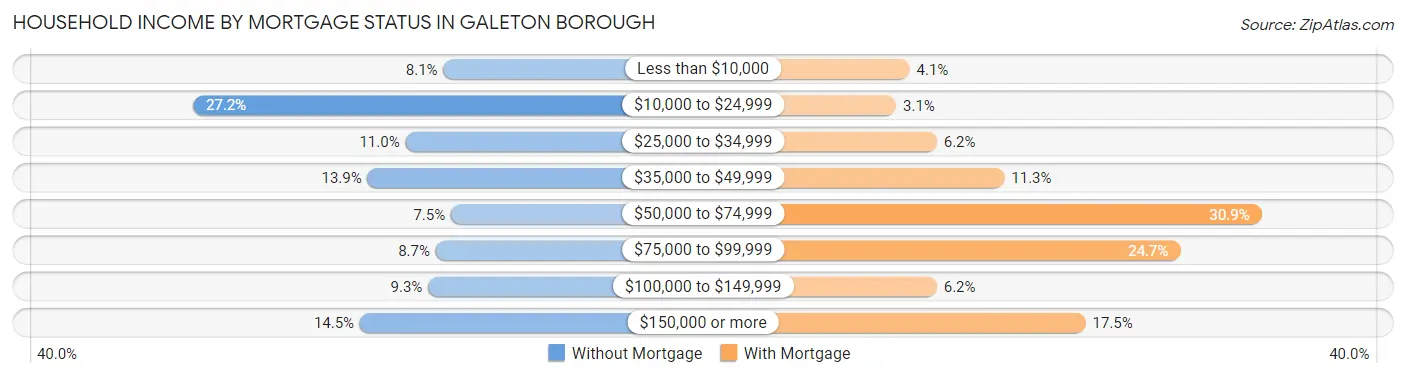
| Household Income | Without Mortgage | With Mortgage |
| Less than $10,000 | 14 (8.1%) | 4 (4.1%) |
| $10,000 to $24,999 | 47 (27.2%) | 3 (3.1%) |
| $25,000 to $34,999 | 19 (11.0%) | 6 (6.2%) |
| $35,000 to $49,999 | 24 (13.9%) | 11 (11.3%) |
| $50,000 to $74,999 | 13 (7.5%) | 30 (30.9%) |
| $75,000 to $99,999 | 15 (8.7%) | 24 (24.7%) |
| $100,000 to $149,999 | 16 (9.2%) | 6 (6.2%) |
| $150,000 or more | 25 (14.4%) | 17 (17.5%) |
| Total | 173 (100.0%) | 97 (100.0%) |
Property Value to Household Income Ratio in Galeton borough
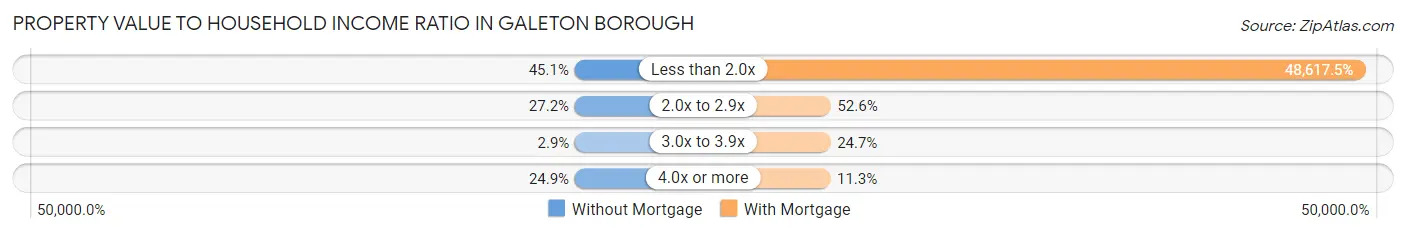
| Value-to-Income Ratio | Without Mortgage | With Mortgage |
| Less than 2.0x | 78 (45.1%) | 47,159 (48,617.5%) |
| 2.0x to 2.9x | 47 (27.2%) | 51 (52.6%) |
| 3.0x to 3.9x | 5 (2.9%) | 24 (24.7%) |
| 4.0x or more | 43 (24.9%) | 11 (11.3%) |
| Total | 173 (100.0%) | 97 (100.0%) |
Real Estate Taxes by Mortgage Status in Galeton borough
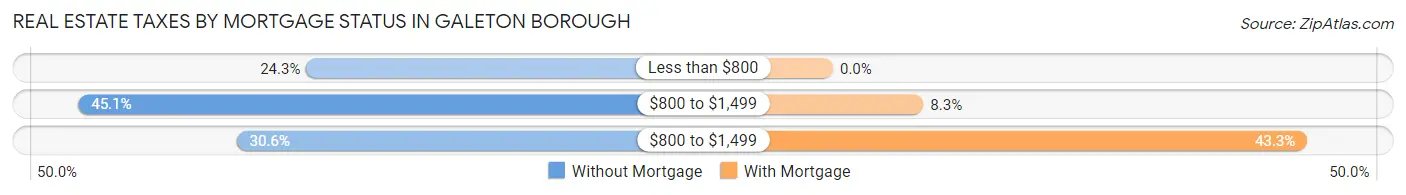
| Property Taxes | Without Mortgage | With Mortgage |
| Less than $800 | 42 (24.3%) | 0 (0.0%) |
| $800 to $1,499 | 78 (45.1%) | 8 (8.3%) |
| $800 to $1,499 | 53 (30.6%) | 42 (43.3%) |
| Total | 173 (100.0%) | 97 (100.0%) |
Health & Disability in Galeton borough
Health Insurance Coverage by Age in Galeton borough
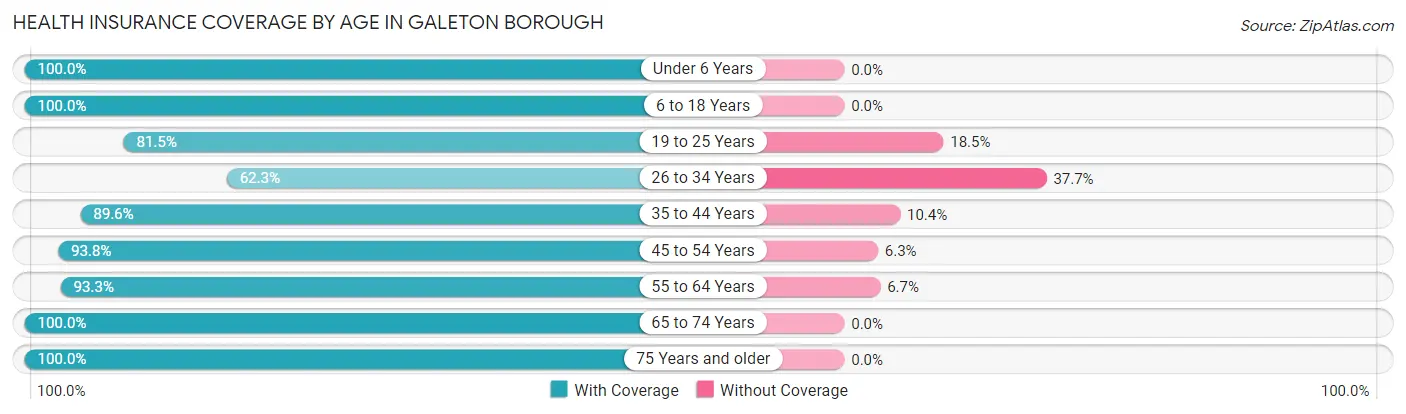
| Age Bracket | With Coverage | Without Coverage |
| Under 6 Years | 33 (100.0%) | 0 (0.0%) |
| 6 to 18 Years | 140 (100.0%) | 0 (0.0%) |
| 19 to 25 Years | 53 (81.5%) | 12 (18.5%) |
| 26 to 34 Years | 38 (62.3%) | 23 (37.7%) |
| 35 to 44 Years | 112 (89.6%) | 13 (10.4%) |
| 45 to 54 Years | 45 (93.8%) | 3 (6.2%) |
| 55 to 64 Years | 181 (93.3%) | 13 (6.7%) |
| 65 to 74 Years | 102 (100.0%) | 0 (0.0%) |
| 75 Years and older | 76 (100.0%) | 0 (0.0%) |
| Total | 780 (92.4%) | 64 (7.6%) |
Health Insurance Coverage by Citizenship Status in Galeton borough
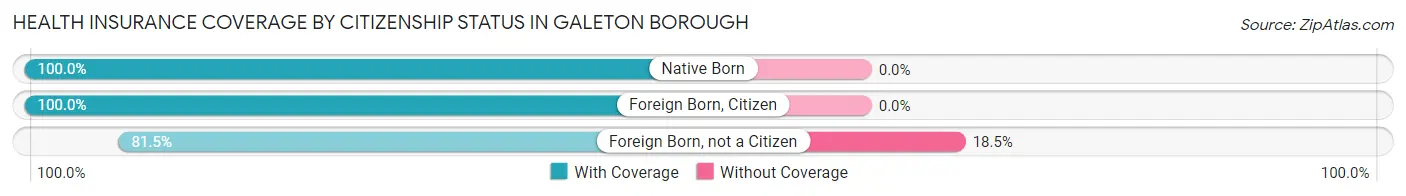
| Citizenship Status | With Coverage | Without Coverage |
| Native Born | 33 (100.0%) | 0 (0.0%) |
| Foreign Born, Citizen | 140 (100.0%) | 0 (0.0%) |
| Foreign Born, not a Citizen | 53 (81.5%) | 12 (18.5%) |
Health Insurance Coverage by Household Income in Galeton borough
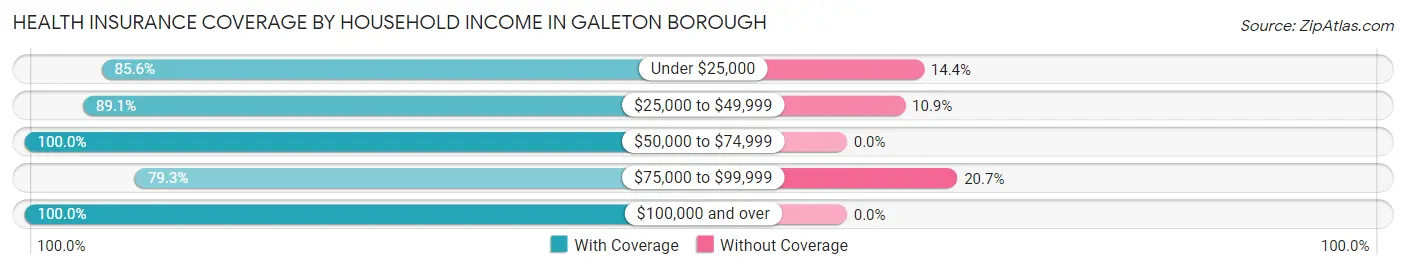
| Household Income | With Coverage | Without Coverage |
| Under $25,000 | 160 (85.6%) | 27 (14.4%) |
| $25,000 to $49,999 | 155 (89.1%) | 19 (10.9%) |
| $50,000 to $74,999 | 239 (100.0%) | 0 (0.0%) |
| $75,000 to $99,999 | 69 (79.3%) | 18 (20.7%) |
| $100,000 and over | 157 (100.0%) | 0 (0.0%) |
Public vs Private Health Insurance Coverage by Age in Galeton borough
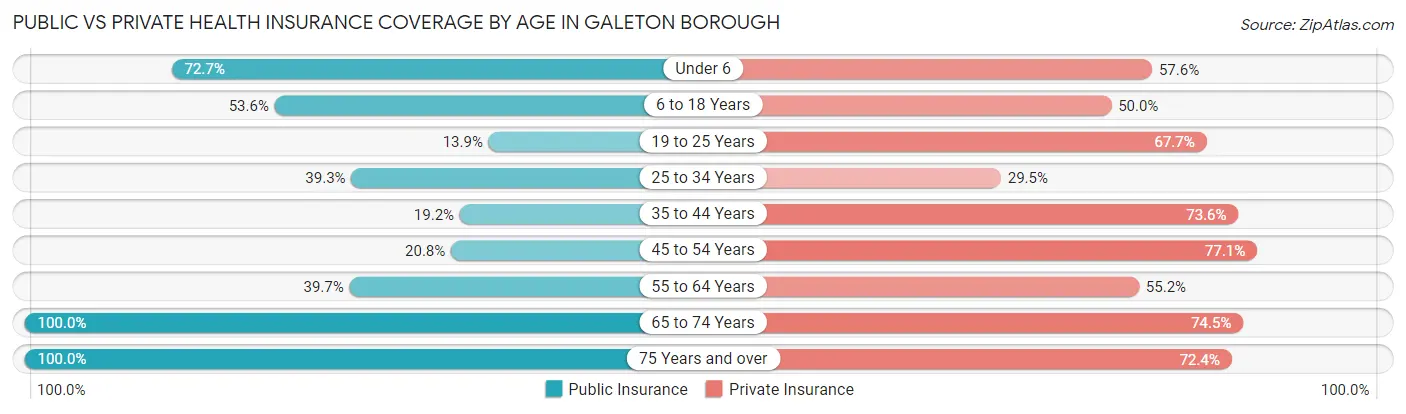
| Age Bracket | Public Insurance | Private Insurance |
| Under 6 | 24 (72.7%) | 19 (57.6%) |
| 6 to 18 Years | 75 (53.6%) | 70 (50.0%) |
| 19 to 25 Years | 9 (13.9%) | 44 (67.7%) |
| 25 to 34 Years | 24 (39.3%) | 18 (29.5%) |
| 35 to 44 Years | 24 (19.2%) | 92 (73.6%) |
| 45 to 54 Years | 10 (20.8%) | 37 (77.1%) |
| 55 to 64 Years | 77 (39.7%) | 107 (55.1%) |
| 65 to 74 Years | 102 (100.0%) | 76 (74.5%) |
| 75 Years and over | 76 (100.0%) | 55 (72.4%) |
| Total | 421 (49.9%) | 518 (61.4%) |
Disability Status by Sex by Age in Galeton borough
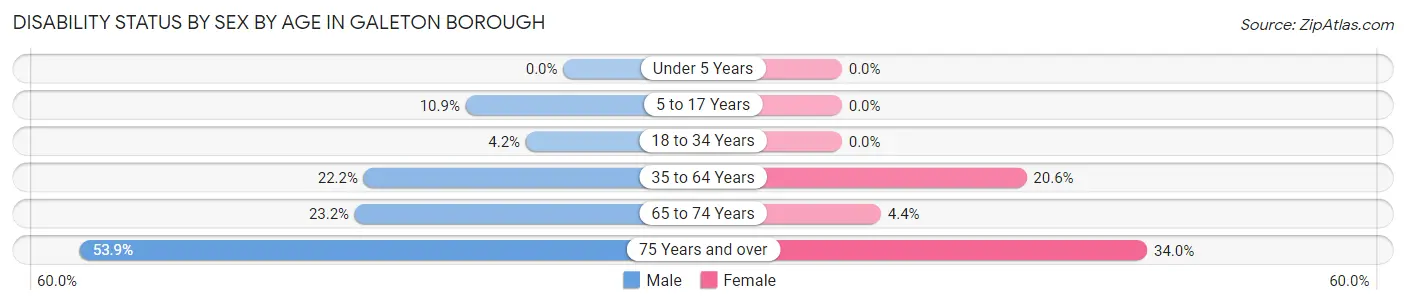
| Age Bracket | Male | Female |
| Under 5 Years | 0 (0.0%) | 0 (0.0%) |
| 5 to 17 Years | 5 (10.9%) | 0 (0.0%) |
| 18 to 34 Years | 3 (4.2%) | 0 (0.0%) |
| 35 to 64 Years | 34 (22.2%) | 44 (20.6%) |
| 65 to 74 Years | 13 (23.2%) | 2 (4.3%) |
| 75 Years and over | 14 (53.8%) | 17 (34.0%) |
Disability Class by Sex by Age in Galeton borough
Disability Class: Hearing Difficulty
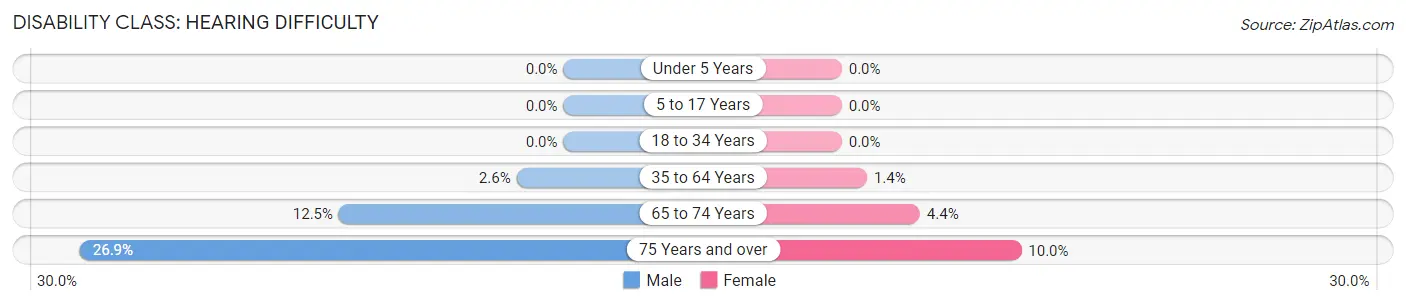
| Age Bracket | Male | Female |
| Under 5 Years | 0 (0.0%) | 0 (0.0%) |
| 5 to 17 Years | 0 (0.0%) | 0 (0.0%) |
| 18 to 34 Years | 0 (0.0%) | 0 (0.0%) |
| 35 to 64 Years | 4 (2.6%) | 3 (1.4%) |
| 65 to 74 Years | 7 (12.5%) | 2 (4.3%) |
| 75 Years and over | 7 (26.9%) | 5 (10.0%) |
Disability Class: Vision Difficulty
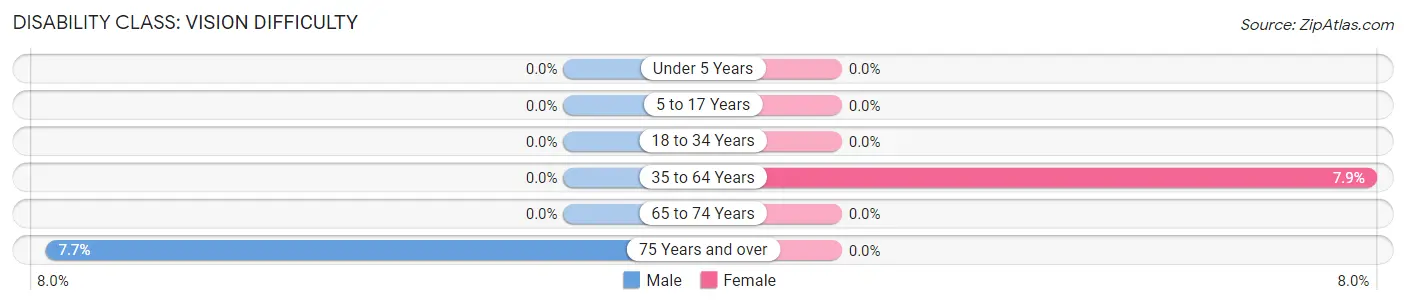
| Age Bracket | Male | Female |
| Under 5 Years | 0 (0.0%) | 0 (0.0%) |
| 5 to 17 Years | 0 (0.0%) | 0 (0.0%) |
| 18 to 34 Years | 0 (0.0%) | 0 (0.0%) |
| 35 to 64 Years | 0 (0.0%) | 17 (7.9%) |
| 65 to 74 Years | 0 (0.0%) | 0 (0.0%) |
| 75 Years and over | 2 (7.7%) | 0 (0.0%) |
Disability Class: Cognitive Difficulty
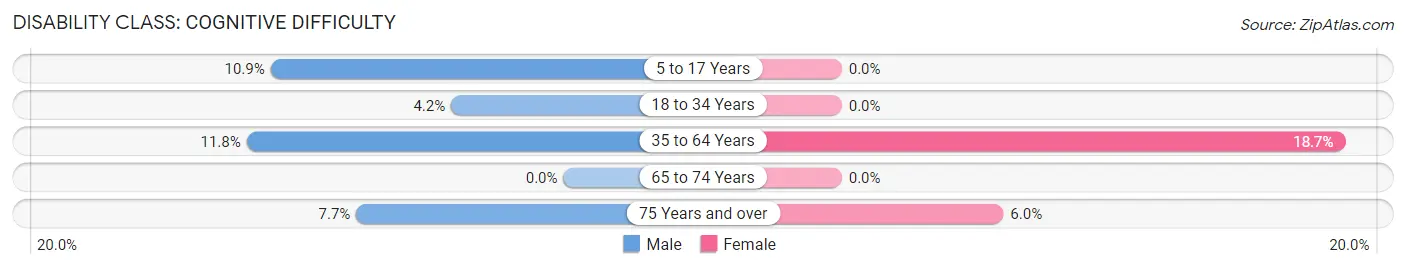
| Age Bracket | Male | Female |
| 5 to 17 Years | 5 (10.9%) | 0 (0.0%) |
| 18 to 34 Years | 3 (4.2%) | 0 (0.0%) |
| 35 to 64 Years | 18 (11.8%) | 40 (18.7%) |
| 65 to 74 Years | 0 (0.0%) | 0 (0.0%) |
| 75 Years and over | 2 (7.7%) | 3 (6.0%) |
Disability Class: Ambulatory Difficulty
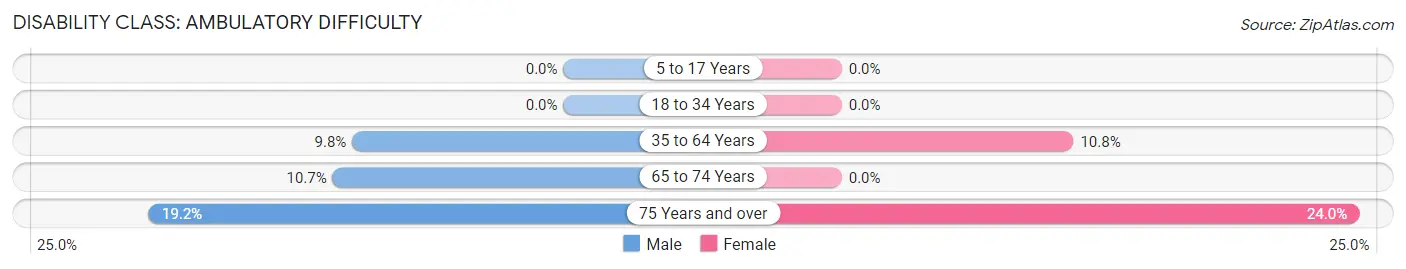
| Age Bracket | Male | Female |
| 5 to 17 Years | 0 (0.0%) | 0 (0.0%) |
| 18 to 34 Years | 0 (0.0%) | 0 (0.0%) |
| 35 to 64 Years | 15 (9.8%) | 23 (10.7%) |
| 65 to 74 Years | 6 (10.7%) | 0 (0.0%) |
| 75 Years and over | 5 (19.2%) | 12 (24.0%) |
Disability Class: Self-Care Difficulty
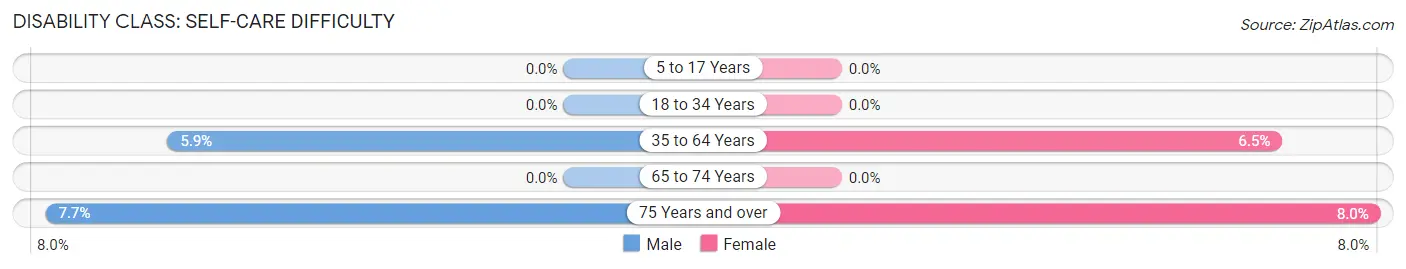
| Age Bracket | Male | Female |
| 5 to 17 Years | 0 (0.0%) | 0 (0.0%) |
| 18 to 34 Years | 0 (0.0%) | 0 (0.0%) |
| 35 to 64 Years | 9 (5.9%) | 14 (6.5%) |
| 65 to 74 Years | 0 (0.0%) | 0 (0.0%) |
| 75 Years and over | 2 (7.7%) | 4 (8.0%) |
Technology Access in Galeton borough
Computing Device Access in Galeton borough
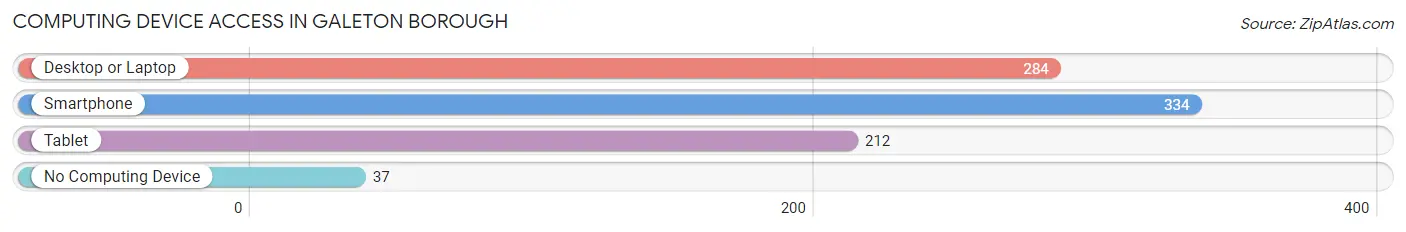
| Device Type | # Households | % Households |
| Desktop or Laptop | 284 | 67.8% |
| Smartphone | 334 | 79.7% |
| Tablet | 212 | 50.6% |
| No Computing Device | 37 | 8.8% |
| Total | 419 | 100.0% |
Internet Access in Galeton borough
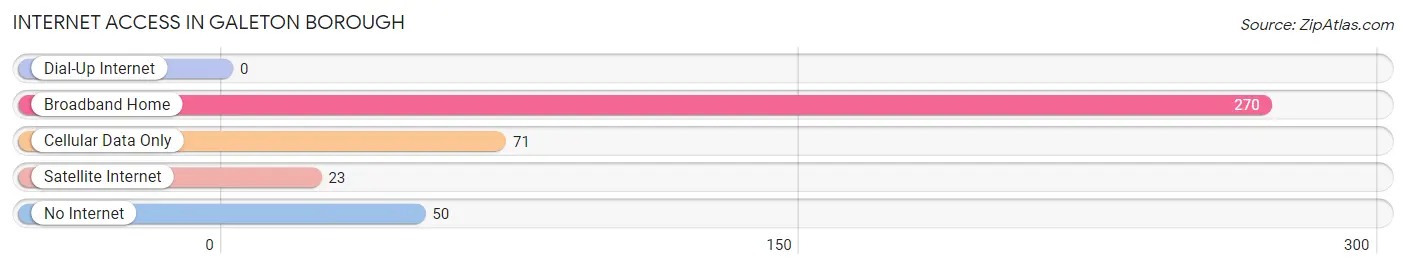
| Internet Type | # Households | % Households |
| Dial-Up Internet | 0 | 0.0% |
| Broadband Home | 270 | 64.4% |
| Cellular Data Only | 71 | 17.0% |
| Satellite Internet | 23 | 5.5% |
| No Internet | 50 | 11.9% |
| Total | 419 | 100.0% |
Galeton borough Summary
Geography
Galeton Borough is located in Potter County, Pennsylvania, in the United States. It is situated in the north-central part of the state, approximately 20 miles south of the New York border. The borough is located in the Allegheny Plateau region of Pennsylvania, and is surrounded by the Tioga State Forest. The borough is situated on the banks of the West Branch of the Susquehanna River, and is bordered by the boroughs of Ulysses and Coudersport.
The borough has a total area of 0.7 square miles, all of which is land. The terrain is mostly flat, with some rolling hills in the surrounding area. The climate is humid continental, with cold winters and warm summers.
History
Galeton Borough was founded in 1876 by a group of settlers from the nearby town of Ulysses. The settlers were attracted to the area by the abundance of timber and the potential for economic growth. The town was named after the nearby Galeton Creek, which was named after a Native American chief.
The first settlers in the area were mostly farmers, and the town quickly grew to become a center of commerce and industry. The first businesses in the area included a sawmill, a gristmill, a tannery, and a blacksmith shop. The town also had a post office, a school, and a church.
In the late 19th century, the town began to experience a period of rapid growth. The population increased from just over 500 in 1880 to over 1,000 in 1900. This growth was largely due to the development of the lumber industry in the area. The town was also home to several other industries, including a brickyard, a furniture factory, and a canning factory.
The town continued to grow throughout the 20th century, and by 2000 the population had reached 1,845.
Economy
The economy of Galeton Borough is largely based on the lumber industry. The town is home to several sawmills and woodworking shops, as well as a furniture factory. The town is also home to several small businesses, including restaurants, retail stores, and service providers.
The town is also home to several tourist attractions, including the Galeton Museum of Natural History and the Galeton Historical Society. The town is also home to several parks and recreational areas, including the Galeton Recreation Area and the Galeton State Park.
Demographics
As of the 2010 census, the population of Galeton Borough was 1,845. The racial makeup of the town was 97.3% White, 0.7% African American, 0.2% Native American, 0.2% Asian, 0.1% from other races, and 1.5% from two or more races. Hispanic or Latino of any race were 0.7% of the population.
The median household income in the town was $37,917, and the median family income was $45,625. The per capita income in the town was $19,945. About 11.2% of families and 14.2% of the population were below the poverty line, including 19.2% of those under age 18 and 8.3% of those age 65 or over.
Common Questions
What is Per Capita Income in Galeton borough?
Per Capita income in Galeton borough is $29,530.
What is the Median Family Income in Galeton borough?
Median Family Income in Galeton borough is $66,633.
What is the Median Household income in Galeton borough?
Median Household Income in Galeton borough is $47,554.
What is Income or Wage Gap in Galeton borough?
Income or Wage Gap in Galeton borough is 8.1%.
Women in Galeton borough earn 91.9 cents for every dollar earned by a man.
What is Inequality or Gini Index in Galeton borough?
Inequality or Gini Index in Galeton borough is 0.45.
What is the Total Population of Galeton borough?
Total Population of Galeton borough is 844.
What is the Total Male Population of Galeton borough?
Total Male Population of Galeton borough is 370.
What is the Total Female Population of Galeton borough?
Total Female Population of Galeton borough is 474.
What is the Ratio of Males per 100 Females in Galeton borough?
There are 78.06 Males per 100 Females in Galeton borough.
What is the Ratio of Females per 100 Males in Galeton borough?
There are 128.11 Females per 100 Males in Galeton borough.
What is the Median Population Age in Galeton borough?
Median Population Age in Galeton borough is 44.7 Years.
What is the Average Family Size in Galeton borough
Average Family Size in Galeton borough is 2.5 People.
What is the Average Household Size in Galeton borough
Average Household Size in Galeton borough is 2.0 People.
How Large is the Labor Force in Galeton borough?
There are 388 People in the Labor Forcein in Galeton borough.
What is the Percentage of People in the Labor Force in Galeton borough?
54.3% of People are in the Labor Force in Galeton borough.
What is the Unemployment Rate in Galeton borough?
Unemployment Rate in Galeton borough is 2.8%.