Cities with the Highest Percentage of Population Employed in Administrative & Support Services in Massachusetts
RELATED REPORTS & OPTIONS
Administrative & Support Services
Massachusetts
Compare Cities
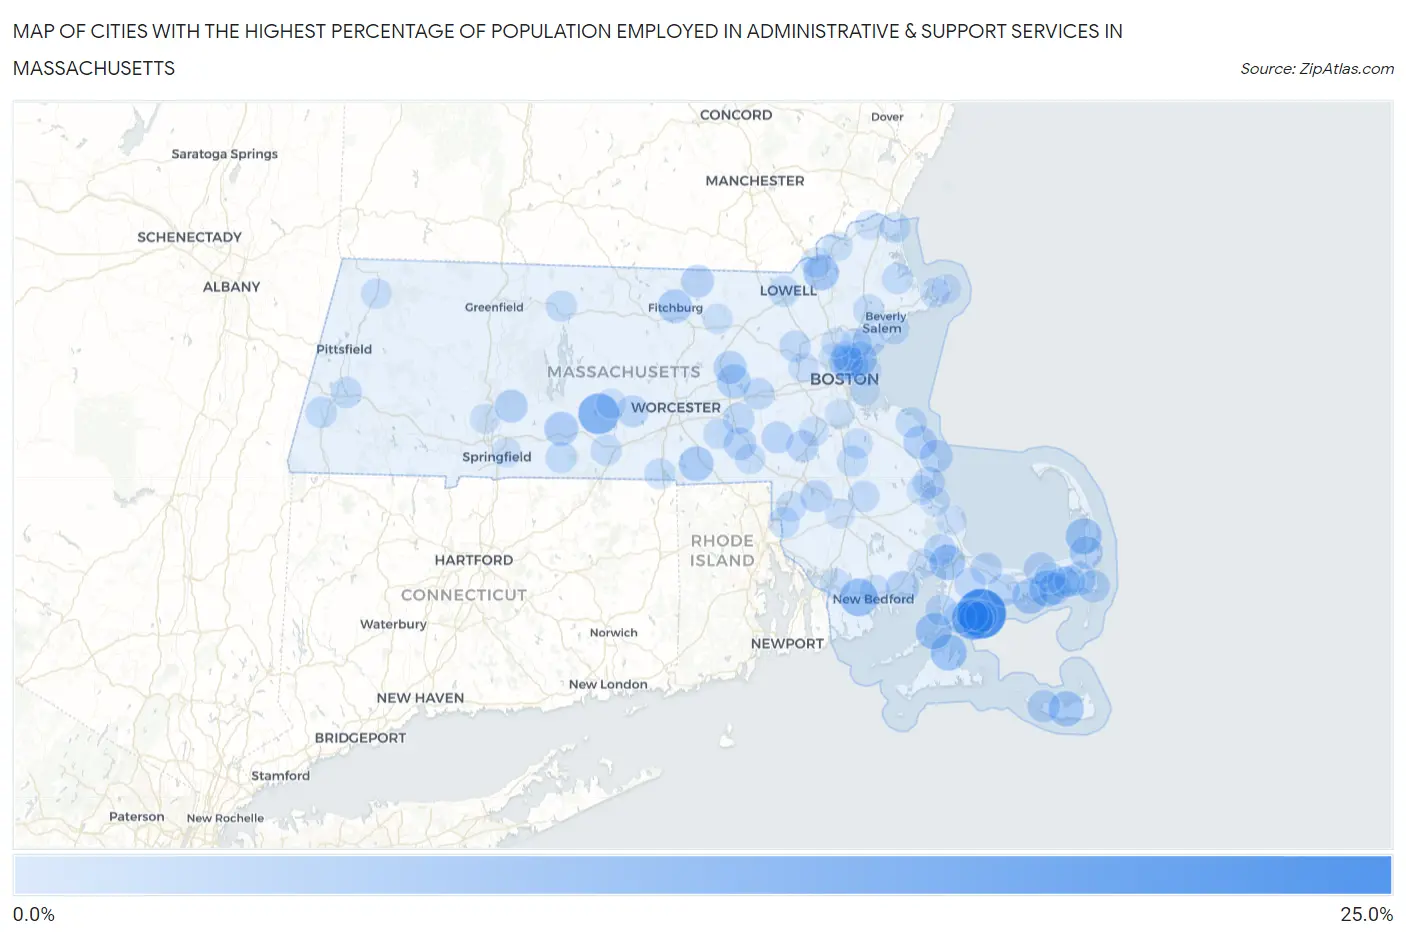
Map of Cities with the Highest Percentage of Population Employed in Administrative & Support Services in Massachusetts
0.0%
25.0%
Cities with the Highest Percentage of Population Employed in Administrative & Support Services in Massachusetts
| City | % Employed | vs State | vs National | |
| 1. | Popponesset Island | 23.1% | 3.6%(+19.4)#1 | 4.1%(+18.9)#339 |
| 2. | Monomoscoy Island | 14.7% | 3.6%(+11.1)#2 | 4.1%(+10.6)#837 |
| 3. | West Brookfield | 14.2% | 3.6%(+10.5)#3 | 4.1%(+10.0)#916 |
| 4. | Smith Mills | 11.1% | 3.6%(+7.47)#4 | 4.1%(+6.96)#1,508 |
| 5. | West Dennis | 9.8% | 3.6%(+6.12)#5 | 4.1%(+5.61)#2,007 |
| 6. | Vineyard Haven | 9.7% | 3.6%(+6.07)#6 | 4.1%(+5.56)#2,030 |
| 7. | Woods Hole | 9.6% | 3.6%(+5.99)#7 | 4.1%(+5.49)#2,057 |
| 8. | North Eastham | 9.5% | 3.6%(+5.85)#8 | 4.1%(+5.34)#2,126 |
| 9. | Buzzards Bay | 9.0% | 3.6%(+5.33)#9 | 4.1%(+4.82)#2,392 |
| 10. | Lawrence | 8.9% | 3.6%(+5.26)#10 | 4.1%(+4.76)#2,424 |
| 11. | West Yarmouth | 8.8% | 3.6%(+5.18)#11 | 4.1%(+4.68)#2,481 |
| 12. | Nantucket | 8.7% | 3.6%(+5.07)#12 | 4.1%(+4.56)#2,546 |
| 13. | East Douglas | 8.2% | 3.6%(+4.58)#13 | 4.1%(+4.08)#2,848 |
| 14. | Chelsea | 7.6% | 3.6%(+3.98)#14 | 4.1%(+3.47)#3,292 |
| 15. | Revere | 7.5% | 3.6%(+3.89)#15 | 4.1%(+3.39)#3,353 |
| 16. | Everett | 7.5% | 3.6%(+3.87)#16 | 4.1%(+3.36)#3,375 |
| 17. | Palmer Town | 7.5% | 3.6%(+3.87)#17 | 4.1%(+3.36)#3,376 |
| 18. | Fitchburg | 7.5% | 3.6%(+3.87)#18 | 4.1%(+3.36)#3,378 |
| 19. | New Seabury | 7.3% | 3.6%(+3.65)#19 | 4.1%(+3.15)#3,591 |
| 20. | Marlborough | 7.3% | 3.6%(+3.63)#20 | 4.1%(+3.13)#3,610 |
| 21. | Marshfield Hills | 7.1% | 3.6%(+3.41)#21 | 4.1%(+2.90)#3,849 |
| 22. | East Harwich | 7.0% | 3.6%(+3.39)#22 | 4.1%(+2.89)#3,868 |
| 23. | Hudson | 6.8% | 3.6%(+3.14)#23 | 4.1%(+2.64)#4,104 |
| 24. | Orleans | 6.8% | 3.6%(+3.13)#24 | 4.1%(+2.63)#4,115 |
| 25. | Ocean Bluff Brant Rock | 6.7% | 3.6%(+3.03)#25 | 4.1%(+2.53)#4,207 |
| 26. | Granby | 6.5% | 3.6%(+2.90)#26 | 4.1%(+2.40)#4,377 |
| 27. | Mattapoisett Center | 6.5% | 3.6%(+2.88)#27 | 4.1%(+2.37)#4,408 |
| 28. | Townsend | 6.4% | 3.6%(+2.71)#28 | 4.1%(+2.21)#4,614 |
| 29. | Madaket | 6.2% | 3.6%(+2.60)#29 | 4.1%(+2.10)#4,763 |
| 30. | Dennis | 6.2% | 3.6%(+2.57)#30 | 4.1%(+2.07)#4,808 |
| 31. | Milford | 6.2% | 3.6%(+2.54)#31 | 4.1%(+2.03)#4,862 |
| 32. | Chatham | 6.2% | 3.6%(+2.53)#32 | 4.1%(+2.02)#4,874 |
| 33. | Barnstable Town | 6.1% | 3.6%(+2.48)#33 | 4.1%(+1.98)#4,942 |
| 34. | Dennis Port | 6.1% | 3.6%(+2.42)#34 | 4.1%(+1.92)#5,028 |
| 35. | Cedar Crest | 5.9% | 3.6%(+2.22)#35 | 4.1%(+1.71)#5,366 |
| 36. | Norton Center | 5.8% | 3.6%(+2.15)#36 | 4.1%(+1.65)#5,460 |
| 37. | East Sandwich | 5.7% | 3.6%(+2.08)#37 | 4.1%(+1.57)#5,586 |
| 38. | White Island Shores | 5.7% | 3.6%(+2.07)#38 | 4.1%(+1.57)#5,590 |
| 39. | Walpole | 5.7% | 3.6%(+2.07)#39 | 4.1%(+1.56)#5,608 |
| 40. | Spencer | 5.7% | 3.6%(+2.06)#40 | 4.1%(+1.56)#5,613 |
| 41. | Northwest Harwich | 5.7% | 3.6%(+2.06)#41 | 4.1%(+1.55)#5,623 |
| 42. | Lynn | 5.7% | 3.6%(+2.04)#42 | 4.1%(+1.54)#5,649 |
| 43. | Millis Clicquot | 5.7% | 3.6%(+2.04)#43 | 4.1%(+1.53)#5,657 |
| 44. | South Duxbury | 5.6% | 3.6%(+1.93)#44 | 4.1%(+1.42)#5,852 |
| 45. | East Falmouth | 5.5% | 3.6%(+1.88)#45 | 4.1%(+1.37)#5,959 |
| 46. | Forestdale | 5.4% | 3.6%(+1.80)#46 | 4.1%(+1.29)#6,118 |
| 47. | West Falmouth | 5.4% | 3.6%(+1.74)#47 | 4.1%(+1.23)#6,222 |
| 48. | Popponesset | 5.4% | 3.6%(+1.74)#48 | 4.1%(+1.23)#6,224 |
| 49. | Framingham | 5.3% | 3.6%(+1.67)#49 | 4.1%(+1.17)#6,351 |
| 50. | Oak Bluffs | 5.3% | 3.6%(+1.67)#50 | 4.1%(+1.17)#6,356 |
| 51. | Hopkinton | 5.3% | 3.6%(+1.63)#51 | 4.1%(+1.13)#6,434 |
| 52. | Hanscom Afb | 5.3% | 3.6%(+1.62)#52 | 4.1%(+1.11)#6,455 |
| 53. | North Scituate | 5.2% | 3.6%(+1.51)#53 | 4.1%(+1.01)#6,693 |
| 54. | Salem | 5.1% | 3.6%(+1.50)#54 | 4.1%(+0.992)#6,733 |
| 55. | Bridgewater Town | 5.1% | 3.6%(+1.47)#55 | 4.1%(+0.969)#6,780 |
| 56. | Monson Center | 5.1% | 3.6%(+1.42)#56 | 4.1%(+0.912)#6,903 |
| 57. | Housatonic | 5.0% | 3.6%(+1.37)#57 | 4.1%(+0.863)#7,018 |
| 58. | Saugus | 5.0% | 3.6%(+1.35)#58 | 4.1%(+0.846)#7,073 |
| 59. | North Seekonk | 5.0% | 3.6%(+1.33)#59 | 4.1%(+0.823)#7,113 |
| 60. | Lowell | 5.0% | 3.6%(+1.33)#60 | 4.1%(+0.821)#7,121 |
| 61. | Lee | 4.9% | 3.6%(+1.27)#61 | 4.1%(+0.768)#7,239 |
| 62. | Orange | 4.9% | 3.6%(+1.25)#62 | 4.1%(+0.750)#7,283 |
| 63. | Danvers | 4.9% | 3.6%(+1.24)#63 | 4.1%(+0.733)#7,326 |
| 64. | Fiskdale | 4.9% | 3.6%(+1.23)#64 | 4.1%(+0.723)#7,357 |
| 65. | Brockton | 4.8% | 3.6%(+1.15)#65 | 4.1%(+0.645)#7,527 |
| 66. | Harwich Center | 4.8% | 3.6%(+1.12)#66 | 4.1%(+0.612)#7,607 |
| 67. | Ipswich | 4.8% | 3.6%(+1.10)#67 | 4.1%(+0.600)#7,655 |
| 68. | Webster | 4.7% | 3.6%(+1.09)#68 | 4.1%(+0.581)#7,700 |
| 69. | Upton | 4.7% | 3.6%(+1.08)#69 | 4.1%(+0.572)#7,724 |
| 70. | Methuen Town | 4.7% | 3.6%(+1.03)#70 | 4.1%(+0.523)#7,844 |
| 71. | Salisbury | 4.7% | 3.6%(+1.01)#71 | 4.1%(+0.509)#7,889 |
| 72. | South Dennis | 4.6% | 3.6%(+0.965)#72 | 4.1%(+0.460)#8,016 |
| 73. | Attleboro | 4.5% | 3.6%(+0.838)#73 | 4.1%(+0.333)#8,348 |
| 74. | Fall River | 4.5% | 3.6%(+0.835)#74 | 4.1%(+0.331)#8,354 |
| 75. | Holbrook | 4.4% | 3.6%(+0.790)#75 | 4.1%(+0.286)#8,494 |
| 76. | Bellingham | 4.4% | 3.6%(+0.768)#76 | 4.1%(+0.263)#8,546 |
| 77. | Seabrook | 4.4% | 3.6%(+0.726)#77 | 4.1%(+0.222)#8,672 |
| 78. | Malden | 4.4% | 3.6%(+0.710)#78 | 4.1%(+0.206)#8,720 |
| 79. | Winthrop Town | 4.3% | 3.6%(+0.700)#79 | 4.1%(+0.196)#8,770 |
| 80. | New Bedford | 4.3% | 3.6%(+0.688)#80 | 4.1%(+0.183)#8,805 |
| 81. | Adams | 4.3% | 3.6%(+0.643)#81 | 4.1%(+0.138)#8,961 |
| 82. | The Pinehills | 4.2% | 3.6%(+0.562)#82 | 4.1%(+0.057)#9,206 |
| 83. | Waltham | 4.1% | 3.6%(+0.484)#83 | 4.1%(-0.020)#9,442 |
| 84. | Wareham Center | 4.1% | 3.6%(+0.457)#84 | 4.1%(-0.047)#9,508 |
| 85. | North Brookfield | 4.0% | 3.6%(+0.349)#85 | 4.1%(-0.156)#9,881 |
| 86. | Gloucester | 4.0% | 3.6%(+0.340)#86 | 4.1%(-0.164)#9,909 |
| 87. | Norwood | 4.0% | 3.6%(+0.321)#87 | 4.1%(-0.183)#9,967 |
| 88. | Haverhill | 4.0% | 3.6%(+0.315)#88 | 4.1%(-0.190)#9,992 |
| 89. | Devens | 3.9% | 3.6%(+0.280)#89 | 4.1%(-0.224)#10,092 |
| 90. | Springfield | 3.9% | 3.6%(+0.224)#90 | 4.1%(-0.281)#10,283 |
| 91. | Milton | 3.8% | 3.6%(+0.172)#91 | 4.1%(-0.332)#10,456 |
| 92. | Medford | 3.8% | 3.6%(+0.160)#92 | 4.1%(-0.345)#10,493 |
| 93. | Plymouth | 3.8% | 3.6%(+0.158)#93 | 4.1%(-0.347)#10,500 |
| 94. | Taunton | 3.8% | 3.6%(+0.153)#94 | 4.1%(-0.352)#10,515 |
| 95. | Stoneham | 3.8% | 3.6%(+0.150)#95 | 4.1%(-0.355)#10,534 |
| 96. | Boston | 3.8% | 3.6%(+0.148)#96 | 4.1%(-0.357)#10,541 |
| 97. | Amesbury Town | 3.8% | 3.6%(+0.145)#97 | 4.1%(-0.359)#10,551 |
| 98. | Rockport | 3.8% | 3.6%(+0.123)#98 | 4.1%(-0.382)#10,639 |
| 99. | Holyoke | 3.8% | 3.6%(+0.121)#99 | 4.1%(-0.383)#10,643 |
| 100. | Kingston | 3.8% | 3.6%(+0.118)#100 | 4.1%(-0.387)#10,653 |
Common Questions
What are the Top 10 Cities with the Highest Percentage of Population Employed in Administrative & Support Services in Massachusetts?
Top 10 Cities with the Highest Percentage of Population Employed in Administrative & Support Services in Massachusetts are:
#1
23.1%
#2
14.7%
#3
14.2%
#4
11.1%
#5
9.8%
#6
9.7%
#7
9.6%
#8
9.5%
#9
9.0%
#10
8.9%
What city has the Highest Percentage of Population Employed in Administrative & Support Services in Massachusetts?
Popponesset Island has the Highest Percentage of Population Employed in Administrative & Support Services in Massachusetts with 23.1%.
What is the Percentage of Population Employed in Administrative & Support Services in the State of Massachusetts?
Percentage of Population Employed in Administrative & Support Services in Massachusetts is 3.6%.
What is the Percentage of Population Employed in Administrative & Support Services in the United States?
Percentage of Population Employed in Administrative & Support Services in the United States is 4.1%.