Cities with the Highest Percentage of Population Employed in Administrative & Support Services in Iowa
RELATED REPORTS & OPTIONS
Administrative & Support Services
Iowa
Compare Cities
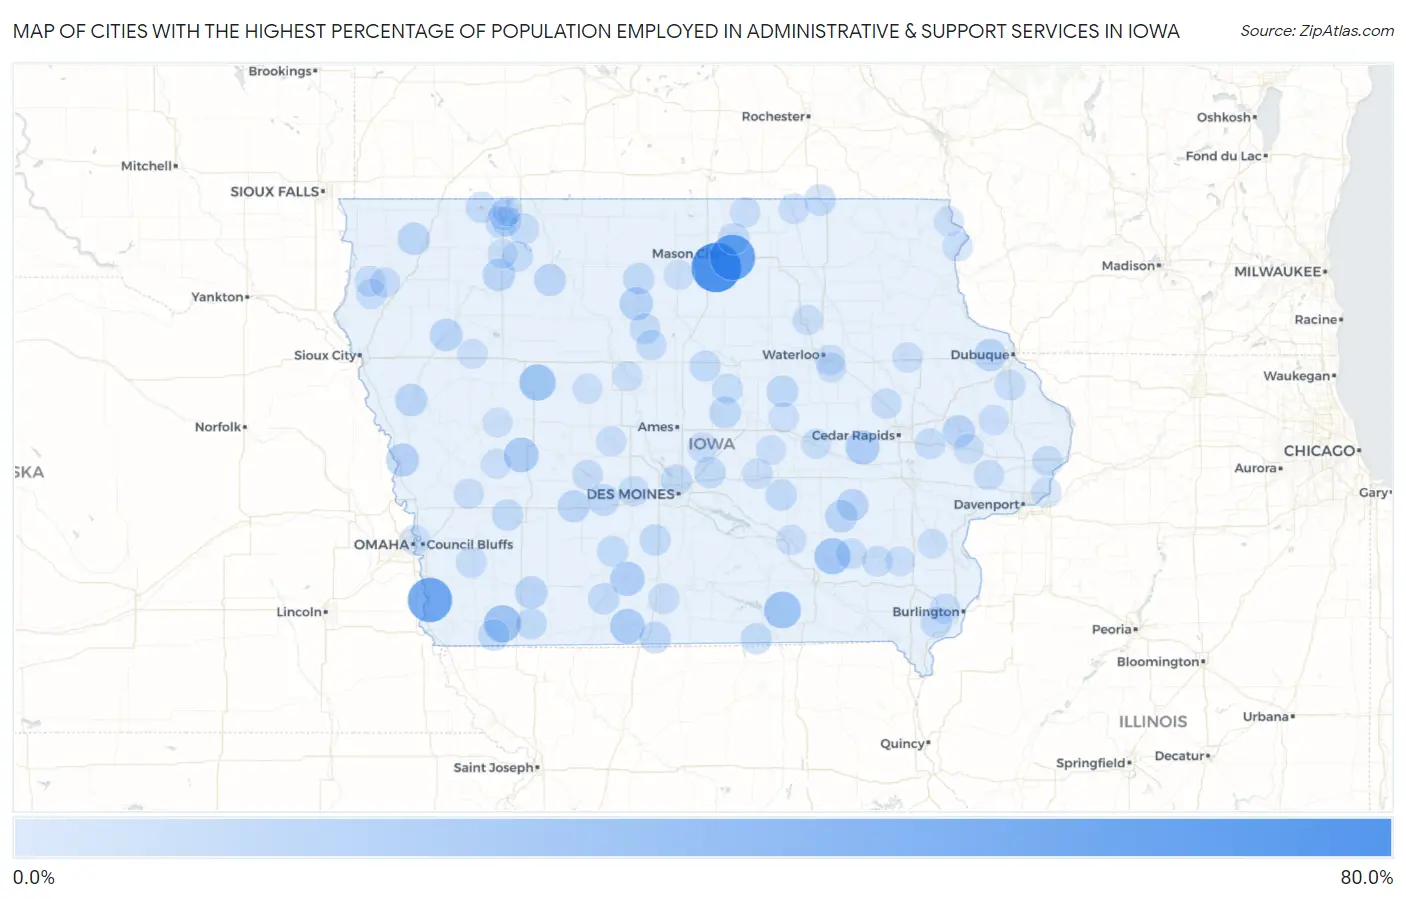
Map of Cities with the Highest Percentage of Population Employed in Administrative & Support Services in Iowa
0.0%
80.0%
Cities with the Highest Percentage of Population Employed in Administrative & Support Services in Iowa
| City | % Employed | vs State | vs National | |
| 1. | Burchinal | 66.7% | 3.0%(+63.6)#1 | 4.1%(+62.5)#30 |
| 2. | Portland | 53.3% | 3.0%(+50.3)#2 | 4.1%(+49.2)#46 |
| 3. | Bartlett | 50.0% | 3.0%(+47.0)#3 | 4.1%(+45.9)#61 |
| 4. | Yorktown | 27.3% | 3.0%(+24.2)#4 | 4.1%(+23.1)#235 |
| 5. | Unionville | 26.4% | 3.0%(+23.4)#5 | 4.1%(+22.3)#251 |
| 6. | Yetter | 25.0% | 3.0%(+22.0)#6 | 4.1%(+20.9)#291 |
| 7. | Martinsburg | 24.5% | 3.0%(+21.5)#7 | 4.1%(+20.4)#297 |
| 8. | Kellerton | 20.2% | 3.0%(+17.1)#8 | 4.1%(+16.0)#432 |
| 9. | Gray | 20.0% | 3.0%(+17.0)#9 | 4.1%(+15.9)#438 |
| 10. | Thayer | 18.8% | 3.0%(+15.7)#10 | 4.1%(+14.6)#499 |
| 11. | Augusta | 18.5% | 3.0%(+15.5)#11 | 4.1%(+14.4)#505 |
| 12. | Watkins | 18.2% | 3.0%(+15.2)#12 | 4.1%(+14.0)#537 |
| 13. | Little Sioux | 15.7% | 3.0%(+12.7)#13 | 4.1%(+11.5)#711 |
| 14. | Renwick | 15.7% | 3.0%(+12.6)#14 | 4.1%(+11.5)#715 |
| 15. | Nodaway | 13.6% | 3.0%(+10.6)#15 | 4.1%(+9.49)#1,011 |
| 16. | Quimby | 13.6% | 3.0%(+10.5)#16 | 4.1%(+9.41)#1,027 |
| 17. | Rossie | 13.3% | 3.0%(+10.3)#17 | 4.1%(+9.18)#1,058 |
| 18. | Rodney | 13.3% | 3.0%(+10.3)#18 | 4.1%(+9.18)#1,061 |
| 19. | Matlock | 13.2% | 3.0%(+10.2)#19 | 4.1%(+9.04)#1,082 |
| 20. | Olin | 13.1% | 3.0%(+10.1)#20 | 4.1%(+8.93)#1,102 |
| 21. | Graf | 13.0% | 3.0%(+10.0)#21 | 4.1%(+8.89)#1,116 |
| 22. | Webster | 12.9% | 3.0%(+9.87)#22 | 4.1%(+8.75)#1,138 |
| 23. | Casey | 12.7% | 3.0%(+9.69)#23 | 4.1%(+8.57)#1,171 |
| 24. | Curlew | 12.5% | 3.0%(+9.47)#24 | 4.1%(+8.35)#1,212 |
| 25. | North English | 11.9% | 3.0%(+8.86)#25 | 4.1%(+7.74)#1,338 |
| 26. | St Anthony | 11.4% | 3.0%(+8.34)#26 | 4.1%(+7.21)#1,455 |
| 27. | Diamondhead Lake | 11.0% | 3.0%(+8.02)#27 | 4.1%(+6.90)#1,540 |
| 28. | Lincoln | 10.9% | 3.0%(+7.88)#28 | 4.1%(+6.76)#1,582 |
| 29. | Davis City | 10.9% | 3.0%(+7.86)#29 | 4.1%(+6.74)#1,585 |
| 30. | Plymouth | 10.7% | 3.0%(+7.65)#30 | 4.1%(+6.53)#1,639 |
| 31. | West Okoboji | 10.6% | 3.0%(+7.61)#31 | 4.1%(+6.49)#1,651 |
| 32. | Marne | 10.6% | 3.0%(+7.61)#32 | 4.1%(+6.49)#1,652 |
| 33. | Valeria | 10.5% | 3.0%(+7.50)#33 | 4.1%(+6.38)#1,694 |
| 34. | Chester | 10.4% | 3.0%(+7.42)#34 | 4.1%(+6.30)#1,722 |
| 35. | Searsboro | 10.4% | 3.0%(+7.42)#35 | 4.1%(+6.30)#1,723 |
| 36. | Shannon City | 10.4% | 3.0%(+7.39)#36 | 4.1%(+6.27)#1,736 |
| 37. | Denmark | 10.3% | 3.0%(+7.27)#37 | 4.1%(+6.14)#1,783 |
| 38. | Coin | 10.3% | 3.0%(+7.23)#38 | 4.1%(+6.11)#1,794 |
| 39. | Corwith | 10.2% | 3.0%(+7.18)#39 | 4.1%(+6.05)#1,814 |
| 40. | New Market | 9.9% | 3.0%(+6.87)#40 | 4.1%(+5.75)#1,950 |
| 41. | St Charles | 9.8% | 3.0%(+6.80)#41 | 4.1%(+5.68)#1,979 |
| 42. | Cincinnati | 9.8% | 3.0%(+6.78)#42 | 4.1%(+5.65)#1,990 |
| 43. | Buckeye | 9.8% | 3.0%(+6.73)#43 | 4.1%(+5.61)#2,017 |
| 44. | Lake Park | 9.6% | 3.0%(+6.52)#44 | 4.1%(+5.40)#2,098 |
| 45. | Saylorville | 9.3% | 3.0%(+6.29)#45 | 4.1%(+5.17)#2,203 |
| 46. | Macksburg | 9.1% | 3.0%(+6.06)#46 | 4.1%(+4.94)#2,328 |
| 47. | Eagle Grove | 9.0% | 3.0%(+6.00)#47 | 4.1%(+4.88)#2,364 |
| 48. | Terril | 8.8% | 3.0%(+5.76)#48 | 4.1%(+4.64)#2,498 |
| 49. | Ollie | 8.8% | 3.0%(+5.74)#49 | 4.1%(+4.62)#2,508 |
| 50. | Henderson | 8.7% | 3.0%(+5.67)#50 | 4.1%(+4.55)#2,555 |
| 51. | Zwingle | 8.7% | 3.0%(+5.67)#51 | 4.1%(+4.55)#2,560 |
| 52. | Ireton | 8.7% | 3.0%(+5.65)#52 | 4.1%(+4.53)#2,570 |
| 53. | Moscow | 8.6% | 3.0%(+5.61)#53 | 4.1%(+4.49)#2,592 |
| 54. | Lisbon | 8.6% | 3.0%(+5.56)#54 | 4.1%(+4.44)#2,625 |
| 55. | Weldon | 8.6% | 3.0%(+5.54)#55 | 4.1%(+4.42)#2,638 |
| 56. | Wever | 8.3% | 3.0%(+5.30)#56 | 4.1%(+4.18)#2,789 |
| 57. | Dickens | 8.3% | 3.0%(+5.30)#57 | 4.1%(+4.18)#2,792 |
| 58. | Low Moor | 8.1% | 3.0%(+5.04)#58 | 4.1%(+3.91)#2,953 |
| 59. | Pleasant Plain | 7.9% | 3.0%(+4.87)#59 | 4.1%(+3.74)#3,074 |
| 60. | Center Point | 7.9% | 3.0%(+4.86)#60 | 4.1%(+3.74)#3,075 |
| 61. | Adel | 7.9% | 3.0%(+4.84)#61 | 4.1%(+3.72)#3,091 |
| 62. | Woolstock | 7.9% | 3.0%(+4.84)#62 | 4.1%(+3.72)#3,101 |
| 63. | Lake Panorama | 7.8% | 3.0%(+4.81)#63 | 4.1%(+3.69)#3,115 |
| 64. | Middletown | 7.8% | 3.0%(+4.76)#64 | 4.1%(+3.63)#3,155 |
| 65. | Maxwell | 7.8% | 3.0%(+4.74)#65 | 4.1%(+3.62)#3,169 |
| 66. | Kellogg | 7.7% | 3.0%(+4.69)#66 | 4.1%(+3.57)#3,204 |
| 67. | New Liberty | 7.6% | 3.0%(+4.58)#67 | 4.1%(+3.46)#3,302 |
| 68. | Le Claire | 7.5% | 3.0%(+4.48)#68 | 4.1%(+3.36)#3,381 |
| 69. | University Park | 7.5% | 3.0%(+4.47)#69 | 4.1%(+3.35)#3,392 |
| 70. | Carter Lake | 7.5% | 3.0%(+4.44)#70 | 4.1%(+3.32)#3,424 |
| 71. | Okoboji | 7.4% | 3.0%(+4.39)#71 | 4.1%(+3.27)#3,480 |
| 72. | Tennant | 7.4% | 3.0%(+4.38)#72 | 4.1%(+3.26)#3,495 |
| 73. | Evansdale | 7.4% | 3.0%(+4.36)#73 | 4.1%(+3.24)#3,512 |
| 74. | Mcintire | 7.3% | 3.0%(+4.29)#74 | 4.1%(+3.17)#3,572 |
| 75. | Masonville | 7.3% | 3.0%(+4.29)#75 | 4.1%(+3.17)#3,573 |
| 76. | Craig | 7.3% | 3.0%(+4.29)#76 | 4.1%(+3.17)#3,575 |
| 77. | Waverly | 7.2% | 3.0%(+4.17)#77 | 4.1%(+3.05)#3,683 |
| 78. | Rippey | 7.1% | 3.0%(+4.11)#78 | 4.1%(+2.99)#3,754 |
| 79. | Baldwin | 7.1% | 3.0%(+4.11)#79 | 4.1%(+2.99)#3,758 |
| 80. | Carpenter | 7.1% | 3.0%(+4.11)#80 | 4.1%(+2.99)#3,763 |
| 81. | Maurice | 7.1% | 3.0%(+4.06)#81 | 4.1%(+2.94)#3,801 |
| 82. | Clarence | 7.1% | 3.0%(+4.05)#82 | 4.1%(+2.92)#3,819 |
| 83. | New Providence | 7.1% | 3.0%(+4.04)#83 | 4.1%(+2.92)#3,825 |
| 84. | Harpers Ferry | 6.9% | 3.0%(+3.83)#84 | 4.1%(+2.71)#4,032 |
| 85. | Chelsea | 6.8% | 3.0%(+3.79)#85 | 4.1%(+2.67)#4,075 |
| 86. | Arnolds Park | 6.8% | 3.0%(+3.74)#86 | 4.1%(+2.62)#4,125 |
| 87. | Lansing | 6.7% | 3.0%(+3.68)#87 | 4.1%(+2.56)#4,186 |
| 88. | Galva | 6.6% | 3.0%(+3.61)#88 | 4.1%(+2.49)#4,280 |
| 89. | Irwin | 6.6% | 3.0%(+3.60)#89 | 4.1%(+2.48)#4,282 |
| 90. | Klemme | 6.6% | 3.0%(+3.56)#90 | 4.1%(+2.44)#4,332 |
| 91. | Garwin | 6.5% | 3.0%(+3.47)#91 | 4.1%(+2.35)#4,447 |
| 92. | Spencer | 6.5% | 3.0%(+3.43)#92 | 4.1%(+2.31)#4,492 |
| 93. | Farnhamville | 6.4% | 3.0%(+3.39)#93 | 4.1%(+2.27)#4,552 |
| 94. | Wayland | 6.4% | 3.0%(+3.36)#94 | 4.1%(+2.24)#4,574 |
| 95. | Lehigh | 6.3% | 3.0%(+3.31)#95 | 4.1%(+2.19)#4,638 |
| 96. | Spirit Lake | 6.3% | 3.0%(+3.30)#96 | 4.1%(+2.18)#4,663 |
| 97. | Washburn | 6.3% | 3.0%(+3.27)#97 | 4.1%(+2.14)#4,703 |
| 98. | Columbus City | 6.3% | 3.0%(+3.27)#98 | 4.1%(+2.14)#4,704 |
| 99. | Gilman | 6.3% | 3.0%(+3.26)#99 | 4.1%(+2.14)#4,707 |
| 100. | Vail | 6.3% | 3.0%(+3.25)#100 | 4.1%(+2.13)#4,727 |
Common Questions
What are the Top 10 Cities with the Highest Percentage of Population Employed in Administrative & Support Services in Iowa?
Top 10 Cities with the Highest Percentage of Population Employed in Administrative & Support Services in Iowa are:
#1
66.7%
#2
53.3%
#3
50.0%
#4
27.3%
#5
26.4%
#6
25.0%
#7
24.5%
#8
20.2%
#9
20.0%
#10
18.8%
What city has the Highest Percentage of Population Employed in Administrative & Support Services in Iowa?
Burchinal has the Highest Percentage of Population Employed in Administrative & Support Services in Iowa with 66.7%.
What is the Percentage of Population Employed in Administrative & Support Services in the State of Iowa?
Percentage of Population Employed in Administrative & Support Services in Iowa is 3.0%.
What is the Percentage of Population Employed in Administrative & Support Services in the United States?
Percentage of Population Employed in Administrative & Support Services in the United States is 4.1%.