Zip Codes with the Highest Percentage of Population Employed in Administrative & Support Services in Butler, PA
RELATED REPORTS & OPTIONS
Administrative & Support Services
Butler
Compare Zip Codes
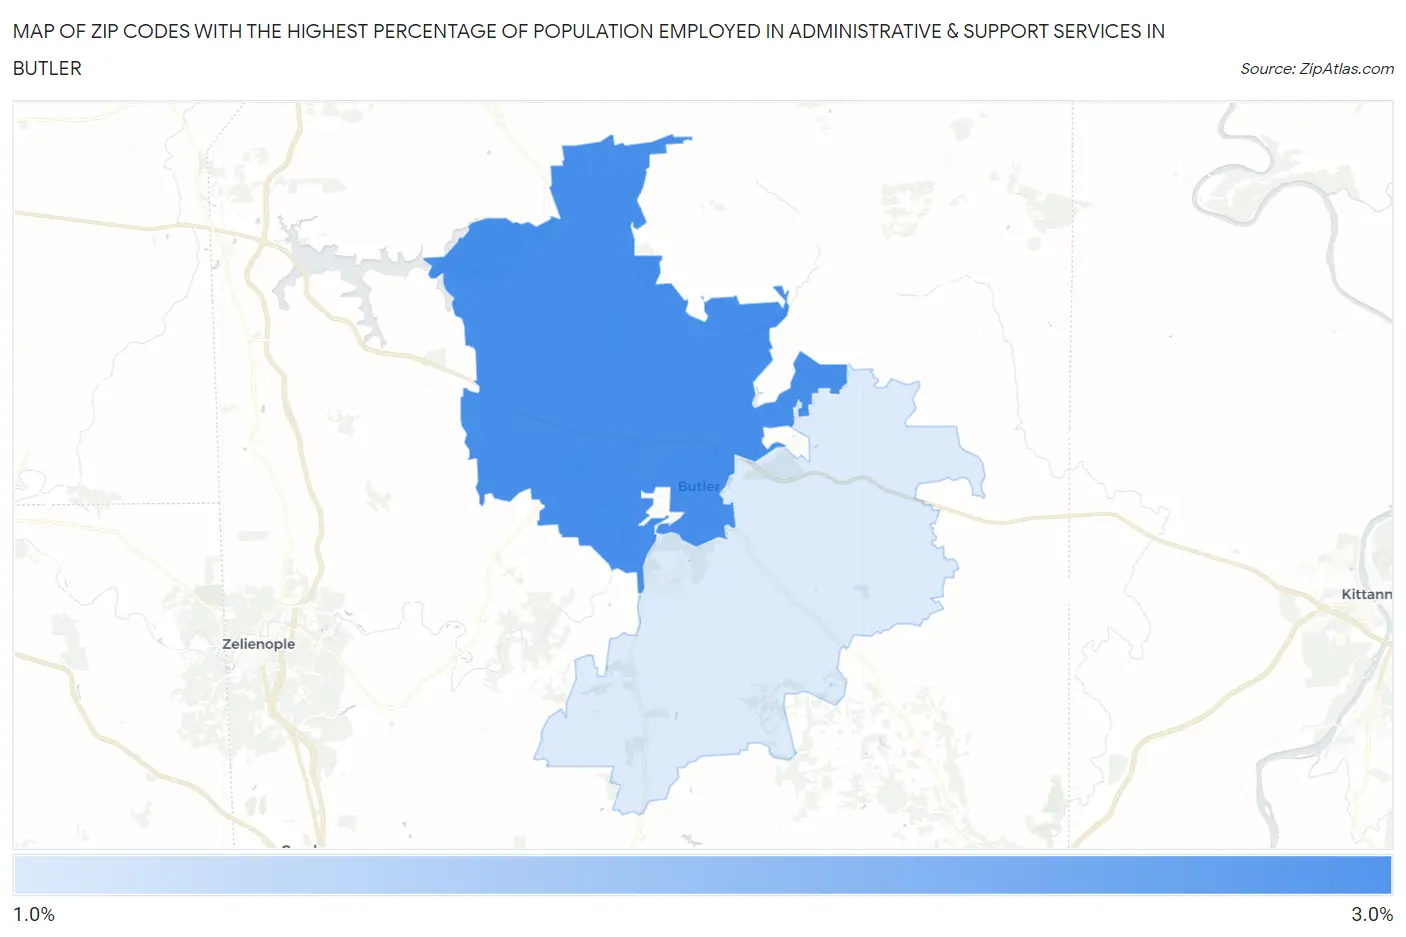
Map of Zip Codes with the Highest Percentage of Population Employed in Administrative & Support Services in Butler
1.5%
2.9%
Zip Codes with the Highest Percentage of Population Employed in Administrative & Support Services in Butler, PA
| Zip Code | % Employed | vs State | vs National | |
| 1. | 16001 | 2.9% | 3.6%(-0.691)#838 | 4.1%(-1.26)#16,030 |
| 2. | 16002 | 1.5% | 3.6%(-2.08)#1,252 | 4.1%(-2.65)#22,741 |
1
Common Questions
What are the Top Zip Codes with the Highest Percentage of Population Employed in Administrative & Support Services in Butler, PA?
Top Zip Codes with the Highest Percentage of Population Employed in Administrative & Support Services in Butler, PA are:
What zip code has the Highest Percentage of Population Employed in Administrative & Support Services in Butler, PA?
16001 has the Highest Percentage of Population Employed in Administrative & Support Services in Butler, PA with 2.9%.
What is the Percentage of Population Employed in Administrative & Support Services in Butler, PA?
Percentage of Population Employed in Administrative & Support Services in Butler is 2.6%.
What is the Percentage of Population Employed in Administrative & Support Services in Pennsylvania?
Percentage of Population Employed in Administrative & Support Services in Pennsylvania is 3.6%.
What is the Percentage of Population Employed in Administrative & Support Services in the United States?
Percentage of Population Employed in Administrative & Support Services in the United States is 4.1%.