Cities with the Highest Percentage of Population Employed in Administrative & Support Services in Ohio
RELATED REPORTS & OPTIONS
Administrative & Support Services
Ohio
Compare Cities
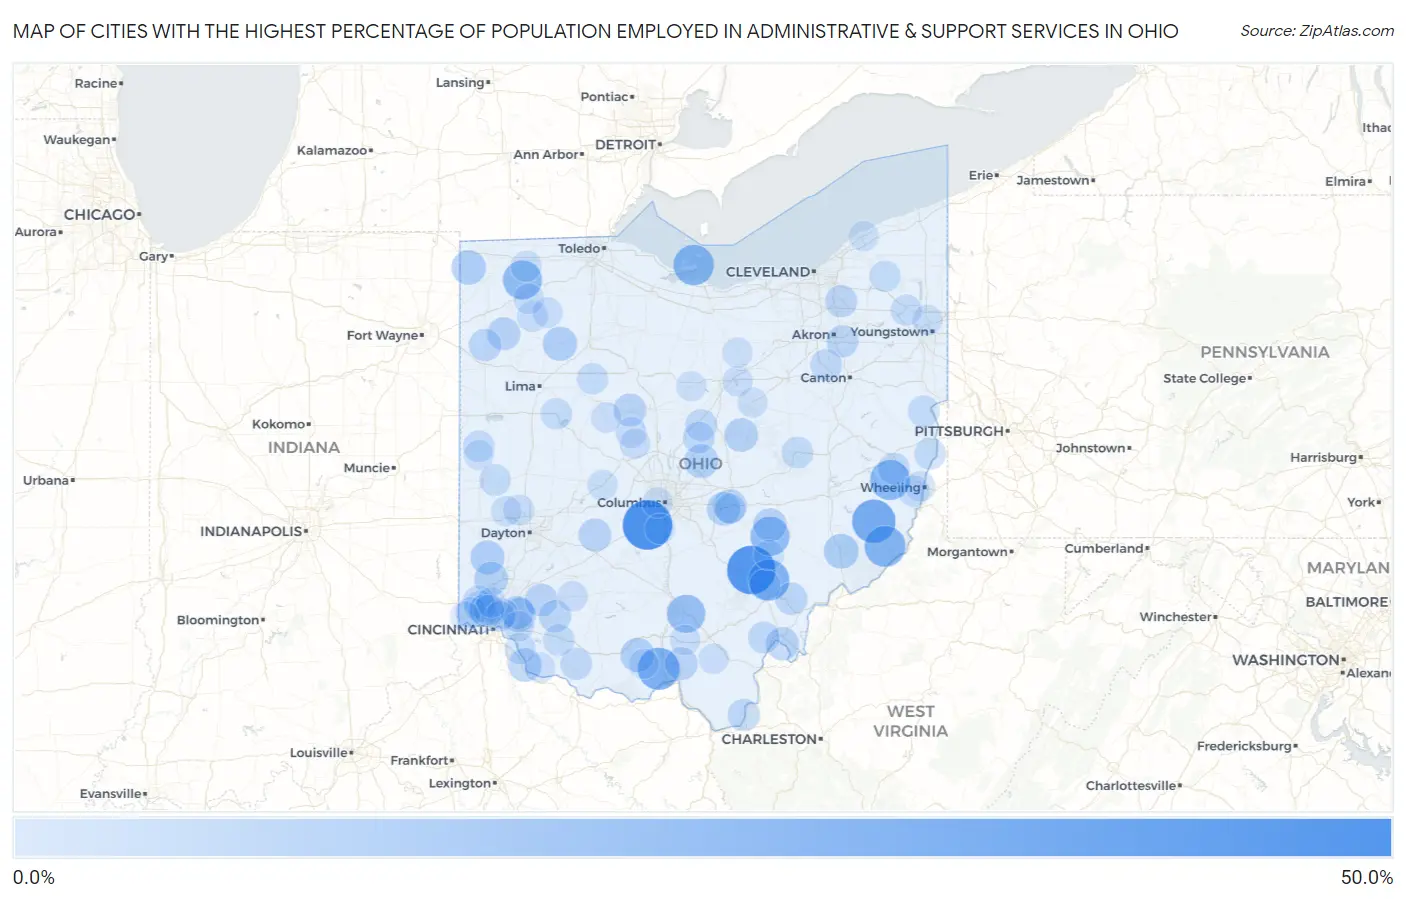
Map of Cities with the Highest Percentage of Population Employed in Administrative & Support Services in Ohio
0.0%
50.0%
Cities with the Highest Percentage of Population Employed in Administrative & Support Services in Ohio
| City | % Employed | vs State | vs National | |
| 1. | Orient | 45.8% | 3.7%(+42.1)#1 | 4.1%(+41.7)#74 |
| 2. | Carbon Hill | 43.5% | 3.7%(+39.8)#2 | 4.1%(+39.3)#83 |
| 3. | Miltonsburg | 33.3% | 3.7%(+29.6)#3 | 4.1%(+29.2)#143 |
| 4. | Mcdermott | 30.8% | 3.7%(+27.1)#4 | 4.1%(+26.7)#172 |
| 5. | Millfield | 29.2% | 3.7%(+25.5)#5 | 4.1%(+25.1)#200 |
| 6. | Antioch | 28.6% | 3.7%(+24.8)#6 | 4.1%(+24.4)#215 |
| 7. | Lakeside | 27.8% | 3.7%(+24.1)#7 | 4.1%(+23.7)#226 |
| 8. | Lafferty | 26.9% | 3.7%(+23.2)#8 | 4.1%(+22.8)#240 |
| 9. | Ridgeville Corners | 25.0% | 3.7%(+21.3)#9 | 4.1%(+20.9)#275 |
| 10. | Rose Farm | 25.0% | 3.7%(+21.3)#10 | 4.1%(+20.9)#281 |
| 11. | Brandt | 24.1% | 3.7%(+20.3)#11 | 4.1%(+19.9)#308 |
| 12. | Ai | 23.7% | 3.7%(+20.0)#12 | 4.1%(+19.5)#320 |
| 13. | Richmond Dale | 23.1% | 3.7%(+19.4)#13 | 4.1%(+18.9)#337 |
| 14. | New Haven Cdp Hamilton County | 21.3% | 3.7%(+17.6)#14 | 4.1%(+17.1)#399 |
| 15. | Macksburg | 16.7% | 3.7%(+12.9)#15 | 4.1%(+12.5)#633 |
| 16. | West Logan | 16.4% | 3.7%(+12.6)#16 | 4.1%(+12.2)#657 |
| 17. | Blakeslee | 16.0% | 3.7%(+12.3)#17 | 4.1%(+11.9)#686 |
| 18. | Skyline Acres | 15.8% | 3.7%(+12.0)#18 | 4.1%(+11.6)#704 |
| 19. | Gilboa | 15.5% | 3.7%(+11.8)#19 | 4.1%(+11.4)#731 |
| 20. | Camp Dennison | 15.5% | 3.7%(+11.7)#20 | 4.1%(+11.3)#739 |
| 21. | Rarden | 15.4% | 3.7%(+11.7)#21 | 4.1%(+11.2)#756 |
| 22. | West Elkton | 15.3% | 3.7%(+11.5)#22 | 4.1%(+11.1)#768 |
| 23. | Hartford Croton | 15.1% | 3.7%(+11.4)#23 | 4.1%(+10.9)#783 |
| 24. | Williamsdale | 14.9% | 3.7%(+11.2)#24 | 4.1%(+10.7)#813 |
| 25. | Harbor Hills | 14.6% | 3.7%(+10.9)#25 | 4.1%(+10.4)#851 |
| 26. | Fairfield Beach | 14.6% | 3.7%(+10.9)#26 | 4.1%(+10.4)#855 |
| 27. | Howard | 14.5% | 3.7%(+10.8)#27 | 4.1%(+10.4)#859 |
| 28. | Moscow | 14.0% | 3.7%(+10.3)#28 | 4.1%(+9.85)#944 |
| 29. | Roseville | 14.0% | 3.7%(+10.2)#29 | 4.1%(+9.80)#949 |
| 30. | Syracuse | 13.8% | 3.7%(+10.1)#30 | 4.1%(+9.68)#968 |
| 31. | Melrose | 13.5% | 3.7%(+9.77)#31 | 4.1%(+9.34)#1,033 |
| 32. | Miamiville | 13.5% | 3.7%(+9.77)#32 | 4.1%(+9.34)#1,034 |
| 33. | South Solon | 13.3% | 3.7%(+9.57)#33 | 4.1%(+9.14)#1,065 |
| 34. | Minford | 13.0% | 3.7%(+9.28)#34 | 4.1%(+8.85)#1,120 |
| 35. | New Bloomington | 12.9% | 3.7%(+9.18)#35 | 4.1%(+8.75)#1,135 |
| 36. | Butlerville | 12.8% | 3.7%(+9.04)#36 | 4.1%(+8.62)#1,164 |
| 37. | North Industry | 12.7% | 3.7%(+8.99)#37 | 4.1%(+8.57)#1,170 |
| 38. | Haviland | 12.3% | 3.7%(+8.62)#38 | 4.1%(+8.20)#1,235 |
| 39. | Massieville | 12.3% | 3.7%(+8.55)#39 | 4.1%(+8.12)#1,251 |
| 40. | Stewart | 12.1% | 3.7%(+8.42)#40 | 4.1%(+7.99)#1,279 |
| 41. | Lake Lorelei | 12.1% | 3.7%(+8.33)#41 | 4.1%(+7.90)#1,300 |
| 42. | Sawyerwood | 11.9% | 3.7%(+8.15)#42 | 4.1%(+7.72)#1,342 |
| 43. | Twinsburg Heights | 11.7% | 3.7%(+7.99)#43 | 4.1%(+7.57)#1,377 |
| 44. | Athalia | 11.6% | 3.7%(+7.85)#44 | 4.1%(+7.42)#1,410 |
| 45. | Chesterville | 11.1% | 3.7%(+7.39)#45 | 4.1%(+6.96)#1,516 |
| 46. | Russellville | 11.1% | 3.7%(+7.36)#46 | 4.1%(+6.93)#1,533 |
| 47. | New Athens | 11.0% | 3.7%(+7.31)#47 | 4.1%(+6.88)#1,546 |
| 48. | Sparta | 11.0% | 3.7%(+7.23)#48 | 4.1%(+6.81)#1,564 |
| 49. | Rutland | 10.9% | 3.7%(+7.16)#49 | 4.1%(+6.73)#1,590 |
| 50. | Canal Fulton | 10.8% | 3.7%(+7.12)#50 | 4.1%(+6.70)#1,602 |
| 51. | Irondale | 10.8% | 3.7%(+7.06)#51 | 4.1%(+6.63)#1,619 |
| 52. | Dunlap | 10.7% | 3.7%(+7.01)#52 | 4.1%(+6.58)#1,630 |
| 53. | Mount Orab | 10.6% | 3.7%(+6.89)#53 | 4.1%(+6.46)#1,662 |
| 54. | Canal Lewisville | 10.5% | 3.7%(+6.80)#54 | 4.1%(+6.38)#1,684 |
| 55. | New Alexandria | 10.5% | 3.7%(+6.80)#55 | 4.1%(+6.38)#1,686 |
| 56. | Dry Ridge | 10.5% | 3.7%(+6.75)#56 | 4.1%(+6.32)#1,707 |
| 57. | Gettysburg | 10.3% | 3.7%(+6.59)#57 | 4.1%(+6.16)#1,776 |
| 58. | New Weston | 10.3% | 3.7%(+6.53)#58 | 4.1%(+6.11)#1,800 |
| 59. | Leavittsburg | 10.2% | 3.7%(+6.45)#59 | 4.1%(+6.03)#1,825 |
| 60. | Dunkirk | 10.1% | 3.7%(+6.38)#60 | 4.1%(+5.95)#1,856 |
| 61. | New Hampshire | 10.0% | 3.7%(+6.28)#61 | 4.1%(+5.85)#1,899 |
| 62. | Chauncey | 10.0% | 3.7%(+6.25)#62 | 4.1%(+5.82)#1,927 |
| 63. | New Richmond | 9.8% | 3.7%(+6.07)#63 | 4.1%(+5.64)#1,995 |
| 64. | Middlefield | 9.8% | 3.7%(+6.06)#64 | 4.1%(+5.63)#1,997 |
| 65. | Neffs | 9.8% | 3.7%(+6.03)#65 | 4.1%(+5.61)#2,010 |
| 66. | Miamitown | 9.7% | 3.7%(+5.98)#66 | 4.1%(+5.56)#2,032 |
| 67. | Pettisville | 9.5% | 3.7%(+5.82)#67 | 4.1%(+5.39)#2,102 |
| 68. | New Bavaria | 9.4% | 3.7%(+5.65)#68 | 4.1%(+5.23)#2,185 |
| 69. | Richwood | 9.3% | 3.7%(+5.56)#69 | 4.1%(+5.13)#2,220 |
| 70. | Union | 9.2% | 3.7%(+5.47)#70 | 4.1%(+5.04)#2,268 |
| 71. | Florida | 9.2% | 3.7%(+5.44)#71 | 4.1%(+5.01)#2,282 |
| 72. | Groesbeck | 9.1% | 3.7%(+5.34)#72 | 4.1%(+4.92)#2,341 |
| 73. | Brookside | 8.8% | 3.7%(+5.08)#73 | 4.1%(+4.66)#2,489 |
| 74. | Amberley | 8.8% | 3.7%(+5.03)#74 | 4.1%(+4.61)#2,517 |
| 75. | Magnetic Springs | 8.7% | 3.7%(+5.03)#75 | 4.1%(+4.60)#2,526 |
| 76. | Mount Victory | 8.7% | 3.7%(+5.01)#76 | 4.1%(+4.59)#2,533 |
| 77. | Martinsville | 8.7% | 3.7%(+4.97)#77 | 4.1%(+4.55)#2,552 |
| 78. | Golf Manor | 8.7% | 3.7%(+4.93)#78 | 4.1%(+4.50)#2,587 |
| 79. | Mechanicsburg | 8.6% | 3.7%(+4.93)#79 | 4.1%(+4.50)#2,588 |
| 80. | Beaver | 8.6% | 3.7%(+4.91)#80 | 4.1%(+4.48)#2,599 |
| 81. | Valleyview | 8.6% | 3.7%(+4.90)#81 | 4.1%(+4.48)#2,603 |
| 82. | Hamler | 8.6% | 3.7%(+4.84)#82 | 4.1%(+4.41)#2,643 |
| 83. | Mifflin | 8.5% | 3.7%(+4.81)#83 | 4.1%(+4.39)#2,661 |
| 84. | Forest Park | 8.5% | 3.7%(+4.80)#84 | 4.1%(+4.37)#2,668 |
| 85. | Mount Healthy | 8.5% | 3.7%(+4.77)#85 | 4.1%(+4.35)#2,682 |
| 86. | Felicity | 8.5% | 3.7%(+4.77)#86 | 4.1%(+4.35)#2,683 |
| 87. | Phillipsburg | 8.5% | 3.7%(+4.75)#87 | 4.1%(+4.32)#2,694 |
| 88. | Oak Hill | 8.4% | 3.7%(+4.72)#88 | 4.1%(+4.29)#2,707 |
| 89. | Summerside | 8.4% | 3.7%(+4.70)#89 | 4.1%(+4.28)#2,716 |
| 90. | Thornport | 8.4% | 3.7%(+4.69)#90 | 4.1%(+4.27)#2,726 |
| 91. | Girard | 8.4% | 3.7%(+4.67)#91 | 4.1%(+4.25)#2,737 |
| 92. | Galion | 8.3% | 3.7%(+4.59)#92 | 4.1%(+4.16)#2,806 |
| 93. | Commercial Point | 8.3% | 3.7%(+4.56)#93 | 4.1%(+4.13)#2,816 |
| 94. | Loudonville | 8.2% | 3.7%(+4.45)#94 | 4.1%(+4.02)#2,889 |
| 95. | Painesville | 8.2% | 3.7%(+4.43)#95 | 4.1%(+4.00)#2,897 |
| 96. | Corning | 8.1% | 3.7%(+4.38)#96 | 4.1%(+3.96)#2,921 |
| 97. | Savannah | 8.1% | 3.7%(+4.35)#97 | 4.1%(+3.92)#2,944 |
| 98. | Rossburg | 8.1% | 3.7%(+4.34)#98 | 4.1%(+3.91)#2,951 |
| 99. | Hooven | 8.0% | 3.7%(+4.28)#99 | 4.1%(+3.85)#2,986 |
| 100. | Otway | 8.0% | 3.7%(+4.28)#100 | 4.1%(+3.85)#2,993 |
Common Questions
What are the Top 10 Cities with the Highest Percentage of Population Employed in Administrative & Support Services in Ohio?
Top 10 Cities with the Highest Percentage of Population Employed in Administrative & Support Services in Ohio are:
#1
45.8%
#2
43.5%
#3
33.3%
#4
30.8%
#5
29.2%
#6
28.6%
#7
27.8%
#8
26.9%
#9
25.0%
#10
25.0%
What city has the Highest Percentage of Population Employed in Administrative & Support Services in Ohio?
Orient has the Highest Percentage of Population Employed in Administrative & Support Services in Ohio with 45.8%.
What is the Percentage of Population Employed in Administrative & Support Services in the State of Ohio?
Percentage of Population Employed in Administrative & Support Services in Ohio is 3.7%.
What is the Percentage of Population Employed in Administrative & Support Services in the United States?
Percentage of Population Employed in Administrative & Support Services in the United States is 4.1%.