Trucksville, PA Map & Demographics
Trucksville Map
Trucksville Overview
$42,002
PER CAPITA INCOME
$66,161
AVG FAMILY INCOME
$60,164
AVG HOUSEHOLD INCOME
34.3%
WAGE / INCOME GAP [ % ]
65.7¢/ $1
WAGE / INCOME GAP [ $ ]
0.49
INEQUALITY / GINI INDEX
2,388
TOTAL POPULATION
1,184
MALE POPULATION
1,204
FEMALE POPULATION
98.34
MALES / 100 FEMALES
101.69
FEMALES / 100 MALES
49.2
MEDIAN AGE
2.6
AVG FAMILY SIZE
2.2
AVG HOUSEHOLD SIZE
1,174
LABOR FORCE [ PEOPLE ]
58.2%
PERCENT IN LABOR FORCE
4.7%
UNEMPLOYMENT RATE
Trucksville Area Codes
Income in Trucksville
Income Overview in Trucksville
Per Capita Income in Trucksville is $42,002, while median incomes of families and households are $66,161 and $60,164 respectively.
| Characteristic | Number | Measure |
| Per Capita Income | 2,388 | $42,002 |
| Median Family Income | 753 | $66,161 |
| Mean Family Income | 753 | $114,151 |
| Median Household Income | 1,102 | $60,164 |
| Mean Household Income | 1,102 | $92,350 |
| Income Deficit | 753 | $0 |
| Wage / Income Gap (%) | 2,388 | 34.25% |
| Wage / Income Gap ($) | 2,388 | 65.75¢ per $1 |
| Gini / Inequality Index | 2,388 | 0.49 |
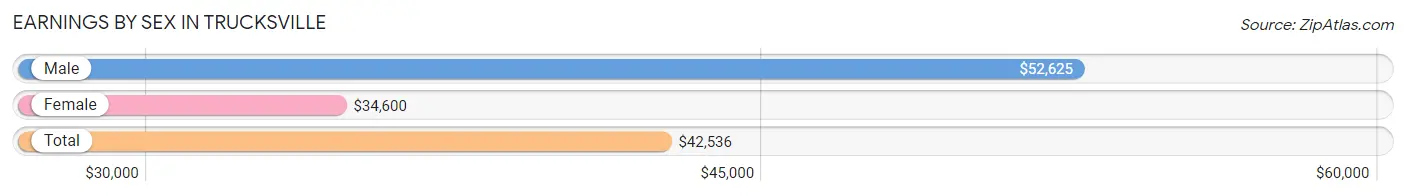
Earnings by Sex in Trucksville
Average Earnings in Trucksville are $42,536, $52,625 for men and $34,600 for women, a difference of 34.3%.
| Sex | Number | Average Earnings |
| Male | 649 (54.0%) | $52,625 |
| Female | 553 (46.0%) | $34,600 |
| Total | 1,202 (100.0%) | $42,536 |
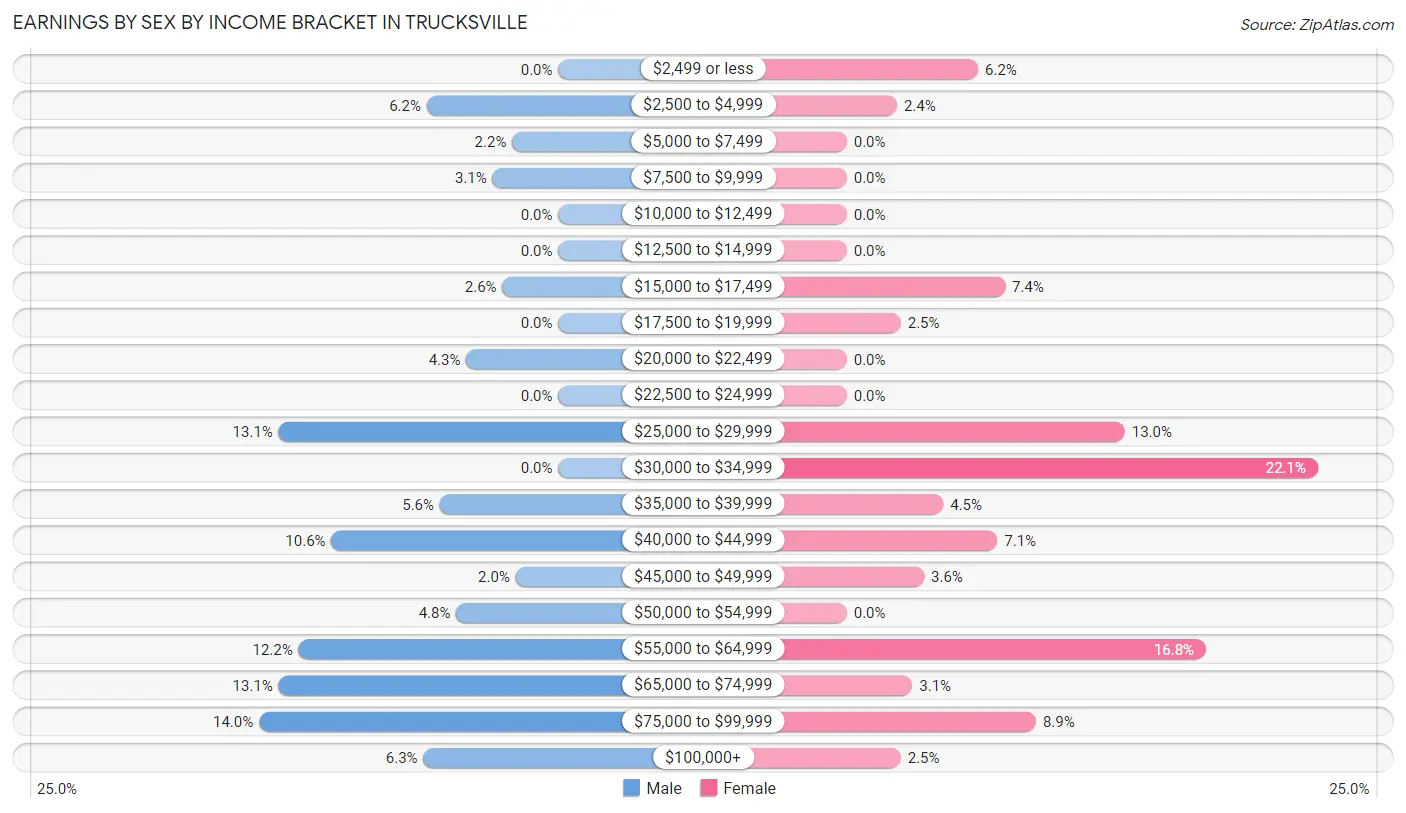
Earnings by Sex by Income Bracket in Trucksville
The most common earnings brackets in Trucksville are $75,000 to $99,999 for men (91 | 14.0%) and $30,000 to $34,999 for women (122 | 22.1%).
| Income | Male | Female |
| $2,499 or less | 0 (0.0%) | 34 (6.1%) |
| $2,500 to $4,999 | 40 (6.2%) | 13 (2.4%) |
| $5,000 to $7,499 | 14 (2.2%) | 0 (0.0%) |
| $7,500 to $9,999 | 20 (3.1%) | 0 (0.0%) |
| $10,000 to $12,499 | 0 (0.0%) | 0 (0.0%) |
| $12,500 to $14,999 | 0 (0.0%) | 0 (0.0%) |
| $15,000 to $17,499 | 17 (2.6%) | 41 (7.4%) |
| $17,500 to $19,999 | 0 (0.0%) | 14 (2.5%) |
| $20,000 to $22,499 | 28 (4.3%) | 0 (0.0%) |
| $22,500 to $24,999 | 0 (0.0%) | 0 (0.0%) |
| $25,000 to $29,999 | 85 (13.1%) | 72 (13.0%) |
| $30,000 to $34,999 | 0 (0.0%) | 122 (22.1%) |
| $35,000 to $39,999 | 36 (5.6%) | 25 (4.5%) |
| $40,000 to $44,999 | 69 (10.6%) | 39 (7.0%) |
| $45,000 to $49,999 | 13 (2.0%) | 20 (3.6%) |
| $50,000 to $54,999 | 31 (4.8%) | 0 (0.0%) |
| $55,000 to $64,999 | 79 (12.2%) | 93 (16.8%) |
| $65,000 to $74,999 | 85 (13.1%) | 17 (3.1%) |
| $75,000 to $99,999 | 91 (14.0%) | 49 (8.9%) |
| $100,000+ | 41 (6.3%) | 14 (2.5%) |
| Total | 649 (100.0%) | 553 (100.0%) |
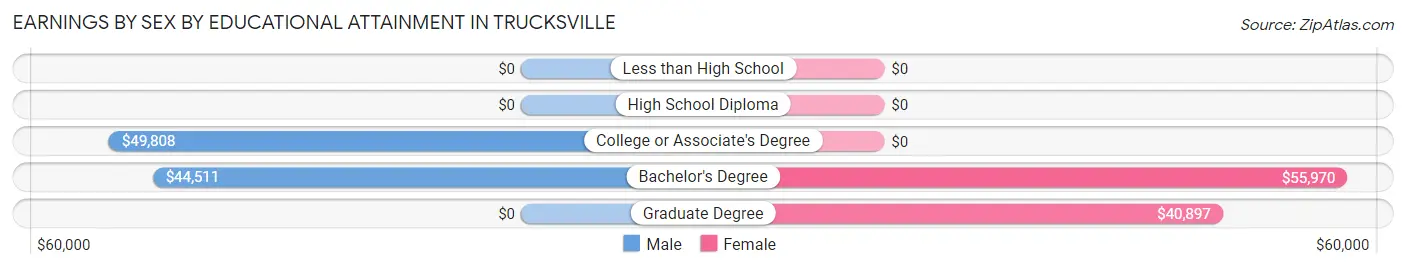
Earnings by Sex by Educational Attainment in Trucksville
Average earnings in Trucksville are $54,667 for men and $34,713 for women, a difference of 36.5%. Men with an educational attainment of college or associate's degree enjoy the highest average annual earnings of $49,808, while those with bachelor's degree education earn the least with $44,511. Women with an educational attainment of bachelor's degree earn the most with the average annual earnings of $55,970, while those with graduate degree education have the smallest earnings of $40,897.
| Educational Attainment | Male Income | Female Income |
| Less than High School | - | - |
| High School Diploma | - | - |
| College or Associate's Degree | $49,808 | $0 |
| Bachelor's Degree | $44,511 | $55,970 |
| Graduate Degree | - | - |
| Total | $54,667 | $34,713 |
Family Income in Trucksville
Family Income Brackets in Trucksville
According to the Trucksville family income data, there are 190 families falling into the $25,000 to $34,999 income range, which is the most common income bracket and makes up 25.2% of all families.
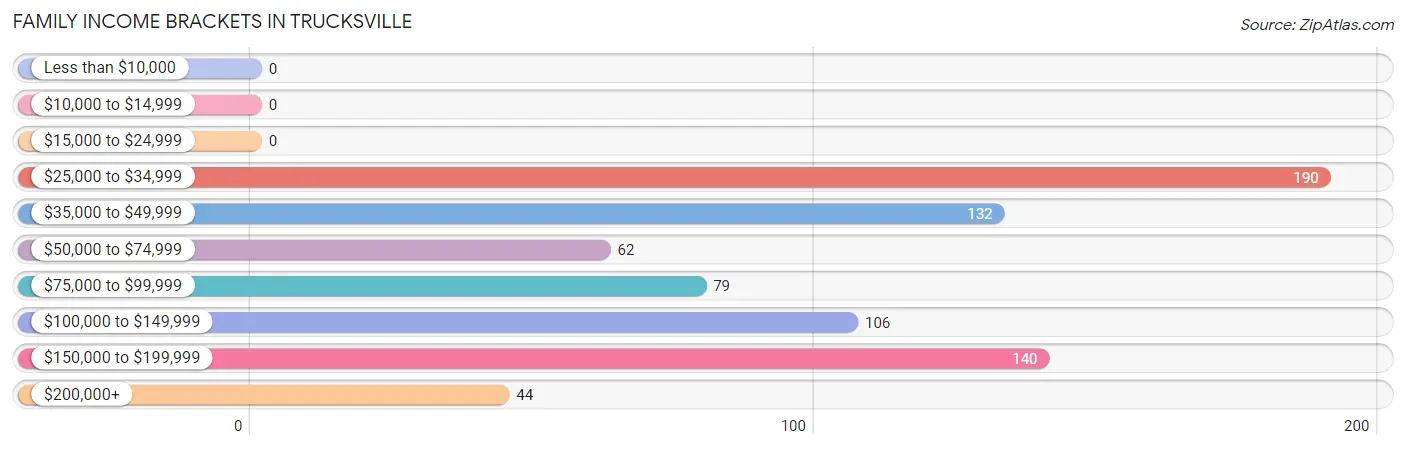
| Income Bracket | # Families | % Families |
| Less than $10,000 | 0 | 0.0% |
| $10,000 to $14,999 | 0 | 0.0% |
| $15,000 to $24,999 | 0 | 0.0% |
| $25,000 to $34,999 | 190 | 25.2% |
| $35,000 to $49,999 | 132 | 17.5% |
| $50,000 to $74,999 | 62 | 8.2% |
| $75,000 to $99,999 | 79 | 10.5% |
| $100,000 to $149,999 | 106 | 14.1% |
| $150,000 to $199,999 | 140 | 18.6% |
| $200,000+ | 44 | 5.8% |
Family Income by Famaliy Size in Trucksville
4-person families (54 | 7.2%) account for the highest median family income in Trucksville with $127,589 per family, while 4-person families (54 | 7.2%) have the highest median income of $31,897 per family member.
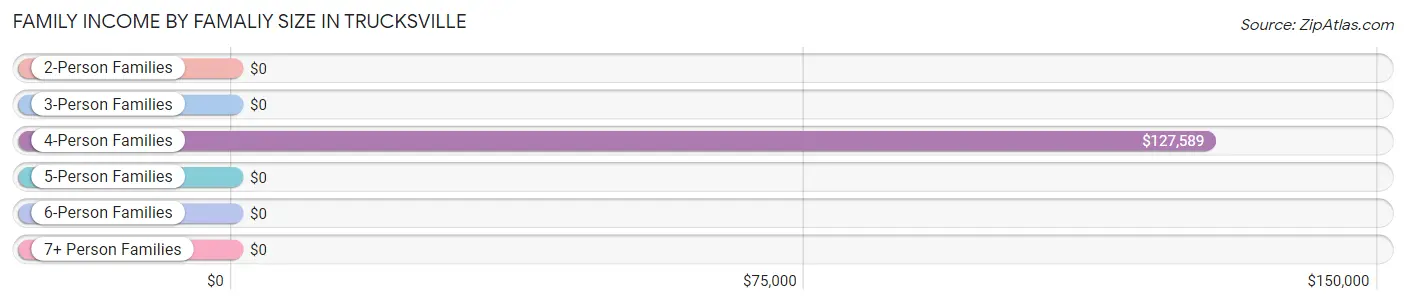
| Income Bracket | # Families | Median Income |
| 2-Person Families | 402 (53.4%) | $0 |
| 3-Person Families | 226 (30.0%) | $0 |
| 4-Person Families | 54 (7.2%) | $127,589 |
| 5-Person Families | 39 (5.2%) | $0 |
| 6-Person Families | 32 (4.3%) | $0 |
| 7+ Person Families | 0 (0.0%) | $0 |
| Total | 753 (100.0%) | $66,161 |
Family Income by Number of Earners in Trucksville
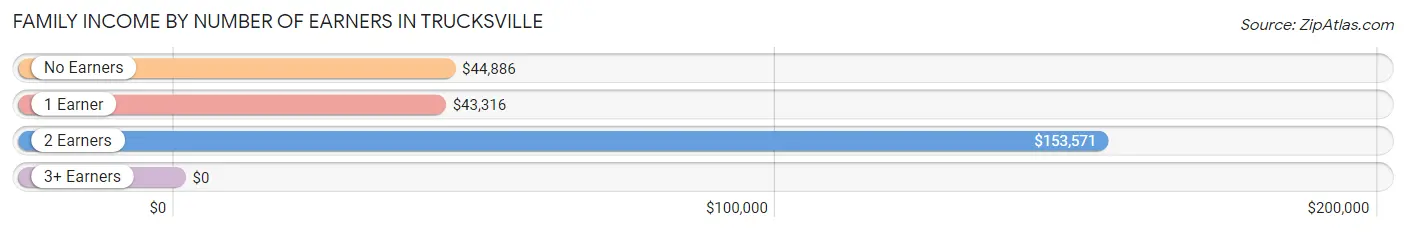
| Number of Earners | # Families | Median Income |
| No Earners | 129 (17.1%) | $44,886 |
| 1 Earner | 319 (42.4%) | $43,316 |
| 2 Earners | 226 (30.0%) | $153,571 |
| 3+ Earners | 79 (10.5%) | $0 |
| Total | 753 (100.0%) | $66,161 |
Household Income in Trucksville
Household Income Brackets in Trucksville
With 270 households falling in the category, the $25,000 to $34,999 income range is the most frequent in Trucksville, accounting for 24.5% of all households.
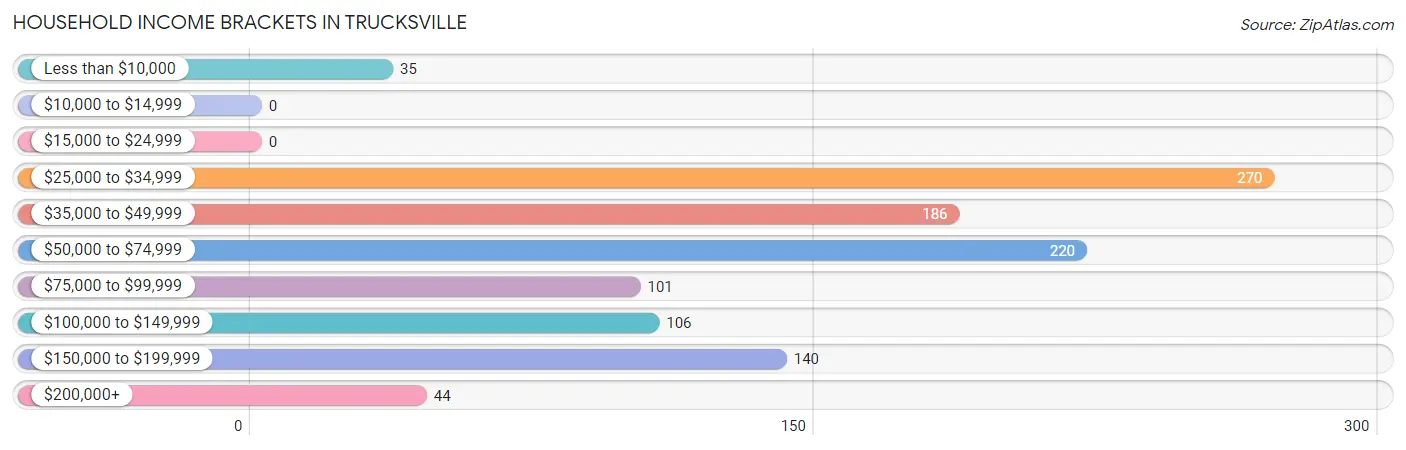
| Income Bracket | # Households | % Households |
| Less than $10,000 | 35 | 3.2% |
| $10,000 to $14,999 | 0 | 0.0% |
| $15,000 to $24,999 | 0 | 0.0% |
| $25,000 to $34,999 | 270 | 24.5% |
| $35,000 to $49,999 | 186 | 16.9% |
| $50,000 to $74,999 | 220 | 20.0% |
| $75,000 to $99,999 | 101 | 9.2% |
| $100,000 to $149,999 | 106 | 9.6% |
| $150,000 to $199,999 | 140 | 12.7% |
| $200,000+ | 44 | 4.0% |
Household Income by Householder Age in Trucksville
The median household income in Trucksville is $60,164, with the highest median household income of $128,080 found in the 45 to 64 years age bracket for the primary householder. A total of 359 households (32.6%) fall into this category.
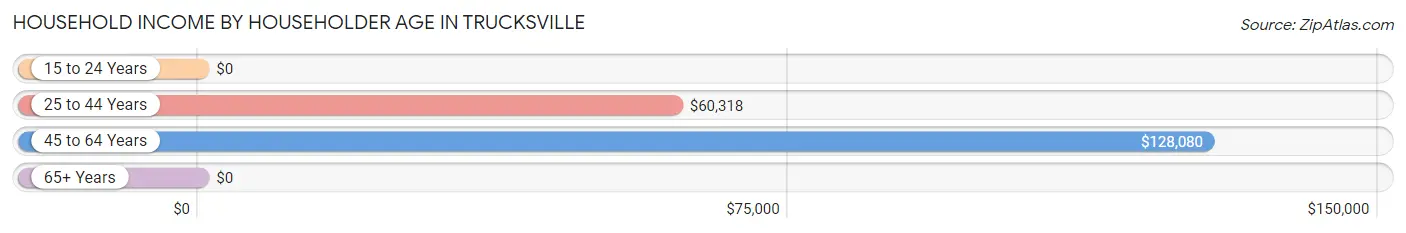
| Income Bracket | # Households | Median Income |
| 15 to 24 Years | 0 (0.0%) | $0 |
| 25 to 44 Years | 325 (29.5%) | $60,318 |
| 45 to 64 Years | 359 (32.6%) | $128,080 |
| 65+ Years | 418 (37.9%) | $0 |
| Total | 1,102 (100.0%) | $60,164 |
Poverty in Trucksville
Income Below Poverty by Sex and Age in Trucksville
With 0.5% poverty level for males and 4.1% for females among the residents of Trucksville, 35 to 44 year old males and 18 to 24 year old females are the most vulnerable to poverty, with 2 males (8.3%) and 14 females (22.6%) in their respective age groups living below the poverty level.
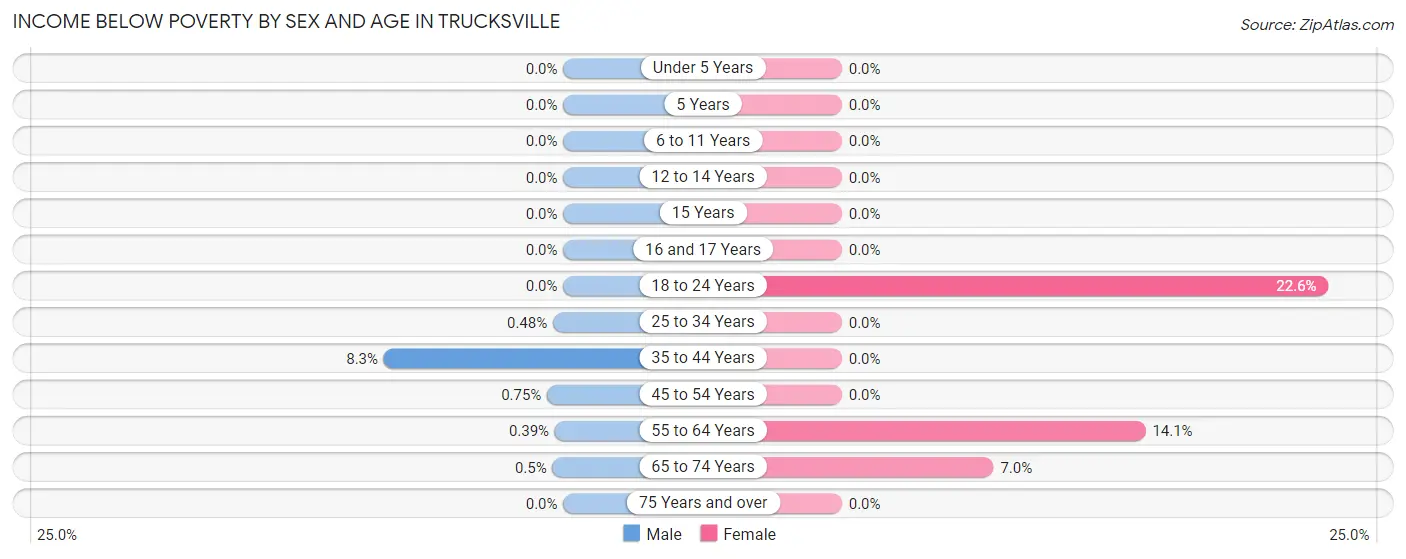
| Age Bracket | Male | Female |
| Under 5 Years | 0 (0.0%) | 0 (0.0%) |
| 5 Years | 0 (0.0%) | 0 (0.0%) |
| 6 to 11 Years | 0 (0.0%) | 0 (0.0%) |
| 12 to 14 Years | 0 (0.0%) | 0 (0.0%) |
| 15 Years | 0 (0.0%) | 0 (0.0%) |
| 16 and 17 Years | 0 (0.0%) | 0 (0.0%) |
| 18 to 24 Years | 0 (0.0%) | 14 (22.6%) |
| 25 to 34 Years | 1 (0.5%) | 0 (0.0%) |
| 35 to 44 Years | 2 (8.3%) | 0 (0.0%) |
| 45 to 54 Years | 1 (0.7%) | 0 (0.0%) |
| 55 to 64 Years | 1 (0.4%) | 21 (14.1%) |
| 65 to 74 Years | 1 (0.5%) | 14 (7.0%) |
| 75 Years and over | 0 (0.0%) | 0 (0.0%) |
| Total | 6 (0.5%) | 49 (4.1%) |
Income Above Poverty by Sex and Age in Trucksville
According to the poverty statistics in Trucksville, males aged under 5 years and females aged under 5 years are the age groups that are most secure financially, with 100.0% of males and 100.0% of females in these age groups living above the poverty line.
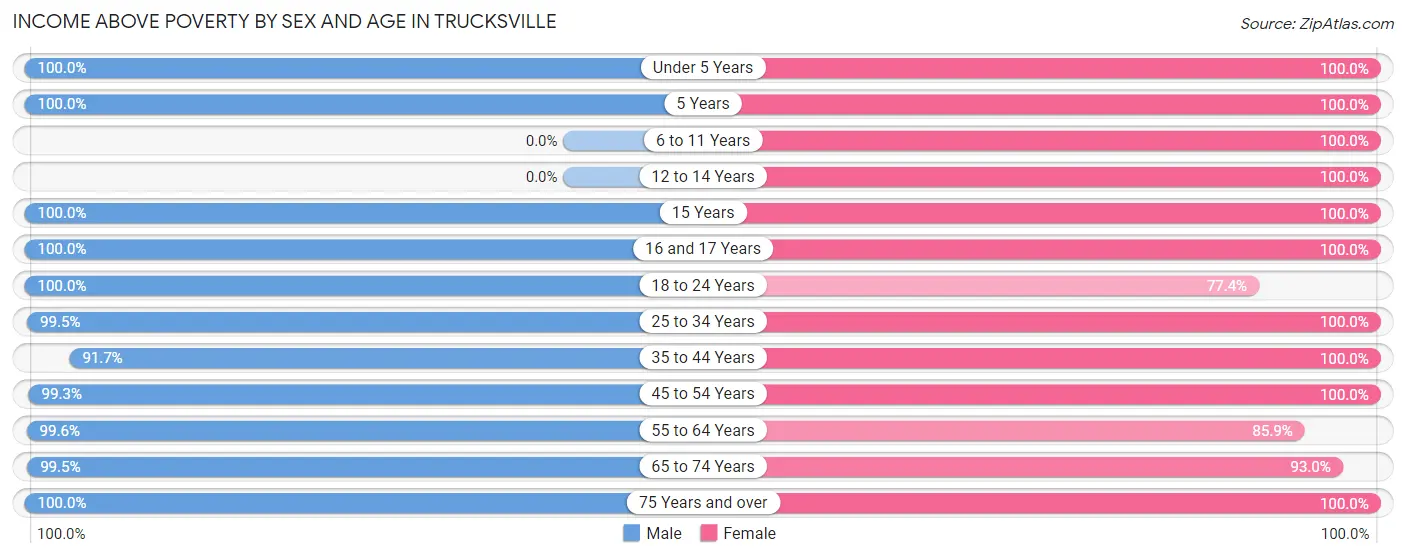
| Age Bracket | Male | Female |
| Under 5 Years | 159 (100.0%) | 62 (100.0%) |
| 5 Years | 20 (100.0%) | 13 (100.0%) |
| 6 to 11 Years | 0 (0.0%) | 68 (100.0%) |
| 12 to 14 Years | 0 (0.0%) | 17 (100.0%) |
| 15 Years | 16 (100.0%) | 16 (100.0%) |
| 16 and 17 Years | 20 (100.0%) | 26 (100.0%) |
| 18 to 24 Years | 43 (100.0%) | 48 (77.4%) |
| 25 to 34 Years | 206 (99.5%) | 299 (100.0%) |
| 35 to 44 Years | 22 (91.7%) | 71 (100.0%) |
| 45 to 54 Years | 132 (99.3%) | 152 (100.0%) |
| 55 to 64 Years | 254 (99.6%) | 128 (85.9%) |
| 65 to 74 Years | 200 (99.5%) | 185 (93.0%) |
| 75 Years and over | 106 (100.0%) | 70 (100.0%) |
| Total | 1,178 (99.5%) | 1,155 (95.9%) |
Income Below Poverty Among Married-Couple Families in Trucksville
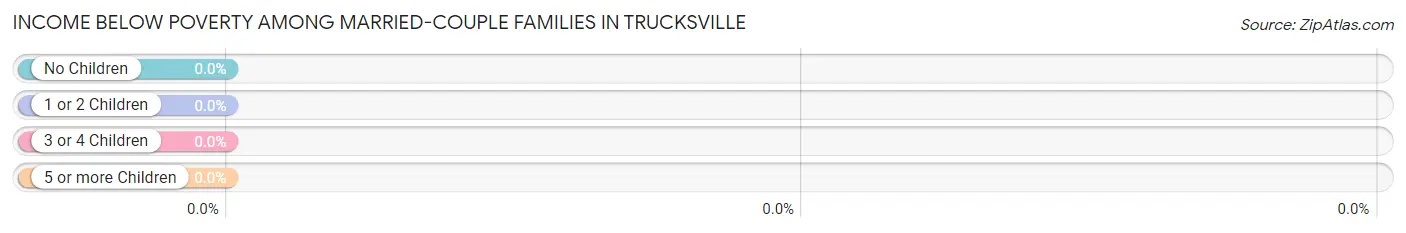
| Children | Above Poverty | Below Poverty |
| No Children | 363 (100.0%) | 0 (0.0%) |
| 1 or 2 Children | 53 (100.0%) | 0 (0.0%) |
| 3 or 4 Children | 58 (100.0%) | 0 (0.0%) |
| 5 or more Children | 0 (0.0%) | 0 (0.0%) |
| Total | 474 (100.0%) | 0 (0.0%) |
Income Below Poverty Among Single-Parent Households in Trucksville
| Children | Single Father | Single Mother |
| No Children | 0 (0.0%) | 0 (0.0%) |
| 1 or 2 Children | 0 (0.0%) | 0 (0.0%) |
| 3 or 4 Children | 0 (0.0%) | 0 (0.0%) |
| 5 or more Children | 0 (0.0%) | 0 (0.0%) |
| Total | 0 (0.0%) | 0 (0.0%) |
Income Below Poverty Among Married-Couple vs Single-Parent Households in Trucksville
| Children | Married-Couple Families | Single-Parent Households |
| No Children | 0 (0.0%) | 0 (0.0%) |
| 1 or 2 Children | 0 (0.0%) | 0 (0.0%) |
| 3 or 4 Children | 0 (0.0%) | 0 (0.0%) |
| 5 or more Children | 0 (0.0%) | 0 (0.0%) |
| Total | 0 (0.0%) | 0 (0.0%) |
Race in Trucksville
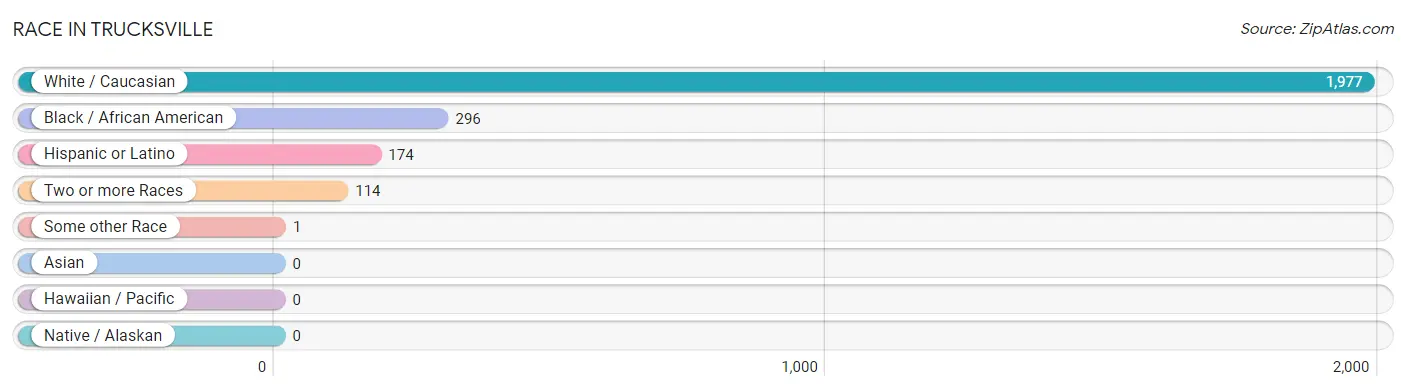
The most populous races in Trucksville are White / Caucasian (1,977 | 82.8%), Black / African American (296 | 12.4%), and Hispanic or Latino (174 | 7.3%).
| Race | # Population | % Population |
| Asian | 0 | 0.0% |
| Black / African American | 296 | 12.4% |
| Hawaiian / Pacific | 0 | 0.0% |
| Hispanic or Latino | 174 | 7.3% |
| Native / Alaskan | 0 | 0.0% |
| White / Caucasian | 1,977 | 82.8% |
| Two or more Races | 114 | 4.8% |
| Some other Race | 1 | 0.0% |
| Total | 2,388 | 100.0% |
Ancestry in Trucksville
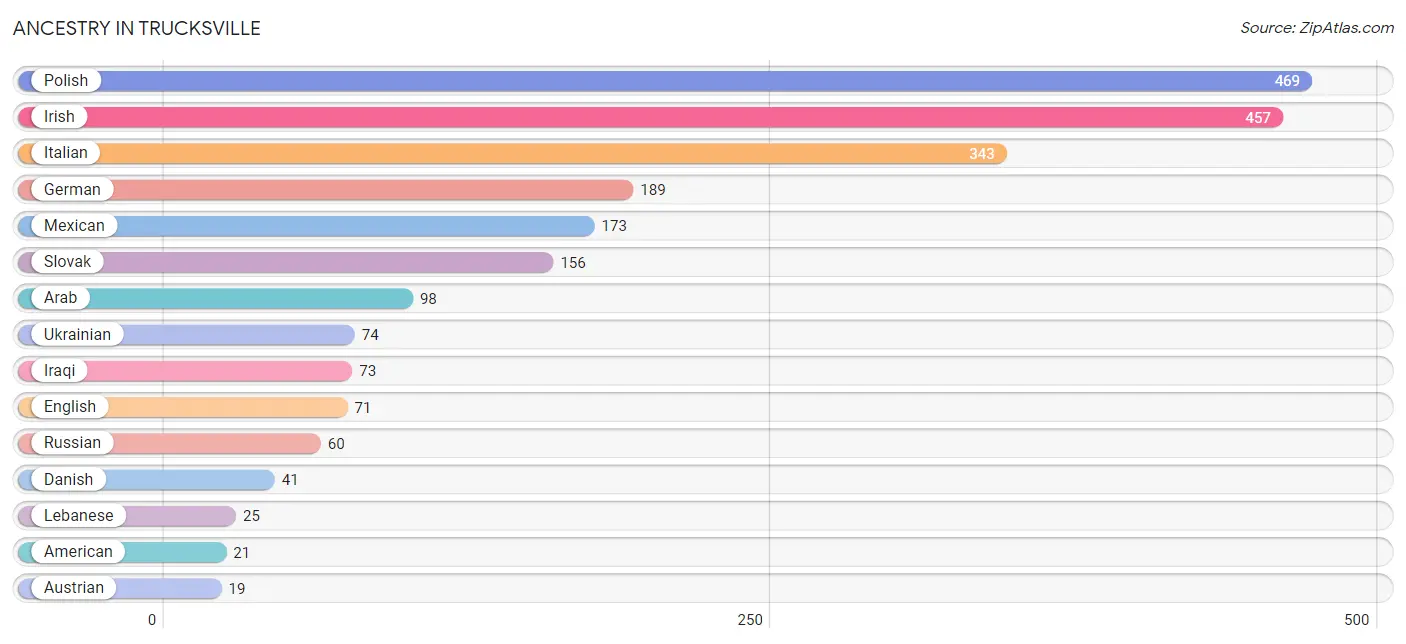
The most populous ancestries reported in Trucksville are Polish (469 | 19.6%), Irish (457 | 19.1%), Italian (343 | 14.4%), German (189 | 7.9%), and Mexican (173 | 7.2%), together accounting for 68.3% of all Trucksville residents.
| Ancestry | # Population | % Population |
| American | 21 | 0.9% |
| Arab | 98 | 4.1% |
| Austrian | 19 | 0.8% |
| Danish | 41 | 1.7% |
| Dutch | 18 | 0.7% |
| English | 71 | 3.0% |
| German | 189 | 7.9% |
| Hungarian | 19 | 0.8% |
| Iraqi | 73 | 3.1% |
| Irish | 457 | 19.1% |
| Italian | 343 | 14.4% |
| Lebanese | 25 | 1.1% |
| Lithuanian | 17 | 0.7% |
| Mexican | 173 | 7.2% |
| Pennsylvania German | 16 | 0.7% |
| Polish | 469 | 19.6% |
| Puerto Rican | 1 | 0.0% |
| Russian | 60 | 2.5% |
| Scottish | 13 | 0.5% |
| Slovak | 156 | 6.5% |
| Ukrainian | 74 | 3.1% |
| Welsh | 14 | 0.6% | View All 22 Rows |
Immigrants in Trucksville
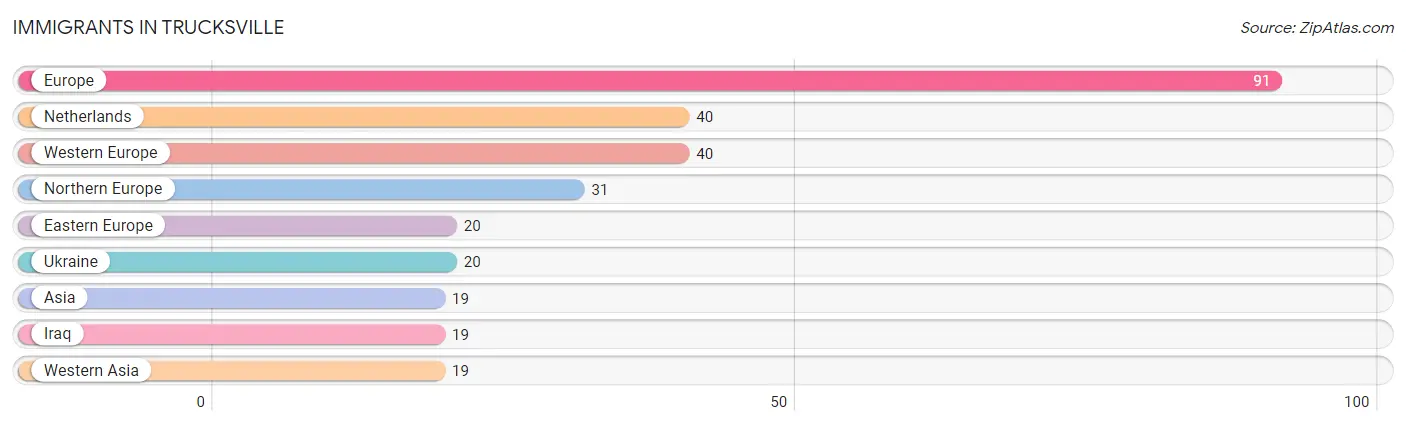
The most numerous immigrant groups reported in Trucksville came from Europe (91 | 3.8%), Netherlands (40 | 1.7%), Western Europe (40 | 1.7%), Northern Europe (31 | 1.3%), and Eastern Europe (20 | 0.8%), together accounting for 9.3% of all Trucksville residents.
| Immigration Origin | # Population | % Population |
| Asia | 19 | 0.8% |
| Eastern Europe | 20 | 0.8% |
| Europe | 91 | 3.8% |
| Iraq | 19 | 0.8% |
| Netherlands | 40 | 1.7% |
| Northern Europe | 31 | 1.3% |
| Ukraine | 20 | 0.8% |
| Western Asia | 19 | 0.8% |
| Western Europe | 40 | 1.7% | View All 9 Rows |
Sex and Age in Trucksville
Sex and Age in Trucksville
The most populous age groups in Trucksville are Under 5 Years (159 | 13.4%) for men and 25 to 29 Years (214 | 17.8%) for women.
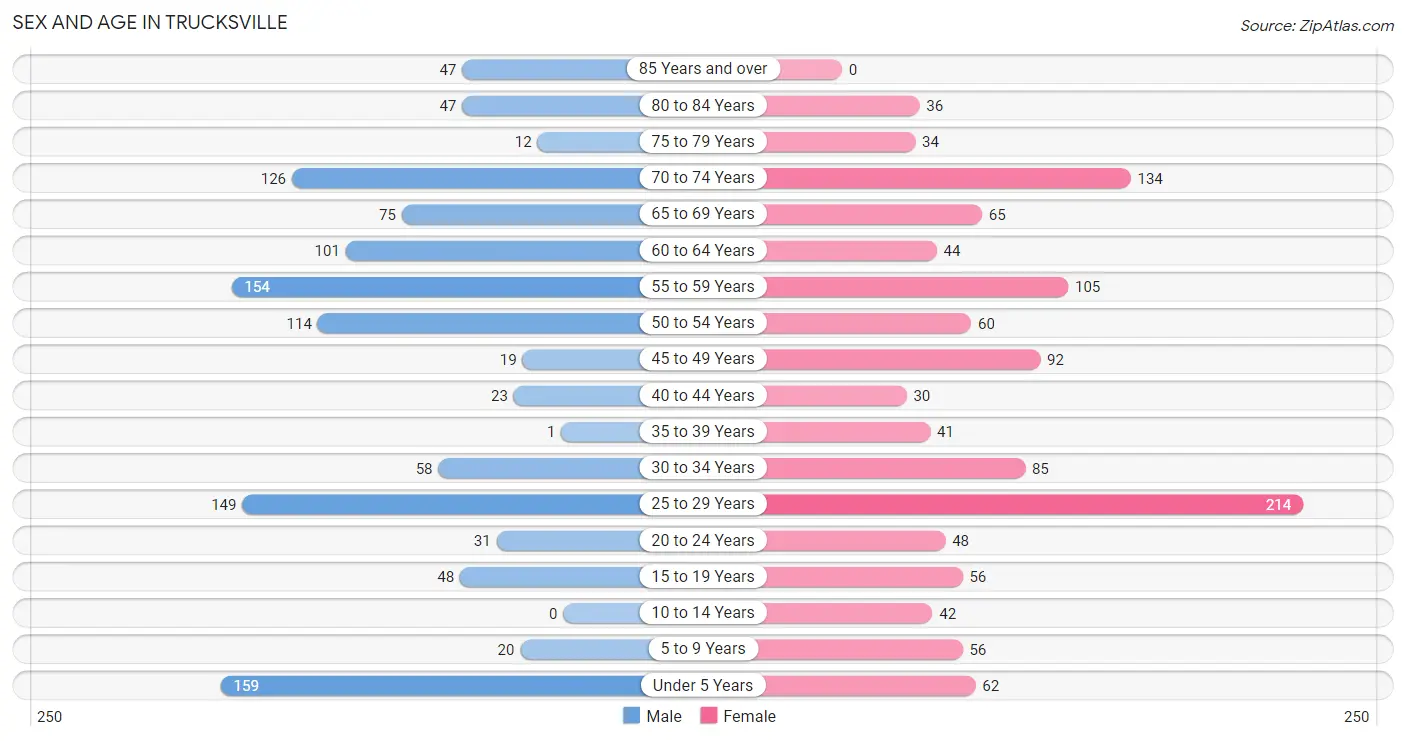
| Age Bracket | Male | Female |
| Under 5 Years | 159 (13.4%) | 62 (5.1%) |
| 5 to 9 Years | 20 (1.7%) | 56 (4.6%) |
| 10 to 14 Years | 0 (0.0%) | 42 (3.5%) |
| 15 to 19 Years | 48 (4.1%) | 56 (4.6%) |
| 20 to 24 Years | 31 (2.6%) | 48 (4.0%) |
| 25 to 29 Years | 149 (12.6%) | 214 (17.8%) |
| 30 to 34 Years | 58 (4.9%) | 85 (7.1%) |
| 35 to 39 Years | 1 (0.1%) | 41 (3.4%) |
| 40 to 44 Years | 23 (1.9%) | 30 (2.5%) |
| 45 to 49 Years | 19 (1.6%) | 92 (7.6%) |
| 50 to 54 Years | 114 (9.6%) | 60 (5.0%) |
| 55 to 59 Years | 154 (13.0%) | 105 (8.7%) |
| 60 to 64 Years | 101 (8.5%) | 44 (3.6%) |
| 65 to 69 Years | 75 (6.3%) | 65 (5.4%) |
| 70 to 74 Years | 126 (10.6%) | 134 (11.1%) |
| 75 to 79 Years | 12 (1.0%) | 34 (2.8%) |
| 80 to 84 Years | 47 (4.0%) | 36 (3.0%) |
| 85 Years and over | 47 (4.0%) | 0 (0.0%) |
| Total | 1,184 (100.0%) | 1,204 (100.0%) |
Families and Households in Trucksville
Median Family Size in Trucksville
The median family size in Trucksville is 2.59 persons per family, with married-couple families (474 | 62.9%) accounting for the largest median family size of 2.76 persons per family. On the other hand, single female/mother families (155 | 20.6%) represent the smallest median family size with 1.98 persons per family.
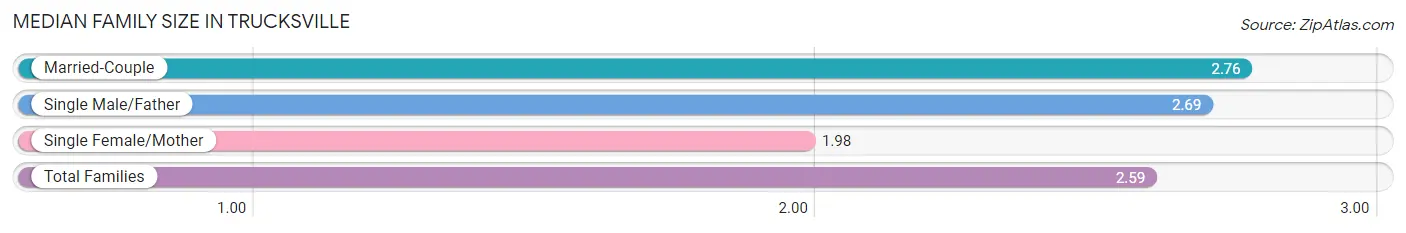
| Family Type | # Families | Family Size |
| Married-Couple | 474 (62.9%) | 2.76 |
| Single Male/Father | 124 (16.5%) | 2.69 |
| Single Female/Mother | 155 (20.6%) | 1.98 |
| Total Families | 753 (100.0%) | 2.59 |
Median Household Size in Trucksville
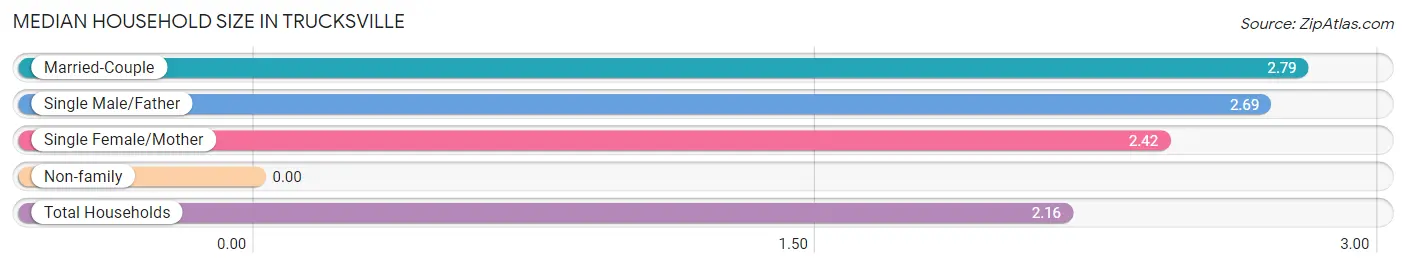
| Household Type | # Households | Household Size |
| Married-Couple | 474 (43.0%) | 2.79 |
| Single Male/Father | 124 (11.3%) | 2.69 |
| Single Female/Mother | 155 (14.1%) | 2.42 |
| Non-family | 349 (31.7%) | - |
| Total Households | 1,102 (100.0%) | 2.16 |
Household Size by Marriage Status in Trucksville
Out of a total of 1,102 households in Trucksville, 753 (68.3%) are family households, while 349 (31.7%) are nonfamily households. The most numerous type of family households are 2-person households, comprising 402, and the most common type of nonfamily households are 1-person households, comprising 349.
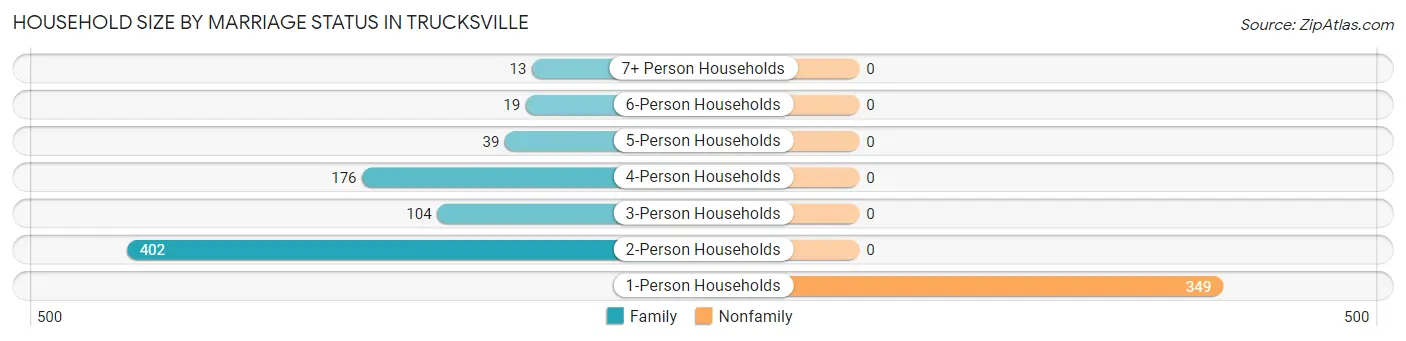
| Household Size | Family Households | Nonfamily Households |
| 1-Person Households | - | 349 (31.7%) |
| 2-Person Households | 402 (36.5%) | 0 (0.0%) |
| 3-Person Households | 104 (9.4%) | 0 (0.0%) |
| 4-Person Households | 176 (16.0%) | 0 (0.0%) |
| 5-Person Households | 39 (3.5%) | 0 (0.0%) |
| 6-Person Households | 19 (1.7%) | 0 (0.0%) |
| 7+ Person Households | 13 (1.2%) | 0 (0.0%) |
| Total | 753 (68.3%) | 349 (31.7%) |
Female Fertility in Trucksville
Fertility by Age in Trucksville
| Age Bracket | Women with Births | Births / 1,000 Women |
| 15 to 19 years | 0 (0.0%) | 0.0 |
| 20 to 34 years | 0 (0.0%) | 0.0 |
| 35 to 50 years | 0 (0.0%) | 0.0 |
| Total | 0 (0.0%) | 0.0 |
Fertility by Age by Marriage Status in Trucksville
| Age Bracket | Married | Unmarried |
| 15 to 19 years | 0 (0.0%) | 0 (0.0%) |
| 20 to 34 years | 0 (0.0%) | 0 (0.0%) |
| 35 to 50 years | 0 (0.0%) | 0 (0.0%) |
| Total | 0 (0.0%) | 0 (0.0%) |
Fertility by Education in Trucksville
| Educational Attainment | Women with Births | Births / 1,000 Women |
| Less than High School | 0 (0.0%) | 0.0 |
| High School Diploma | 0 (0.0%) | 0.0 |
| College or Associate's Degree | 0 (0.0%) | 0.0 |
| Bachelor's Degree | 0 (0.0%) | 0.0 |
| Graduate Degree | 0 (0.0%) | 0.0 |
| Total | 0 (0.0%) | 0.0 |
Fertility by Education by Marriage Status in Trucksville
| Educational Attainment | Married | Unmarried |
| Less than High School | 0 (0.0%) | 0 (0.0%) |
| High School Diploma | 0 (0.0%) | 0 (0.0%) |
| College or Associate's Degree | 0 (0.0%) | 0 (0.0%) |
| Bachelor's Degree | 0 (0.0%) | 0 (0.0%) |
| Graduate Degree | 0 (0.0%) | 0 (0.0%) |
| Total | 0 (0.0%) | 0 (0.0%) |
Employment Characteristics in Trucksville
Employment by Class of Employer in Trucksville
Among the 1,118 employed individuals in Trucksville, private company employees (825 | 73.8%), not-for-profit organizations (85 | 7.6%), and local government employees (81 | 7.2%) make up the most common classes of employment.
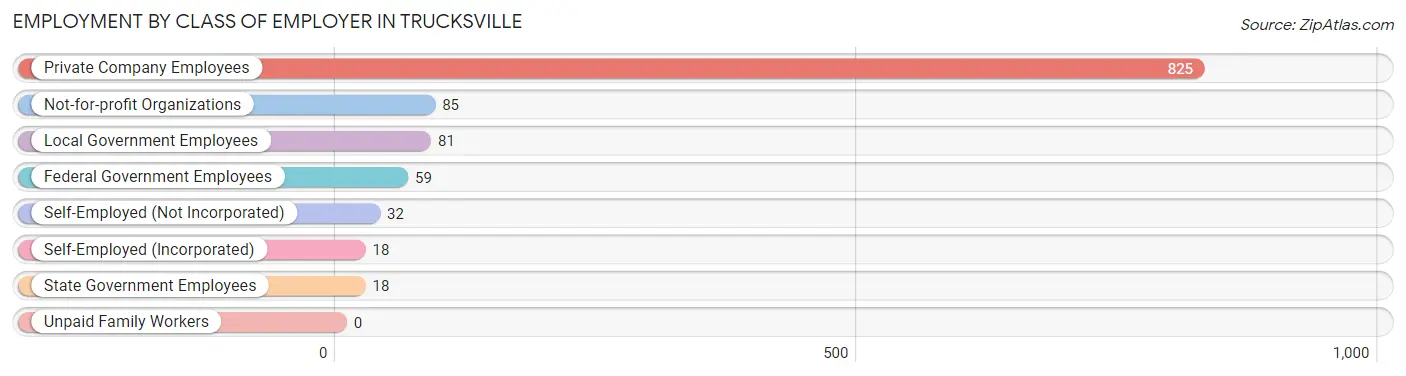
| Employer Class | # Employees | % Employees |
| Private Company Employees | 825 | 73.8% |
| Self-Employed (Incorporated) | 18 | 1.6% |
| Self-Employed (Not Incorporated) | 32 | 2.9% |
| Not-for-profit Organizations | 85 | 7.6% |
| Local Government Employees | 81 | 7.2% |
| State Government Employees | 18 | 1.6% |
| Federal Government Employees | 59 | 5.3% |
| Unpaid Family Workers | 0 | 0.0% |
| Total | 1,118 | 100.0% |
Employment Status by Age in Trucksville
According to the labor force statistics for Trucksville, out of the total population over 16 years of age (2,017), 58.2% or 1,174 individuals are in the labor force, with 4.7% or 55 of them unemployed. The age group with the highest labor force participation rate is 30 to 34 years, with 91.6% or 131 individuals in the labor force. Within the labor force, the 30 to 34 years age range has the highest percentage of unemployed individuals, with 31.3% or 41 of them being unemployed.
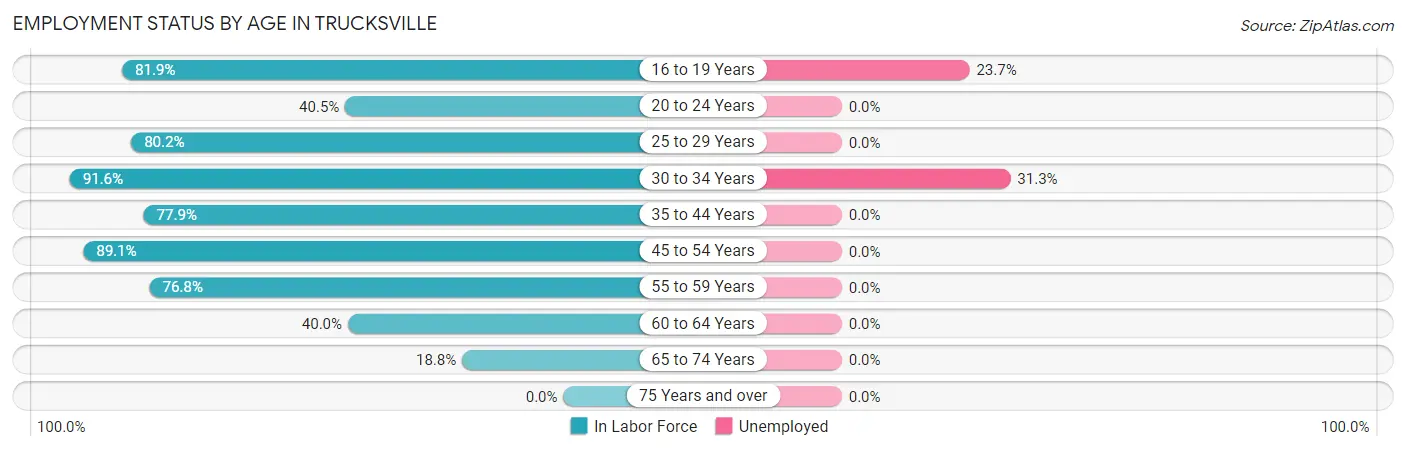
| Age Bracket | In Labor Force | Unemployed |
| 16 to 19 Years | 59 (81.9%) | 14 (23.7%) |
| 20 to 24 Years | 32 (40.5%) | 0 (0.0%) |
| 25 to 29 Years | 291 (80.2%) | 0 (0.0%) |
| 30 to 34 Years | 131 (91.6%) | 41 (31.3%) |
| 35 to 44 Years | 74 (77.9%) | 0 (0.0%) |
| 45 to 54 Years | 254 (89.1%) | 0 (0.0%) |
| 55 to 59 Years | 199 (76.8%) | 0 (0.0%) |
| 60 to 64 Years | 58 (40.0%) | 0 (0.0%) |
| 65 to 74 Years | 75 (18.8%) | 0 (0.0%) |
| 75 Years and over | 0 (0.0%) | 0 (0.0%) |
| Total | 1,174 (58.2%) | 55 (4.7%) |
Employment Status by Educational Attainment in Trucksville
According to labor force statistics for Trucksville, 78.1% of individuals (1,007) out of the total population between 25 and 64 years of age (1,290) are in the labor force, with 4.1% or 41 of them being unemployed. The group with the highest labor force participation rate are those with the educational attainment of college / associate degree, with 88.6% or 342 individuals in the labor force. Within the labor force, individuals with bachelor's degree or higher education have the highest percentage of unemployment, with 7.3% or 41 of them being unemployed.
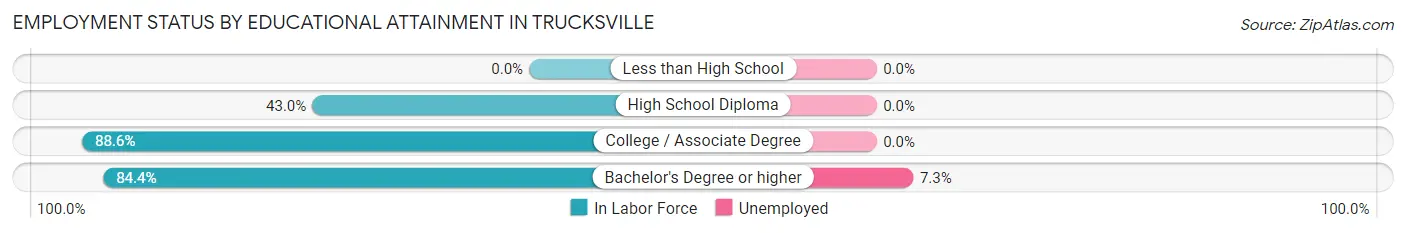
| Educational Attainment | In Labor Force | Unemployed |
| Less than High School | 0 (0.0%) | 0 (0.0%) |
| High School Diploma | 101 (43.0%) | 0 (0.0%) |
| College / Associate Degree | 342 (88.6%) | 0 (0.0%) |
| Bachelor's Degree or higher | 564 (84.4%) | 49 (7.3%) |
| Total | 1,007 (78.1%) | 53 (4.1%) |
Employment Occupations by Sex in Trucksville
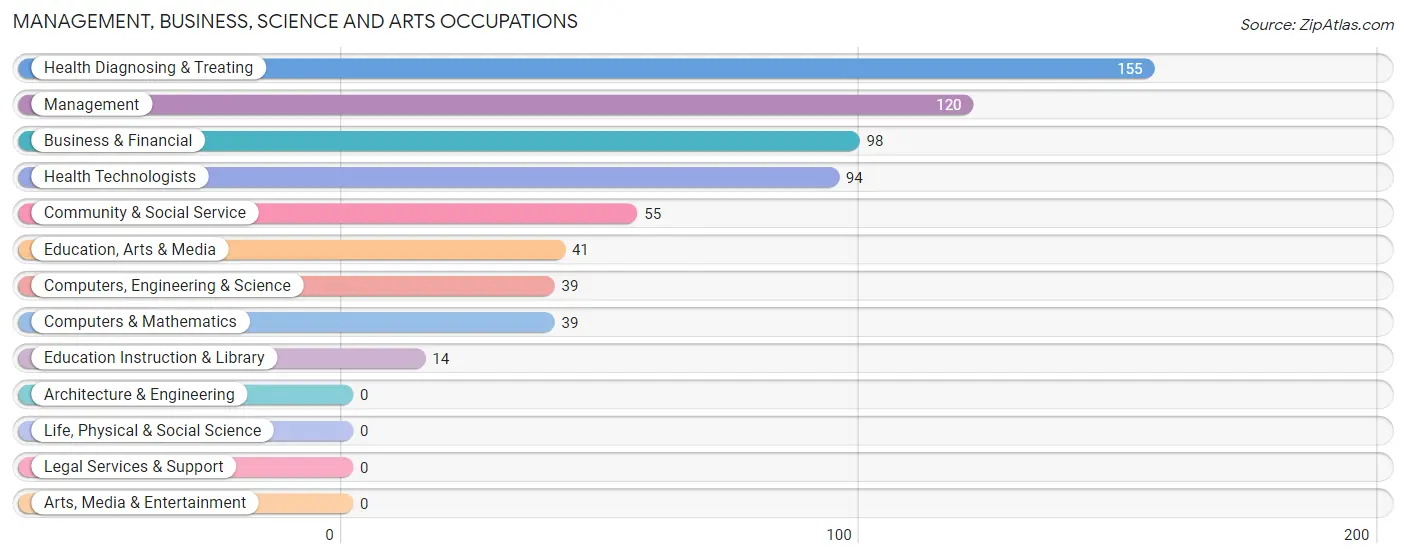
Management, Business, Science and Arts Occupations
The most common Management, Business, Science and Arts occupations in Trucksville are Health Diagnosing & Treating (155 | 13.9%), Management (120 | 10.7%), Business & Financial (98 | 8.8%), Health Technologists (94 | 8.4%), and Community & Social Service (55 | 4.9%).
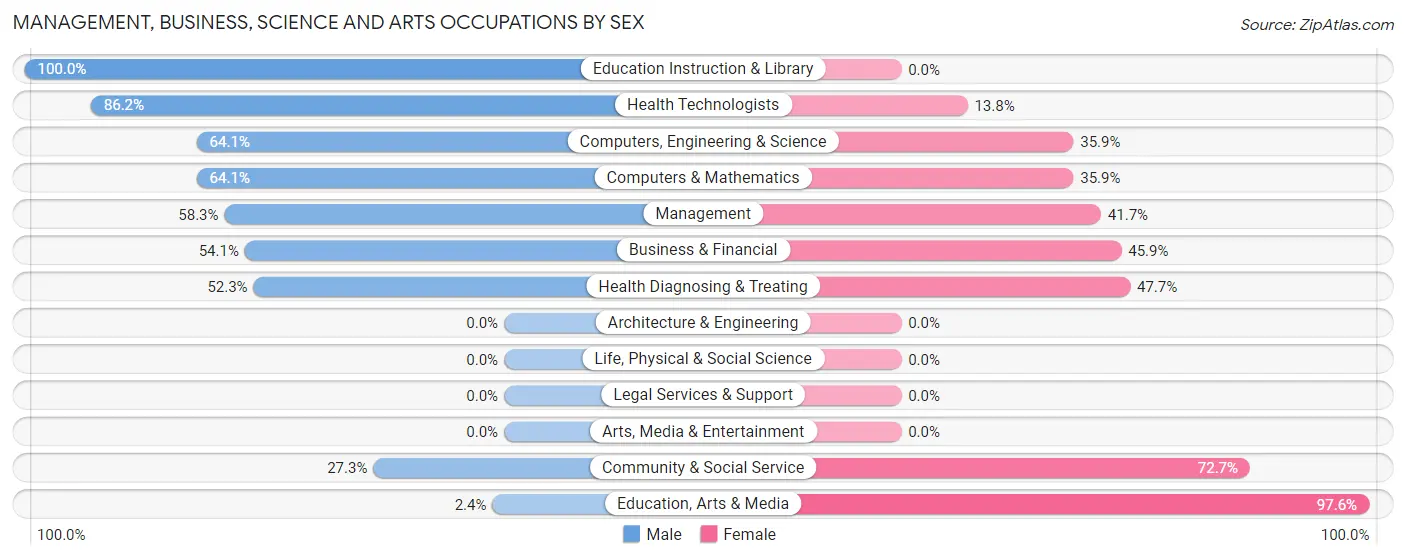
Management, Business, Science and Arts Occupations by Sex
Within the Management, Business, Science and Arts occupations in Trucksville, the most male-oriented occupations are Education Instruction & Library (100.0%), Health Technologists (86.2%), and Computers, Engineering & Science (64.1%), while the most female-oriented occupations are Education, Arts & Media (97.6%), Community & Social Service (72.7%), and Health Diagnosing & Treating (47.7%).
| Occupation | Male | Female |
| Management | 70 (58.3%) | 50 (41.7%) |
| Business & Financial | 53 (54.1%) | 45 (45.9%) |
| Computers, Engineering & Science | 25 (64.1%) | 14 (35.9%) |
| Computers & Mathematics | 25 (64.1%) | 14 (35.9%) |
| Architecture & Engineering | 0 (0.0%) | 0 (0.0%) |
| Life, Physical & Social Science | 0 (0.0%) | 0 (0.0%) |
| Community & Social Service | 15 (27.3%) | 40 (72.7%) |
| Education, Arts & Media | 1 (2.4%) | 40 (97.6%) |
| Legal Services & Support | 0 (0.0%) | 0 (0.0%) |
| Education Instruction & Library | 14 (100.0%) | 0 (0.0%) |
| Arts, Media & Entertainment | 0 (0.0%) | 0 (0.0%) |
| Health Diagnosing & Treating | 81 (52.3%) | 74 (47.7%) |
| Health Technologists | 81 (86.2%) | 13 (13.8%) |
| Total (Category) | 244 (52.2%) | 223 (47.7%) |
| Total (Overall) | 619 (55.4%) | 499 (44.6%) |
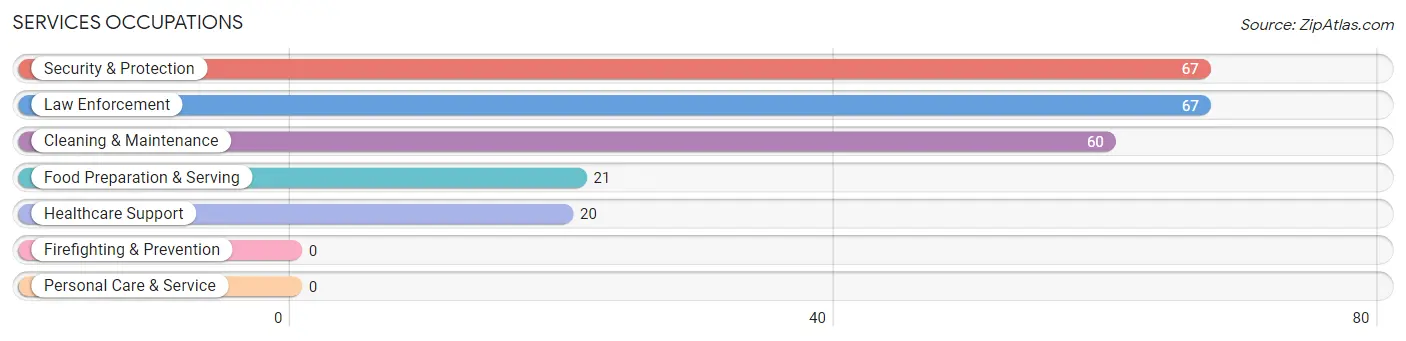
Services Occupations
The most common Services occupations in Trucksville are Security & Protection (67 | 6.0%), Law Enforcement (67 | 6.0%), Cleaning & Maintenance (60 | 5.4%), Food Preparation & Serving (21 | 1.9%), and Healthcare Support (20 | 1.8%).
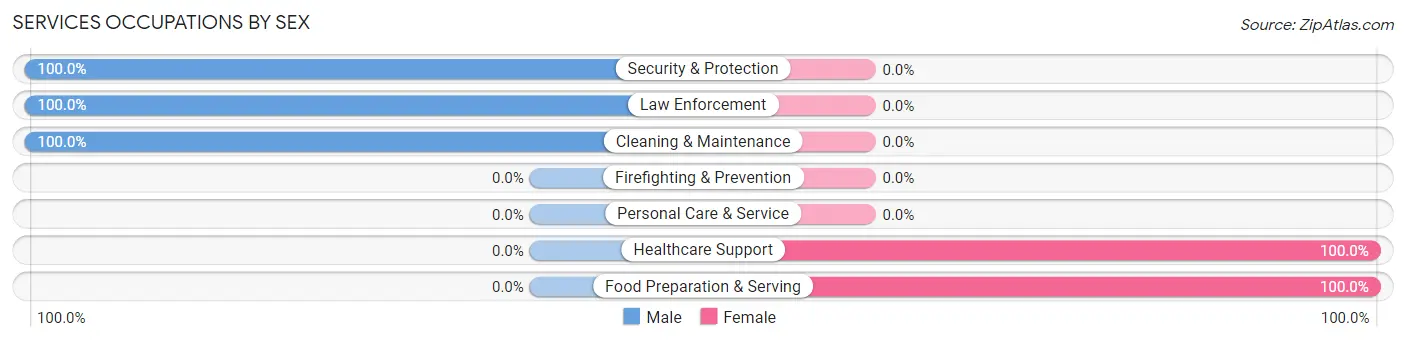
Services Occupations by Sex
Within the Services occupations in Trucksville, the most male-oriented occupations are Security & Protection (100.0%), Law Enforcement (100.0%), and Cleaning & Maintenance (100.0%), while the most female-oriented occupations are Healthcare Support (100.0%), and Food Preparation & Serving (100.0%).
| Occupation | Male | Female |
| Healthcare Support | 0 (0.0%) | 20 (100.0%) |
| Security & Protection | 67 (100.0%) | 0 (0.0%) |
| Firefighting & Prevention | 0 (0.0%) | 0 (0.0%) |
| Law Enforcement | 67 (100.0%) | 0 (0.0%) |
| Food Preparation & Serving | 0 (0.0%) | 21 (100.0%) |
| Cleaning & Maintenance | 60 (100.0%) | 0 (0.0%) |
| Personal Care & Service | 0 (0.0%) | 0 (0.0%) |
| Total (Category) | 127 (75.6%) | 41 (24.4%) |
| Total (Overall) | 619 (55.4%) | 499 (44.6%) |
Sales and Office Occupations
The most common Sales and Office occupations in Trucksville are Office & Administration (295 | 26.4%), and Sales & Related (89 | 8.0%).
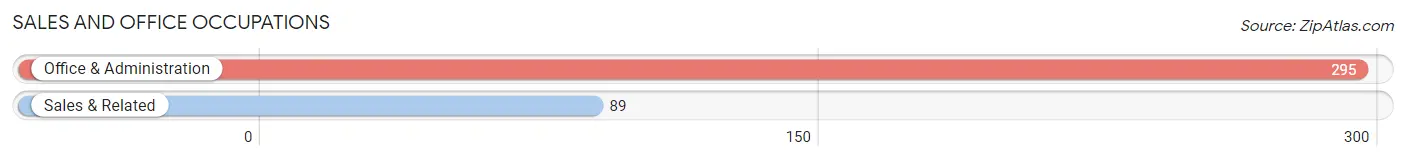
Sales and Office Occupations by Sex

| Occupation | Male | Female |
| Sales & Related | 48 (53.9%) | 41 (46.1%) |
| Office & Administration | 101 (34.2%) | 194 (65.8%) |
| Total (Category) | 149 (38.8%) | 235 (61.2%) |
| Total (Overall) | 619 (55.4%) | 499 (44.6%) |
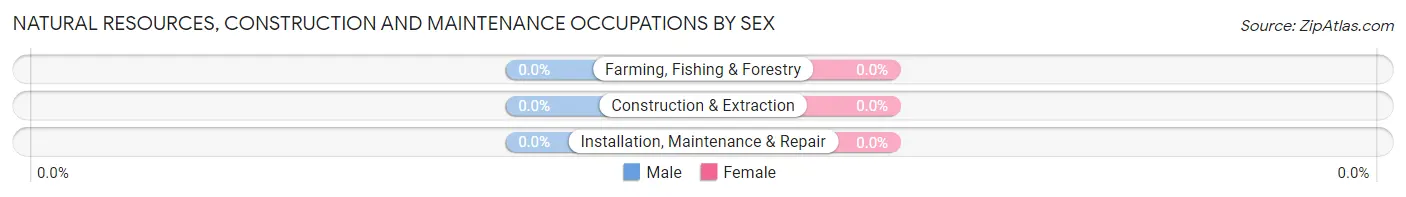
Natural Resources, Construction and Maintenance Occupations

Natural Resources, Construction and Maintenance Occupations by Sex
| Occupation | Male | Female |
| Farming, Fishing & Forestry | 0 (0.0%) | 0 (0.0%) |
| Construction & Extraction | 0 (0.0%) | 0 (0.0%) |
| Installation, Maintenance & Repair | 0 (0.0%) | 0 (0.0%) |
| Total (Category) | 0 (0.0%) | 0 (0.0%) |
| Total (Overall) | 619 (55.4%) | 499 (44.6%) |
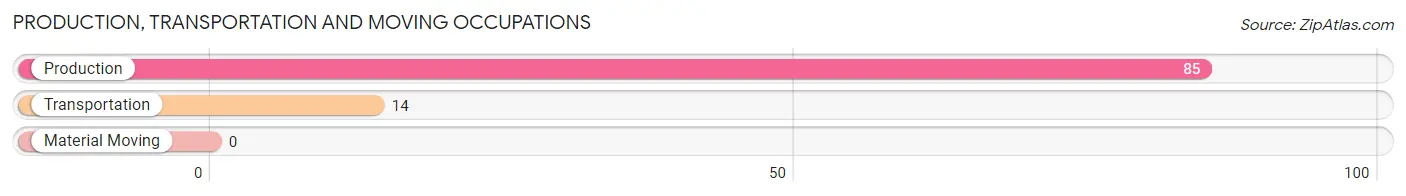
Production, Transportation and Moving Occupations
The most common Production, Transportation and Moving occupations in Trucksville are Production (85 | 7.6%), and Transportation (14 | 1.3%).
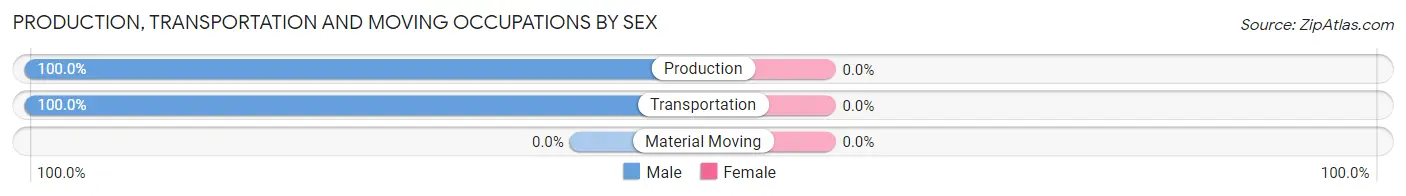
Production, Transportation and Moving Occupations by Sex
| Occupation | Male | Female |
| Production | 85 (100.0%) | 0 (0.0%) |
| Transportation | 14 (100.0%) | 0 (0.0%) |
| Material Moving | 0 (0.0%) | 0 (0.0%) |
| Total (Category) | 99 (100.0%) | 0 (0.0%) |
| Total (Overall) | 619 (55.4%) | 499 (44.6%) |
Employment Industries by Sex in Trucksville
Employment Industries in Trucksville
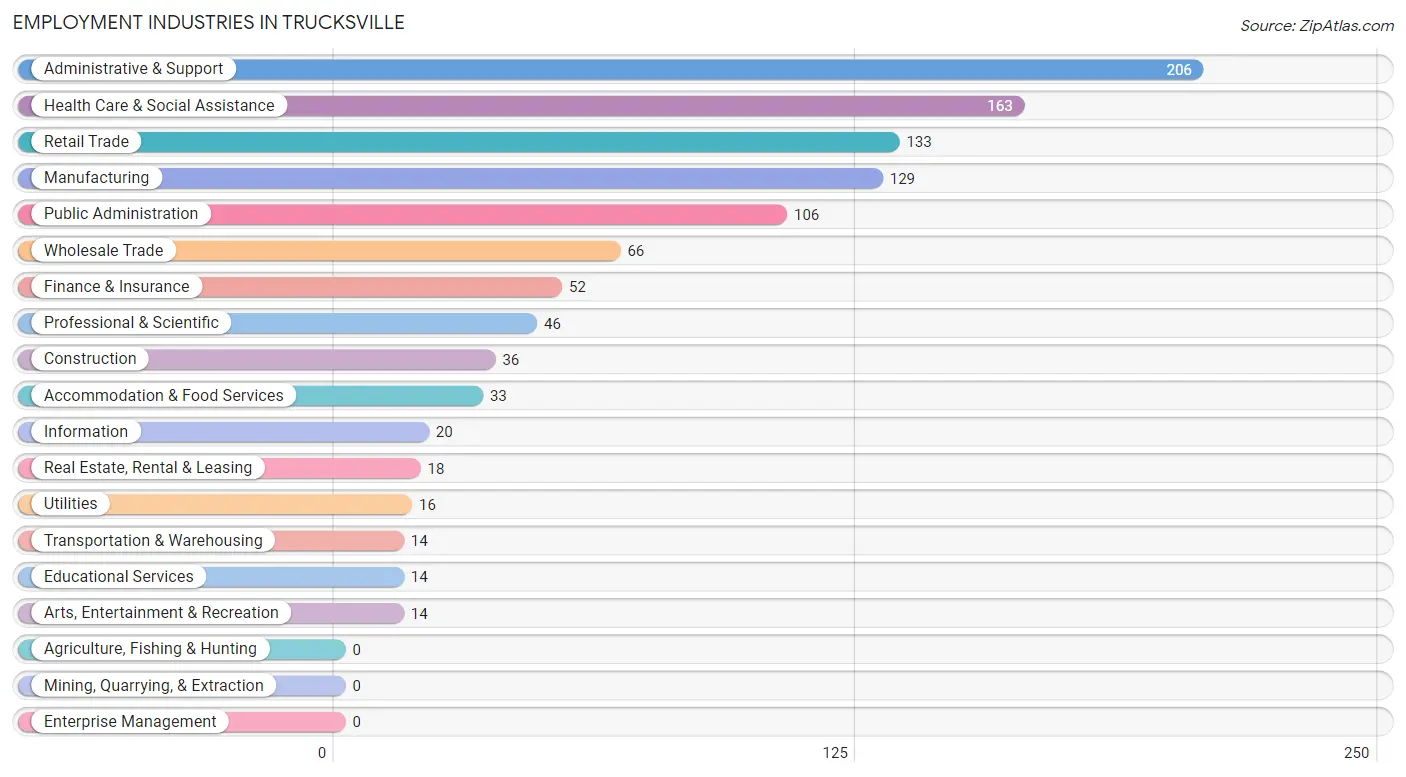
The major employment industries in Trucksville include Administrative & Support (206 | 18.4%), Health Care & Social Assistance (163 | 14.6%), Retail Trade (133 | 11.9%), Manufacturing (129 | 11.5%), and Public Administration (106 | 9.5%).
Employment Industries by Sex in Trucksville
The Trucksville industries that see more men than women are Transportation & Warehousing (100.0%), Utilities (100.0%), and Information (100.0%), whereas the industries that tend to have a higher number of women are Construction (100.0%), Arts, Entertainment & Recreation (100.0%), and Finance & Insurance (76.9%).
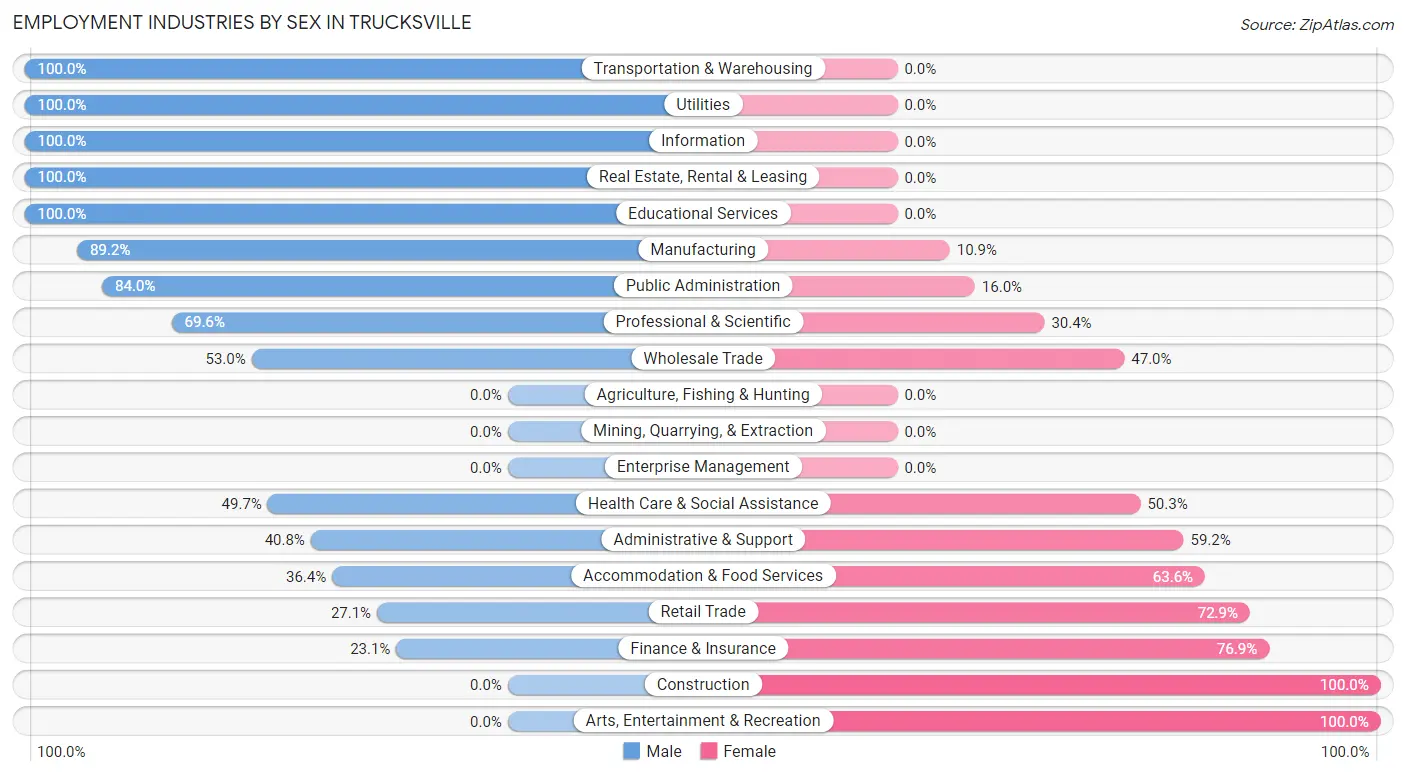
| Industry | Male | Female |
| Agriculture, Fishing & Hunting | 0 (0.0%) | 0 (0.0%) |
| Mining, Quarrying, & Extraction | 0 (0.0%) | 0 (0.0%) |
| Construction | 0 (0.0%) | 36 (100.0%) |
| Manufacturing | 115 (89.1%) | 14 (10.8%) |
| Wholesale Trade | 35 (53.0%) | 31 (47.0%) |
| Retail Trade | 36 (27.1%) | 97 (72.9%) |
| Transportation & Warehousing | 14 (100.0%) | 0 (0.0%) |
| Utilities | 16 (100.0%) | 0 (0.0%) |
| Information | 20 (100.0%) | 0 (0.0%) |
| Finance & Insurance | 12 (23.1%) | 40 (76.9%) |
| Real Estate, Rental & Leasing | 18 (100.0%) | 0 (0.0%) |
| Professional & Scientific | 32 (69.6%) | 14 (30.4%) |
| Enterprise Management | 0 (0.0%) | 0 (0.0%) |
| Administrative & Support | 84 (40.8%) | 122 (59.2%) |
| Educational Services | 14 (100.0%) | 0 (0.0%) |
| Health Care & Social Assistance | 81 (49.7%) | 82 (50.3%) |
| Arts, Entertainment & Recreation | 0 (0.0%) | 14 (100.0%) |
| Accommodation & Food Services | 12 (36.4%) | 21 (63.6%) |
| Public Administration | 89 (84.0%) | 17 (16.0%) |
| Total | 619 (55.4%) | 499 (44.6%) |
Education in Trucksville
School Enrollment in Trucksville
The most common levels of schooling among the 463 students in Trucksville are nursery / preschool (114 | 24.6%), graduate / professional (110 | 23.8%), and high school (87 | 18.8%).
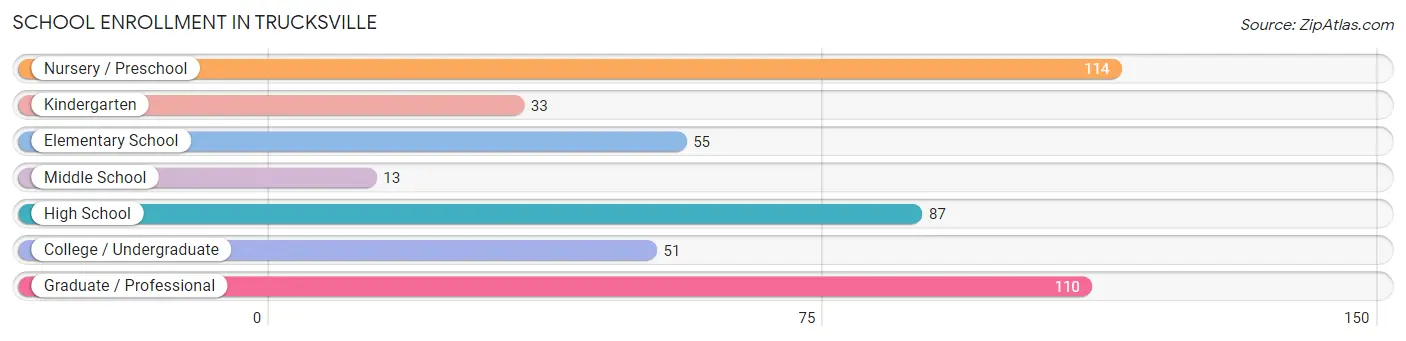
| School Level | # Students | % Students |
| Nursery / Preschool | 114 | 24.6% |
| Kindergarten | 33 | 7.1% |
| Elementary School | 55 | 11.9% |
| Middle School | 13 | 2.8% |
| High School | 87 | 18.8% |
| College / Undergraduate | 51 | 11.0% |
| Graduate / Professional | 110 | 23.8% |
| Total | 463 | 100.0% |
School Enrollment by Age by Funding Source in Trucksville
Out of a total of 463 students who are enrolled in schools in Trucksville, 187 (40.4%) attend a private institution, while the remaining 276 (59.6%) are enrolled in public schools. The age group of 25 to 34 year olds has the highest likelihood of being enrolled in private schools, with 92 (100.0% in the age bracket) enrolled. Conversely, the age group of 18 to 19 year olds has the lowest likelihood of being enrolled in a private school, with 12 (100.0% in the age bracket) attending a public institution.
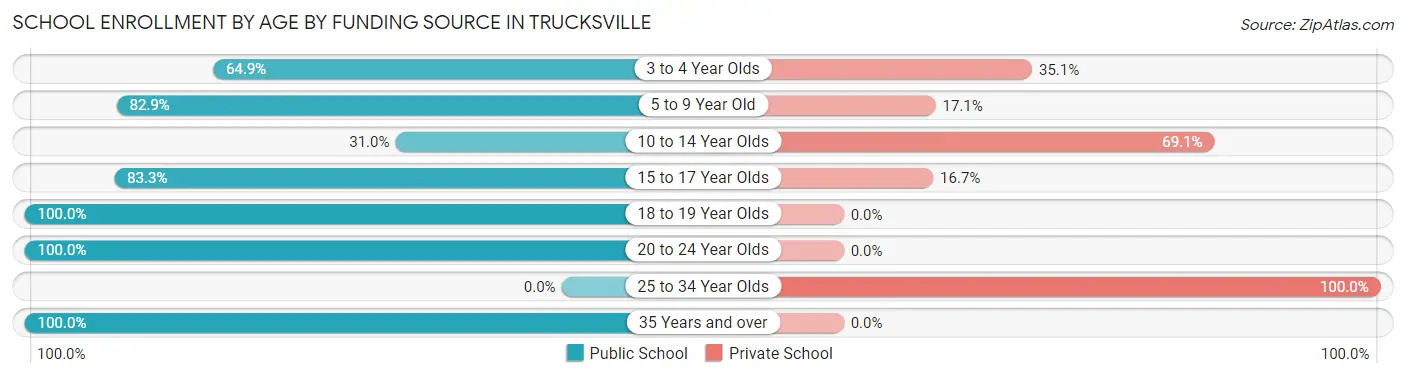
| Age Bracket | Public School | Private School |
| 3 to 4 Year Olds | 74 (64.9%) | 40 (35.1%) |
| 5 to 9 Year Old | 63 (82.9%) | 13 (17.1%) |
| 10 to 14 Year Olds | 13 (30.9%) | 29 (69.1%) |
| 15 to 17 Year Olds | 65 (83.3%) | 13 (16.7%) |
| 18 to 19 Year Olds | 12 (100.0%) | 0 (0.0%) |
| 20 to 24 Year Olds | 13 (100.0%) | 0 (0.0%) |
| 25 to 34 Year Olds | 0 (0.0%) | 92 (100.0%) |
| 35 Years and over | 36 (100.0%) | 0 (0.0%) |
| Total | 276 (59.6%) | 187 (40.4%) |
Educational Attainment by Field of Study in Trucksville
Science & technology (157 | 18.8%), business (138 | 16.6%), arts & humanities (117 | 14.0%), education (91 | 10.9%), and bio, nature & agricultural (83 | 10.0%) are the most common fields of study among 834 individuals in Trucksville who have obtained a bachelor's degree or higher.
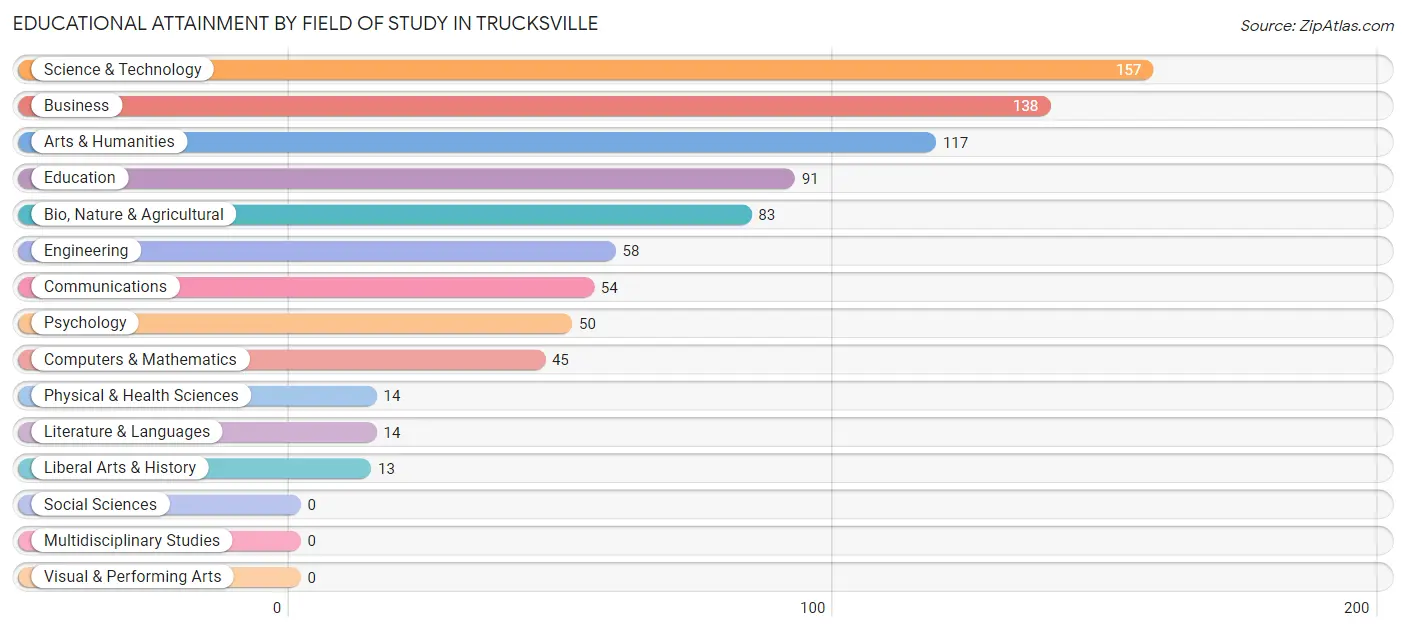
| Field of Study | # Graduates | % Graduates |
| Computers & Mathematics | 45 | 5.4% |
| Bio, Nature & Agricultural | 83 | 10.0% |
| Physical & Health Sciences | 14 | 1.7% |
| Psychology | 50 | 6.0% |
| Social Sciences | 0 | 0.0% |
| Engineering | 58 | 7.0% |
| Multidisciplinary Studies | 0 | 0.0% |
| Science & Technology | 157 | 18.8% |
| Business | 138 | 16.6% |
| Education | 91 | 10.9% |
| Literature & Languages | 14 | 1.7% |
| Liberal Arts & History | 13 | 1.6% |
| Visual & Performing Arts | 0 | 0.0% |
| Communications | 54 | 6.5% |
| Arts & Humanities | 117 | 14.0% |
| Total | 834 | 100.0% |
Transportation & Commute in Trucksville
Vehicle Availability by Sex in Trucksville
The most prevalent vehicle ownership categories in Trucksville are males with 2 vehicles (360, accounting for 58.3%) and females with 2 vehicles (233, making up 72.1%).
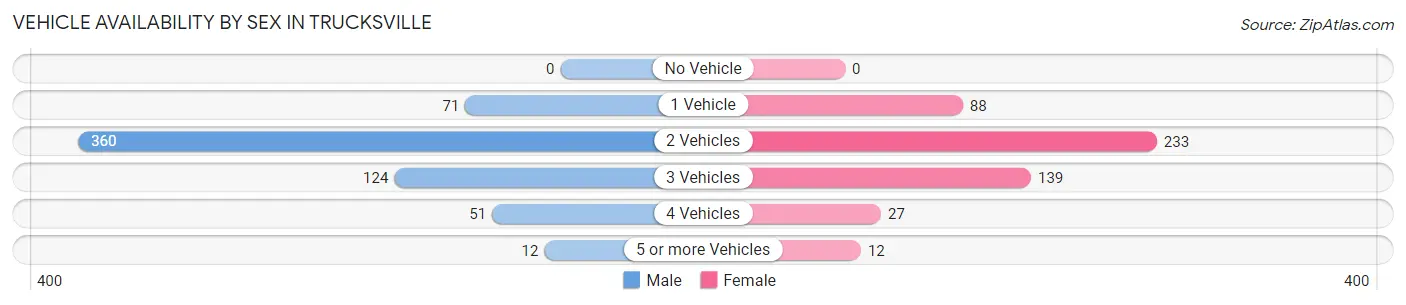
| Vehicles Available | Male | Female |
| No Vehicle | 0 (0.0%) | 0 (0.0%) |
| 1 Vehicle | 71 (11.5%) | 88 (17.6%) |
| 2 Vehicles | 360 (58.3%) | 233 (46.7%) |
| 3 Vehicles | 124 (20.1%) | 139 (27.9%) |
| 4 Vehicles | 51 (8.3%) | 27 (5.4%) |
| 5 or more Vehicles | 12 (1.9%) | 12 (2.4%) |
| Total | 618 (100.0%) | 499 (100.0%) |
Commute Time in Trucksville
The most frequently occuring commute durations in Trucksville are 30 to 34 minutes (300 commuters, 30.2%), 15 to 19 minutes (178 commuters, 17.9%), and 20 to 24 minutes (164 commuters, 16.5%).
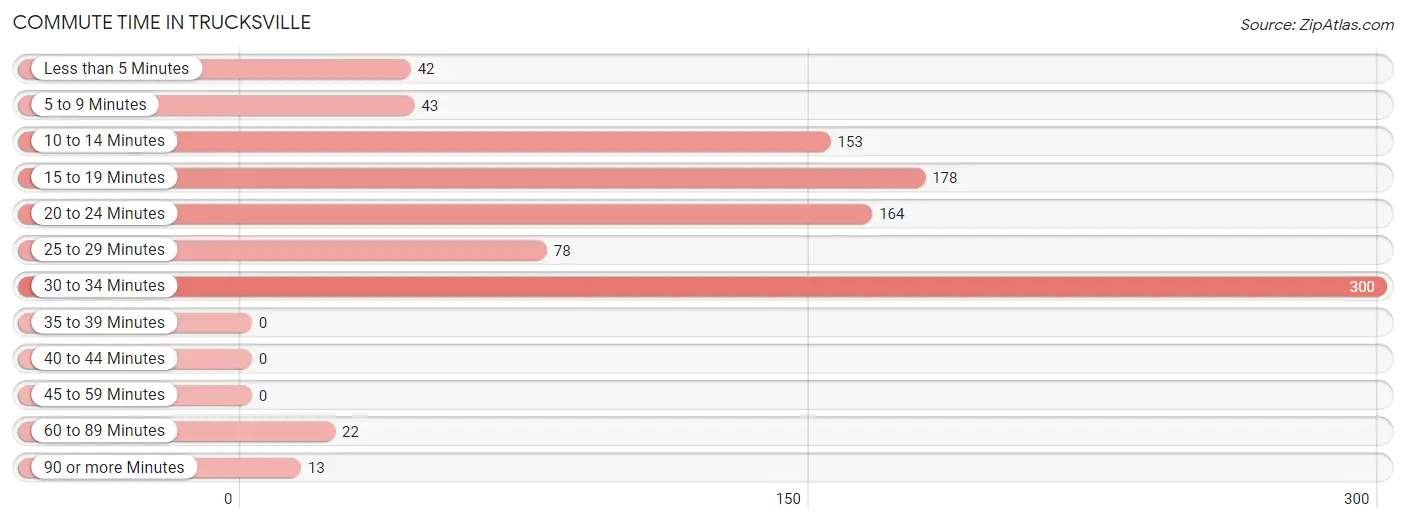
| Commute Time | # Commuters | % Commuters |
| Less than 5 Minutes | 42 | 4.2% |
| 5 to 9 Minutes | 43 | 4.3% |
| 10 to 14 Minutes | 153 | 15.4% |
| 15 to 19 Minutes | 178 | 17.9% |
| 20 to 24 Minutes | 164 | 16.5% |
| 25 to 29 Minutes | 78 | 7.9% |
| 30 to 34 Minutes | 300 | 30.2% |
| 35 to 39 Minutes | 0 | 0.0% |
| 40 to 44 Minutes | 0 | 0.0% |
| 45 to 59 Minutes | 0 | 0.0% |
| 60 to 89 Minutes | 22 | 2.2% |
| 90 or more Minutes | 13 | 1.3% |
Commute Time by Sex in Trucksville
The most common commute times in Trucksville are 30 to 34 minutes (137 commuters, 24.8%) for males and 30 to 34 minutes (163 commuters, 37.0%) for females.
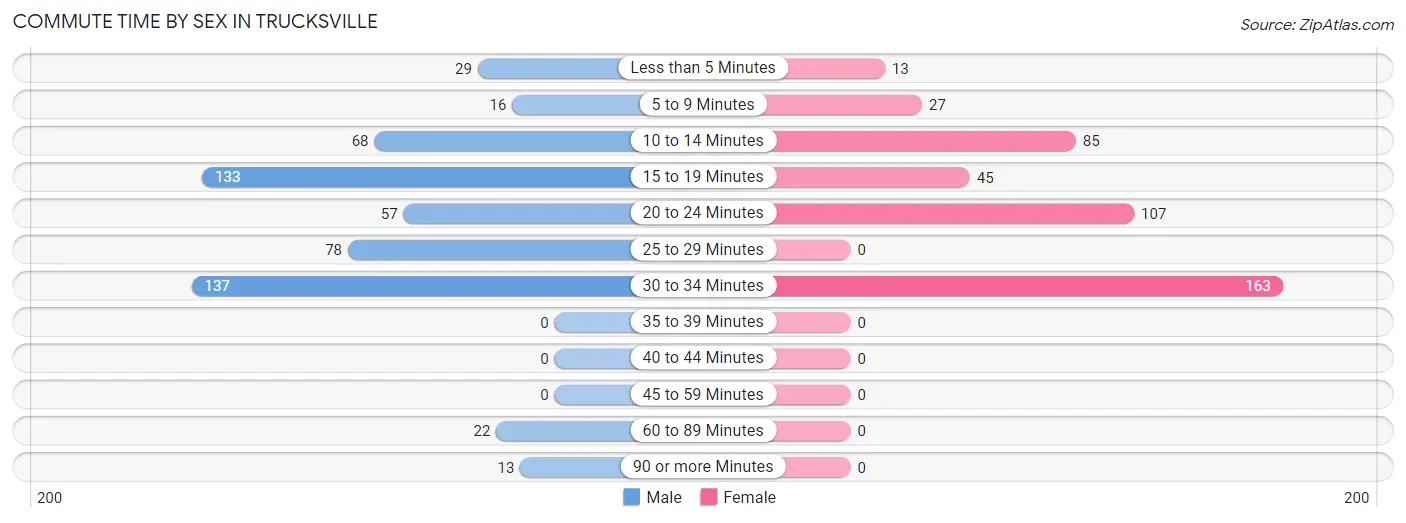
| Commute Time | Male | Female |
| Less than 5 Minutes | 29 (5.2%) | 13 (2.9%) |
| 5 to 9 Minutes | 16 (2.9%) | 27 (6.1%) |
| 10 to 14 Minutes | 68 (12.3%) | 85 (19.3%) |
| 15 to 19 Minutes | 133 (24.0%) | 45 (10.2%) |
| 20 to 24 Minutes | 57 (10.3%) | 107 (24.3%) |
| 25 to 29 Minutes | 78 (14.1%) | 0 (0.0%) |
| 30 to 34 Minutes | 137 (24.8%) | 163 (37.0%) |
| 35 to 39 Minutes | 0 (0.0%) | 0 (0.0%) |
| 40 to 44 Minutes | 0 (0.0%) | 0 (0.0%) |
| 45 to 59 Minutes | 0 (0.0%) | 0 (0.0%) |
| 60 to 89 Minutes | 22 (4.0%) | 0 (0.0%) |
| 90 or more Minutes | 13 (2.4%) | 0 (0.0%) |
Time of Departure to Work by Sex in Trucksville
The most frequent times of departure to work in Trucksville are 7:00 AM to 7:29 AM (127, 23.0%) for males and 12:00 AM to 4:59 AM (122, 27.7%) for females.
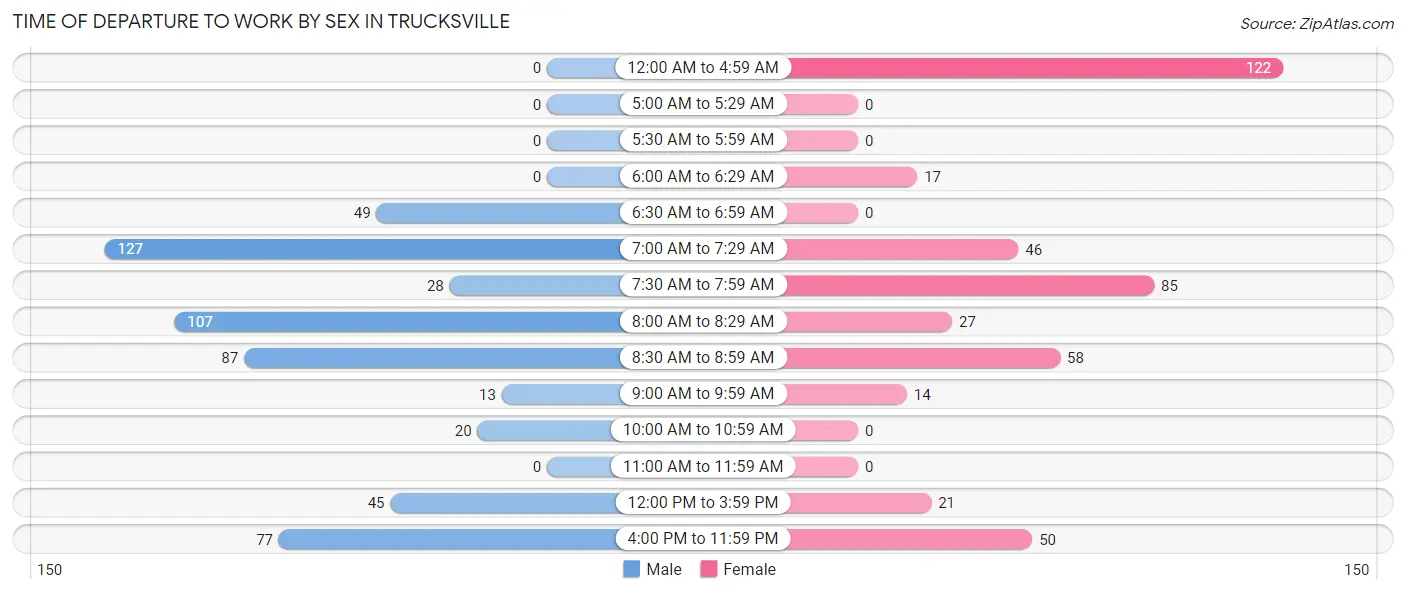
| Time of Departure | Male | Female |
| 12:00 AM to 4:59 AM | 0 (0.0%) | 122 (27.7%) |
| 5:00 AM to 5:29 AM | 0 (0.0%) | 0 (0.0%) |
| 5:30 AM to 5:59 AM | 0 (0.0%) | 0 (0.0%) |
| 6:00 AM to 6:29 AM | 0 (0.0%) | 17 (3.9%) |
| 6:30 AM to 6:59 AM | 49 (8.9%) | 0 (0.0%) |
| 7:00 AM to 7:29 AM | 127 (23.0%) | 46 (10.4%) |
| 7:30 AM to 7:59 AM | 28 (5.1%) | 85 (19.3%) |
| 8:00 AM to 8:29 AM | 107 (19.4%) | 27 (6.1%) |
| 8:30 AM to 8:59 AM | 87 (15.7%) | 58 (13.2%) |
| 9:00 AM to 9:59 AM | 13 (2.4%) | 14 (3.2%) |
| 10:00 AM to 10:59 AM | 20 (3.6%) | 0 (0.0%) |
| 11:00 AM to 11:59 AM | 0 (0.0%) | 0 (0.0%) |
| 12:00 PM to 3:59 PM | 45 (8.1%) | 21 (4.8%) |
| 4:00 PM to 11:59 PM | 77 (13.9%) | 50 (11.4%) |
| Total | 553 (100.0%) | 440 (100.0%) |
Housing Occupancy in Trucksville
Occupancy by Ownership in Trucksville
Of the total 1,102 dwellings in Trucksville, owner-occupied units account for 734 (66.6%), while renter-occupied units make up 368 (33.4%).
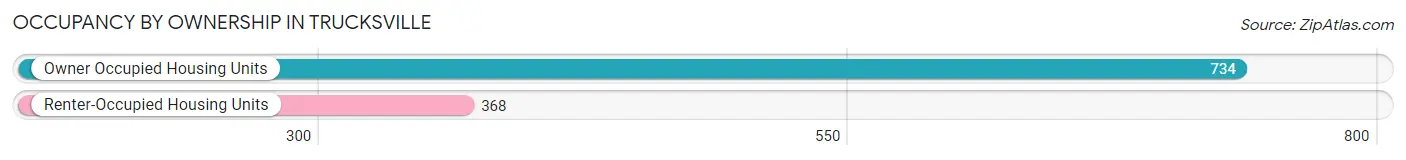
| Occupancy | # Housing Units | % Housing Units |
| Owner Occupied Housing Units | 734 | 66.6% |
| Renter-Occupied Housing Units | 368 | 33.4% |
| Total Occupied Housing Units | 1,102 | 100.0% |
Occupancy by Household Size in Trucksville
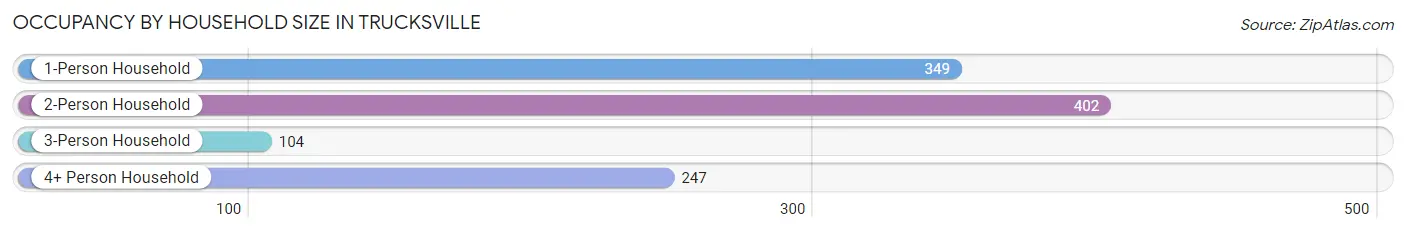
| Household Size | # Housing Units | % Housing Units |
| 1-Person Household | 349 | 31.7% |
| 2-Person Household | 402 | 36.5% |
| 3-Person Household | 104 | 9.4% |
| 4+ Person Household | 247 | 22.4% |
| Total Housing Units | 1,102 | 100.0% |
Occupancy by Ownership by Household Size in Trucksville
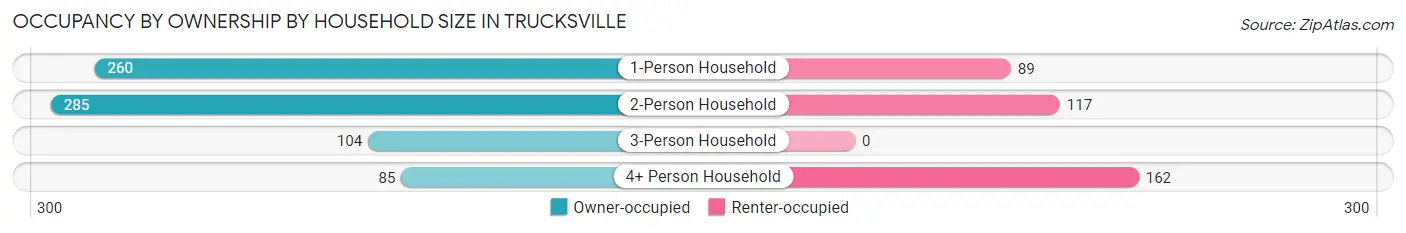
| Household Size | Owner-occupied | Renter-occupied |
| 1-Person Household | 260 (74.5%) | 89 (25.5%) |
| 2-Person Household | 285 (70.9%) | 117 (29.1%) |
| 3-Person Household | 104 (100.0%) | 0 (0.0%) |
| 4+ Person Household | 85 (34.4%) | 162 (65.6%) |
| Total Housing Units | 734 (66.6%) | 368 (33.4%) |
Occupancy by Educational Attainment in Trucksville
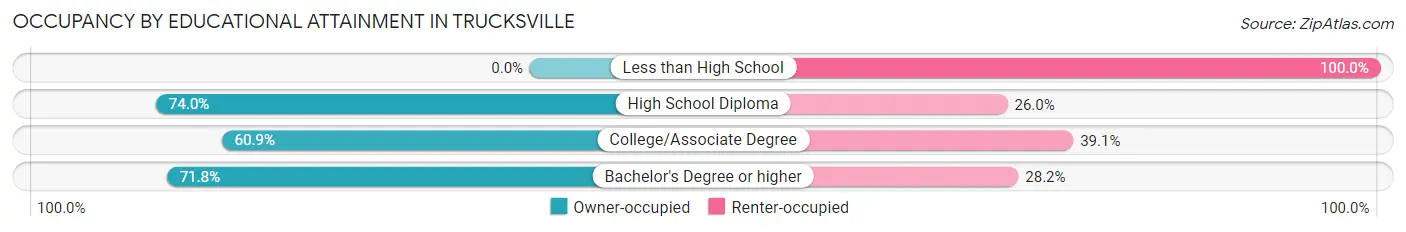
| Household Size | Owner-occupied | Renter-occupied |
| Less than High School | 0 (0.0%) | 33 (100.0%) |
| High School Diploma | 213 (74.0%) | 75 (26.0%) |
| College/Associate Degree | 223 (60.9%) | 143 (39.1%) |
| Bachelor's Degree or higher | 298 (71.8%) | 117 (28.2%) |
Occupancy by Age of Householder in Trucksville
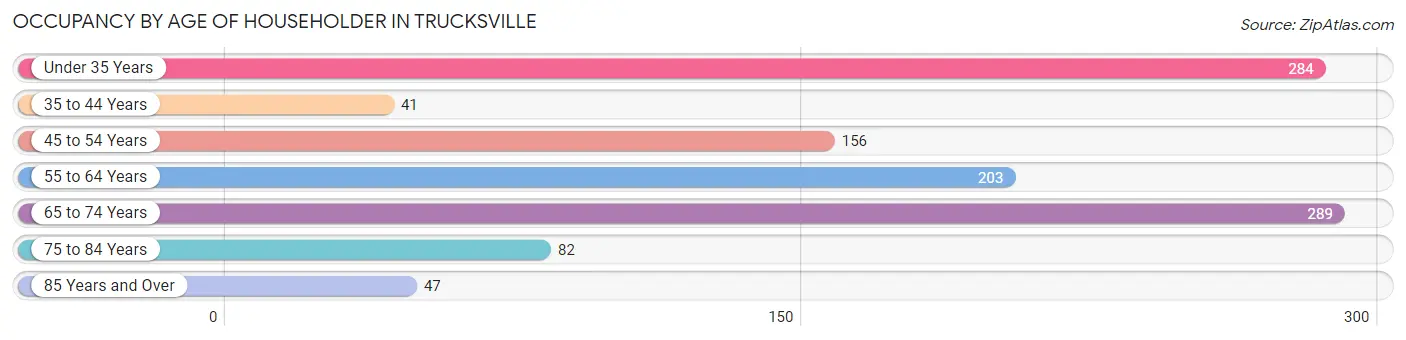
| Age Bracket | # Households | % Households |
| Under 35 Years | 284 | 25.8% |
| 35 to 44 Years | 41 | 3.7% |
| 45 to 54 Years | 156 | 14.2% |
| 55 to 64 Years | 203 | 18.4% |
| 65 to 74 Years | 289 | 26.2% |
| 75 to 84 Years | 82 | 7.4% |
| 85 Years and Over | 47 | 4.3% |
| Total | 1,102 | 100.0% |
Housing Finances in Trucksville
Median Income by Occupancy in Trucksville
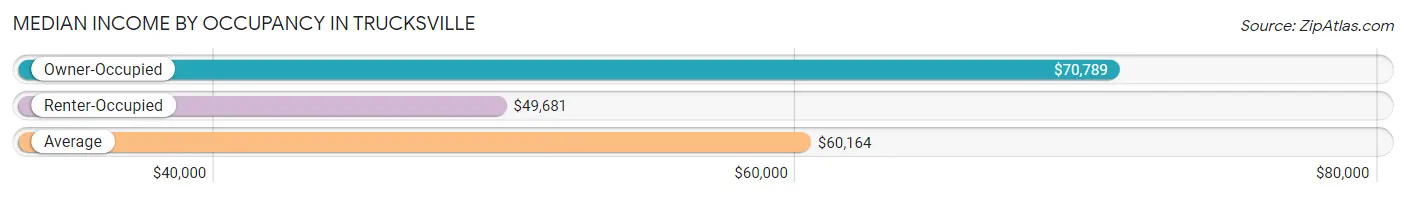
| Occupancy Type | # Households | Median Income |
| Owner-Occupied | 734 (66.6%) | $70,789 |
| Renter-Occupied | 368 (33.4%) | $49,681 |
| Average | 1,102 (100.0%) | $60,164 |
Occupancy by Householder Income Bracket in Trucksville
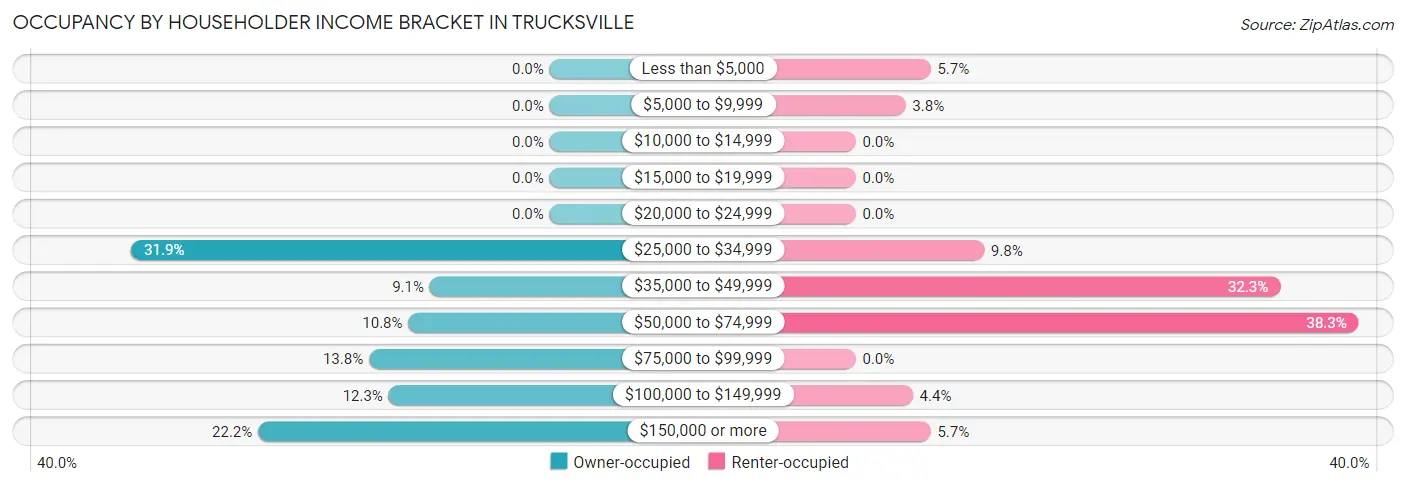
| Income Bracket | Owner-occupied | Renter-occupied |
| Less than $5,000 | 0 (0.0%) | 21 (5.7%) |
| $5,000 to $9,999 | 0 (0.0%) | 14 (3.8%) |
| $10,000 to $14,999 | 0 (0.0%) | 0 (0.0%) |
| $15,000 to $19,999 | 0 (0.0%) | 0 (0.0%) |
| $20,000 to $24,999 | 0 (0.0%) | 0 (0.0%) |
| $25,000 to $34,999 | 234 (31.9%) | 36 (9.8%) |
| $35,000 to $49,999 | 67 (9.1%) | 119 (32.3%) |
| $50,000 to $74,999 | 79 (10.8%) | 141 (38.3%) |
| $75,000 to $99,999 | 101 (13.8%) | 0 (0.0%) |
| $100,000 to $149,999 | 90 (12.3%) | 16 (4.3%) |
| $150,000 or more | 163 (22.2%) | 21 (5.7%) |
| Total | 734 (100.0%) | 368 (100.0%) |
Monthly Housing Cost Tiers in Trucksville
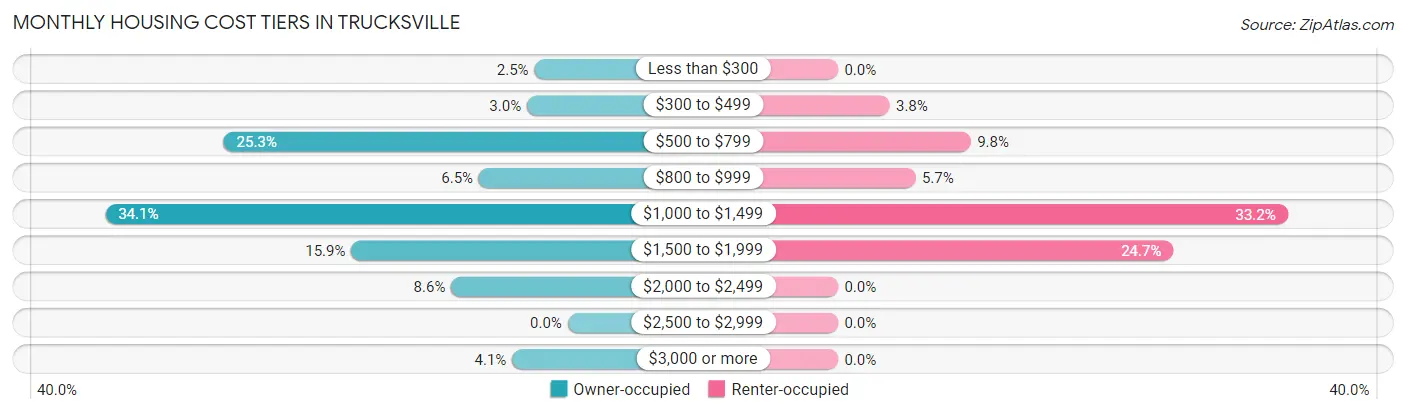
| Monthly Cost | Owner-occupied | Renter-occupied |
| Less than $300 | 18 (2.5%) | 0 (0.0%) |
| $300 to $499 | 22 (3.0%) | 14 (3.8%) |
| $500 to $799 | 186 (25.3%) | 36 (9.8%) |
| $800 to $999 | 48 (6.5%) | 21 (5.7%) |
| $1,000 to $1,499 | 250 (34.1%) | 122 (33.2%) |
| $1,500 to $1,999 | 117 (15.9%) | 91 (24.7%) |
| $2,000 to $2,499 | 63 (8.6%) | 0 (0.0%) |
| $2,500 to $2,999 | 0 (0.0%) | 0 (0.0%) |
| $3,000 or more | 30 (4.1%) | 0 (0.0%) |
| Total | 734 (100.0%) | 368 (100.0%) |
Physical Housing Characteristics in Trucksville
Housing Structures in Trucksville
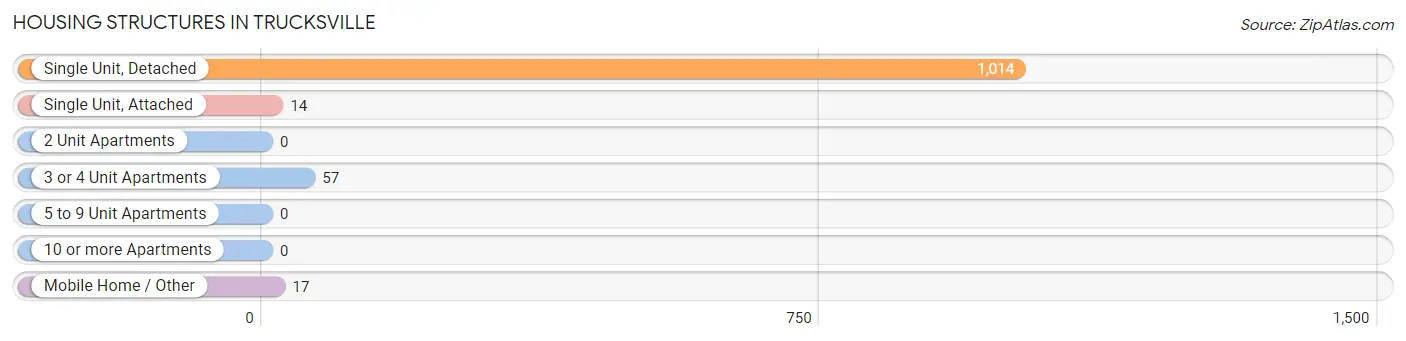
| Structure Type | # Housing Units | % Housing Units |
| Single Unit, Detached | 1,014 | 92.0% |
| Single Unit, Attached | 14 | 1.3% |
| 2 Unit Apartments | 0 | 0.0% |
| 3 or 4 Unit Apartments | 57 | 5.2% |
| 5 to 9 Unit Apartments | 0 | 0.0% |
| 10 or more Apartments | 0 | 0.0% |
| Mobile Home / Other | 17 | 1.5% |
| Total | 1,102 | 100.0% |
Housing Structures by Occupancy in Trucksville
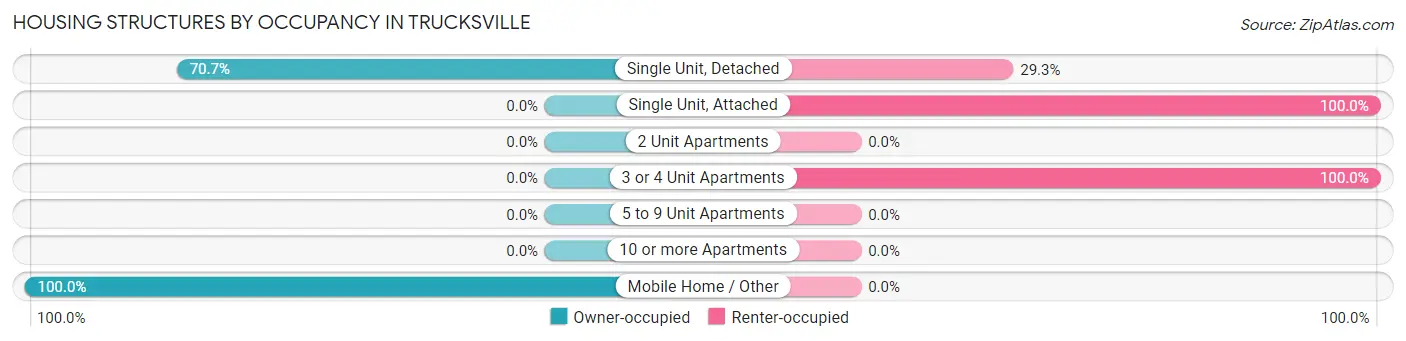
| Structure Type | Owner-occupied | Renter-occupied |
| Single Unit, Detached | 717 (70.7%) | 297 (29.3%) |
| Single Unit, Attached | 0 (0.0%) | 14 (100.0%) |
| 2 Unit Apartments | 0 (0.0%) | 0 (0.0%) |
| 3 or 4 Unit Apartments | 0 (0.0%) | 57 (100.0%) |
| 5 to 9 Unit Apartments | 0 (0.0%) | 0 (0.0%) |
| 10 or more Apartments | 0 (0.0%) | 0 (0.0%) |
| Mobile Home / Other | 17 (100.0%) | 0 (0.0%) |
| Total | 734 (66.6%) | 368 (33.4%) |
Housing Structures by Number of Rooms in Trucksville
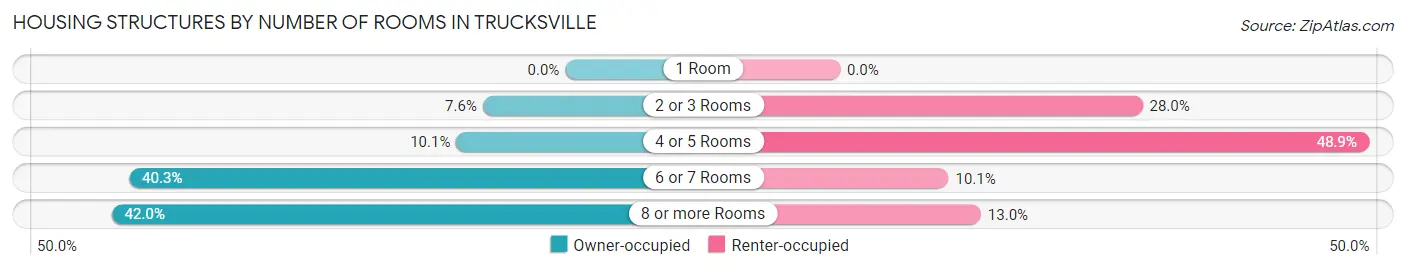
| Number of Rooms | Owner-occupied | Renter-occupied |
| 1 Room | 0 (0.0%) | 0 (0.0%) |
| 2 or 3 Rooms | 56 (7.6%) | 103 (28.0%) |
| 4 or 5 Rooms | 74 (10.1%) | 180 (48.9%) |
| 6 or 7 Rooms | 296 (40.3%) | 37 (10.1%) |
| 8 or more Rooms | 308 (42.0%) | 48 (13.0%) |
| Total | 734 (100.0%) | 368 (100.0%) |
Housing Structure by Heating Type in Trucksville
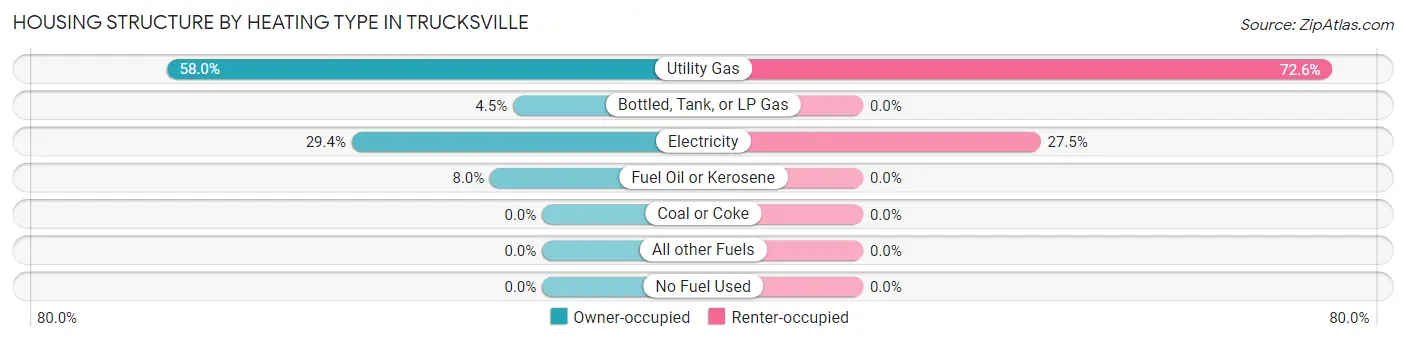
| Heating Type | Owner-occupied | Renter-occupied |
| Utility Gas | 426 (58.0%) | 267 (72.6%) |
| Bottled, Tank, or LP Gas | 33 (4.5%) | 0 (0.0%) |
| Electricity | 216 (29.4%) | 101 (27.5%) |
| Fuel Oil or Kerosene | 59 (8.0%) | 0 (0.0%) |
| Coal or Coke | 0 (0.0%) | 0 (0.0%) |
| All other Fuels | 0 (0.0%) | 0 (0.0%) |
| No Fuel Used | 0 (0.0%) | 0 (0.0%) |
| Total | 734 (100.0%) | 368 (100.0%) |
Household Vehicle Usage in Trucksville
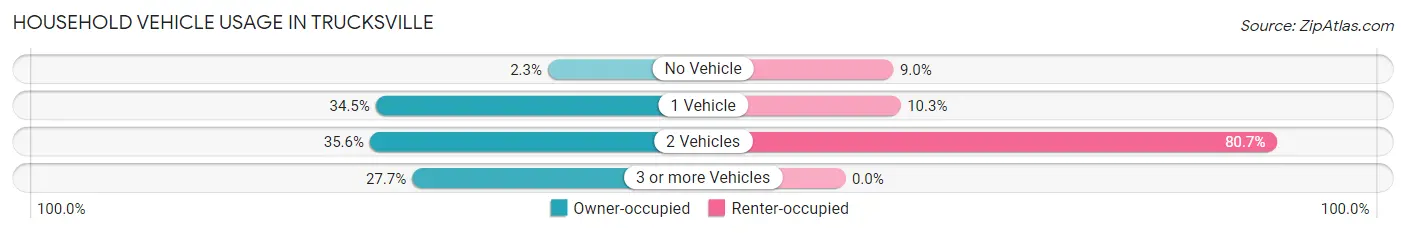
| Vehicles per Household | Owner-occupied | Renter-occupied |
| No Vehicle | 17 (2.3%) | 33 (9.0%) |
| 1 Vehicle | 253 (34.5%) | 38 (10.3%) |
| 2 Vehicles | 261 (35.6%) | 297 (80.7%) |
| 3 or more Vehicles | 203 (27.7%) | 0 (0.0%) |
| Total | 734 (100.0%) | 368 (100.0%) |
Real Estate & Mortgages in Trucksville
Real Estate and Mortgage Overview in Trucksville
| Characteristic | Without Mortgage | With Mortgage |
| Housing Units | 277 | 457 |
| Median Property Value | $163,200 | $200,900 |
| Median Household Income | $120,486 | $67 |
| Monthly Housing Costs | $701 | $18 |
| Real Estate Taxes | $3,115 | $0 |
Property Value by Mortgage Status in Trucksville
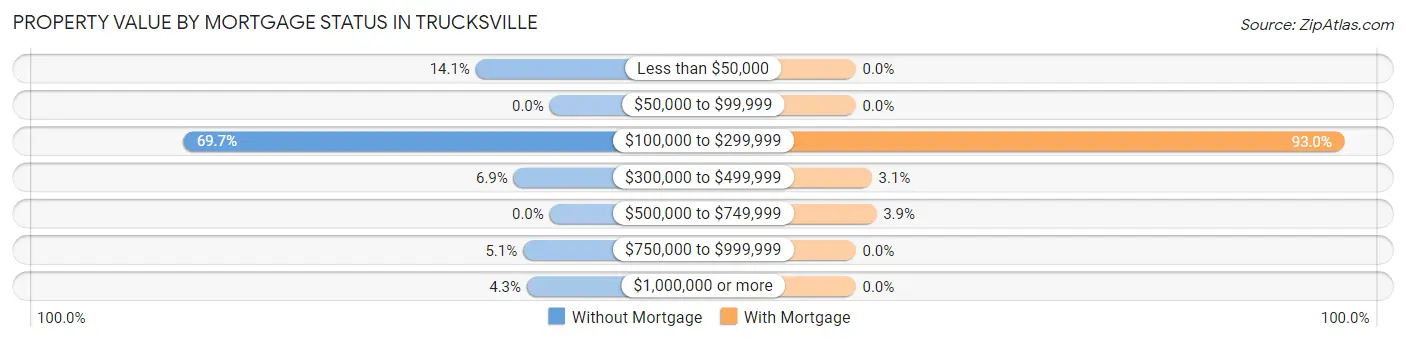
| Property Value | Without Mortgage | With Mortgage |
| Less than $50,000 | 39 (14.1%) | 0 (0.0%) |
| $50,000 to $99,999 | 0 (0.0%) | 0 (0.0%) |
| $100,000 to $299,999 | 193 (69.7%) | 425 (93.0%) |
| $300,000 to $499,999 | 19 (6.9%) | 14 (3.1%) |
| $500,000 to $749,999 | 0 (0.0%) | 18 (3.9%) |
| $750,000 to $999,999 | 14 (5.1%) | 0 (0.0%) |
| $1,000,000 or more | 12 (4.3%) | 0 (0.0%) |
| Total | 277 (100.0%) | 457 (100.0%) |
Household Income by Mortgage Status in Trucksville
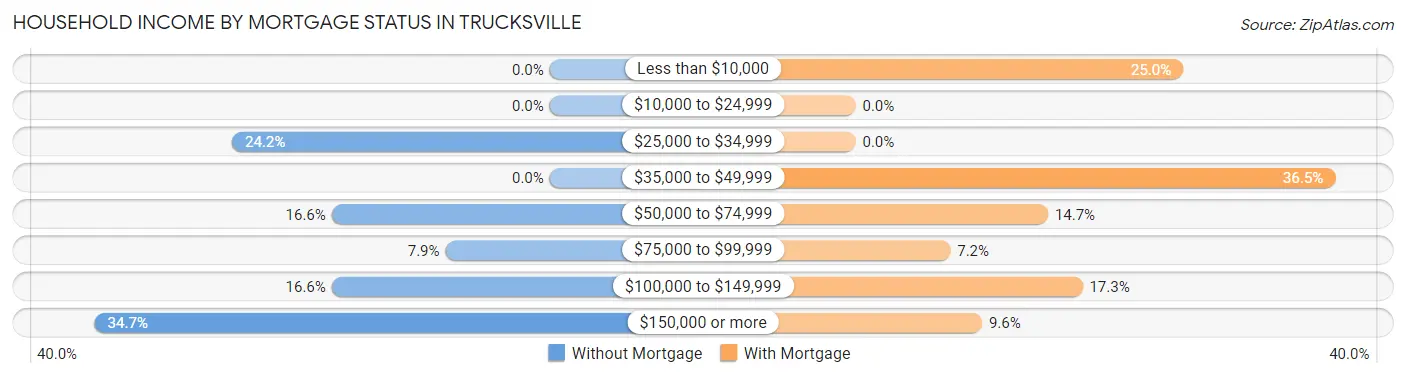
| Household Income | Without Mortgage | With Mortgage |
| Less than $10,000 | 0 (0.0%) | 114 (24.9%) |
| $10,000 to $24,999 | 0 (0.0%) | 0 (0.0%) |
| $25,000 to $34,999 | 67 (24.2%) | 0 (0.0%) |
| $35,000 to $49,999 | 0 (0.0%) | 167 (36.5%) |
| $50,000 to $74,999 | 46 (16.6%) | 67 (14.7%) |
| $75,000 to $99,999 | 22 (7.9%) | 33 (7.2%) |
| $100,000 to $149,999 | 46 (16.6%) | 79 (17.3%) |
| $150,000 or more | 96 (34.7%) | 44 (9.6%) |
| Total | 277 (100.0%) | 457 (100.0%) |
Property Value to Household Income Ratio in Trucksville
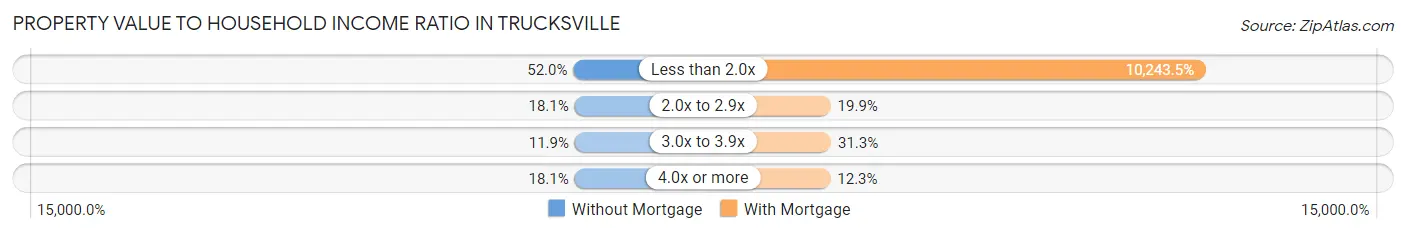
| Value-to-Income Ratio | Without Mortgage | With Mortgage |
| Less than 2.0x | 144 (52.0%) | 46,813 (10,243.5%) |
| 2.0x to 2.9x | 50 (18.0%) | 91 (19.9%) |
| 3.0x to 3.9x | 33 (11.9%) | 143 (31.3%) |
| 4.0x or more | 50 (18.0%) | 56 (12.2%) |
| Total | 277 (100.0%) | 457 (100.0%) |
Real Estate Taxes by Mortgage Status in Trucksville
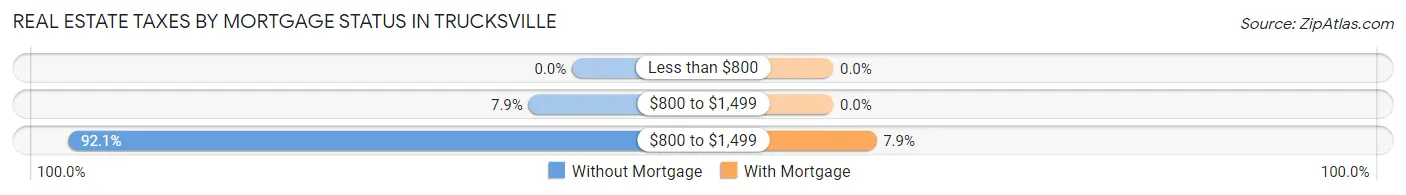
| Property Taxes | Without Mortgage | With Mortgage |
| Less than $800 | 0 (0.0%) | 0 (0.0%) |
| $800 to $1,499 | 22 (7.9%) | 0 (0.0%) |
| $800 to $1,499 | 255 (92.1%) | 36 (7.9%) |
| Total | 277 (100.0%) | 457 (100.0%) |
Health & Disability in Trucksville
Health Insurance Coverage by Age in Trucksville
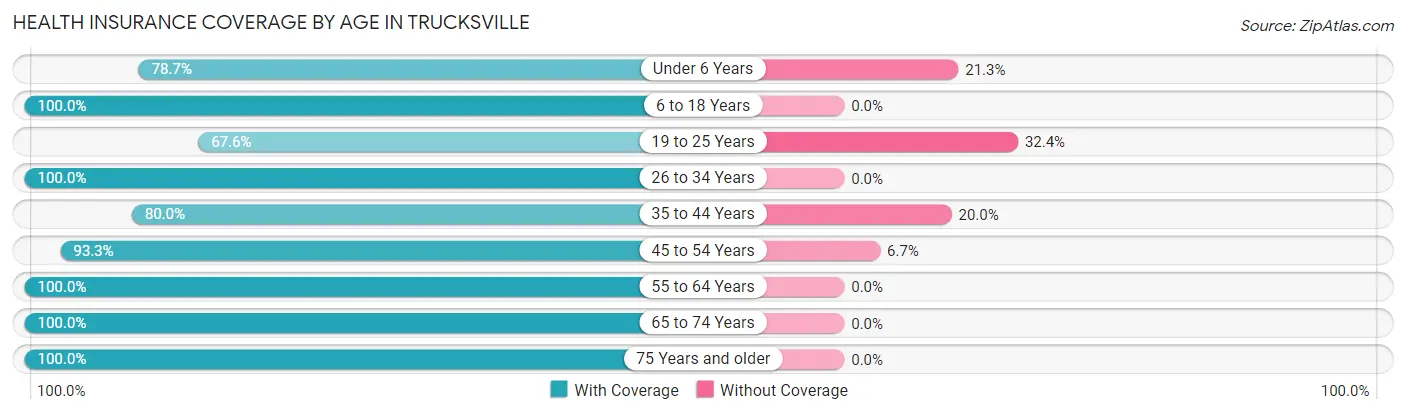
| Age Bracket | With Coverage | Without Coverage |
| Under 6 Years | 200 (78.7%) | 54 (21.3%) |
| 6 to 18 Years | 175 (100.0%) | 0 (0.0%) |
| 19 to 25 Years | 71 (67.6%) | 34 (32.4%) |
| 26 to 34 Years | 494 (100.0%) | 0 (0.0%) |
| 35 to 44 Years | 76 (80.0%) | 19 (20.0%) |
| 45 to 54 Years | 266 (93.3%) | 19 (6.7%) |
| 55 to 64 Years | 404 (100.0%) | 0 (0.0%) |
| 65 to 74 Years | 400 (100.0%) | 0 (0.0%) |
| 75 Years and older | 176 (100.0%) | 0 (0.0%) |
| Total | 2,262 (94.7%) | 126 (5.3%) |
Health Insurance Coverage by Citizenship Status in Trucksville
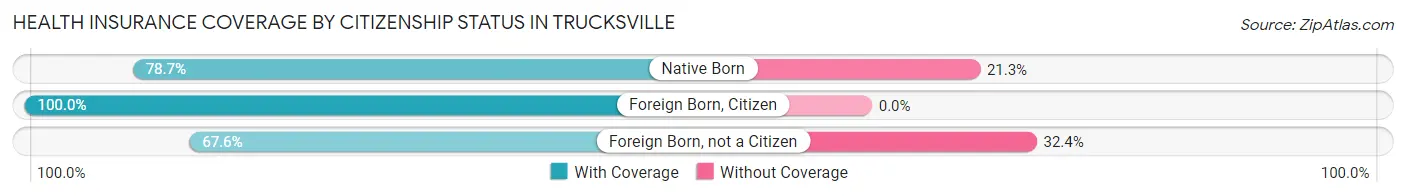
| Citizenship Status | With Coverage | Without Coverage |
| Native Born | 200 (78.7%) | 54 (21.3%) |
| Foreign Born, Citizen | 175 (100.0%) | 0 (0.0%) |
| Foreign Born, not a Citizen | 71 (67.6%) | 34 (32.4%) |
Health Insurance Coverage by Household Income in Trucksville
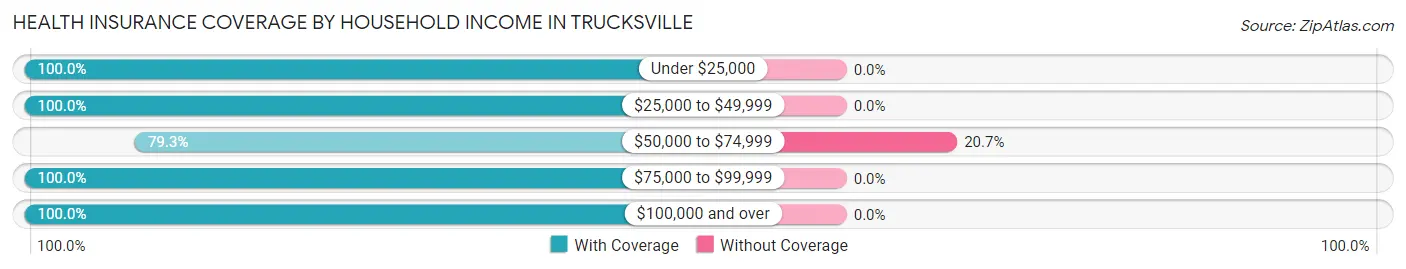
| Household Income | With Coverage | Without Coverage |
| Under $25,000 | 35 (100.0%) | 0 (0.0%) |
| $25,000 to $49,999 | 672 (100.0%) | 0 (0.0%) |
| $50,000 to $74,999 | 483 (79.3%) | 126 (20.7%) |
| $75,000 to $99,999 | 257 (100.0%) | 0 (0.0%) |
| $100,000 and over | 808 (100.0%) | 0 (0.0%) |
Public vs Private Health Insurance Coverage by Age in Trucksville
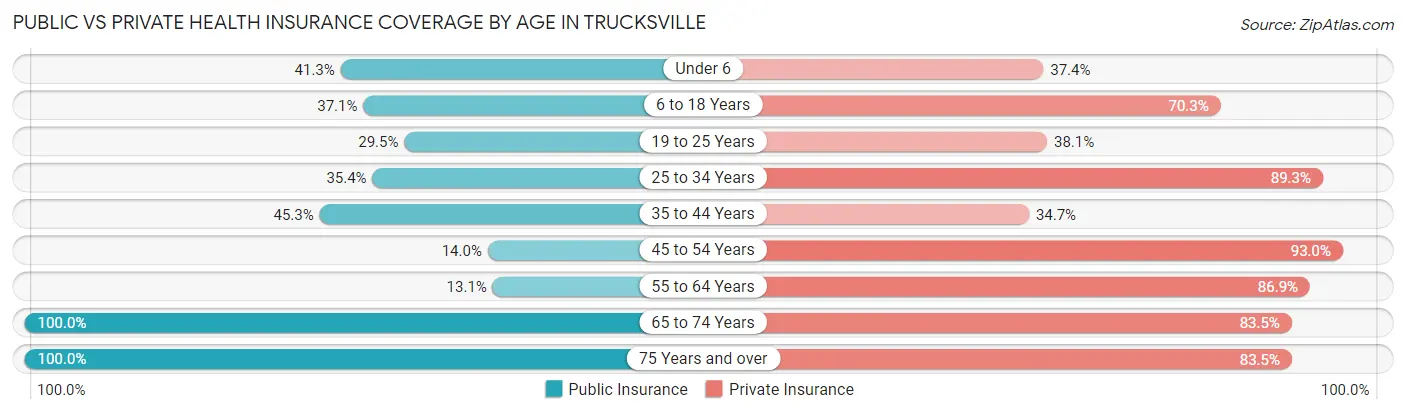
| Age Bracket | Public Insurance | Private Insurance |
| Under 6 | 105 (41.3%) | 95 (37.4%) |
| 6 to 18 Years | 65 (37.1%) | 123 (70.3%) |
| 19 to 25 Years | 31 (29.5%) | 40 (38.1%) |
| 25 to 34 Years | 175 (35.4%) | 441 (89.3%) |
| 35 to 44 Years | 43 (45.3%) | 33 (34.7%) |
| 45 to 54 Years | 40 (14.0%) | 265 (93.0%) |
| 55 to 64 Years | 53 (13.1%) | 351 (86.9%) |
| 65 to 74 Years | 400 (100.0%) | 334 (83.5%) |
| 75 Years and over | 176 (100.0%) | 147 (83.5%) |
| Total | 1,088 (45.6%) | 1,829 (76.6%) |
Disability Status by Sex by Age in Trucksville
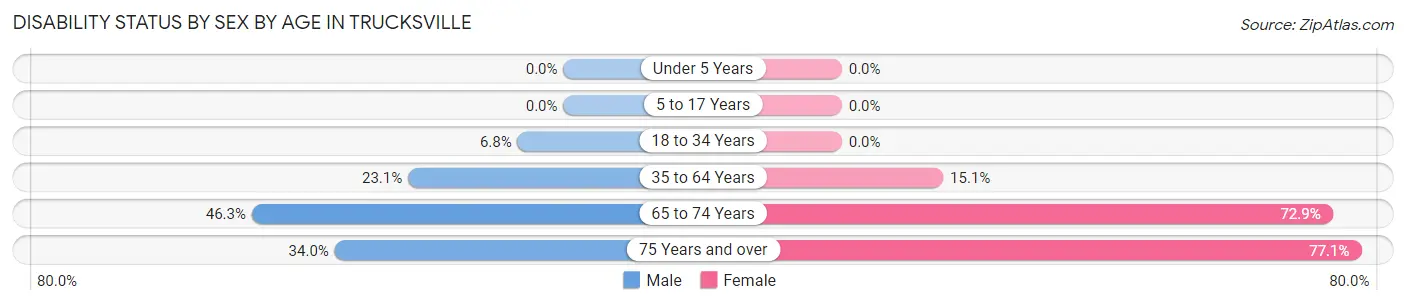
| Age Bracket | Male | Female |
| Under 5 Years | 0 (0.0%) | 0 (0.0%) |
| 5 to 17 Years | 0 (0.0%) | 0 (0.0%) |
| 18 to 34 Years | 17 (6.8%) | 0 (0.0%) |
| 35 to 64 Years | 95 (23.1%) | 56 (15.0%) |
| 65 to 74 Years | 93 (46.3%) | 145 (72.9%) |
| 75 Years and over | 36 (34.0%) | 54 (77.1%) |
Disability Class by Sex by Age in Trucksville
Disability Class: Hearing Difficulty
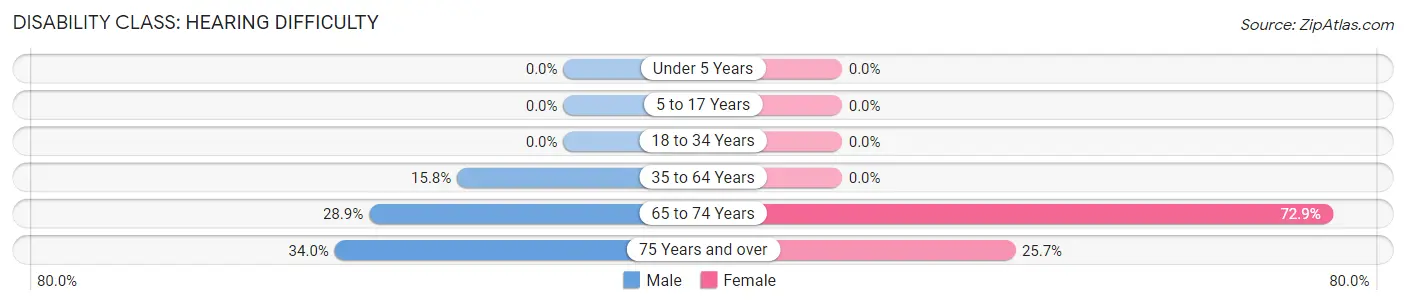
| Age Bracket | Male | Female |
| Under 5 Years | 0 (0.0%) | 0 (0.0%) |
| 5 to 17 Years | 0 (0.0%) | 0 (0.0%) |
| 18 to 34 Years | 0 (0.0%) | 0 (0.0%) |
| 35 to 64 Years | 65 (15.8%) | 0 (0.0%) |
| 65 to 74 Years | 58 (28.9%) | 145 (72.9%) |
| 75 Years and over | 36 (34.0%) | 18 (25.7%) |
Disability Class: Vision Difficulty
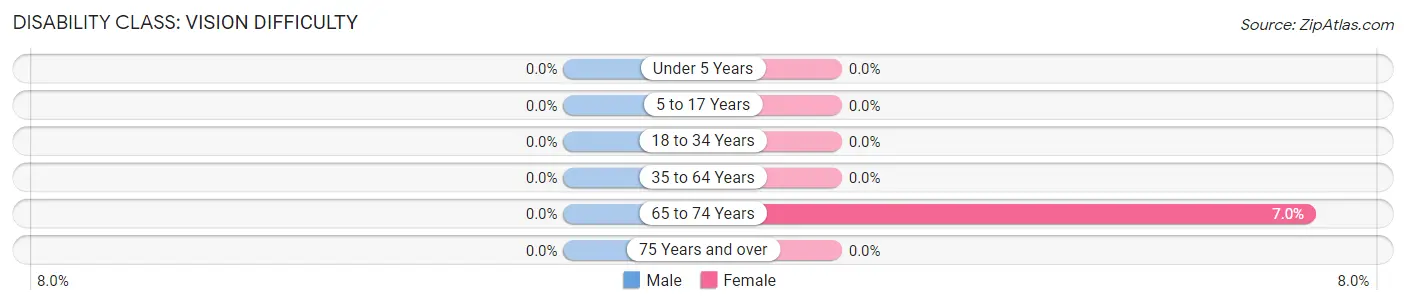
| Age Bracket | Male | Female |
| Under 5 Years | 0 (0.0%) | 0 (0.0%) |
| 5 to 17 Years | 0 (0.0%) | 0 (0.0%) |
| 18 to 34 Years | 0 (0.0%) | 0 (0.0%) |
| 35 to 64 Years | 0 (0.0%) | 0 (0.0%) |
| 65 to 74 Years | 0 (0.0%) | 14 (7.0%) |
| 75 Years and over | 0 (0.0%) | 0 (0.0%) |
Disability Class: Cognitive Difficulty
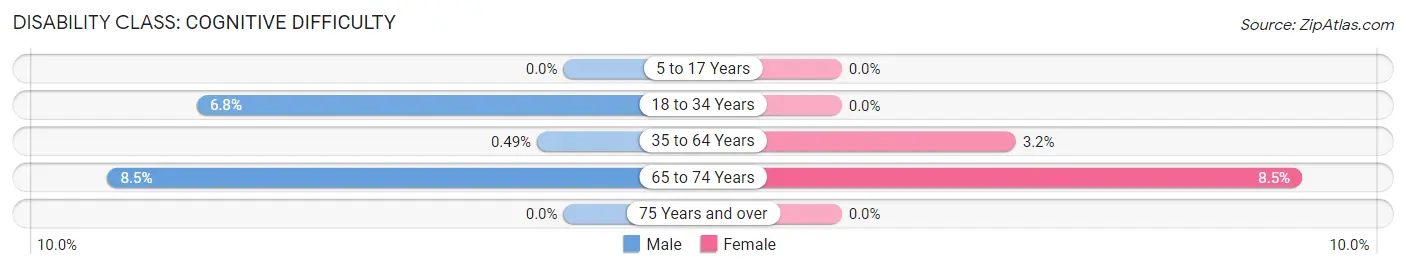
| Age Bracket | Male | Female |
| 5 to 17 Years | 0 (0.0%) | 0 (0.0%) |
| 18 to 34 Years | 17 (6.8%) | 0 (0.0%) |
| 35 to 64 Years | 2 (0.5%) | 12 (3.2%) |
| 65 to 74 Years | 17 (8.5%) | 17 (8.5%) |
| 75 Years and over | 0 (0.0%) | 0 (0.0%) |
Disability Class: Ambulatory Difficulty
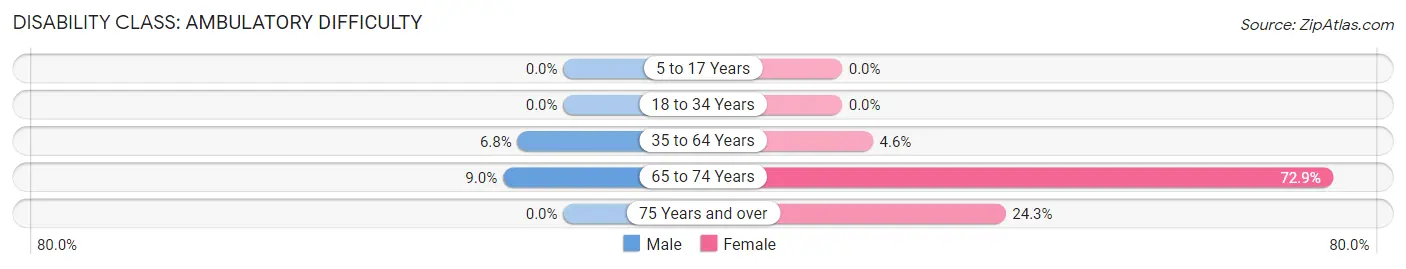
| Age Bracket | Male | Female |
| 5 to 17 Years | 0 (0.0%) | 0 (0.0%) |
| 18 to 34 Years | 0 (0.0%) | 0 (0.0%) |
| 35 to 64 Years | 28 (6.8%) | 17 (4.6%) |
| 65 to 74 Years | 18 (9.0%) | 145 (72.9%) |
| 75 Years and over | 0 (0.0%) | 17 (24.3%) |
Disability Class: Self-Care Difficulty
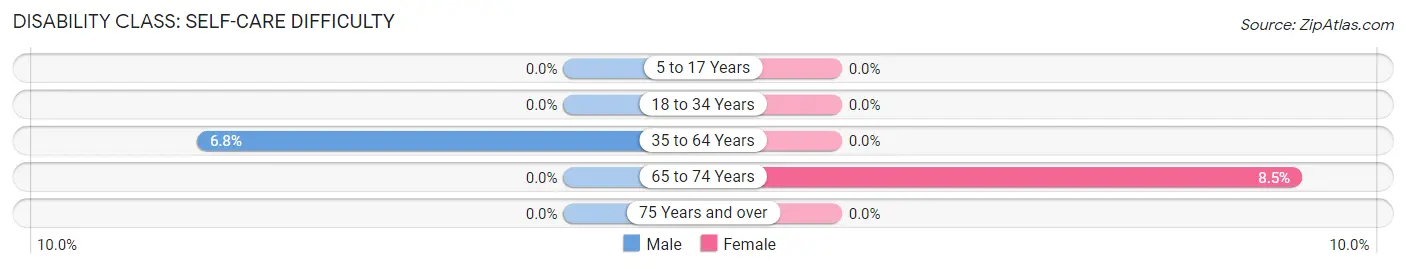
| Age Bracket | Male | Female |
| 5 to 17 Years | 0 (0.0%) | 0 (0.0%) |
| 18 to 34 Years | 0 (0.0%) | 0 (0.0%) |
| 35 to 64 Years | 28 (6.8%) | 0 (0.0%) |
| 65 to 74 Years | 0 (0.0%) | 17 (8.5%) |
| 75 Years and over | 0 (0.0%) | 0 (0.0%) |
Technology Access in Trucksville
Computing Device Access in Trucksville
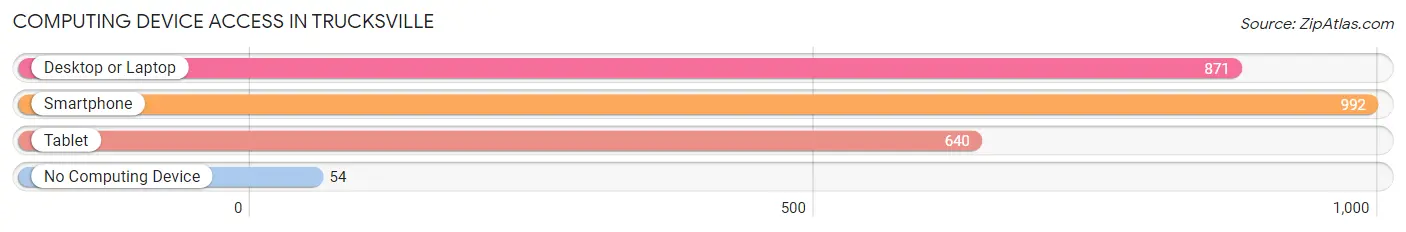
| Device Type | # Households | % Households |
| Desktop or Laptop | 871 | 79.0% |
| Smartphone | 992 | 90.0% |
| Tablet | 640 | 58.1% |
| No Computing Device | 54 | 4.9% |
| Total | 1,102 | 100.0% |
Internet Access in Trucksville
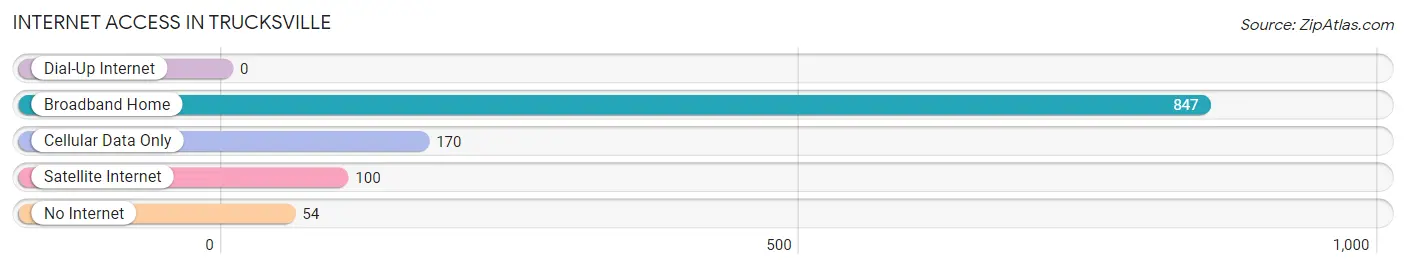
| Internet Type | # Households | % Households |
| Dial-Up Internet | 0 | 0.0% |
| Broadband Home | 847 | 76.9% |
| Cellular Data Only | 170 | 15.4% |
| Satellite Internet | 100 | 9.1% |
| No Internet | 54 | 4.9% |
| Total | 1,102 | 100.0% |
Trucksville Summary
Trucksville is a small borough located in Luzerne County, Pennsylvania. It is situated in the Wyoming Valley, a region of the Northeastern United States. The borough is located approximately 8 miles south of Wilkes-Barre, the county seat. The population of Trucksville was 1,845 at the 2010 census.
History
Trucksville was first settled in the late 1700s by a group of German immigrants. The town was originally known as “Truckersville”, named after the truckers who traveled through the area. The name was eventually shortened to “Trucksville”. The town was officially incorporated in 1845.
In the late 1800s, Trucksville was a thriving industrial center. The town was home to several coal mines, brickyards, and other factories. The town also had a large number of stores and businesses.
Geography
Trucksville is located in the Wyoming Valley, a region of the Northeastern United States. The borough is situated in the foothills of the Pocono Mountains. The town is located approximately 8 miles south of Wilkes-Barre, the county seat.
The borough is situated along the Susquehanna River. The river is a major source of recreation for the town, with fishing, boating, and swimming being popular activities.
The climate in Trucksville is humid continental, with cold winters and hot, humid summers. The average annual temperature is around 50°F.
Economy
Trucksville’s economy is largely based on tourism and retail. The town is home to several small businesses, including restaurants, shops, and galleries. The town also has a number of bed and breakfasts, which attract visitors from all over the region.
The town is also home to several manufacturing companies, including a paper mill and a plastics factory. The town also has a number of coal mines, which provide jobs for many of the town’s residents.
Demographics
As of the 2010 census, the population of Trucksville was 1,845. The racial makeup of the town was 97.3% White, 0.9% African American, 0.2% Native American, 0.4% Asian, and 0.9% from other races. Hispanic or Latino of any race were 1.2% of the population.
The median household income in Trucksville was $41,250, and the median family income was $50,000. The per capita income for the town was $20,945. About 8.3% of families and 10.2% of the population were below the poverty line.
Trucksville is a small, rural town with a rich history and a strong sense of community. The town is home to a diverse population, and its economy is largely based on tourism and retail. The town is situated in a beautiful area of the Northeastern United States, and it is a popular destination for visitors from all over the region.
Common Questions
What is Per Capita Income in Trucksville?
Per Capita income in Trucksville is $42,002.
What is the Median Family Income in Trucksville?
Median Family Income in Trucksville is $66,161.
What is the Median Household income in Trucksville?
Median Household Income in Trucksville is $60,164.
What is Income or Wage Gap in Trucksville?
Income or Wage Gap in Trucksville is 34.3%.
Women in Trucksville earn 65.7 cents for every dollar earned by a man.
What is Inequality or Gini Index in Trucksville?
Inequality or Gini Index in Trucksville is 0.49.
What is the Total Population of Trucksville?
Total Population of Trucksville is 2,388.
What is the Total Male Population of Trucksville?
Total Male Population of Trucksville is 1,184.
What is the Total Female Population of Trucksville?
Total Female Population of Trucksville is 1,204.
What is the Ratio of Males per 100 Females in Trucksville?
There are 98.34 Males per 100 Females in Trucksville.
What is the Ratio of Females per 100 Males in Trucksville?
There are 101.69 Females per 100 Males in Trucksville.
What is the Median Population Age in Trucksville?
Median Population Age in Trucksville is 49.2 Years.
What is the Average Family Size in Trucksville
Average Family Size in Trucksville is 2.6 People.
What is the Average Household Size in Trucksville
Average Household Size in Trucksville is 2.2 People.
How Large is the Labor Force in Trucksville?
There are 1,174 People in the Labor Forcein in Trucksville.
What is the Percentage of People in the Labor Force in Trucksville?
58.2% of People are in the Labor Force in Trucksville.
What is the Unemployment Rate in Trucksville?
Unemployment Rate in Trucksville is 4.7%.