Midland borough, PA Map & Demographics
Midland borough Overview
$30,538
PER CAPITA INCOME
$66,563
AVG FAMILY INCOME
$61,083
AVG HOUSEHOLD INCOME
7.7%
WAGE / INCOME GAP [ % ]
92.3¢/ $1
WAGE / INCOME GAP [ $ ]
0.43
INEQUALITY / GINI INDEX
2,658
TOTAL POPULATION
1,251
MALE POPULATION
1,407
FEMALE POPULATION
88.91
MALES / 100 FEMALES
112.47
FEMALES / 100 MALES
46.1
MEDIAN AGE
2.9
AVG FAMILY SIZE
2.4
AVG HOUSEHOLD SIZE
1,344
LABOR FORCE [ PEOPLE ]
62.3%
PERCENT IN LABOR FORCE
11.2%
UNEMPLOYMENT RATE
Income in Midland borough
Income Overview in Midland borough
Per Capita Income in Midland borough is $30,538, while median incomes of families and households are $66,563 and $61,083 respectively.
| Characteristic | Number | Measure |
| Per Capita Income | 2,658 | $30,538 |
| Median Family Income | 739 | $66,563 |
| Mean Family Income | 739 | $86,399 |
| Median Household Income | 1,116 | $61,083 |
| Mean Household Income | 1,116 | $71,016 |
| Income Deficit | 739 | $0 |
| Wage / Income Gap (%) | 2,658 | 7.67% |
| Wage / Income Gap ($) | 2,658 | 92.33¢ per $1 |
| Gini / Inequality Index | 2,658 | 0.43 |
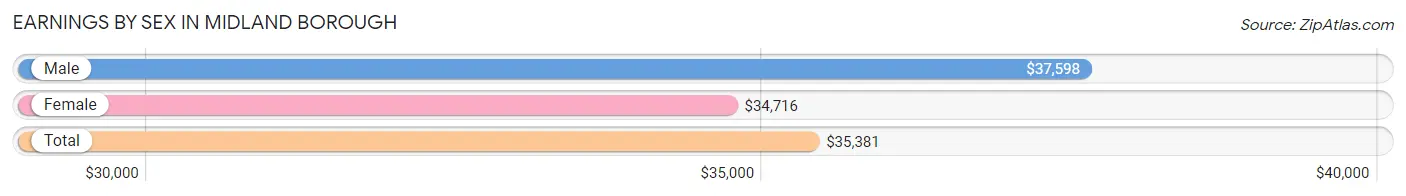
Earnings by Sex in Midland borough
Average Earnings in Midland borough are $35,381, $37,598 for men and $34,716 for women, a difference of 7.7%.
| Sex | Number | Average Earnings |
| Male | 660 (46.1%) | $37,598 |
| Female | 772 (53.9%) | $34,716 |
| Total | 1,432 (100.0%) | $35,381 |
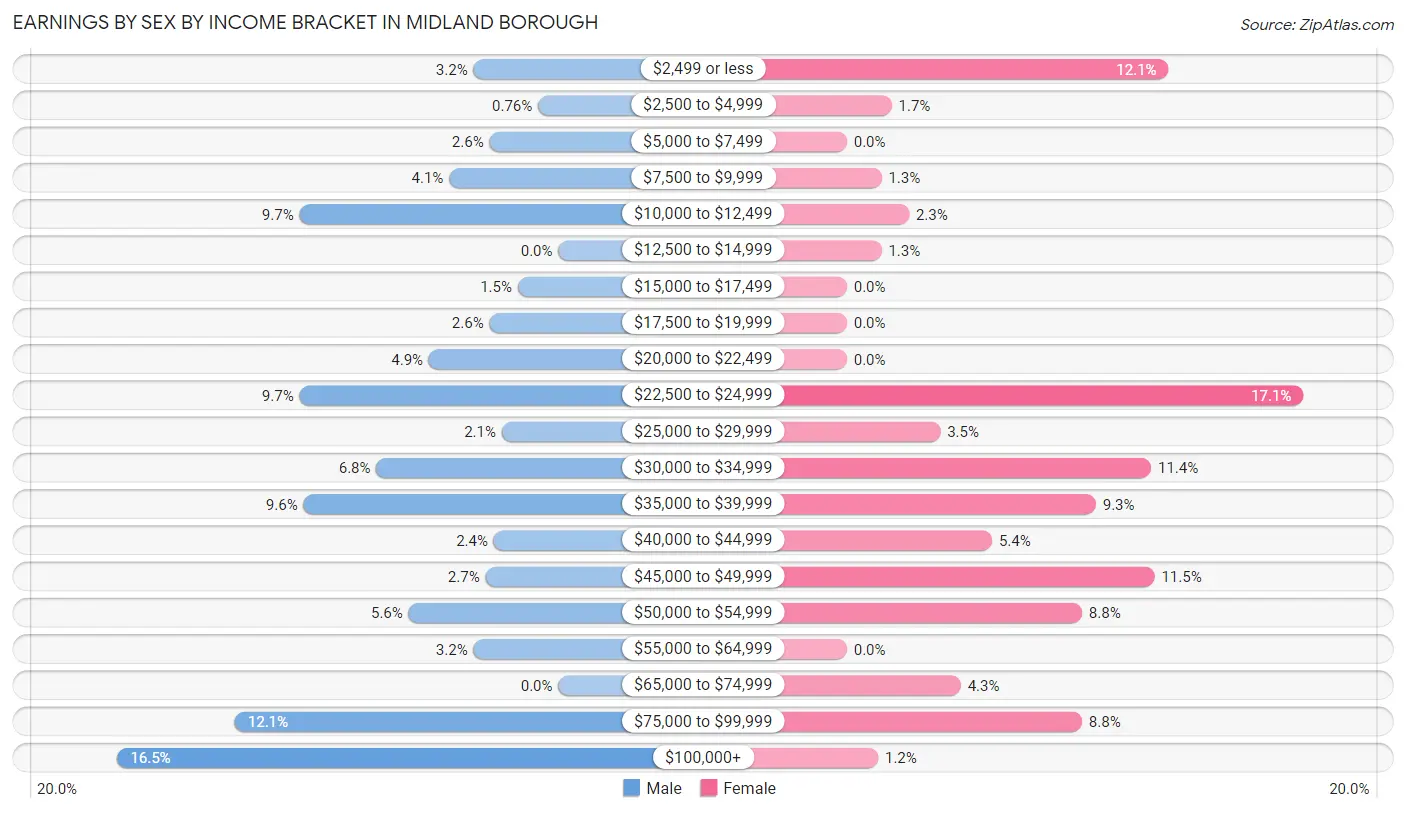
Earnings by Sex by Income Bracket in Midland borough
The most common earnings brackets in Midland borough are $100,000+ for men (109 | 16.5%) and $22,500 to $24,999 for women (132 | 17.1%).
| Income | Male | Female |
| $2,499 or less | 21 (3.2%) | 93 (12.0%) |
| $2,500 to $4,999 | 5 (0.8%) | 13 (1.7%) |
| $5,000 to $7,499 | 17 (2.6%) | 0 (0.0%) |
| $7,500 to $9,999 | 27 (4.1%) | 10 (1.3%) |
| $10,000 to $12,499 | 64 (9.7%) | 18 (2.3%) |
| $12,500 to $14,999 | 0 (0.0%) | 10 (1.3%) |
| $15,000 to $17,499 | 10 (1.5%) | 0 (0.0%) |
| $17,500 to $19,999 | 17 (2.6%) | 0 (0.0%) |
| $20,000 to $22,499 | 32 (4.9%) | 0 (0.0%) |
| $22,500 to $24,999 | 64 (9.7%) | 132 (17.1%) |
| $25,000 to $29,999 | 14 (2.1%) | 27 (3.5%) |
| $30,000 to $34,999 | 45 (6.8%) | 88 (11.4%) |
| $35,000 to $39,999 | 63 (9.6%) | 72 (9.3%) |
| $40,000 to $44,999 | 16 (2.4%) | 42 (5.4%) |
| $45,000 to $49,999 | 18 (2.7%) | 89 (11.5%) |
| $50,000 to $54,999 | 37 (5.6%) | 68 (8.8%) |
| $55,000 to $64,999 | 21 (3.2%) | 0 (0.0%) |
| $65,000 to $74,999 | 0 (0.0%) | 33 (4.3%) |
| $75,000 to $99,999 | 80 (12.1%) | 68 (8.8%) |
| $100,000+ | 109 (16.5%) | 9 (1.2%) |
| Total | 660 (100.0%) | 772 (100.0%) |
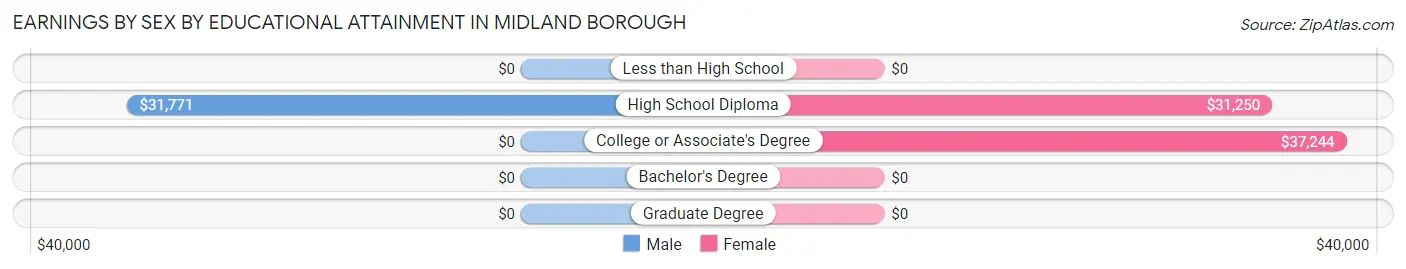
Earnings by Sex by Educational Attainment in Midland borough
Average earnings in Midland borough are $47,431 for men and $37,314 for women, a difference of 21.3%. Men with an educational attainment of high school diploma enjoy the highest average annual earnings of $31,771, while those with high school diploma education earn the least with $31,771. Women with an educational attainment of college or associate's degree earn the most with the average annual earnings of $37,244, while those with high school diploma education have the smallest earnings of $31,250.
| Educational Attainment | Male Income | Female Income |
| Less than High School | - | - |
| High School Diploma | $31,771 | $31,250 |
| College or Associate's Degree | - | - |
| Bachelor's Degree | - | - |
| Graduate Degree | - | - |
| Total | $47,431 | $37,314 |
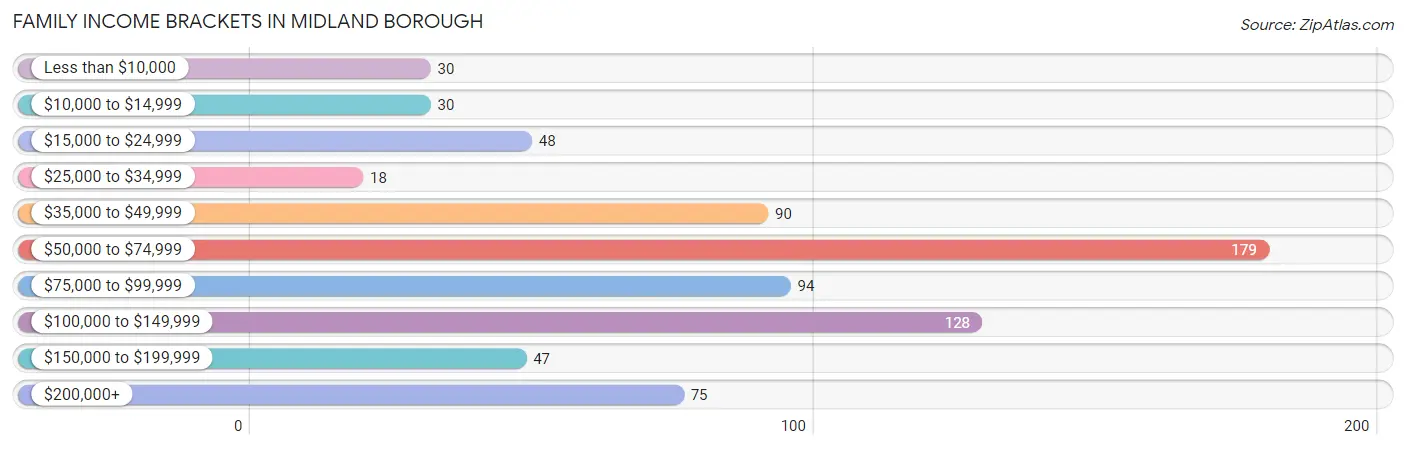
Family Income in Midland borough
Family Income Brackets in Midland borough
According to the Midland borough family income data, there are 179 families falling into the $50,000 to $74,999 income range, which is the most common income bracket and makes up 24.2% of all families. Conversely, the $25,000 to $34,999 income bracket is the least frequent group with only 18 families (2.4%) belonging to this category.
| Income Bracket | # Families | % Families |
| Less than $10,000 | 30 | 4.1% |
| $10,000 to $14,999 | 30 | 4.1% |
| $15,000 to $24,999 | 48 | 6.5% |
| $25,000 to $34,999 | 18 | 2.4% |
| $35,000 to $49,999 | 90 | 12.2% |
| $50,000 to $74,999 | 179 | 24.2% |
| $75,000 to $99,999 | 94 | 12.7% |
| $100,000 to $149,999 | 128 | 17.3% |
| $150,000 to $199,999 | 47 | 6.4% |
| $200,000+ | 75 | 10.1% |
Family Income by Famaliy Size in Midland borough
3-person families (252 | 34.1%) account for the highest median family income in Midland borough with $104,000 per family, while 3-person families (252 | 34.1%) have the highest median income of $34,667 per family member.
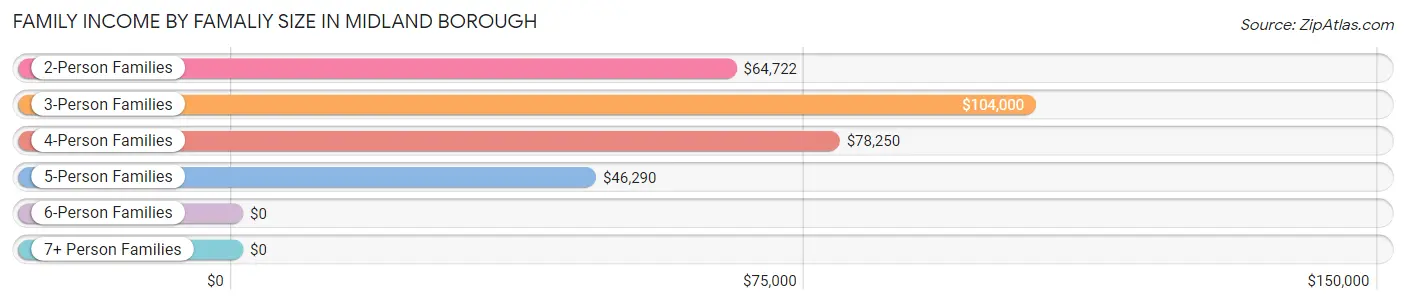
| Income Bracket | # Families | Median Income |
| 2-Person Families | 358 (48.4%) | $64,722 |
| 3-Person Families | 252 (34.1%) | $104,000 |
| 4-Person Families | 84 (11.4%) | $78,250 |
| 5-Person Families | 36 (4.9%) | $46,290 |
| 6-Person Families | 0 (0.0%) | $0 |
| 7+ Person Families | 9 (1.2%) | $0 |
| Total | 739 (100.0%) | $66,563 |
Family Income by Number of Earners in Midland borough
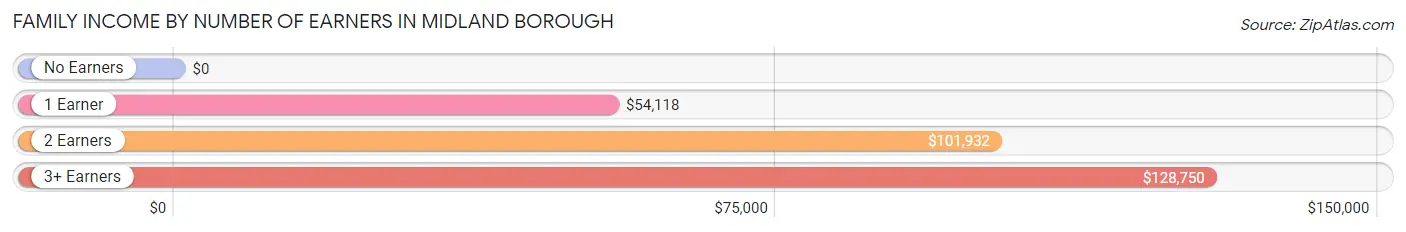
| Number of Earners | # Families | Median Income |
| No Earners | 97 (13.1%) | $0 |
| 1 Earner | 230 (31.1%) | $54,118 |
| 2 Earners | 379 (51.3%) | $101,932 |
| 3+ Earners | 33 (4.5%) | $128,750 |
| Total | 739 (100.0%) | $66,563 |
Household Income in Midland borough
Household Income Brackets in Midland borough
With 230 households falling in the category, the $75,000 to $99,999 income range is the most frequent in Midland borough, accounting for 20.6% of all households. In contrast, only 45 households (4.0%) fall into the less than $10,000 income bracket, making it the least populous group.
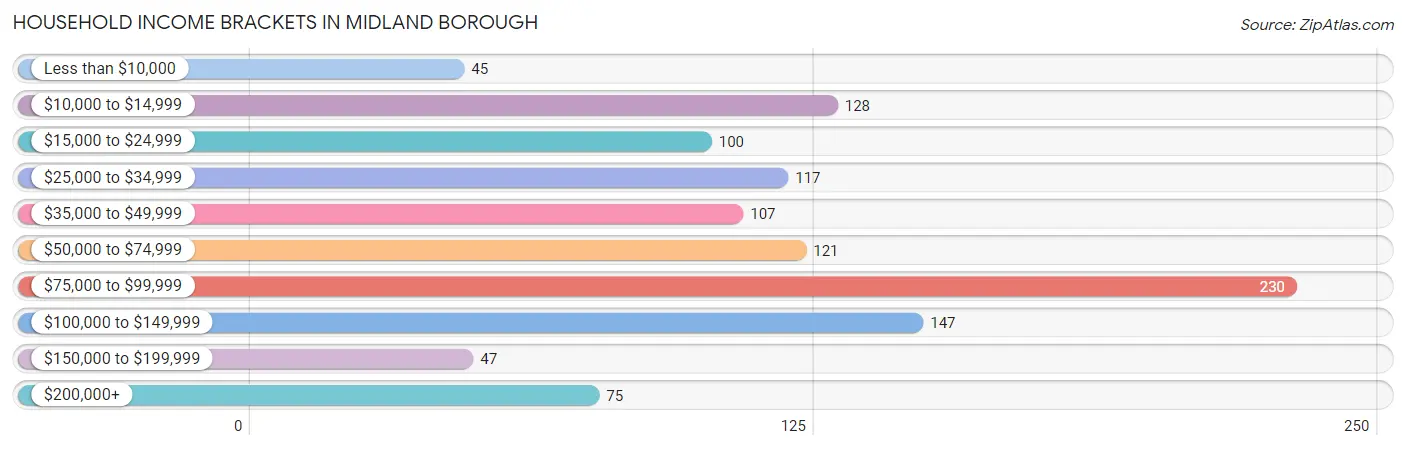
| Income Bracket | # Households | % Households |
| Less than $10,000 | 45 | 4.0% |
| $10,000 to $14,999 | 128 | 11.5% |
| $15,000 to $24,999 | 100 | 9.0% |
| $25,000 to $34,999 | 117 | 10.5% |
| $35,000 to $49,999 | 107 | 9.6% |
| $50,000 to $74,999 | 121 | 10.8% |
| $75,000 to $99,999 | 230 | 20.6% |
| $100,000 to $149,999 | 147 | 13.2% |
| $150,000 to $199,999 | 47 | 4.2% |
| $200,000+ | 75 | 6.7% |
Household Income by Householder Age in Midland borough
The median household income in Midland borough is $61,083, with the highest median household income of $76,563 found in the 25 to 44 years age bracket for the primary householder. A total of 209 households (18.7%) fall into this category. Meanwhile, the 15 to 24 years age bracket for the primary householder has the lowest median household income of $0, with 21 households (1.9%) in this group.
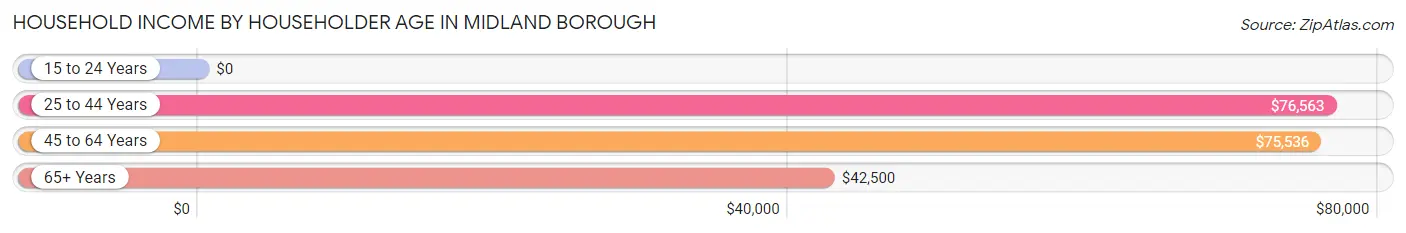
| Income Bracket | # Households | Median Income |
| 15 to 24 Years | 21 (1.9%) | $0 |
| 25 to 44 Years | 209 (18.7%) | $76,563 |
| 45 to 64 Years | 488 (43.7%) | $75,536 |
| 65+ Years | 398 (35.7%) | $42,500 |
| Total | 1,116 (100.0%) | $61,083 |
Poverty in Midland borough
Income Below Poverty by Sex and Age in Midland borough
With 21.4% poverty level for males and 14.3% for females among the residents of Midland borough, 6 to 11 year old males and 12 to 14 year old females are the most vulnerable to poverty, with 57 males (50.0%) and 39 females (81.2%) in their respective age groups living below the poverty level.
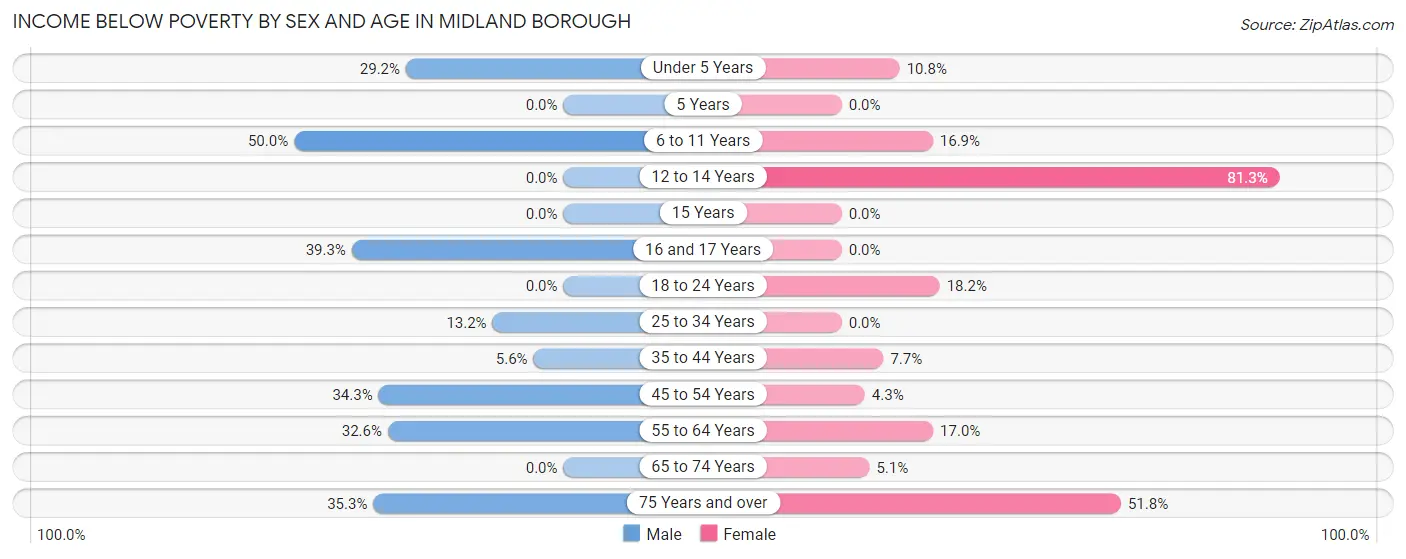
| Age Bracket | Male | Female |
| Under 5 Years | 19 (29.2%) | 10 (10.7%) |
| 5 Years | 0 (0.0%) | 0 (0.0%) |
| 6 to 11 Years | 57 (50.0%) | 12 (16.9%) |
| 12 to 14 Years | 0 (0.0%) | 39 (81.2%) |
| 15 Years | 0 (0.0%) | 0 (0.0%) |
| 16 and 17 Years | 11 (39.3%) | 0 (0.0%) |
| 18 to 24 Years | 0 (0.0%) | 8 (18.2%) |
| 25 to 34 Years | 10 (13.2%) | 0 (0.0%) |
| 35 to 44 Years | 6 (5.6%) | 12 (7.7%) |
| 45 to 54 Years | 47 (34.3%) | 10 (4.3%) |
| 55 to 64 Years | 88 (32.6%) | 29 (17.0%) |
| 65 to 74 Years | 0 (0.0%) | 10 (5.1%) |
| 75 Years and over | 30 (35.3%) | 71 (51.8%) |
| Total | 268 (21.4%) | 201 (14.3%) |
Income Above Poverty by Sex and Age in Midland borough
According to the poverty statistics in Midland borough, males aged 12 to 14 years and females aged 5 years are the age groups that are most secure financially, with 100.0% of males and 100.0% of females in these age groups living above the poverty line.
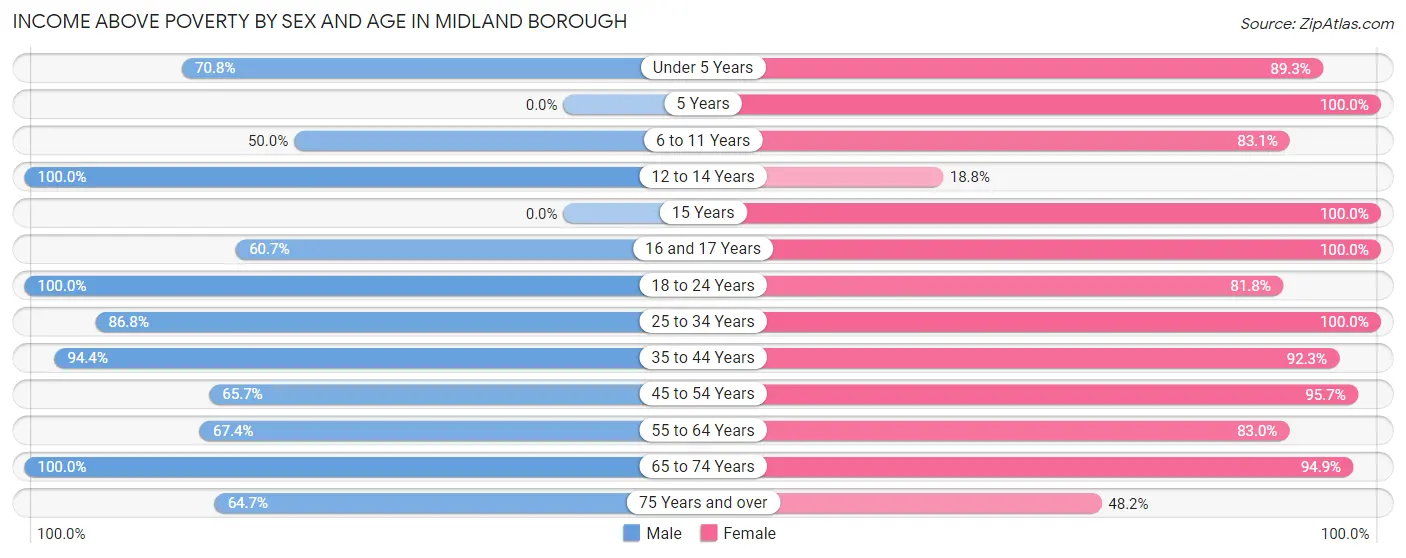
| Age Bracket | Male | Female |
| Under 5 Years | 46 (70.8%) | 83 (89.2%) |
| 5 Years | 0 (0.0%) | 11 (100.0%) |
| 6 to 11 Years | 57 (50.0%) | 59 (83.1%) |
| 12 to 14 Years | 60 (100.0%) | 9 (18.8%) |
| 15 Years | 0 (0.0%) | 39 (100.0%) |
| 16 and 17 Years | 17 (60.7%) | 68 (100.0%) |
| 18 to 24 Years | 171 (100.0%) | 36 (81.8%) |
| 25 to 34 Years | 66 (86.8%) | 142 (100.0%) |
| 35 to 44 Years | 102 (94.4%) | 143 (92.3%) |
| 45 to 54 Years | 90 (65.7%) | 223 (95.7%) |
| 55 to 64 Years | 182 (67.4%) | 142 (83.0%) |
| 65 to 74 Years | 137 (100.0%) | 185 (94.9%) |
| 75 Years and over | 55 (64.7%) | 66 (48.2%) |
| Total | 983 (78.6%) | 1,206 (85.7%) |
Income Below Poverty Among Married-Couple Families in Midland borough
The poverty statistics for married-couple families in Midland borough show that 9.0% or 41 of the total 454 families live below the poverty line. Families with 3 or 4 children have the highest poverty rate of 100.0%, comprising of 2 families. On the other hand, families with 1 or 2 children have the lowest poverty rate of 0.0%, which includes 0 families.
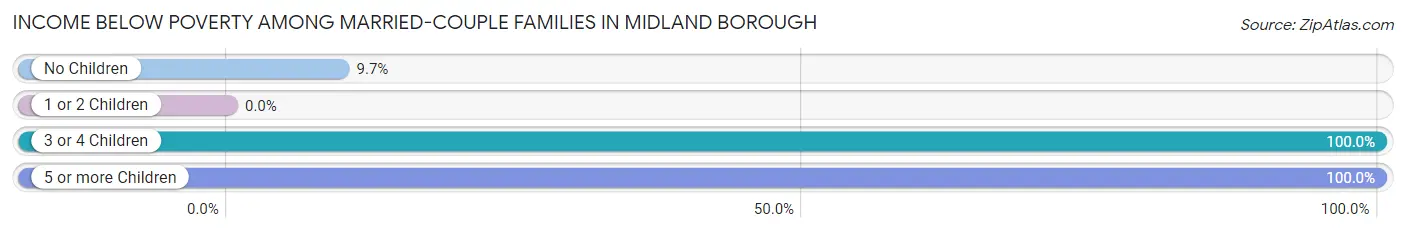
| Children | Above Poverty | Below Poverty |
| No Children | 279 (90.3%) | 30 (9.7%) |
| 1 or 2 Children | 134 (100.0%) | 0 (0.0%) |
| 3 or 4 Children | 0 (0.0%) | 2 (100.0%) |
| 5 or more Children | 0 (0.0%) | 9 (100.0%) |
| Total | 413 (91.0%) | 41 (9.0%) |
Income Below Poverty Among Single-Parent Households in Midland borough
According to the poverty data in Midland borough, 67.7% or 42 single-father households and 9.0% or 20 single-mother households are living below the poverty line. Among single-father households, those with 1 or 2 children have the highest poverty rate, with 42 households (67.7%) experiencing poverty. Likewise, among single-mother households, those with no children have the highest poverty rate, with 10 households (9.2%) falling below the poverty line.
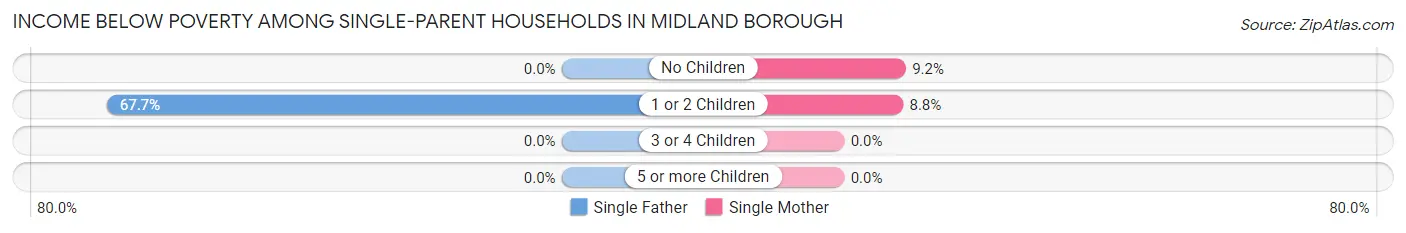
| Children | Single Father | Single Mother |
| No Children | 0 (0.0%) | 10 (9.2%) |
| 1 or 2 Children | 42 (67.7%) | 10 (8.8%) |
| 3 or 4 Children | 0 (0.0%) | 0 (0.0%) |
| 5 or more Children | 0 (0.0%) | 0 (0.0%) |
| Total | 42 (67.7%) | 20 (9.0%) |
Income Below Poverty Among Married-Couple vs Single-Parent Households in Midland borough
The poverty data for Midland borough shows that 41 of the married-couple family households (9.0%) and 62 of the single-parent households (21.7%) are living below the poverty level. Within the married-couple family households, those with 3 or 4 children have the highest poverty rate, with 2 households (100.0%) falling below the poverty line. Among the single-parent households, those with 1 or 2 children have the highest poverty rate, with 52 household (29.5%) living below poverty.
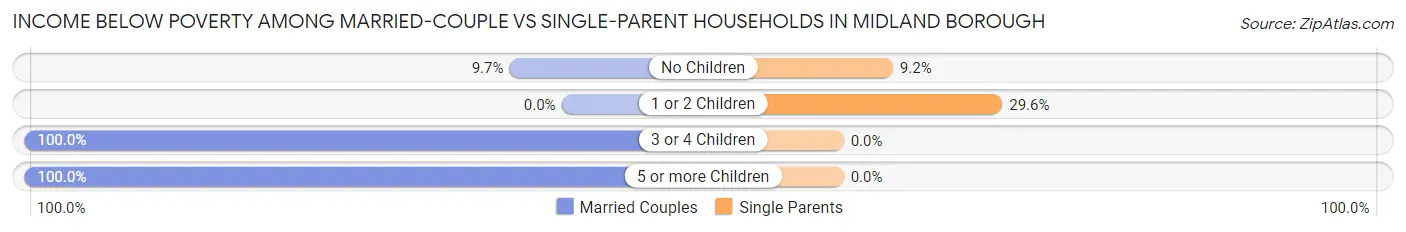
| Children | Married-Couple Families | Single-Parent Households |
| No Children | 30 (9.7%) | 10 (9.2%) |
| 1 or 2 Children | 0 (0.0%) | 52 (29.5%) |
| 3 or 4 Children | 2 (100.0%) | 0 (0.0%) |
| 5 or more Children | 9 (100.0%) | 0 (0.0%) |
| Total | 41 (9.0%) | 62 (21.7%) |
Race in Midland borough
The most populous races in Midland borough are White / Caucasian (2,111 | 79.4%), Black / African American (324 | 12.2%), and Two or more Races (214 | 8.1%).
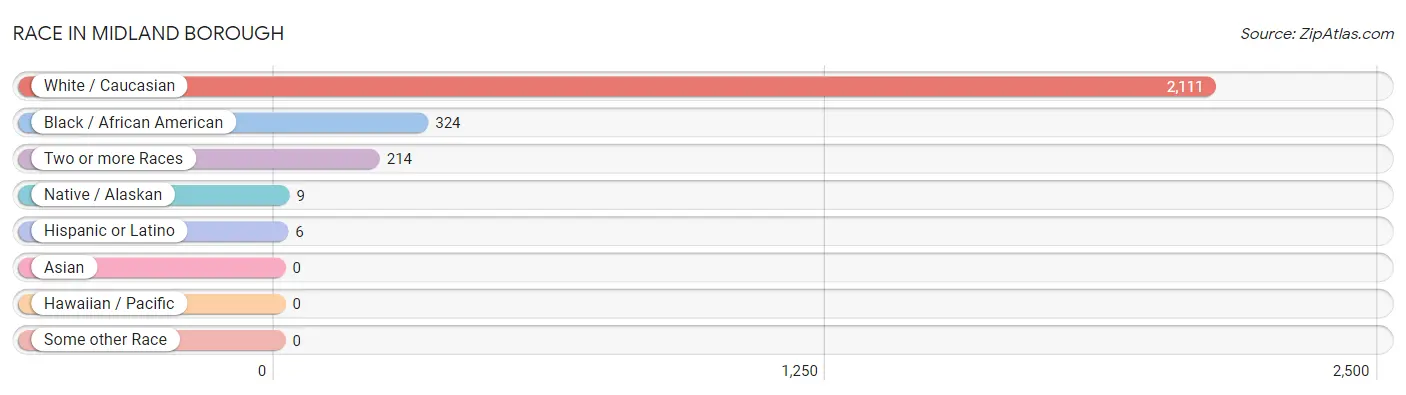
| Race | # Population | % Population |
| Asian | 0 | 0.0% |
| Black / African American | 324 | 12.2% |
| Hawaiian / Pacific | 0 | 0.0% |
| Hispanic or Latino | 6 | 0.2% |
| Native / Alaskan | 9 | 0.3% |
| White / Caucasian | 2,111 | 79.4% |
| Two or more Races | 214 | 8.1% |
| Some other Race | 0 | 0.0% |
| Total | 2,658 | 100.0% |
Ancestry in Midland borough
The most populous ancestries reported in Midland borough are Italian (579 | 21.8%), Irish (569 | 21.4%), German (488 | 18.4%), English (339 | 12.8%), and American (188 | 7.1%), together accounting for 81.4% of all Midland borough residents.
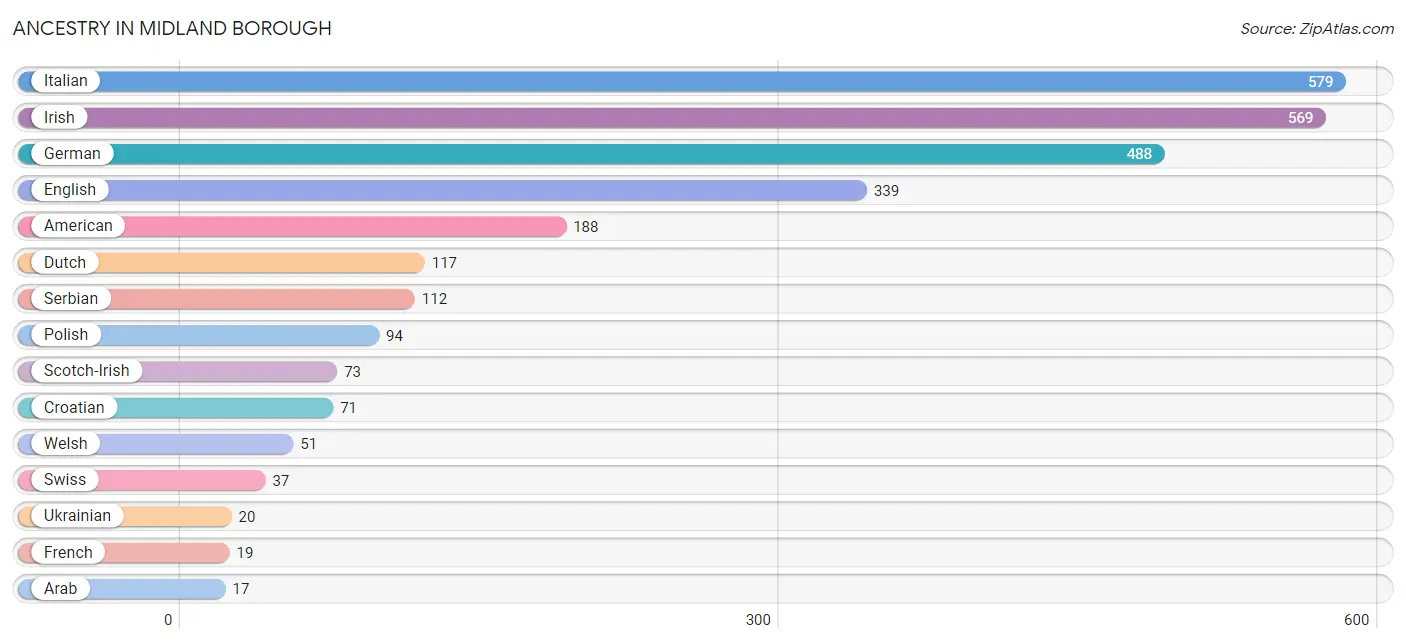
| Ancestry | # Population | % Population |
| American | 188 | 7.1% |
| Arab | 17 | 0.6% |
| British | 13 | 0.5% |
| Cherokee | 5 | 0.2% |
| Croatian | 71 | 2.7% |
| Dutch | 117 | 4.4% |
| English | 339 | 12.8% |
| French | 19 | 0.7% |
| German | 488 | 18.4% |
| Irish | 569 | 21.4% |
| Italian | 579 | 21.8% |
| Mexican | 6 | 0.2% |
| Polish | 94 | 3.5% |
| Russian | 5 | 0.2% |
| Scotch-Irish | 73 | 2.8% |
| Scottish | 16 | 0.6% |
| Serbian | 112 | 4.2% |
| Slovak | 9 | 0.3% |
| Swiss | 37 | 1.4% |
| Syrian | 17 | 0.6% |
| Ukrainian | 20 | 0.7% |
| Welsh | 51 | 1.9% | View All 22 Rows |
Immigrants in Midland borough
The most numerous immigrant groups reported in Midland borough came from Europe (16 | 0.6%), Italy (16 | 0.6%), and Southern Europe (16 | 0.6%), together accounting for 1.8% of all Midland borough residents.
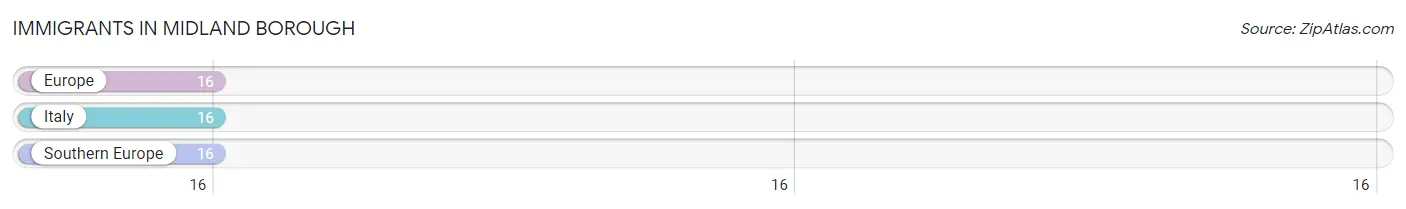
| Immigration Origin | # Population | % Population |
| Europe | 16 | 0.6% |
| Italy | 16 | 0.6% |
| Southern Europe | 16 | 0.6% | View All 3 Rows |
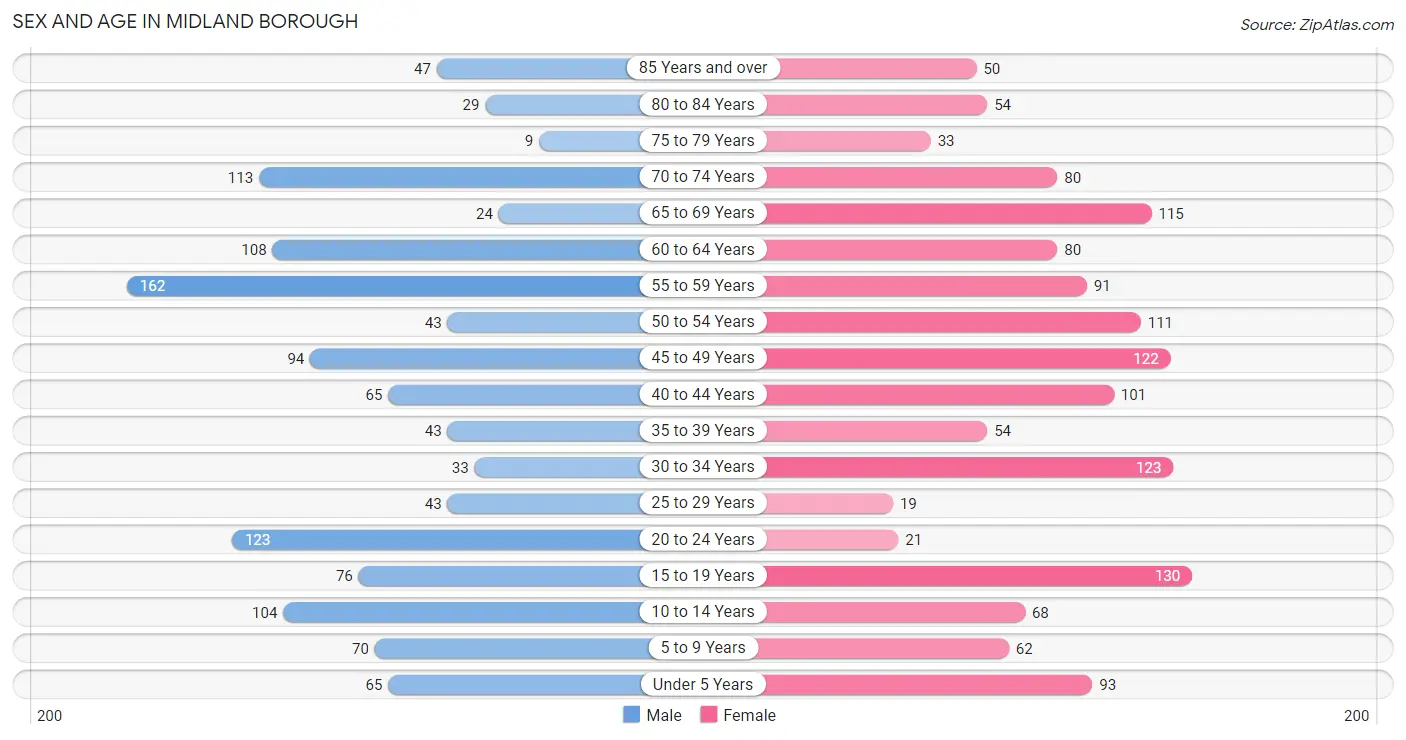
Sex and Age in Midland borough
Sex and Age in Midland borough
The most populous age groups in Midland borough are 55 to 59 Years (162 | 13.0%) for men and 15 to 19 Years (130 | 9.2%) for women.
| Age Bracket | Male | Female |
| Under 5 Years | 65 (5.2%) | 93 (6.6%) |
| 5 to 9 Years | 70 (5.6%) | 62 (4.4%) |
| 10 to 14 Years | 104 (8.3%) | 68 (4.8%) |
| 15 to 19 Years | 76 (6.1%) | 130 (9.2%) |
| 20 to 24 Years | 123 (9.8%) | 21 (1.5%) |
| 25 to 29 Years | 43 (3.4%) | 19 (1.3%) |
| 30 to 34 Years | 33 (2.6%) | 123 (8.7%) |
| 35 to 39 Years | 43 (3.4%) | 54 (3.8%) |
| 40 to 44 Years | 65 (5.2%) | 101 (7.2%) |
| 45 to 49 Years | 94 (7.5%) | 122 (8.7%) |
| 50 to 54 Years | 43 (3.4%) | 111 (7.9%) |
| 55 to 59 Years | 162 (13.0%) | 91 (6.5%) |
| 60 to 64 Years | 108 (8.6%) | 80 (5.7%) |
| 65 to 69 Years | 24 (1.9%) | 115 (8.2%) |
| 70 to 74 Years | 113 (9.0%) | 80 (5.7%) |
| 75 to 79 Years | 9 (0.7%) | 33 (2.4%) |
| 80 to 84 Years | 29 (2.3%) | 54 (3.8%) |
| 85 Years and over | 47 (3.8%) | 50 (3.5%) |
| Total | 1,251 (100.0%) | 1,407 (100.0%) |
Families and Households in Midland borough
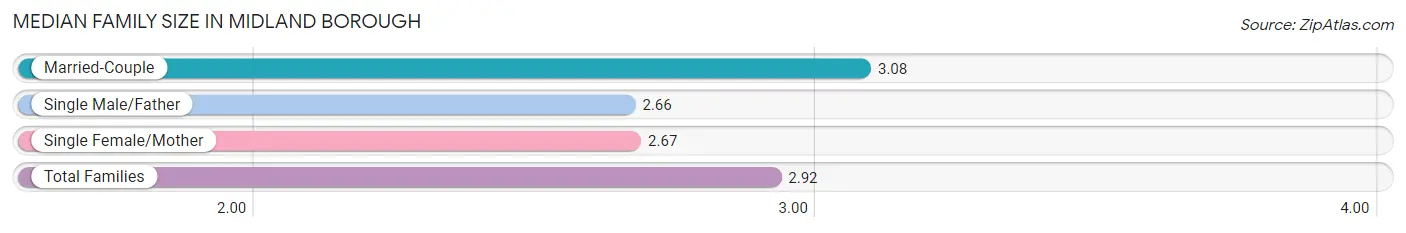
Median Family Size in Midland borough
The median family size in Midland borough is 2.92 persons per family, with married-couple families (454 | 61.4%) accounting for the largest median family size of 3.08 persons per family. On the other hand, single male/father families (62 | 8.4%) represent the smallest median family size with 2.66 persons per family.
| Family Type | # Families | Family Size |
| Married-Couple | 454 (61.4%) | 3.08 |
| Single Male/Father | 62 (8.4%) | 2.66 |
| Single Female/Mother | 223 (30.2%) | 2.67 |
| Total Families | 739 (100.0%) | 2.92 |
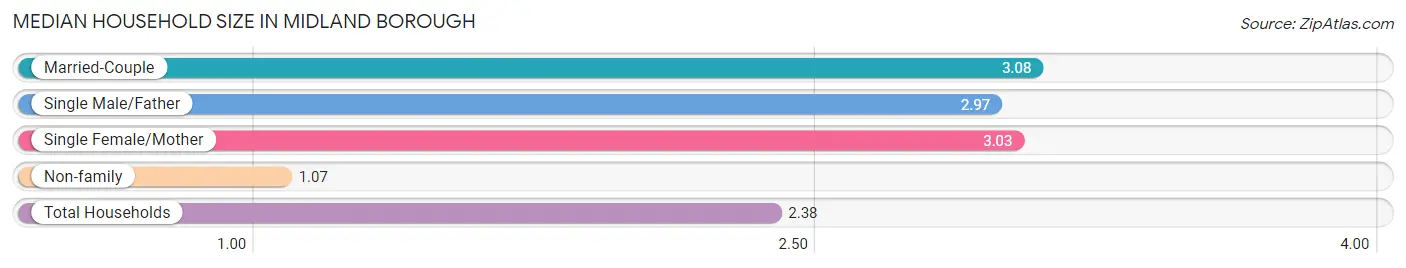
Median Household Size in Midland borough
The median household size in Midland borough is 2.38 persons per household, with married-couple households (454 | 40.7%) accounting for the largest median household size of 3.08 persons per household. non-family households (377 | 33.8%) represent the smallest median household size with 1.07 persons per household.
| Household Type | # Households | Household Size |
| Married-Couple | 454 (40.7%) | 3.08 |
| Single Male/Father | 62 (5.6%) | 2.97 |
| Single Female/Mother | 223 (20.0%) | 3.03 |
| Non-family | 377 (33.8%) | 1.07 |
| Total Households | 1,116 (100.0%) | 2.38 |
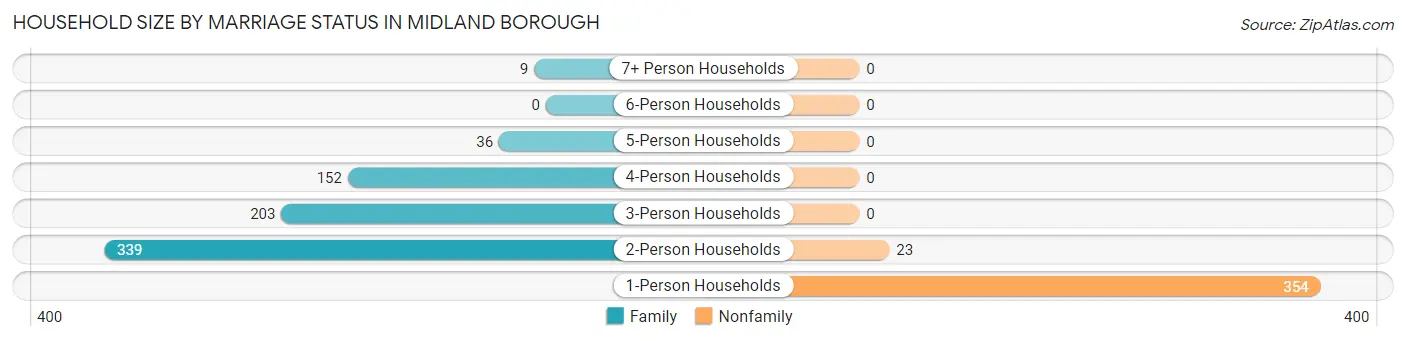
Household Size by Marriage Status in Midland borough
Out of a total of 1,116 households in Midland borough, 739 (66.2%) are family households, while 377 (33.8%) are nonfamily households. The most numerous type of family households are 2-person households, comprising 339, and the most common type of nonfamily households are 1-person households, comprising 354.
| Household Size | Family Households | Nonfamily Households |
| 1-Person Households | - | 354 (31.7%) |
| 2-Person Households | 339 (30.4%) | 23 (2.1%) |
| 3-Person Households | 203 (18.2%) | 0 (0.0%) |
| 4-Person Households | 152 (13.6%) | 0 (0.0%) |
| 5-Person Households | 36 (3.2%) | 0 (0.0%) |
| 6-Person Households | 0 (0.0%) | 0 (0.0%) |
| 7+ Person Households | 9 (0.8%) | 0 (0.0%) |
| Total | 739 (66.2%) | 377 (33.8%) |
Female Fertility in Midland borough
Fertility by Age in Midland borough
Average fertility rate in Midland borough is 135.0 births per 1,000 women. Women in the age bracket of 20 to 34 years have the highest fertility rate with 423.0 births per 1,000 women. Women in the age bracket of 20 to 34 years acount for 89.6% of all women with births.
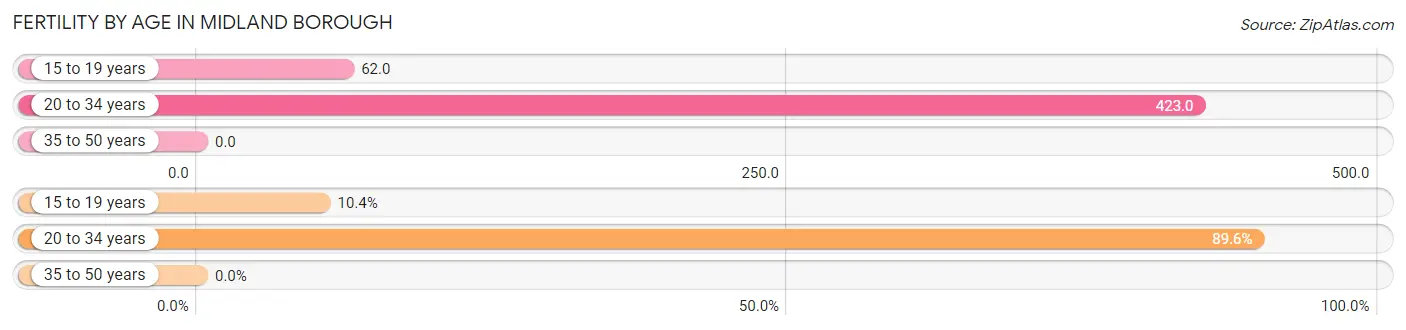
| Age Bracket | Women with Births | Births / 1,000 Women |
| 15 to 19 years | 8 (10.4%) | 62.0 |
| 20 to 34 years | 69 (89.6%) | 423.0 |
| 35 to 50 years | 0 (0.0%) | 0.0 |
| Total | 77 (100.0%) | 135.0 |
Fertility by Age by Marriage Status in Midland borough
45.5% of women with births (77) in Midland borough are married. The highest percentage of unmarried women with births falls into 15 to 19 years age bracket with 100.0% of them unmarried at the time of birth, while the lowest percentage of unmarried women with births belong to 20 to 34 years age bracket with 49.3% of them unmarried.
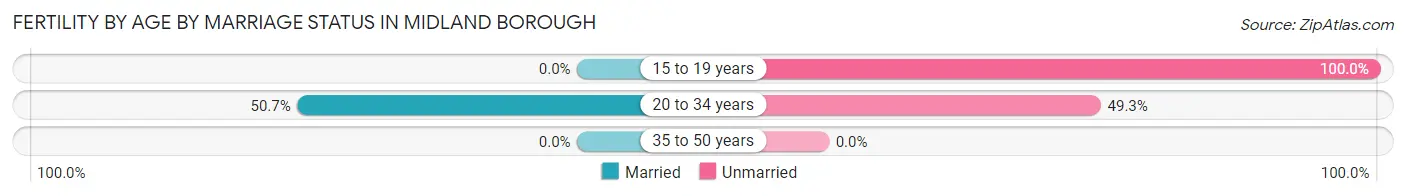
| Age Bracket | Married | Unmarried |
| 15 to 19 years | 0 (0.0%) | 8 (100.0%) |
| 20 to 34 years | 35 (50.7%) | 34 (49.3%) |
| 35 to 50 years | 0 (0.0%) | 0 (0.0%) |
| Total | 35 (45.5%) | 42 (54.5%) |
Fertility by Education in Midland borough
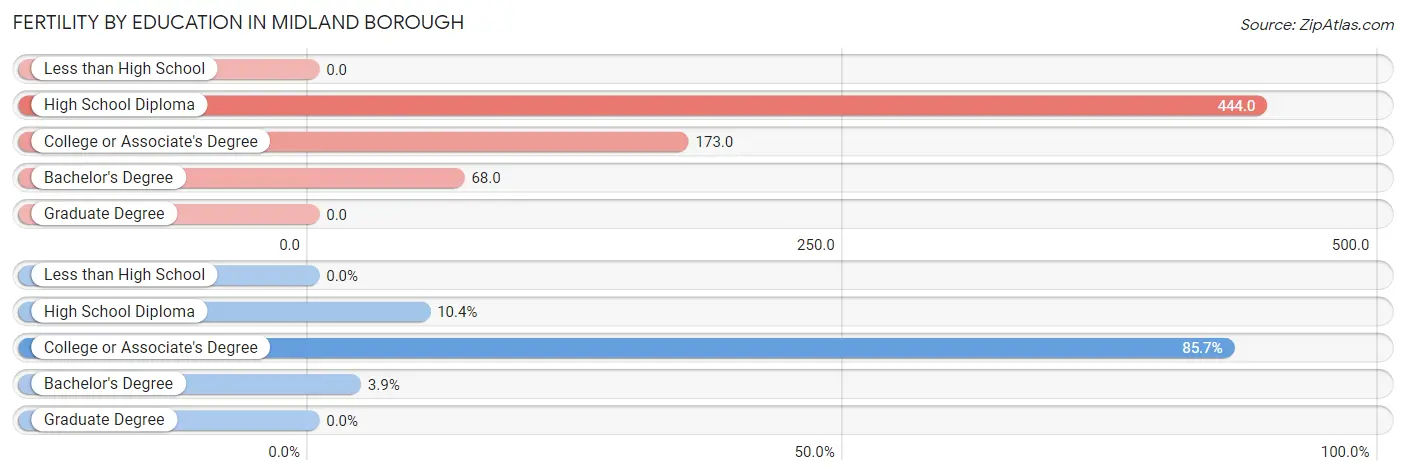
| Educational Attainment | Women with Births | Births / 1,000 Women |
| Less than High School | 0 (0.0%) | 0.0 |
| High School Diploma | 8 (10.4%) | 444.0 |
| College or Associate's Degree | 66 (85.7%) | 173.0 |
| Bachelor's Degree | 3 (3.9%) | 68.0 |
| Graduate Degree | 0 (0.0%) | 0.0 |
| Total | 77 (100.0%) | 135.0 |
Fertility by Education by Marriage Status in Midland borough
54.5% of women with births in Midland borough are unmarried. Women with the educational attainment of bachelor's degree are most likely to be married with 100.0% of them married at childbirth, while women with the educational attainment of high school diploma are least likely to be married with 100.0% of them unmarried at childbirth.
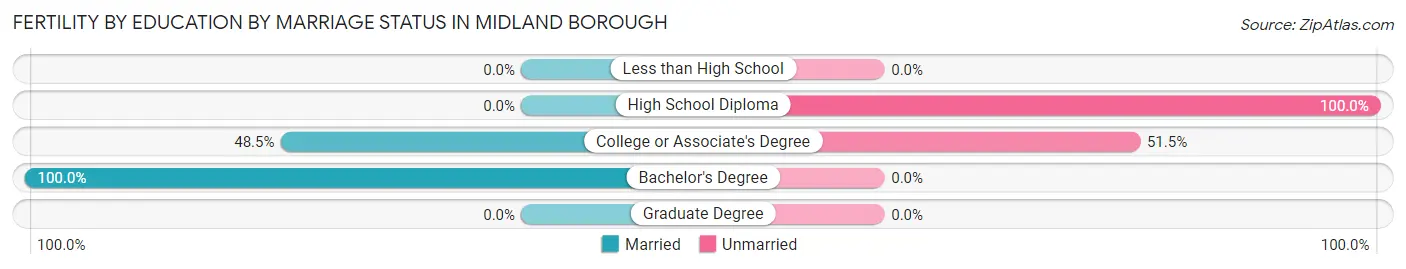
| Educational Attainment | Married | Unmarried |
| Less than High School | 0 (0.0%) | 0 (0.0%) |
| High School Diploma | 0 (0.0%) | 8 (100.0%) |
| College or Associate's Degree | 32 (48.5%) | 34 (51.5%) |
| Bachelor's Degree | 3 (100.0%) | 0 (0.0%) |
| Graduate Degree | 0 (0.0%) | 0 (0.0%) |
| Total | 35 (45.5%) | 42 (54.5%) |
Employment Characteristics in Midland borough
Employment by Class of Employer in Midland borough
Among the 1,110 employed individuals in Midland borough, private company employees (922 | 83.1%), not-for-profit organizations (92 | 8.3%), and self-employed (not incorporated) (43 | 3.9%) make up the most common classes of employment.
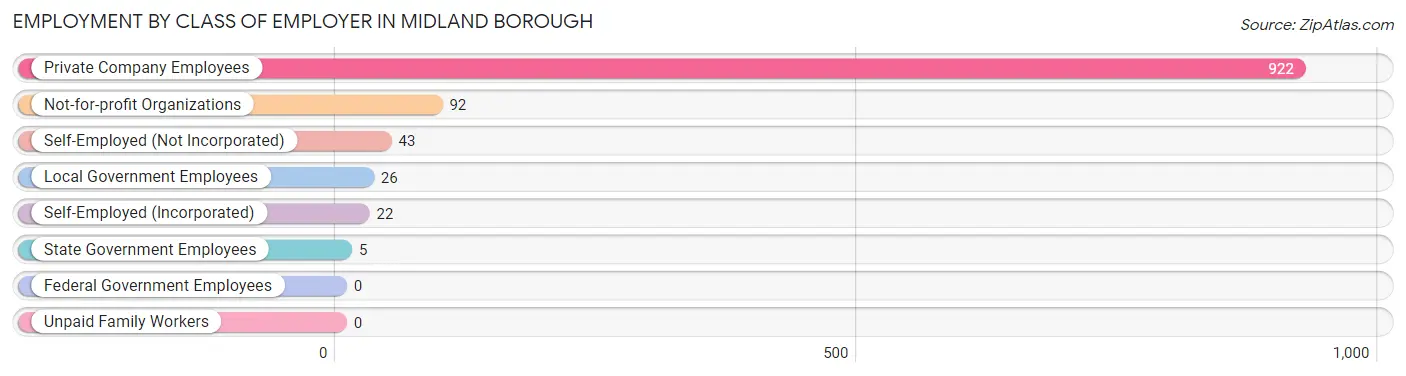
| Employer Class | # Employees | % Employees |
| Private Company Employees | 922 | 83.1% |
| Self-Employed (Incorporated) | 22 | 2.0% |
| Self-Employed (Not Incorporated) | 43 | 3.9% |
| Not-for-profit Organizations | 92 | 8.3% |
| Local Government Employees | 26 | 2.3% |
| State Government Employees | 5 | 0.4% |
| Federal Government Employees | 0 | 0.0% |
| Unpaid Family Workers | 0 | 0.0% |
| Total | 1,110 | 100.0% |
Employment Status by Age in Midland borough
According to the labor force statistics for Midland borough, out of the total population over 16 years of age (2,157), 62.3% or 1,344 individuals are in the labor force, with 11.2% or 151 of them unemployed. The age group with the highest labor force participation rate is 20 to 24 years, with 85.4% or 123 individuals in the labor force. Within the labor force, the 20 to 24 years age range has the highest percentage of unemployed individuals, with 56.1% or 69 of them being unemployed.
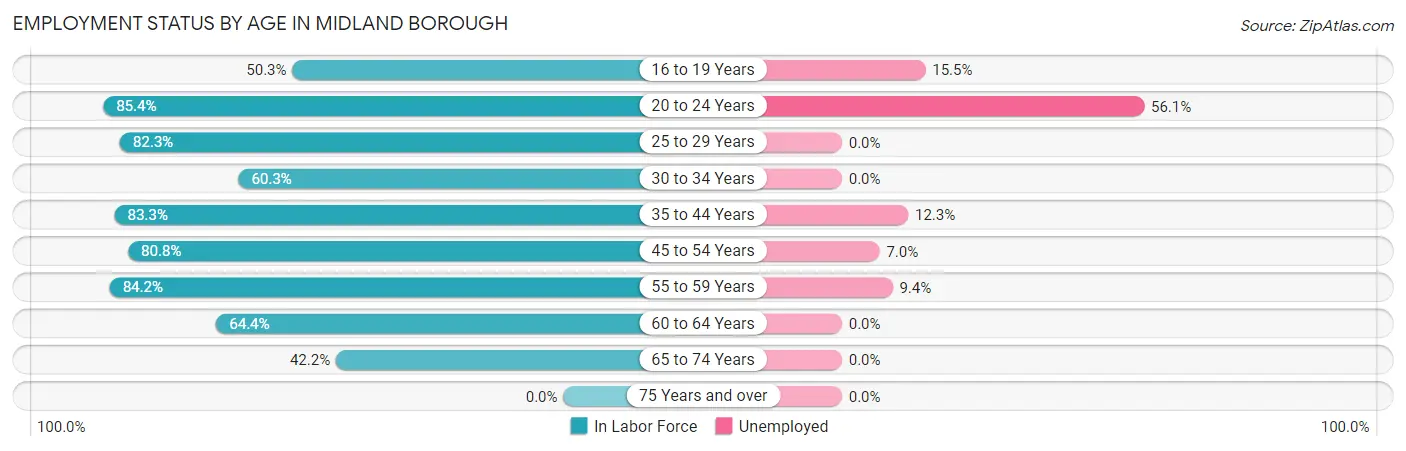
| Age Bracket | In Labor Force | Unemployed |
| 16 to 19 Years | 84 (50.3%) | 13 (15.5%) |
| 20 to 24 Years | 123 (85.4%) | 69 (56.1%) |
| 25 to 29 Years | 51 (82.3%) | 0 (0.0%) |
| 30 to 34 Years | 94 (60.3%) | 0 (0.0%) |
| 35 to 44 Years | 219 (83.3%) | 27 (12.3%) |
| 45 to 54 Years | 299 (80.8%) | 21 (7.0%) |
| 55 to 59 Years | 213 (84.2%) | 20 (9.4%) |
| 60 to 64 Years | 121 (64.4%) | 0 (0.0%) |
| 65 to 74 Years | 140 (42.2%) | 0 (0.0%) |
| 75 Years and over | 0 (0.0%) | 0 (0.0%) |
| Total | 1,344 (62.3%) | 151 (11.2%) |
Employment Status by Educational Attainment in Midland borough
According to labor force statistics for Midland borough, 77.2% of individuals (997) out of the total population between 25 and 64 years of age (1,292) are in the labor force, with 6.8% or 68 of them being unemployed. The group with the highest labor force participation rate are those with the educational attainment of college / associate degree, with 85.8% or 654 individuals in the labor force. Within the labor force, individuals with college / associate degree education have the highest percentage of unemployment, with 10.4% or 68 of them being unemployed.
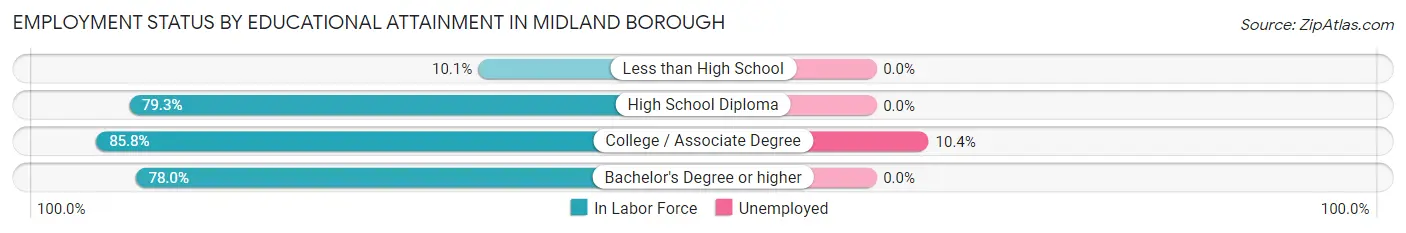
| Educational Attainment | In Labor Force | Unemployed |
| Less than High School | 11 (10.1%) | 0 (0.0%) |
| High School Diploma | 222 (79.3%) | 0 (0.0%) |
| College / Associate Degree | 654 (85.8%) | 79 (10.4%) |
| Bachelor's Degree or higher | 110 (78.0%) | 0 (0.0%) |
| Total | 997 (77.2%) | 88 (6.8%) |
Employment Occupations by Sex in Midland borough
Management, Business, Science and Arts Occupations
The most common Management, Business, Science and Arts occupations in Midland borough are Management (98 | 8.2%), Computers, Engineering & Science (88 | 7.4%), Architecture & Engineering (88 | 7.4%), Health Diagnosing & Treating (84 | 7.0%), and Community & Social Service (53 | 4.4%).
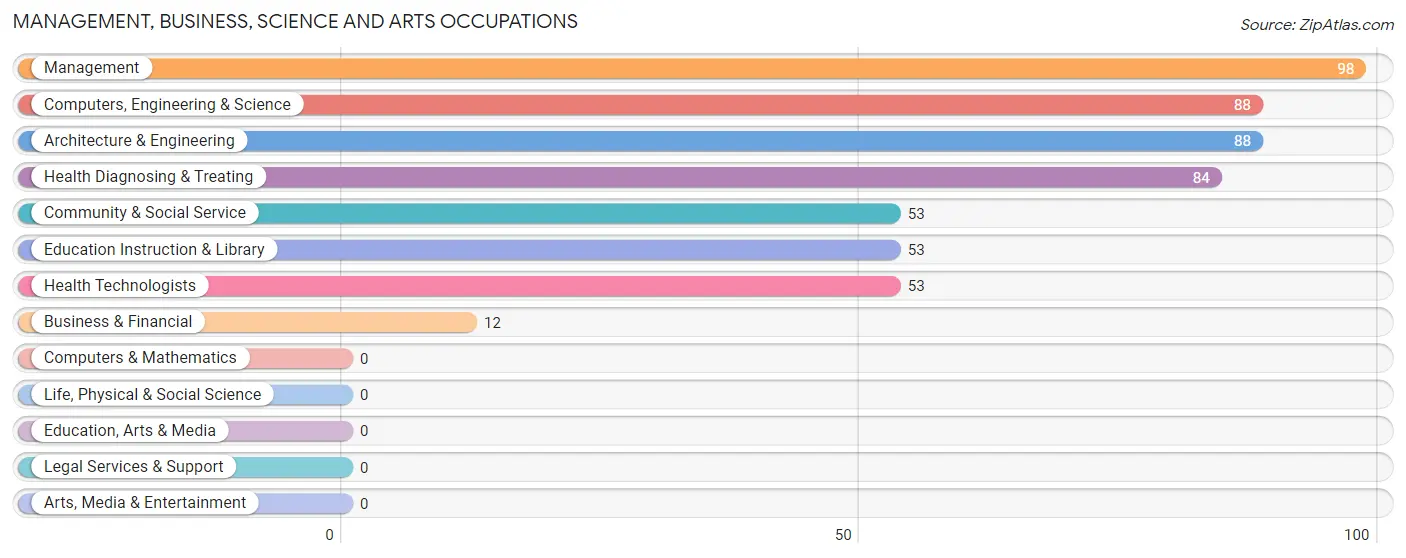
Management, Business, Science and Arts Occupations by Sex
Within the Management, Business, Science and Arts occupations in Midland borough, the most male-oriented occupations are Computers, Engineering & Science (100.0%), Architecture & Engineering (100.0%), and Business & Financial (75.0%), while the most female-oriented occupations are Health Diagnosing & Treating (100.0%), Health Technologists (100.0%), and Management (93.9%).
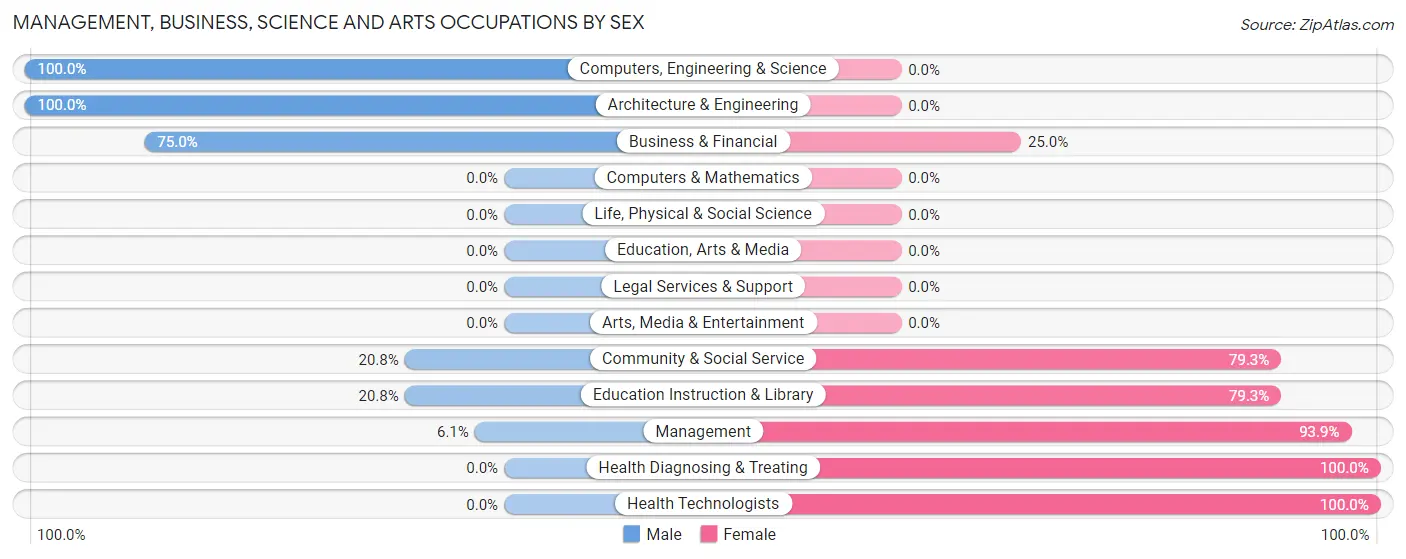
| Occupation | Male | Female |
| Management | 6 (6.1%) | 92 (93.9%) |
| Business & Financial | 9 (75.0%) | 3 (25.0%) |
| Computers, Engineering & Science | 88 (100.0%) | 0 (0.0%) |
| Computers & Mathematics | 0 (0.0%) | 0 (0.0%) |
| Architecture & Engineering | 88 (100.0%) | 0 (0.0%) |
| Life, Physical & Social Science | 0 (0.0%) | 0 (0.0%) |
| Community & Social Service | 11 (20.7%) | 42 (79.2%) |
| Education, Arts & Media | 0 (0.0%) | 0 (0.0%) |
| Legal Services & Support | 0 (0.0%) | 0 (0.0%) |
| Education Instruction & Library | 11 (20.7%) | 42 (79.2%) |
| Arts, Media & Entertainment | 0 (0.0%) | 0 (0.0%) |
| Health Diagnosing & Treating | 0 (0.0%) | 84 (100.0%) |
| Health Technologists | 0 (0.0%) | 53 (100.0%) |
| Total (Category) | 114 (34.0%) | 221 (66.0%) |
| Total (Overall) | 531 (44.5%) | 663 (55.5%) |
Services Occupations
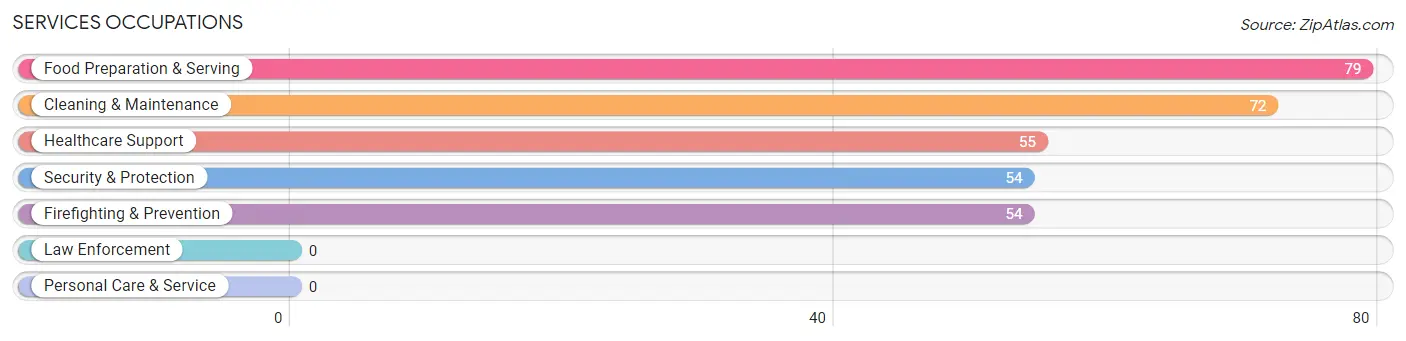
The most common Services occupations in Midland borough are Food Preparation & Serving (79 | 6.6%), Cleaning & Maintenance (72 | 6.0%), Healthcare Support (55 | 4.6%), Security & Protection (54 | 4.5%), and Firefighting & Prevention (54 | 4.5%).
Services Occupations by Sex
Within the Services occupations in Midland borough, the most male-oriented occupations are Security & Protection (87.0%), Firefighting & Prevention (87.0%), and Food Preparation & Serving (55.7%), while the most female-oriented occupations are Healthcare Support (83.6%), Cleaning & Maintenance (73.6%), and Food Preparation & Serving (44.3%).
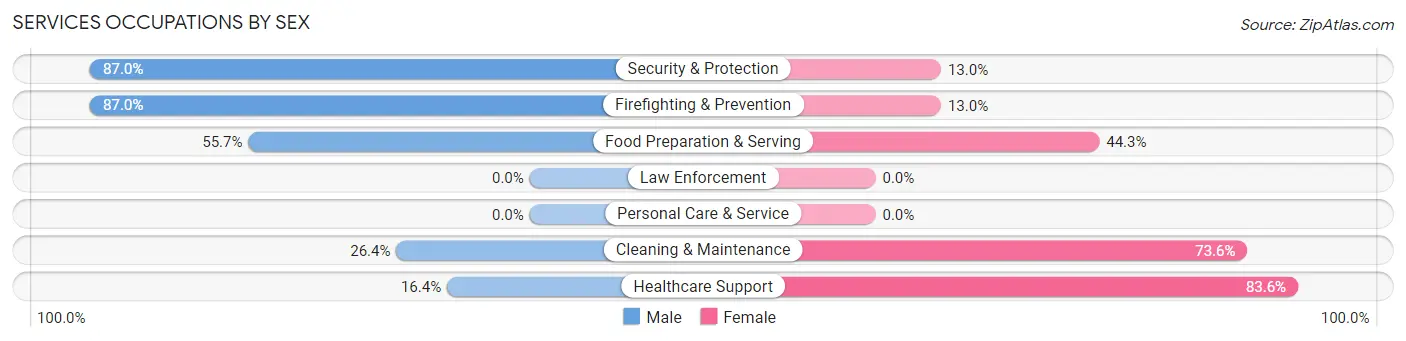
| Occupation | Male | Female |
| Healthcare Support | 9 (16.4%) | 46 (83.6%) |
| Security & Protection | 47 (87.0%) | 7 (13.0%) |
| Firefighting & Prevention | 47 (87.0%) | 7 (13.0%) |
| Law Enforcement | 0 (0.0%) | 0 (0.0%) |
| Food Preparation & Serving | 44 (55.7%) | 35 (44.3%) |
| Cleaning & Maintenance | 19 (26.4%) | 53 (73.6%) |
| Personal Care & Service | 0 (0.0%) | 0 (0.0%) |
| Total (Category) | 119 (45.8%) | 141 (54.2%) |
| Total (Overall) | 531 (44.5%) | 663 (55.5%) |
Sales and Office Occupations
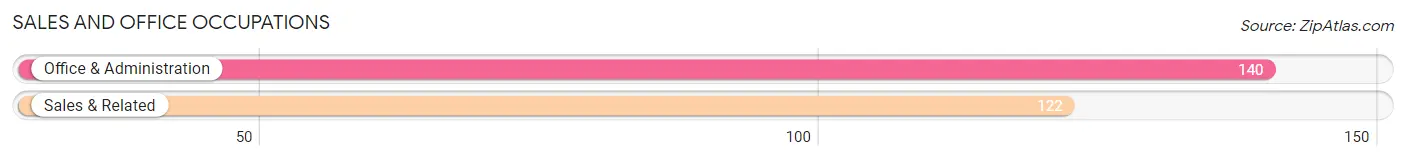
The most common Sales and Office occupations in Midland borough are Office & Administration (140 | 11.7%), and Sales & Related (122 | 10.2%).
Sales and Office Occupations by Sex
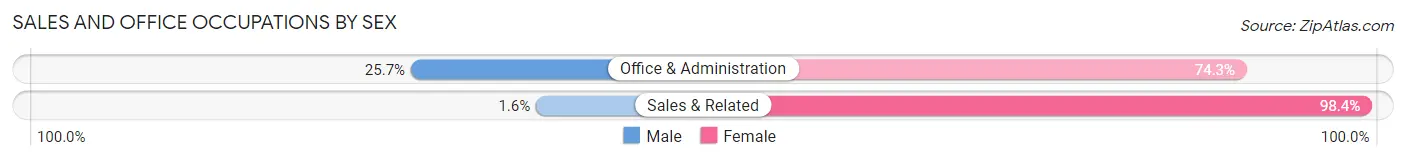
| Occupation | Male | Female |
| Sales & Related | 2 (1.6%) | 120 (98.4%) |
| Office & Administration | 36 (25.7%) | 104 (74.3%) |
| Total (Category) | 38 (14.5%) | 224 (85.5%) |
| Total (Overall) | 531 (44.5%) | 663 (55.5%) |
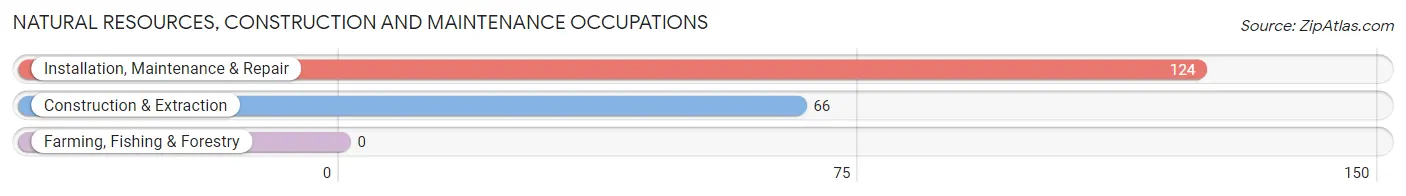
Natural Resources, Construction and Maintenance Occupations
The most common Natural Resources, Construction and Maintenance occupations in Midland borough are Installation, Maintenance & Repair (124 | 10.4%), and Construction & Extraction (66 | 5.5%).
Natural Resources, Construction and Maintenance Occupations by Sex
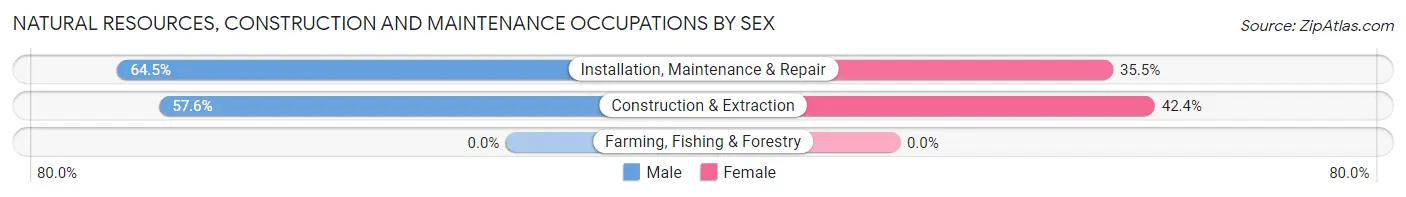
| Occupation | Male | Female |
| Farming, Fishing & Forestry | 0 (0.0%) | 0 (0.0%) |
| Construction & Extraction | 38 (57.6%) | 28 (42.4%) |
| Installation, Maintenance & Repair | 80 (64.5%) | 44 (35.5%) |
| Total (Category) | 118 (62.1%) | 72 (37.9%) |
| Total (Overall) | 531 (44.5%) | 663 (55.5%) |
Production, Transportation and Moving Occupations
The most common Production, Transportation and Moving occupations in Midland borough are Production (66 | 5.5%), Material Moving (42 | 3.5%), and Transportation (39 | 3.3%).
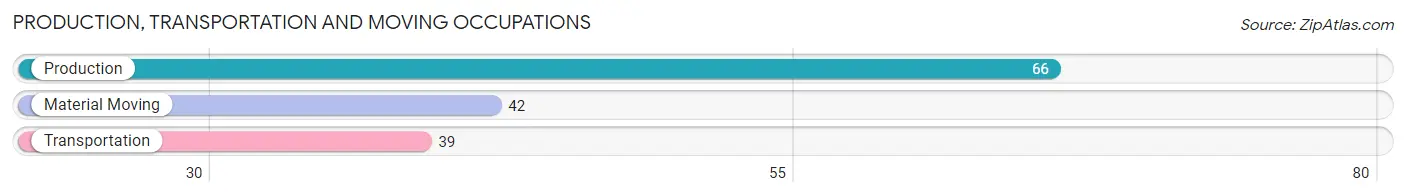
Production, Transportation and Moving Occupations by Sex
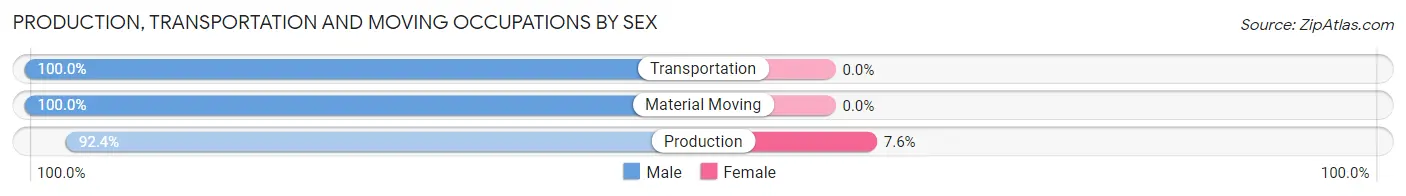
| Occupation | Male | Female |
| Production | 61 (92.4%) | 5 (7.6%) |
| Transportation | 39 (100.0%) | 0 (0.0%) |
| Material Moving | 42 (100.0%) | 0 (0.0%) |
| Total (Category) | 142 (96.6%) | 5 (3.4%) |
| Total (Overall) | 531 (44.5%) | 663 (55.5%) |
Employment Industries by Sex in Midland borough
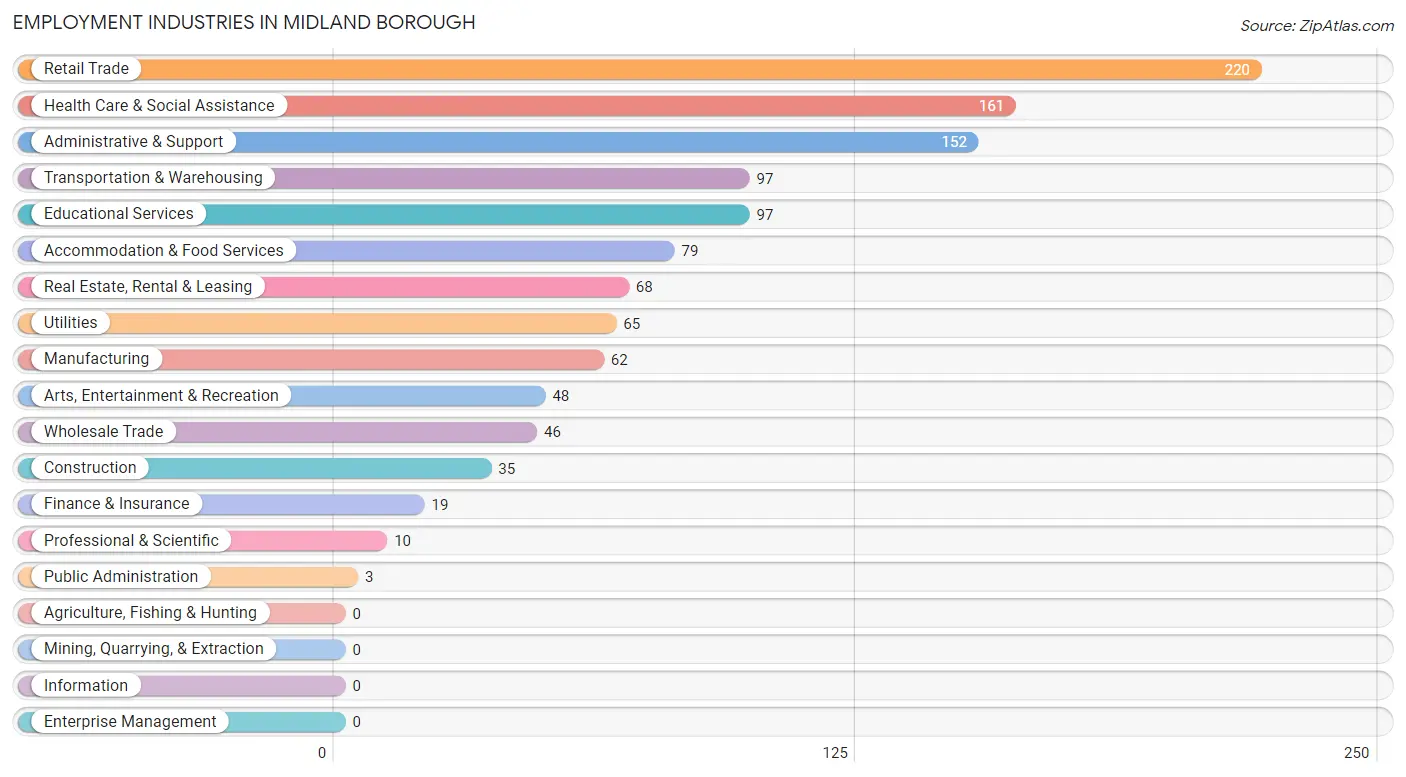
Employment Industries in Midland borough
The major employment industries in Midland borough include Retail Trade (220 | 18.4%), Health Care & Social Assistance (161 | 13.5%), Administrative & Support (152 | 12.7%), Transportation & Warehousing (97 | 8.1%), and Educational Services (97 | 8.1%).
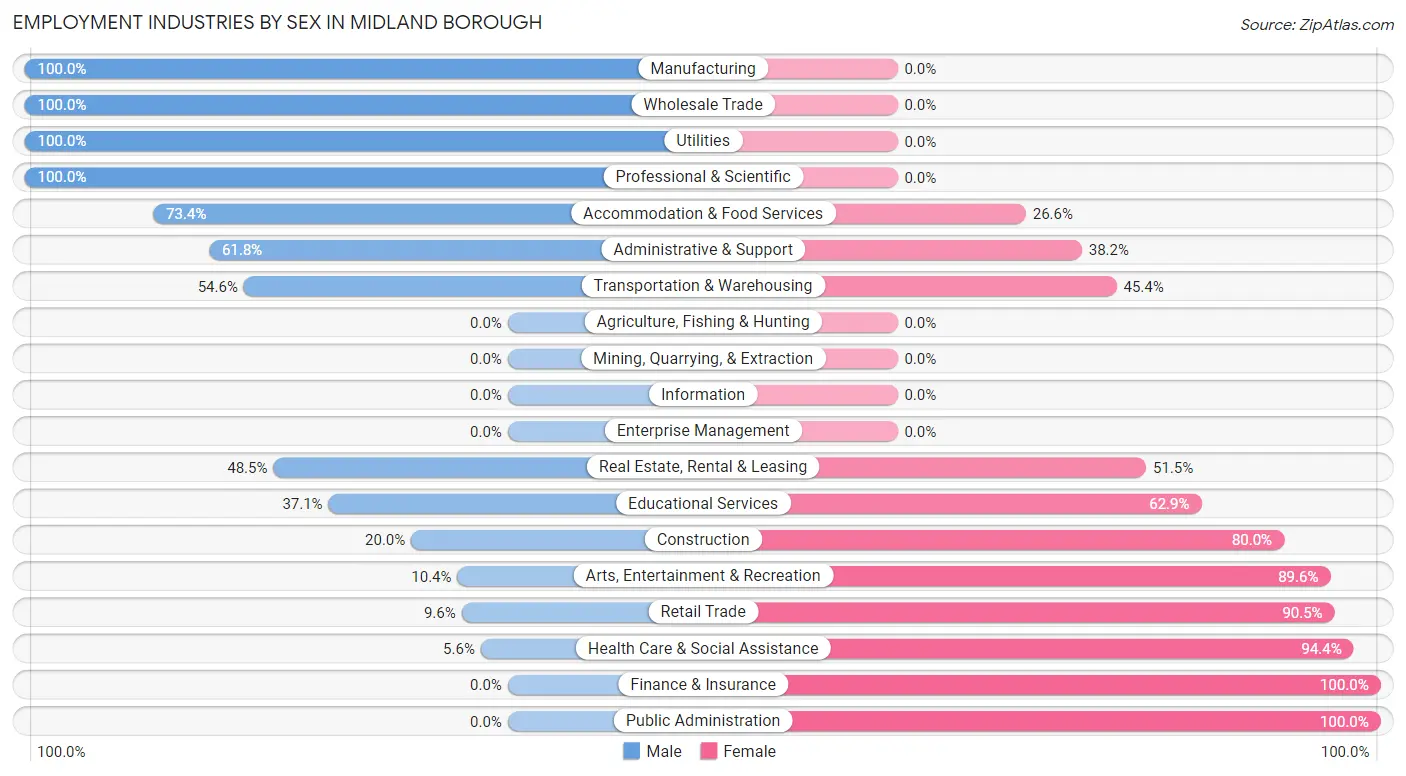
Employment Industries by Sex in Midland borough
The Midland borough industries that see more men than women are Manufacturing (100.0%), Wholesale Trade (100.0%), and Utilities (100.0%), whereas the industries that tend to have a higher number of women are Finance & Insurance (100.0%), Public Administration (100.0%), and Health Care & Social Assistance (94.4%).
| Industry | Male | Female |
| Agriculture, Fishing & Hunting | 0 (0.0%) | 0 (0.0%) |
| Mining, Quarrying, & Extraction | 0 (0.0%) | 0 (0.0%) |
| Construction | 7 (20.0%) | 28 (80.0%) |
| Manufacturing | 62 (100.0%) | 0 (0.0%) |
| Wholesale Trade | 46 (100.0%) | 0 (0.0%) |
| Retail Trade | 21 (9.6%) | 199 (90.4%) |
| Transportation & Warehousing | 53 (54.6%) | 44 (45.4%) |
| Utilities | 65 (100.0%) | 0 (0.0%) |
| Information | 0 (0.0%) | 0 (0.0%) |
| Finance & Insurance | 0 (0.0%) | 19 (100.0%) |
| Real Estate, Rental & Leasing | 33 (48.5%) | 35 (51.5%) |
| Professional & Scientific | 10 (100.0%) | 0 (0.0%) |
| Enterprise Management | 0 (0.0%) | 0 (0.0%) |
| Administrative & Support | 94 (61.8%) | 58 (38.2%) |
| Educational Services | 36 (37.1%) | 61 (62.9%) |
| Health Care & Social Assistance | 9 (5.6%) | 152 (94.4%) |
| Arts, Entertainment & Recreation | 5 (10.4%) | 43 (89.6%) |
| Accommodation & Food Services | 58 (73.4%) | 21 (26.6%) |
| Public Administration | 0 (0.0%) | 3 (100.0%) |
| Total | 531 (44.5%) | 663 (55.5%) |
Education in Midland borough
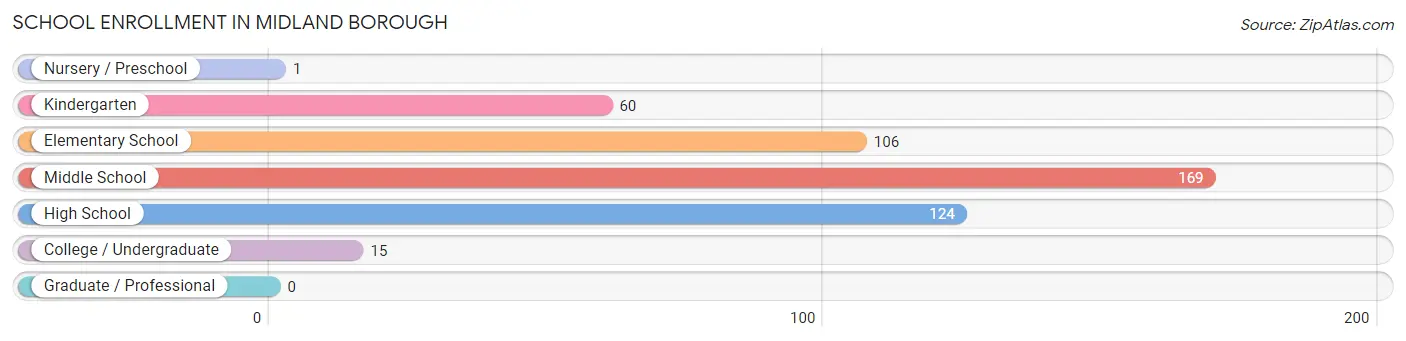
School Enrollment in Midland borough
The most common levels of schooling among the 475 students in Midland borough are middle school (169 | 35.6%), high school (124 | 26.1%), and elementary school (106 | 22.3%).
| School Level | # Students | % Students |
| Nursery / Preschool | 1 | 0.2% |
| Kindergarten | 60 | 12.6% |
| Elementary School | 106 | 22.3% |
| Middle School | 169 | 35.6% |
| High School | 124 | 26.1% |
| College / Undergraduate | 15 | 3.2% |
| Graduate / Professional | 0 | 0.0% |
| Total | 475 | 100.0% |
School Enrollment by Age by Funding Source in Midland borough
Out of a total of 475 students who are enrolled in schools in Midland borough, 12 (2.5%) attend a private institution, while the remaining 463 (97.5%) are enrolled in public schools. The age group of 10 to 14 year olds has the highest likelihood of being enrolled in private schools, with 12 (7.0% in the age bracket) enrolled. Conversely, the age group of 3 to 4 year olds has the lowest likelihood of being enrolled in a private school, with 1 (100.0% in the age bracket) attending a public institution.
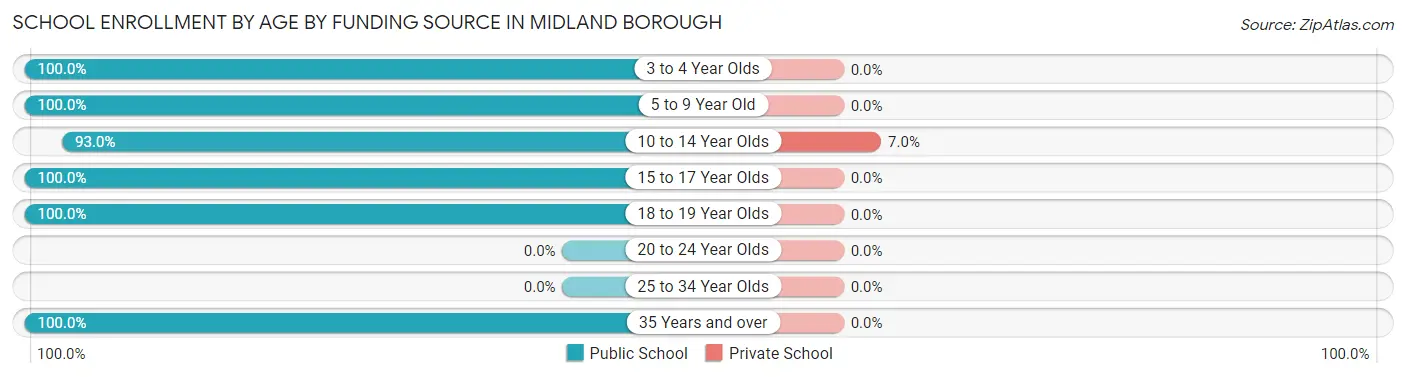
| Age Bracket | Public School | Private School |
| 3 to 4 Year Olds | 1 (100.0%) | 0 (0.0%) |
| 5 to 9 Year Old | 132 (100.0%) | 0 (0.0%) |
| 10 to 14 Year Olds | 160 (93.0%) | 12 (7.0%) |
| 15 to 17 Year Olds | 122 (100.0%) | 0 (0.0%) |
| 18 to 19 Year Olds | 17 (100.0%) | 0 (0.0%) |
| 20 to 24 Year Olds | 0 (0.0%) | 0 (0.0%) |
| 25 to 34 Year Olds | 0 (0.0%) | 0 (0.0%) |
| 35 Years and over | 31 (100.0%) | 0 (0.0%) |
| Total | 463 (97.5%) | 12 (2.5%) |
Educational Attainment by Field of Study in Midland borough
Education (43 | 26.5%), social sciences (31 | 19.1%), arts & humanities (21 | 13.0%), business (16 | 9.9%), and liberal arts & history (14 | 8.6%) are the most common fields of study among 162 individuals in Midland borough who have obtained a bachelor's degree or higher.
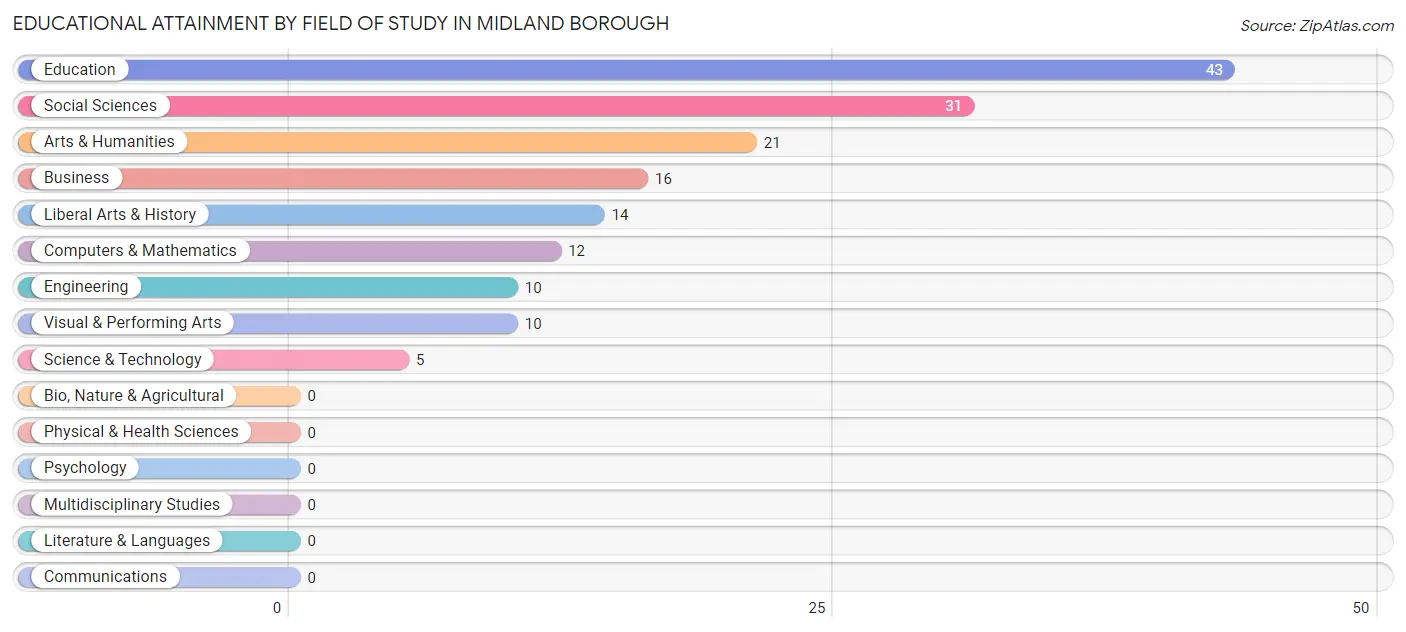
| Field of Study | # Graduates | % Graduates |
| Computers & Mathematics | 12 | 7.4% |
| Bio, Nature & Agricultural | 0 | 0.0% |
| Physical & Health Sciences | 0 | 0.0% |
| Psychology | 0 | 0.0% |
| Social Sciences | 31 | 19.1% |
| Engineering | 10 | 6.2% |
| Multidisciplinary Studies | 0 | 0.0% |
| Science & Technology | 5 | 3.1% |
| Business | 16 | 9.9% |
| Education | 43 | 26.5% |
| Literature & Languages | 0 | 0.0% |
| Liberal Arts & History | 14 | 8.6% |
| Visual & Performing Arts | 10 | 6.2% |
| Communications | 0 | 0.0% |
| Arts & Humanities | 21 | 13.0% |
| Total | 162 | 100.0% |
Transportation & Commute in Midland borough
Vehicle Availability by Sex in Midland borough
The most prevalent vehicle ownership categories in Midland borough are males with 2 vehicles (196, accounting for 36.9%) and females with 2 vehicles (224, making up 33.9%).
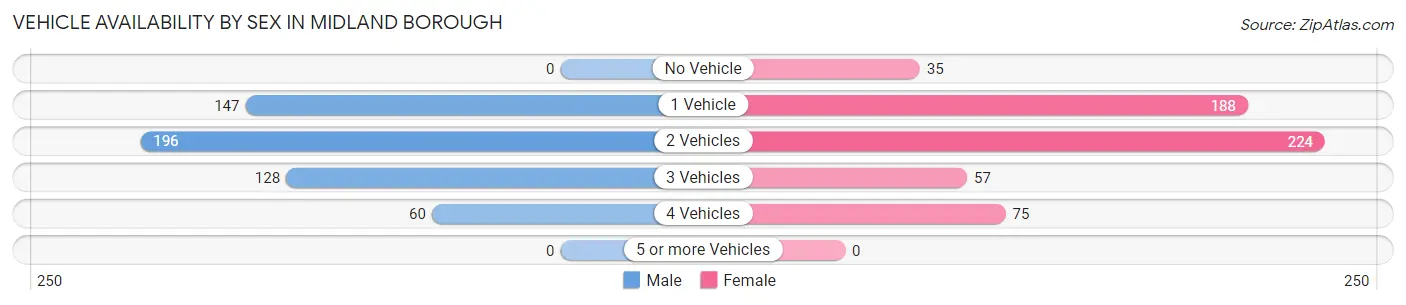
| Vehicles Available | Male | Female |
| No Vehicle | 0 (0.0%) | 35 (6.0%) |
| 1 Vehicle | 147 (27.7%) | 188 (32.5%) |
| 2 Vehicles | 196 (36.9%) | 224 (38.7%) |
| 3 Vehicles | 128 (24.1%) | 57 (9.8%) |
| 4 Vehicles | 60 (11.3%) | 75 (13.0%) |
| 5 or more Vehicles | 0 (0.0%) | 0 (0.0%) |
| Total | 531 (100.0%) | 579 (100.0%) |
Commute Time in Midland borough
The most frequently occuring commute durations in Midland borough are 30 to 34 minutes (179 commuters, 16.3%), 20 to 24 minutes (174 commuters, 15.9%), and 10 to 14 minutes (156 commuters, 14.2%).
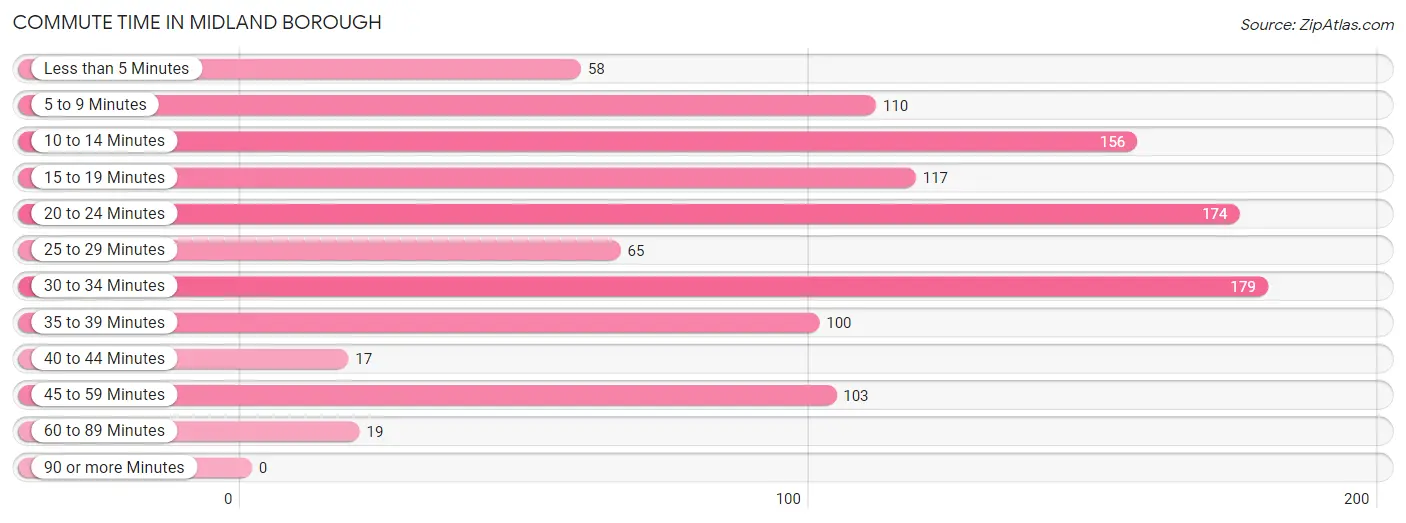
| Commute Time | # Commuters | % Commuters |
| Less than 5 Minutes | 58 | 5.3% |
| 5 to 9 Minutes | 110 | 10.0% |
| 10 to 14 Minutes | 156 | 14.2% |
| 15 to 19 Minutes | 117 | 10.7% |
| 20 to 24 Minutes | 174 | 15.9% |
| 25 to 29 Minutes | 65 | 5.9% |
| 30 to 34 Minutes | 179 | 16.3% |
| 35 to 39 Minutes | 100 | 9.1% |
| 40 to 44 Minutes | 17 | 1.5% |
| 45 to 59 Minutes | 103 | 9.4% |
| 60 to 89 Minutes | 19 | 1.7% |
| 90 or more Minutes | 0 | 0.0% |
Commute Time by Sex in Midland borough
The most common commute times in Midland borough are 10 to 14 minutes (116 commuters, 22.4%) for males and 20 to 24 minutes (105 commuters, 18.1%) for females.
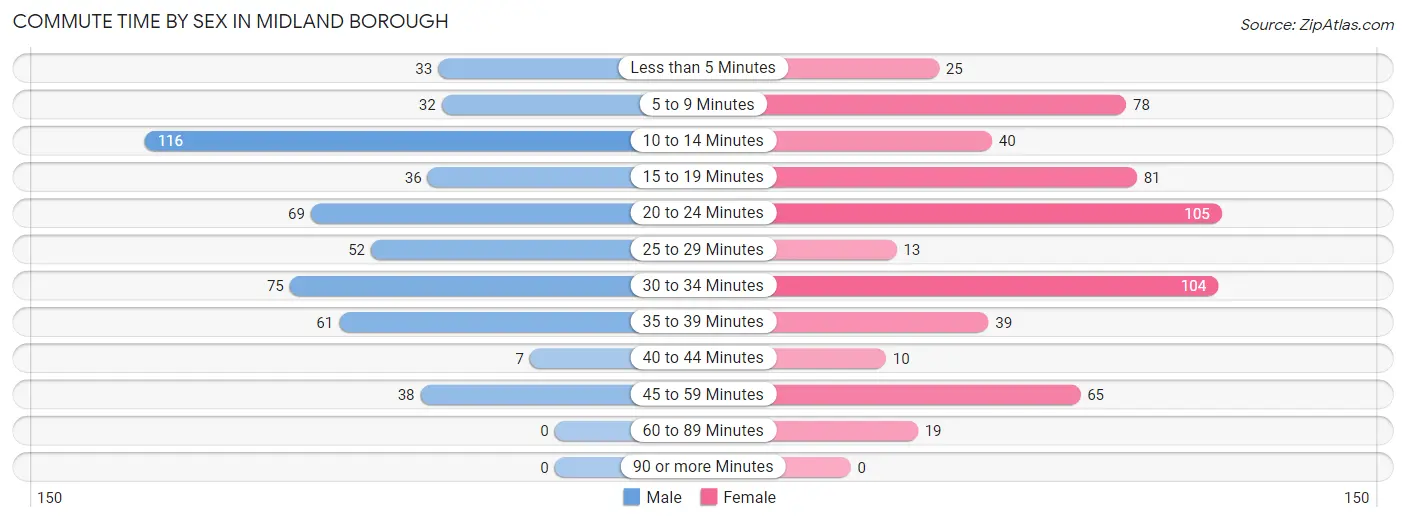
| Commute Time | Male | Female |
| Less than 5 Minutes | 33 (6.4%) | 25 (4.3%) |
| 5 to 9 Minutes | 32 (6.2%) | 78 (13.5%) |
| 10 to 14 Minutes | 116 (22.4%) | 40 (6.9%) |
| 15 to 19 Minutes | 36 (6.9%) | 81 (14.0%) |
| 20 to 24 Minutes | 69 (13.3%) | 105 (18.1%) |
| 25 to 29 Minutes | 52 (10.0%) | 13 (2.2%) |
| 30 to 34 Minutes | 75 (14.4%) | 104 (18.0%) |
| 35 to 39 Minutes | 61 (11.7%) | 39 (6.7%) |
| 40 to 44 Minutes | 7 (1.3%) | 10 (1.7%) |
| 45 to 59 Minutes | 38 (7.3%) | 65 (11.2%) |
| 60 to 89 Minutes | 0 (0.0%) | 19 (3.3%) |
| 90 or more Minutes | 0 (0.0%) | 0 (0.0%) |
Time of Departure to Work by Sex in Midland borough
The most frequent times of departure to work in Midland borough are 6:30 AM to 6:59 AM (103, 19.9%) for males and 7:00 AM to 7:29 AM (79, 13.6%) for females.
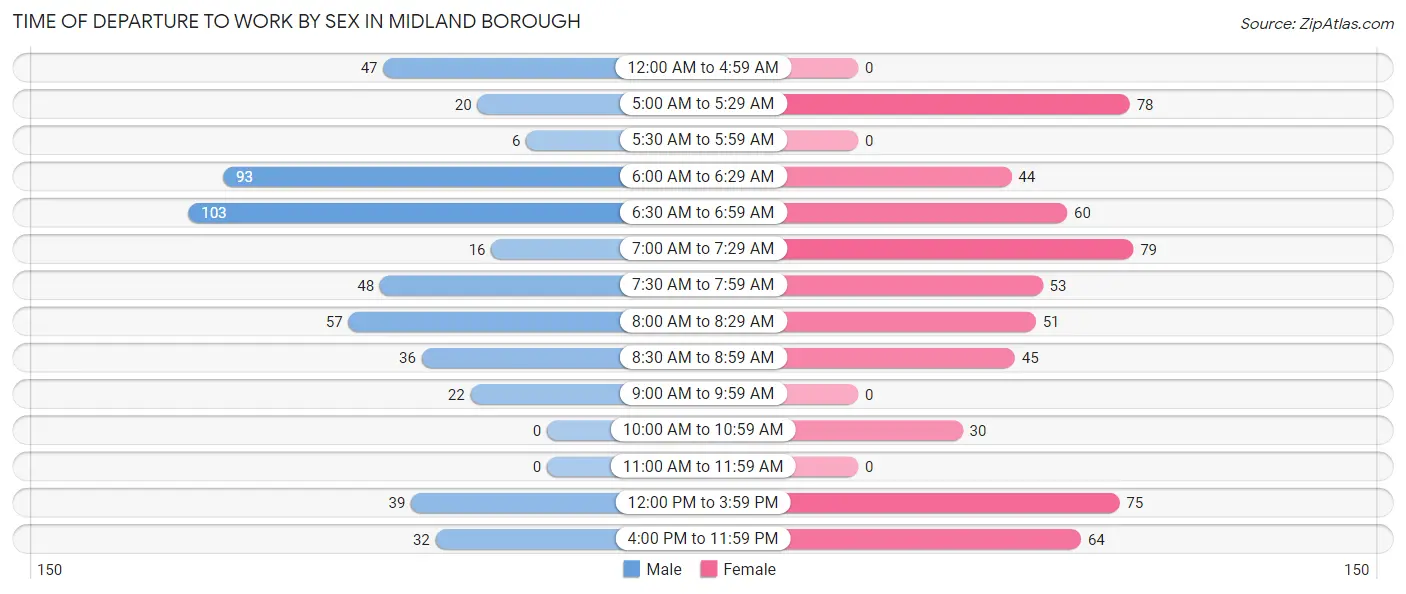
| Time of Departure | Male | Female |
| 12:00 AM to 4:59 AM | 47 (9.1%) | 0 (0.0%) |
| 5:00 AM to 5:29 AM | 20 (3.8%) | 78 (13.5%) |
| 5:30 AM to 5:59 AM | 6 (1.2%) | 0 (0.0%) |
| 6:00 AM to 6:29 AM | 93 (17.9%) | 44 (7.6%) |
| 6:30 AM to 6:59 AM | 103 (19.9%) | 60 (10.4%) |
| 7:00 AM to 7:29 AM | 16 (3.1%) | 79 (13.6%) |
| 7:30 AM to 7:59 AM | 48 (9.2%) | 53 (9.1%) |
| 8:00 AM to 8:29 AM | 57 (11.0%) | 51 (8.8%) |
| 8:30 AM to 8:59 AM | 36 (6.9%) | 45 (7.8%) |
| 9:00 AM to 9:59 AM | 22 (4.2%) | 0 (0.0%) |
| 10:00 AM to 10:59 AM | 0 (0.0%) | 30 (5.2%) |
| 11:00 AM to 11:59 AM | 0 (0.0%) | 0 (0.0%) |
| 12:00 PM to 3:59 PM | 39 (7.5%) | 75 (13.0%) |
| 4:00 PM to 11:59 PM | 32 (6.2%) | 64 (11.1%) |
| Total | 519 (100.0%) | 579 (100.0%) |
Housing Occupancy in Midland borough
Occupancy by Ownership in Midland borough
Of the total 1,116 dwellings in Midland borough, owner-occupied units account for 525 (47.0%), while renter-occupied units make up 591 (53.0%).
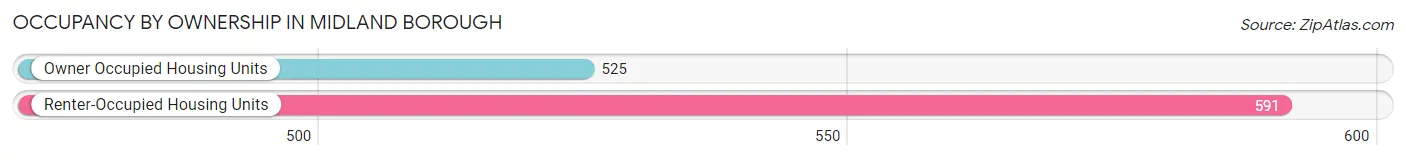
| Occupancy | # Housing Units | % Housing Units |
| Owner Occupied Housing Units | 525 | 47.0% |
| Renter-Occupied Housing Units | 591 | 53.0% |
| Total Occupied Housing Units | 1,116 | 100.0% |
Occupancy by Household Size in Midland borough
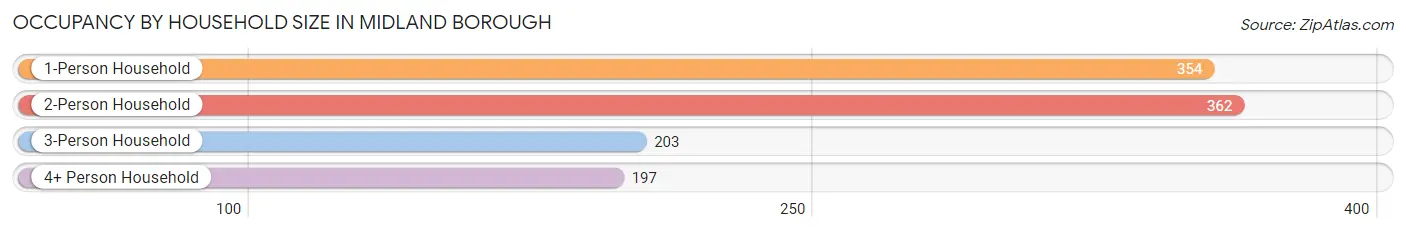
| Household Size | # Housing Units | % Housing Units |
| 1-Person Household | 354 | 31.7% |
| 2-Person Household | 362 | 32.4% |
| 3-Person Household | 203 | 18.2% |
| 4+ Person Household | 197 | 17.6% |
| Total Housing Units | 1,116 | 100.0% |
Occupancy by Ownership by Household Size in Midland borough
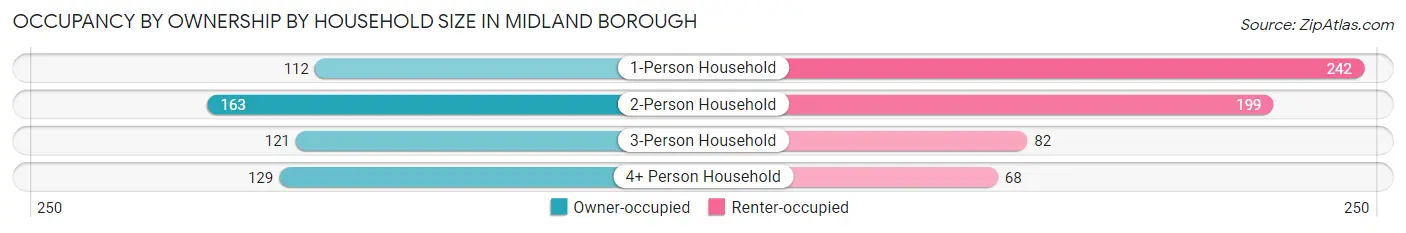
| Household Size | Owner-occupied | Renter-occupied |
| 1-Person Household | 112 (31.6%) | 242 (68.4%) |
| 2-Person Household | 163 (45.0%) | 199 (55.0%) |
| 3-Person Household | 121 (59.6%) | 82 (40.4%) |
| 4+ Person Household | 129 (65.5%) | 68 (34.5%) |
| Total Housing Units | 525 (47.0%) | 591 (53.0%) |
Occupancy by Educational Attainment in Midland borough
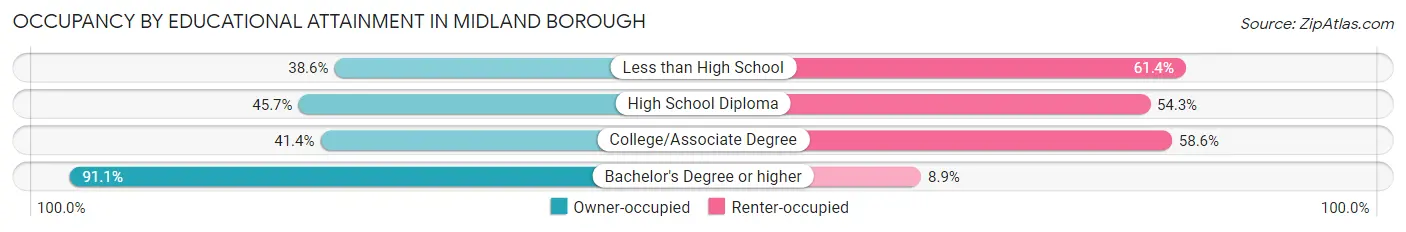
| Household Size | Owner-occupied | Renter-occupied |
| Less than High School | 44 (38.6%) | 70 (61.4%) |
| High School Diploma | 171 (45.7%) | 203 (54.3%) |
| College/Associate Degree | 218 (41.4%) | 309 (58.6%) |
| Bachelor's Degree or higher | 92 (91.1%) | 9 (8.9%) |
Occupancy by Age of Householder in Midland borough
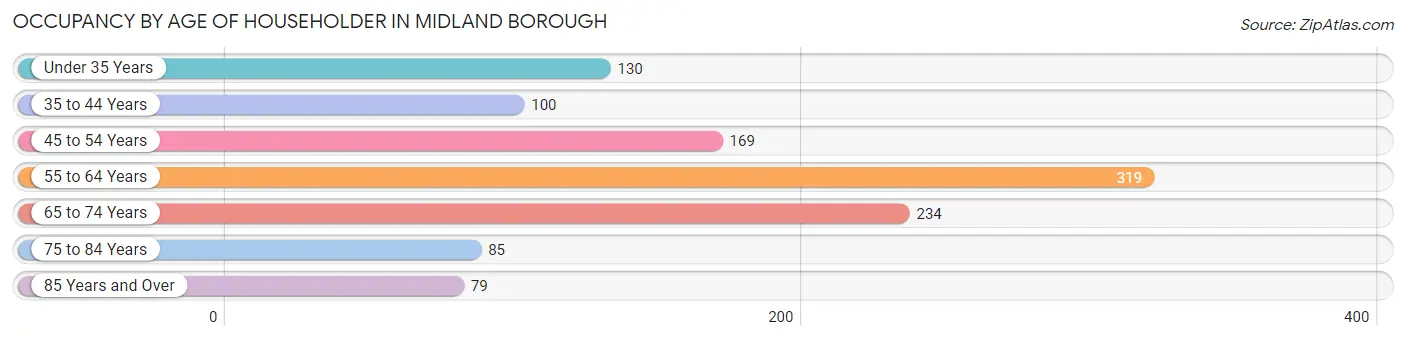
| Age Bracket | # Households | % Households |
| Under 35 Years | 130 | 11.7% |
| 35 to 44 Years | 100 | 9.0% |
| 45 to 54 Years | 169 | 15.1% |
| 55 to 64 Years | 319 | 28.6% |
| 65 to 74 Years | 234 | 21.0% |
| 75 to 84 Years | 85 | 7.6% |
| 85 Years and Over | 79 | 7.1% |
| Total | 1,116 | 100.0% |
Housing Finances in Midland borough
Median Income by Occupancy in Midland borough
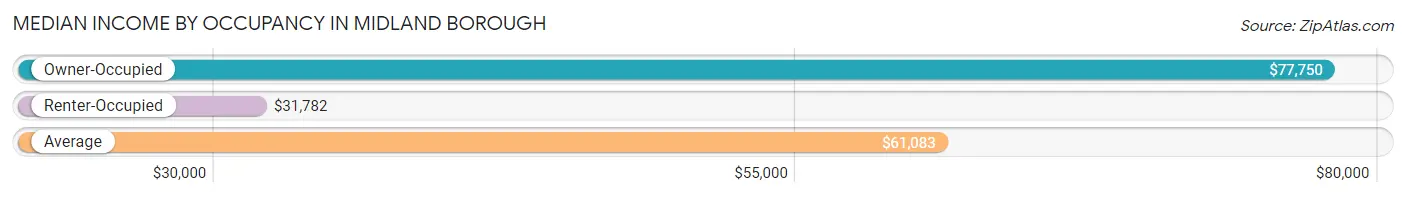
| Occupancy Type | # Households | Median Income |
| Owner-Occupied | 525 (47.0%) | $77,750 |
| Renter-Occupied | 591 (53.0%) | $31,782 |
| Average | 1,116 (100.0%) | $61,083 |
Occupancy by Householder Income Bracket in Midland borough
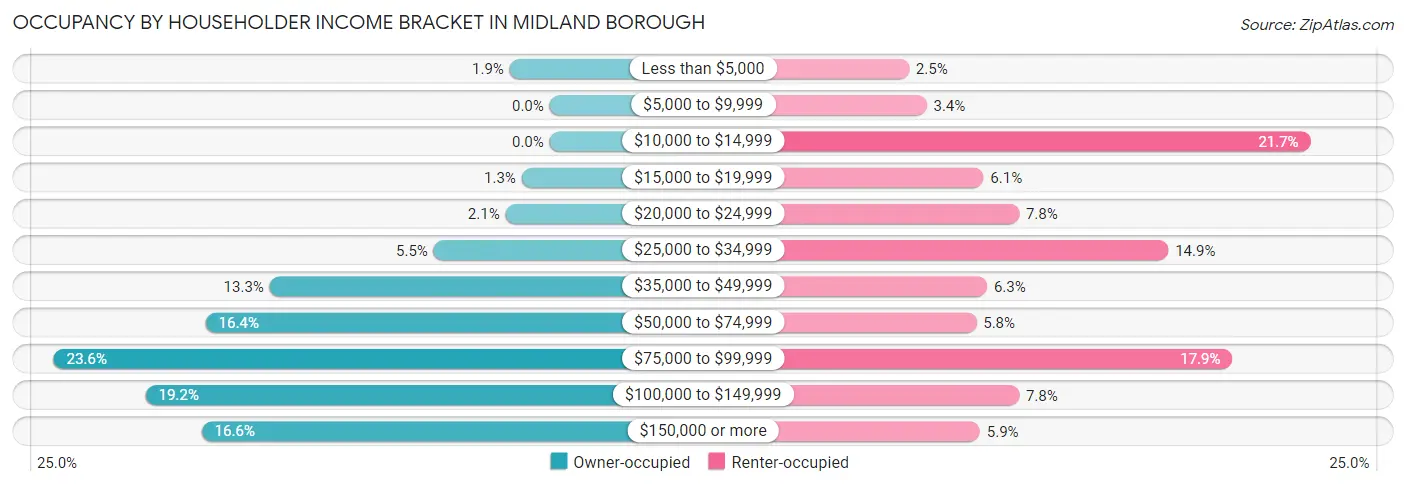
| Income Bracket | Owner-occupied | Renter-occupied |
| Less than $5,000 | 10 (1.9%) | 15 (2.5%) |
| $5,000 to $9,999 | 0 (0.0%) | 20 (3.4%) |
| $10,000 to $14,999 | 0 (0.0%) | 128 (21.7%) |
| $15,000 to $19,999 | 7 (1.3%) | 36 (6.1%) |
| $20,000 to $24,999 | 11 (2.1%) | 46 (7.8%) |
| $25,000 to $34,999 | 29 (5.5%) | 88 (14.9%) |
| $35,000 to $49,999 | 70 (13.3%) | 37 (6.3%) |
| $50,000 to $74,999 | 86 (16.4%) | 34 (5.8%) |
| $75,000 to $99,999 | 124 (23.6%) | 106 (17.9%) |
| $100,000 to $149,999 | 101 (19.2%) | 46 (7.8%) |
| $150,000 or more | 87 (16.6%) | 35 (5.9%) |
| Total | 525 (100.0%) | 591 (100.0%) |
Monthly Housing Cost Tiers in Midland borough
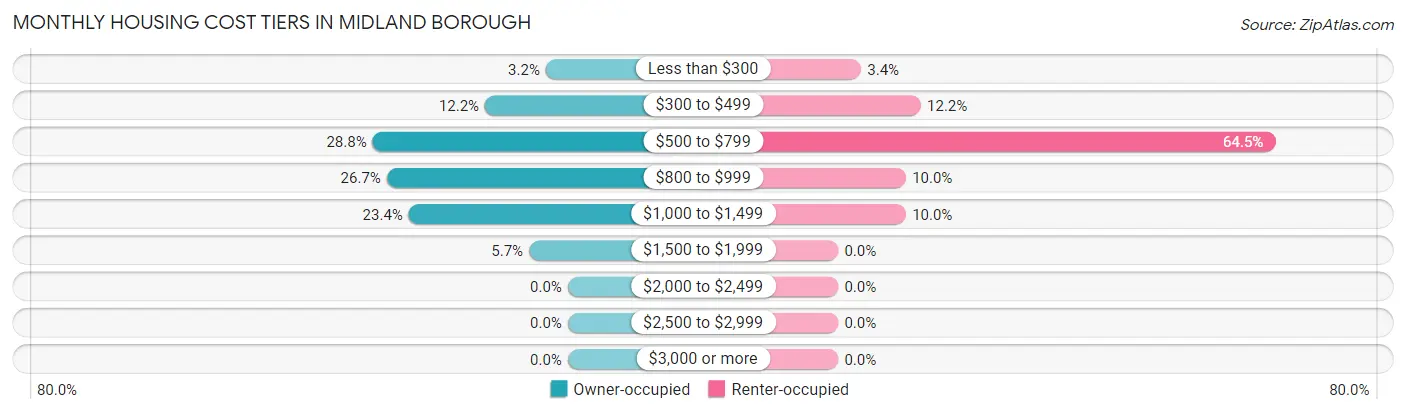
| Monthly Cost | Owner-occupied | Renter-occupied |
| Less than $300 | 17 (3.2%) | 20 (3.4%) |
| $300 to $499 | 64 (12.2%) | 72 (12.2%) |
| $500 to $799 | 151 (28.8%) | 381 (64.5%) |
| $800 to $999 | 140 (26.7%) | 59 (10.0%) |
| $1,000 to $1,499 | 123 (23.4%) | 59 (10.0%) |
| $1,500 to $1,999 | 30 (5.7%) | 0 (0.0%) |
| $2,000 to $2,499 | 0 (0.0%) | 0 (0.0%) |
| $2,500 to $2,999 | 0 (0.0%) | 0 (0.0%) |
| $3,000 or more | 0 (0.0%) | 0 (0.0%) |
| Total | 525 (100.0%) | 591 (100.0%) |
Physical Housing Characteristics in Midland borough
Housing Structures in Midland borough
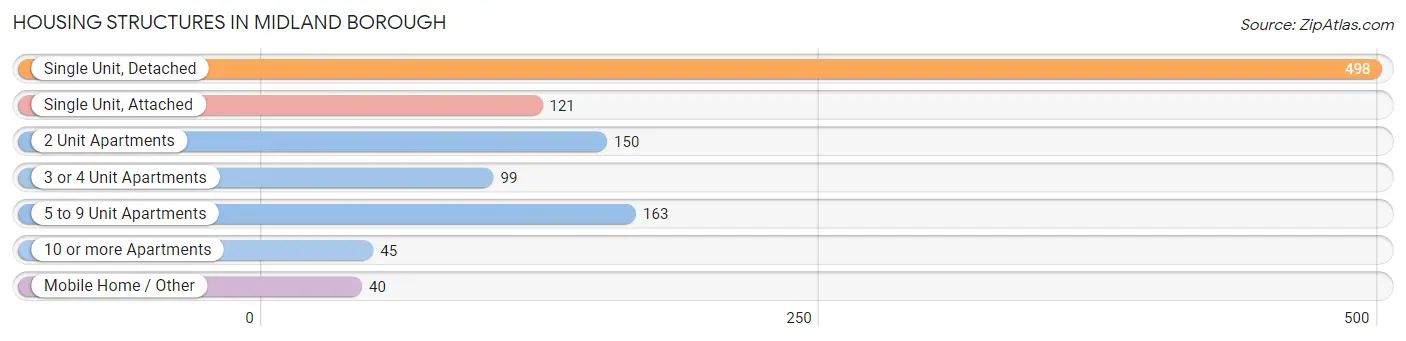
| Structure Type | # Housing Units | % Housing Units |
| Single Unit, Detached | 498 | 44.6% |
| Single Unit, Attached | 121 | 10.8% |
| 2 Unit Apartments | 150 | 13.4% |
| 3 or 4 Unit Apartments | 99 | 8.9% |
| 5 to 9 Unit Apartments | 163 | 14.6% |
| 10 or more Apartments | 45 | 4.0% |
| Mobile Home / Other | 40 | 3.6% |
| Total | 1,116 | 100.0% |
Housing Structures by Occupancy in Midland borough
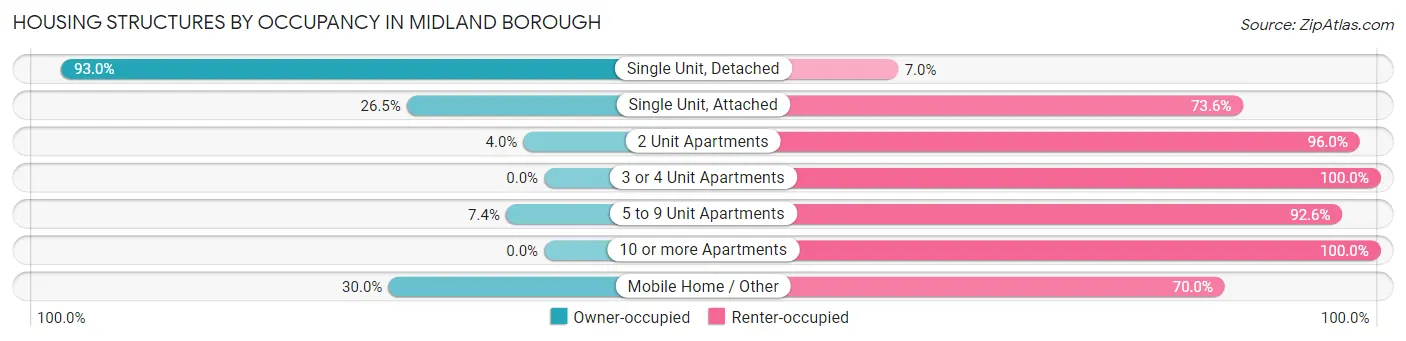
| Structure Type | Owner-occupied | Renter-occupied |
| Single Unit, Detached | 463 (93.0%) | 35 (7.0%) |
| Single Unit, Attached | 32 (26.5%) | 89 (73.6%) |
| 2 Unit Apartments | 6 (4.0%) | 144 (96.0%) |
| 3 or 4 Unit Apartments | 0 (0.0%) | 99 (100.0%) |
| 5 to 9 Unit Apartments | 12 (7.4%) | 151 (92.6%) |
| 10 or more Apartments | 0 (0.0%) | 45 (100.0%) |
| Mobile Home / Other | 12 (30.0%) | 28 (70.0%) |
| Total | 525 (47.0%) | 591 (53.0%) |
Housing Structures by Number of Rooms in Midland borough
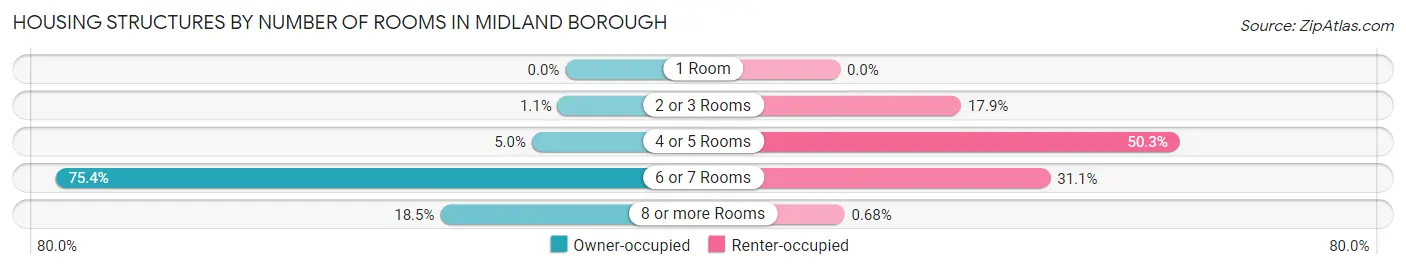
| Number of Rooms | Owner-occupied | Renter-occupied |
| 1 Room | 0 (0.0%) | 0 (0.0%) |
| 2 or 3 Rooms | 6 (1.1%) | 106 (17.9%) |
| 4 or 5 Rooms | 26 (5.0%) | 297 (50.2%) |
| 6 or 7 Rooms | 396 (75.4%) | 184 (31.1%) |
| 8 or more Rooms | 97 (18.5%) | 4 (0.7%) |
| Total | 525 (100.0%) | 591 (100.0%) |
Housing Structure by Heating Type in Midland borough
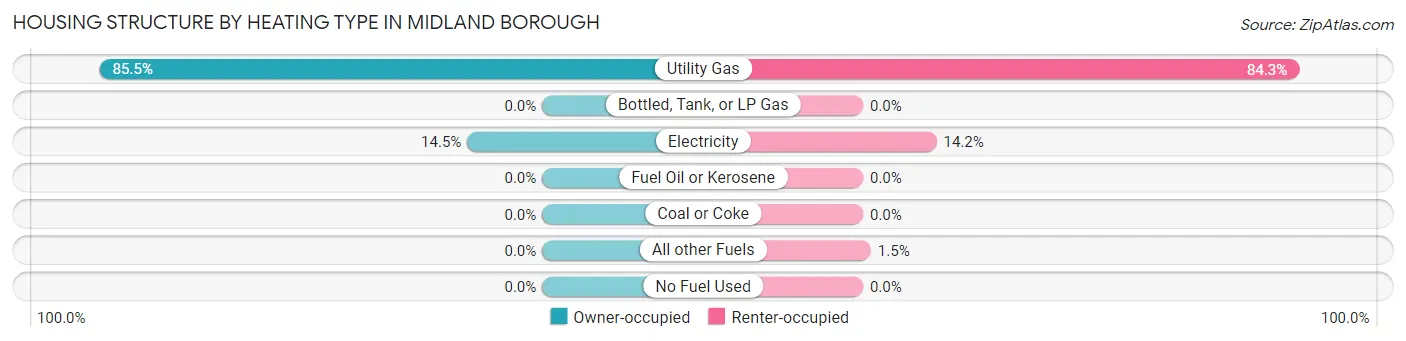
| Heating Type | Owner-occupied | Renter-occupied |
| Utility Gas | 449 (85.5%) | 498 (84.3%) |
| Bottled, Tank, or LP Gas | 0 (0.0%) | 0 (0.0%) |
| Electricity | 76 (14.5%) | 84 (14.2%) |
| Fuel Oil or Kerosene | 0 (0.0%) | 0 (0.0%) |
| Coal or Coke | 0 (0.0%) | 0 (0.0%) |
| All other Fuels | 0 (0.0%) | 9 (1.5%) |
| No Fuel Used | 0 (0.0%) | 0 (0.0%) |
| Total | 525 (100.0%) | 591 (100.0%) |
Household Vehicle Usage in Midland borough
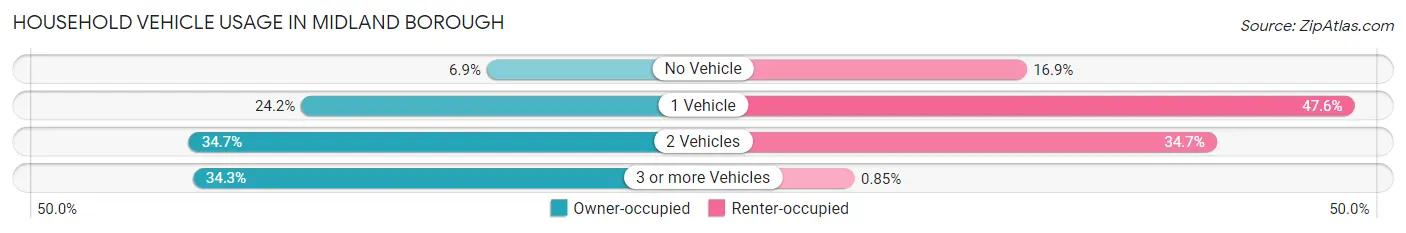
| Vehicles per Household | Owner-occupied | Renter-occupied |
| No Vehicle | 36 (6.9%) | 100 (16.9%) |
| 1 Vehicle | 127 (24.2%) | 281 (47.5%) |
| 2 Vehicles | 182 (34.7%) | 205 (34.7%) |
| 3 or more Vehicles | 180 (34.3%) | 5 (0.9%) |
| Total | 525 (100.0%) | 591 (100.0%) |
Real Estate & Mortgages in Midland borough
Real Estate and Mortgage Overview in Midland borough
| Characteristic | Without Mortgage | With Mortgage |
| Housing Units | 161 | 364 |
| Median Property Value | $58,900 | $90,500 |
| Median Household Income | $47,292 | $87 |
| Monthly Housing Costs | $507 | $0 |
| Real Estate Taxes | $711 | $7 |
Property Value by Mortgage Status in Midland borough
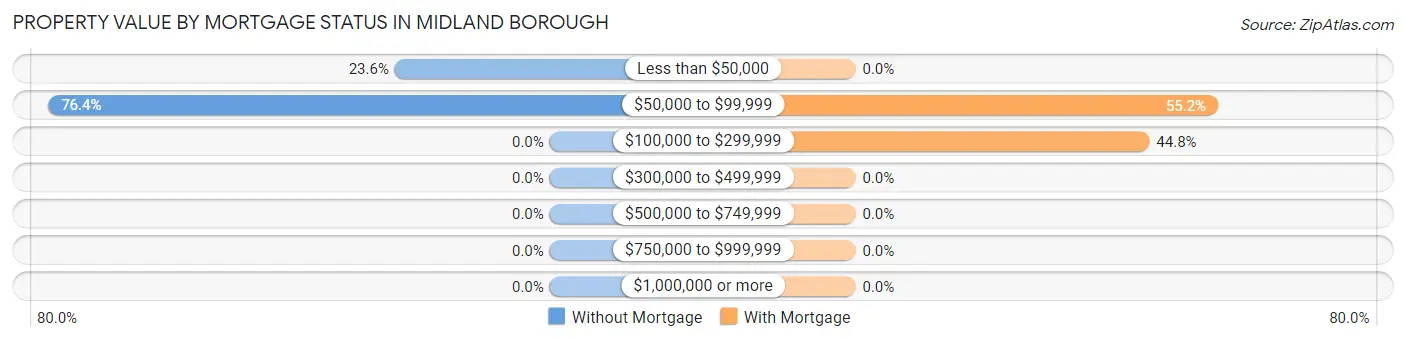
| Property Value | Without Mortgage | With Mortgage |
| Less than $50,000 | 38 (23.6%) | 0 (0.0%) |
| $50,000 to $99,999 | 123 (76.4%) | 201 (55.2%) |
| $100,000 to $299,999 | 0 (0.0%) | 163 (44.8%) |
| $300,000 to $499,999 | 0 (0.0%) | 0 (0.0%) |
| $500,000 to $749,999 | 0 (0.0%) | 0 (0.0%) |
| $750,000 to $999,999 | 0 (0.0%) | 0 (0.0%) |
| $1,000,000 or more | 0 (0.0%) | 0 (0.0%) |
| Total | 161 (100.0%) | 364 (100.0%) |
Household Income by Mortgage Status in Midland borough
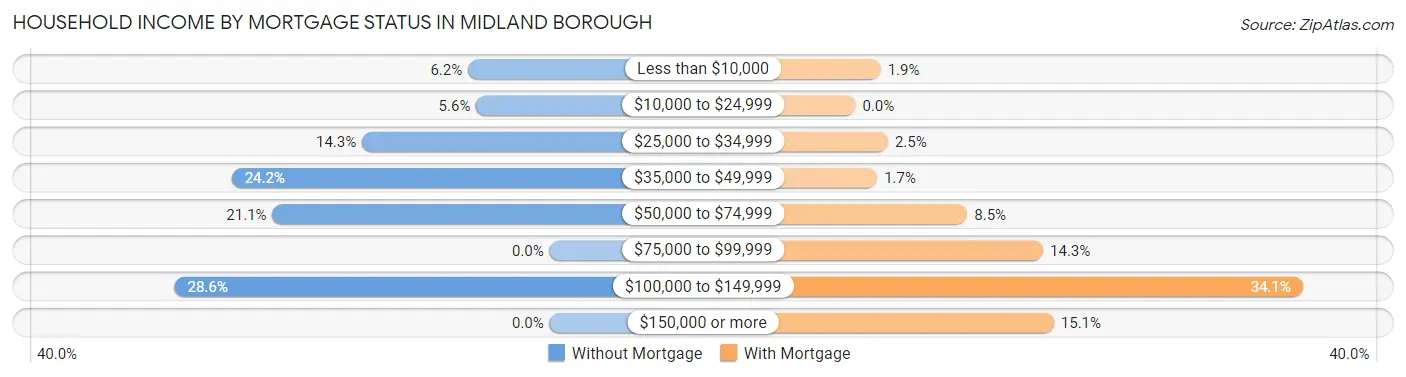
| Household Income | Without Mortgage | With Mortgage |
| Less than $10,000 | 10 (6.2%) | 7 (1.9%) |
| $10,000 to $24,999 | 9 (5.6%) | 0 (0.0%) |
| $25,000 to $34,999 | 23 (14.3%) | 9 (2.5%) |
| $35,000 to $49,999 | 39 (24.2%) | 6 (1.7%) |
| $50,000 to $74,999 | 34 (21.1%) | 31 (8.5%) |
| $75,000 to $99,999 | 0 (0.0%) | 52 (14.3%) |
| $100,000 to $149,999 | 46 (28.6%) | 124 (34.1%) |
| $150,000 or more | 0 (0.0%) | 55 (15.1%) |
| Total | 161 (100.0%) | 364 (100.0%) |
Property Value to Household Income Ratio in Midland borough
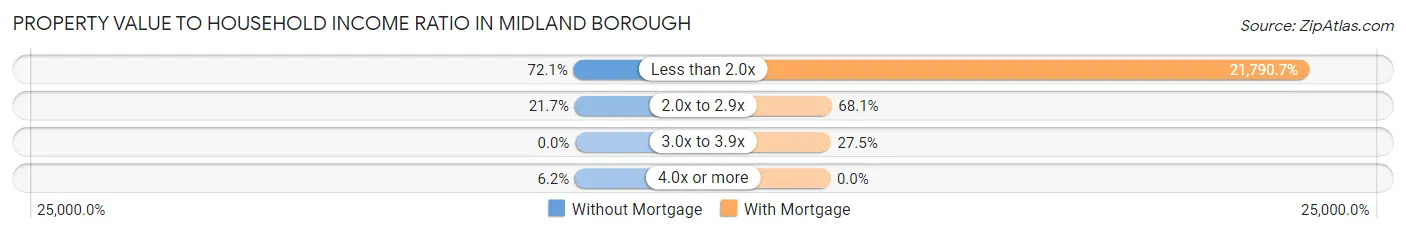
| Value-to-Income Ratio | Without Mortgage | With Mortgage |
| Less than 2.0x | 116 (72.1%) | 79,318 (21,790.7%) |
| 2.0x to 2.9x | 35 (21.7%) | 248 (68.1%) |
| 3.0x to 3.9x | 0 (0.0%) | 100 (27.5%) |
| 4.0x or more | 10 (6.2%) | 0 (0.0%) |
| Total | 161 (100.0%) | 364 (100.0%) |
Real Estate Taxes by Mortgage Status in Midland borough
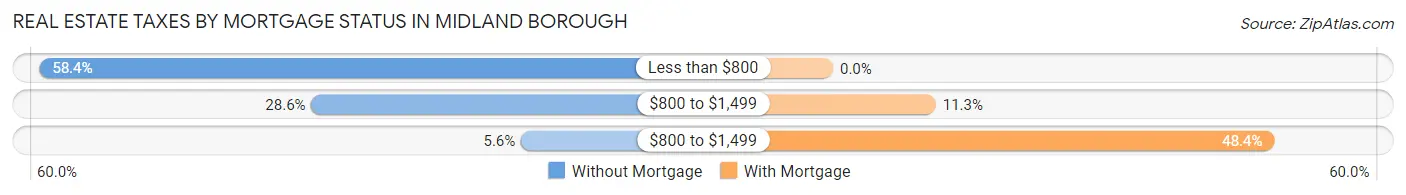
| Property Taxes | Without Mortgage | With Mortgage |
| Less than $800 | 94 (58.4%) | 0 (0.0%) |
| $800 to $1,499 | 46 (28.6%) | 41 (11.3%) |
| $800 to $1,499 | 9 (5.6%) | 176 (48.3%) |
| Total | 161 (100.0%) | 364 (100.0%) |
Health & Disability in Midland borough
Health Insurance Coverage by Age in Midland borough
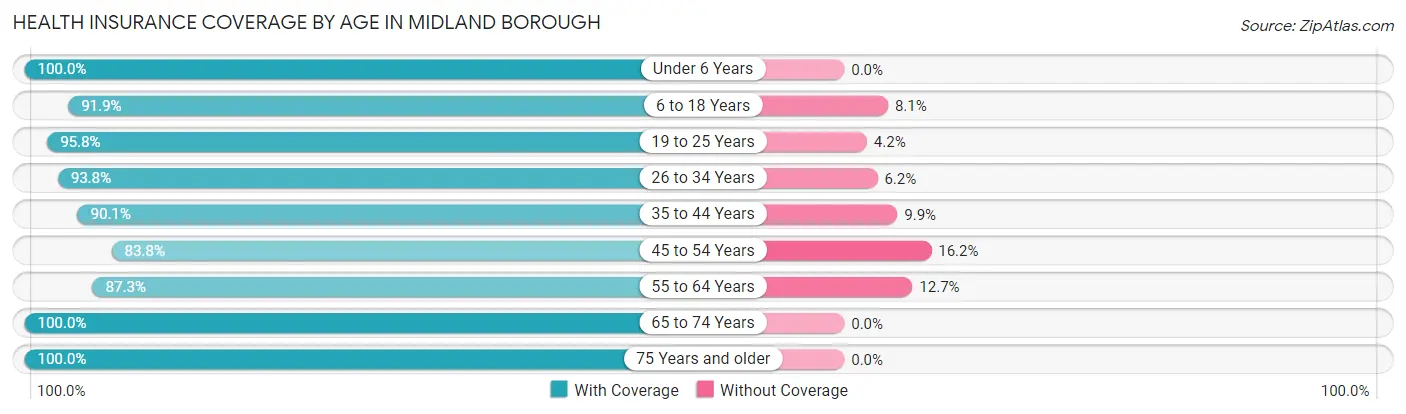
| Age Bracket | With Coverage | Without Coverage |
| Under 6 Years | 169 (100.0%) | 0 (0.0%) |
| 6 to 18 Years | 395 (91.9%) | 35 (8.1%) |
| 19 to 25 Years | 227 (95.8%) | 10 (4.2%) |
| 26 to 34 Years | 182 (93.8%) | 12 (6.2%) |
| 35 to 44 Years | 237 (90.1%) | 26 (9.9%) |
| 45 to 54 Years | 310 (83.8%) | 60 (16.2%) |
| 55 to 64 Years | 385 (87.3%) | 56 (12.7%) |
| 65 to 74 Years | 332 (100.0%) | 0 (0.0%) |
| 75 Years and older | 222 (100.0%) | 0 (0.0%) |
| Total | 2,459 (92.5%) | 199 (7.5%) |
Health Insurance Coverage by Citizenship Status in Midland borough
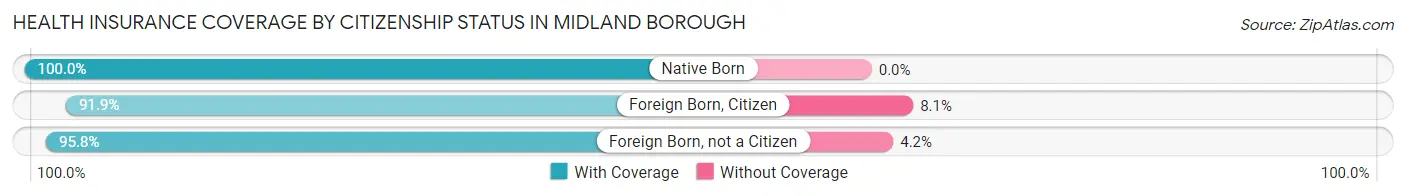
| Citizenship Status | With Coverage | Without Coverage |
| Native Born | 169 (100.0%) | 0 (0.0%) |
| Foreign Born, Citizen | 395 (91.9%) | 35 (8.1%) |
| Foreign Born, not a Citizen | 227 (95.8%) | 10 (4.2%) |
Health Insurance Coverage by Household Income in Midland borough
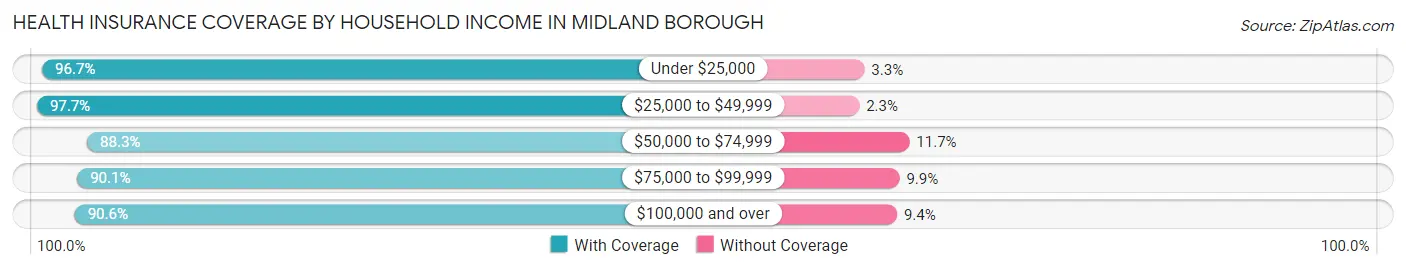
| Household Income | With Coverage | Without Coverage |
| Under $25,000 | 410 (96.7%) | 14 (3.3%) |
| $25,000 to $49,999 | 505 (97.7%) | 12 (2.3%) |
| $50,000 to $74,999 | 331 (88.3%) | 44 (11.7%) |
| $75,000 to $99,999 | 548 (90.1%) | 60 (9.9%) |
| $100,000 and over | 665 (90.6%) | 69 (9.4%) |
Public vs Private Health Insurance Coverage by Age in Midland borough
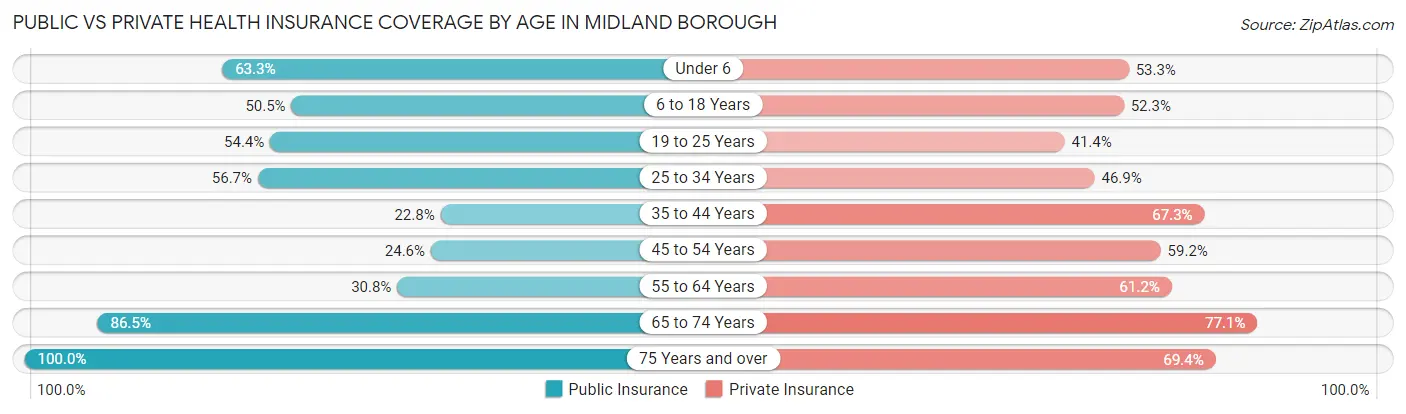
| Age Bracket | Public Insurance | Private Insurance |
| Under 6 | 107 (63.3%) | 90 (53.2%) |
| 6 to 18 Years | 217 (50.5%) | 225 (52.3%) |
| 19 to 25 Years | 129 (54.4%) | 98 (41.3%) |
| 25 to 34 Years | 110 (56.7%) | 91 (46.9%) |
| 35 to 44 Years | 60 (22.8%) | 177 (67.3%) |
| 45 to 54 Years | 91 (24.6%) | 219 (59.2%) |
| 55 to 64 Years | 136 (30.8%) | 270 (61.2%) |
| 65 to 74 Years | 287 (86.5%) | 256 (77.1%) |
| 75 Years and over | 222 (100.0%) | 154 (69.4%) |
| Total | 1,359 (51.1%) | 1,580 (59.4%) |
Disability Status by Sex by Age in Midland borough
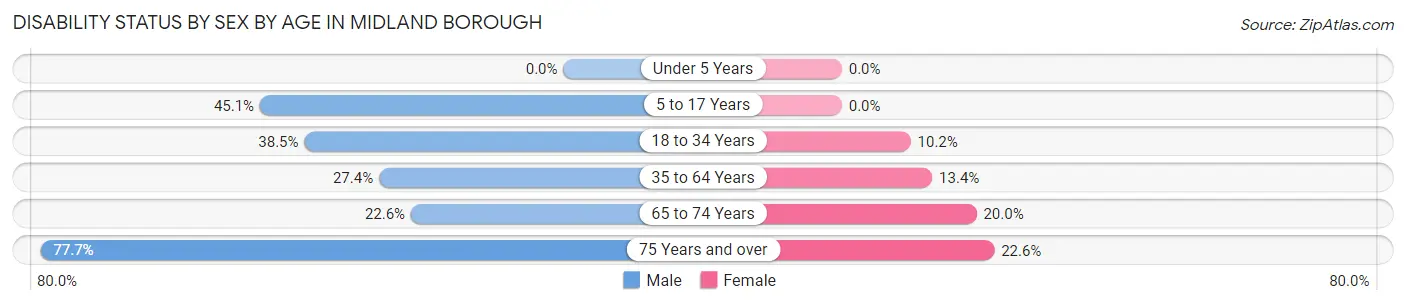
| Age Bracket | Male | Female |
| Under 5 Years | 0 (0.0%) | 0 (0.0%) |
| 5 to 17 Years | 91 (45.1%) | 0 (0.0%) |
| 18 to 34 Years | 95 (38.5%) | 19 (10.2%) |
| 35 to 64 Years | 141 (27.4%) | 75 (13.4%) |
| 65 to 74 Years | 31 (22.6%) | 39 (20.0%) |
| 75 Years and over | 66 (77.6%) | 31 (22.6%) |
Disability Class by Sex by Age in Midland borough
Disability Class: Hearing Difficulty
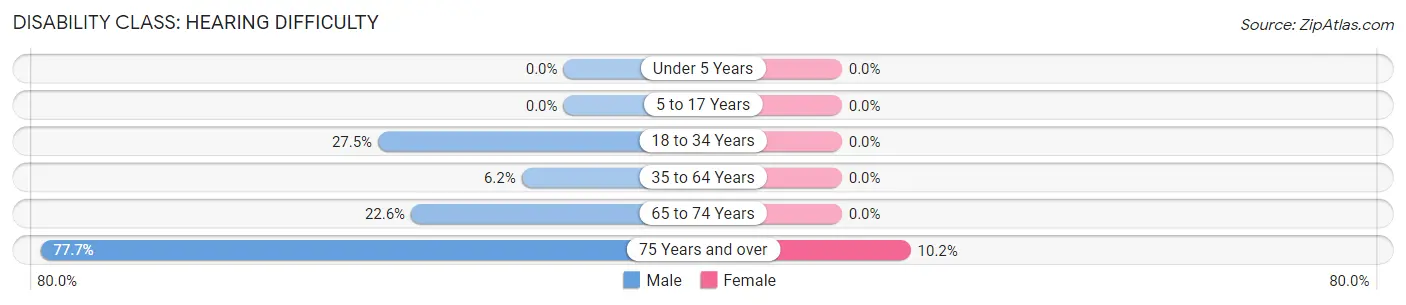
| Age Bracket | Male | Female |
| Under 5 Years | 0 (0.0%) | 0 (0.0%) |
| 5 to 17 Years | 0 (0.0%) | 0 (0.0%) |
| 18 to 34 Years | 68 (27.5%) | 0 (0.0%) |
| 35 to 64 Years | 32 (6.2%) | 0 (0.0%) |
| 65 to 74 Years | 31 (22.6%) | 0 (0.0%) |
| 75 Years and over | 66 (77.6%) | 14 (10.2%) |
Disability Class: Vision Difficulty

| Age Bracket | Male | Female |
| Under 5 Years | 0 (0.0%) | 0 (0.0%) |
| 5 to 17 Years | 0 (0.0%) | 0 (0.0%) |
| 18 to 34 Years | 0 (0.0%) | 0 (0.0%) |
| 35 to 64 Years | 0 (0.0%) | 0 (0.0%) |
| 65 to 74 Years | 0 (0.0%) | 0 (0.0%) |
| 75 Years and over | 0 (0.0%) | 4 (2.9%) |
Disability Class: Cognitive Difficulty
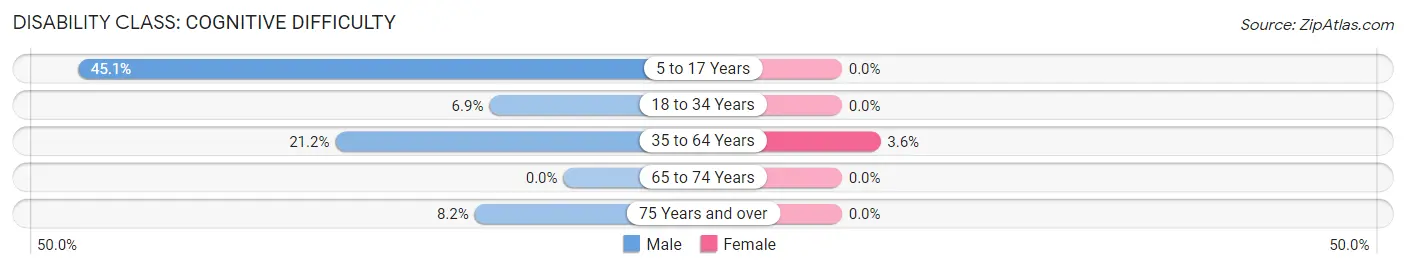
| Age Bracket | Male | Female |
| 5 to 17 Years | 91 (45.1%) | 0 (0.0%) |
| 18 to 34 Years | 17 (6.9%) | 0 (0.0%) |
| 35 to 64 Years | 109 (21.2%) | 20 (3.6%) |
| 65 to 74 Years | 0 (0.0%) | 0 (0.0%) |
| 75 Years and over | 7 (8.2%) | 0 (0.0%) |
Disability Class: Ambulatory Difficulty
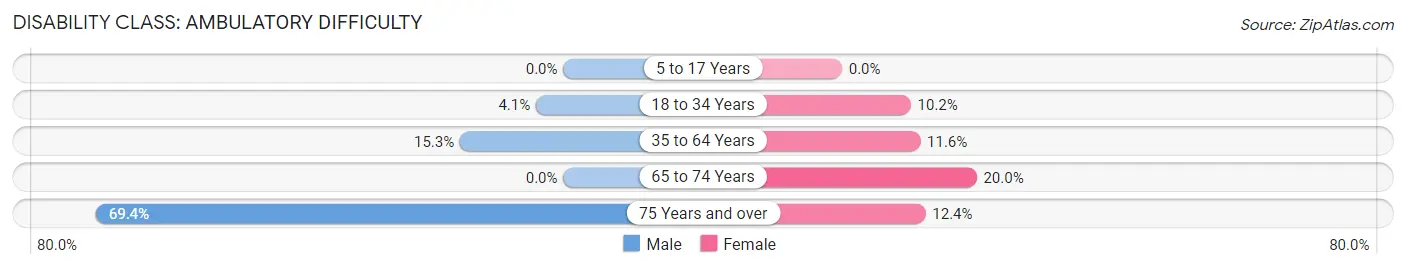
| Age Bracket | Male | Female |
| 5 to 17 Years | 0 (0.0%) | 0 (0.0%) |
| 18 to 34 Years | 10 (4.1%) | 19 (10.2%) |
| 35 to 64 Years | 79 (15.3%) | 65 (11.6%) |
| 65 to 74 Years | 0 (0.0%) | 39 (20.0%) |
| 75 Years and over | 59 (69.4%) | 17 (12.4%) |
Disability Class: Self-Care Difficulty
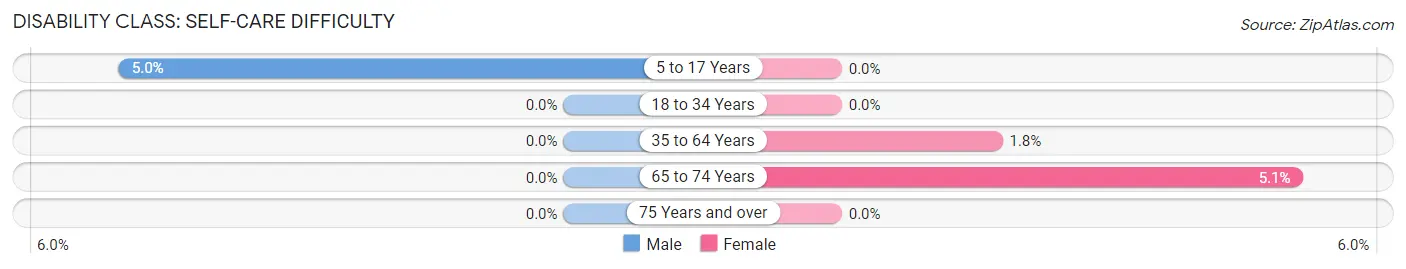
| Age Bracket | Male | Female |
| 5 to 17 Years | 10 (5.0%) | 0 (0.0%) |
| 18 to 34 Years | 0 (0.0%) | 0 (0.0%) |
| 35 to 64 Years | 0 (0.0%) | 10 (1.8%) |
| 65 to 74 Years | 0 (0.0%) | 10 (5.1%) |
| 75 Years and over | 0 (0.0%) | 0 (0.0%) |
Technology Access in Midland borough
Computing Device Access in Midland borough
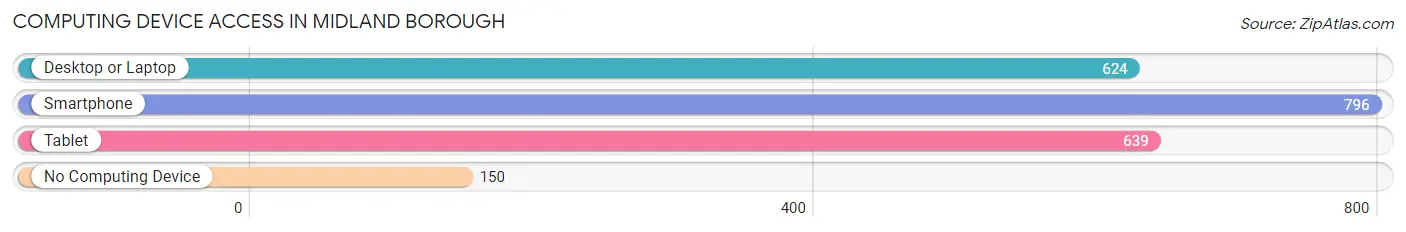
| Device Type | # Households | % Households |
| Desktop or Laptop | 624 | 55.9% |
| Smartphone | 796 | 71.3% |
| Tablet | 639 | 57.3% |
| No Computing Device | 150 | 13.4% |
| Total | 1,116 | 100.0% |
Internet Access in Midland borough
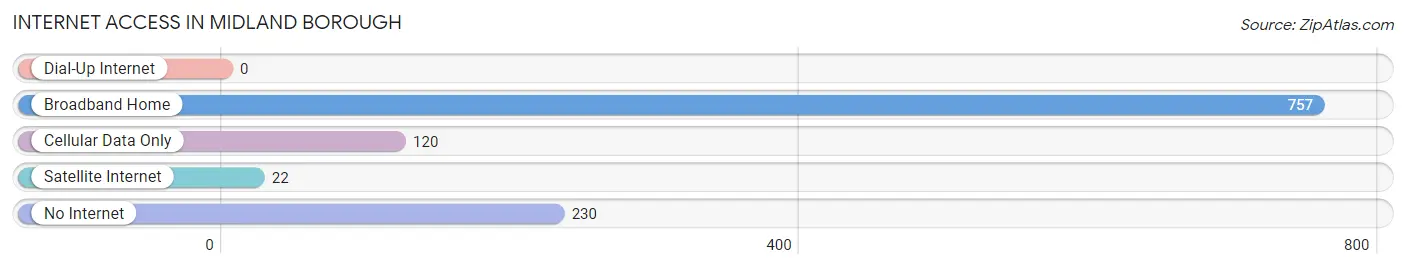
| Internet Type | # Households | % Households |
| Dial-Up Internet | 0 | 0.0% |
| Broadband Home | 757 | 67.8% |
| Cellular Data Only | 120 | 10.7% |
| Satellite Internet | 22 | 2.0% |
| No Internet | 230 | 20.6% |
| Total | 1,116 | 100.0% |
Midland borough Summary
Midland Borough is a small borough located in Beaver County, Pennsylvania. It is situated along the Ohio River, approximately 25 miles northwest of Pittsburgh. The borough has a population of approximately 2,500 people and covers an area of 0.7 square miles.
History
Midland Borough was founded in 1876 by the Midland Improvement Company. The company was formed by a group of investors who wanted to develop the area for industrial and commercial purposes. The borough was named after the Midland Railroad, which ran through the area. The railroad was built in 1871 and connected Pittsburgh to the Ohio River.
The borough quickly grew in population and industry. By the early 1900s, Midland was home to several factories, including a steel mill, a glass factory, and a brickyard. The borough also had a thriving business district, with several stores, banks, and other businesses.
In the 1950s, the steel mill and other factories began to close, and the population of Midland began to decline. The borough was hit hard by the decline of the steel industry in the region. In the 1970s, the borough began to experience a resurgence, as new businesses and industries moved into the area.
Geography
Midland Borough is located in Beaver County, Pennsylvania. It is situated along the Ohio River, approximately 25 miles northwest of Pittsburgh. The borough has a total area of 0.7 square miles, all of which is land.
The borough is located in the Allegheny Plateau region of Pennsylvania. The terrain is mostly flat, with some rolling hills. The climate is humid continental, with cold winters and hot, humid summers.
Economy
Midland Borough’s economy is largely based on manufacturing and services. The borough is home to several factories, including a steel mill, a glass factory, and a brickyard. The borough also has a thriving business district, with several stores, banks, and other businesses.
The borough is also home to several educational institutions, including a community college and a technical school. The borough also has a hospital and several medical centers.
Demographics
As of the 2010 census, Midland Borough had a population of 2,500 people. The racial makeup of the borough was 95.2% White, 1.2% African American, 0.4% Native American, 0.8% Asian, 0.4% from other races, and 2.0% from two or more races. Hispanic or Latino of any race were 1.2% of the population.
The median household income in Midland Borough was $37,500, and the median family income was $45,000. The per capita income was $19,000. About 11.2% of families and 14.4% of the population were below the poverty line, including 18.2% of those under age 18 and 8.4% of those age 65 or over.
Common Questions
What is Per Capita Income in Midland borough?
Per Capita income in Midland borough is $30,538.
What is the Median Family Income in Midland borough?
Median Family Income in Midland borough is $66,563.
What is the Median Household income in Midland borough?
Median Household Income in Midland borough is $61,083.
What is Income or Wage Gap in Midland borough?
Income or Wage Gap in Midland borough is 7.7%.
Women in Midland borough earn 92.3 cents for every dollar earned by a man.
What is Inequality or Gini Index in Midland borough?
Inequality or Gini Index in Midland borough is 0.43.
What is the Total Population of Midland borough?
Total Population of Midland borough is 2,658.
What is the Total Male Population of Midland borough?
Total Male Population of Midland borough is 1,251.
What is the Total Female Population of Midland borough?
Total Female Population of Midland borough is 1,407.
What is the Ratio of Males per 100 Females in Midland borough?
There are 88.91 Males per 100 Females in Midland borough.
What is the Ratio of Females per 100 Males in Midland borough?
There are 112.47 Females per 100 Males in Midland borough.
What is the Median Population Age in Midland borough?
Median Population Age in Midland borough is 46.1 Years.
What is the Average Family Size in Midland borough
Average Family Size in Midland borough is 2.9 People.
What is the Average Household Size in Midland borough
Average Household Size in Midland borough is 2.4 People.
How Large is the Labor Force in Midland borough?
There are 1,344 People in the Labor Forcein in Midland borough.
What is the Percentage of People in the Labor Force in Midland borough?
62.3% of People are in the Labor Force in Midland borough.
What is the Unemployment Rate in Midland borough?
Unemployment Rate in Midland borough is 11.2%.