Cities with the Highest Percentage of Population Employed in Administrative & Support Services in Vermont
RELATED REPORTS & OPTIONS
Administrative & Support Services
Vermont
Compare Cities
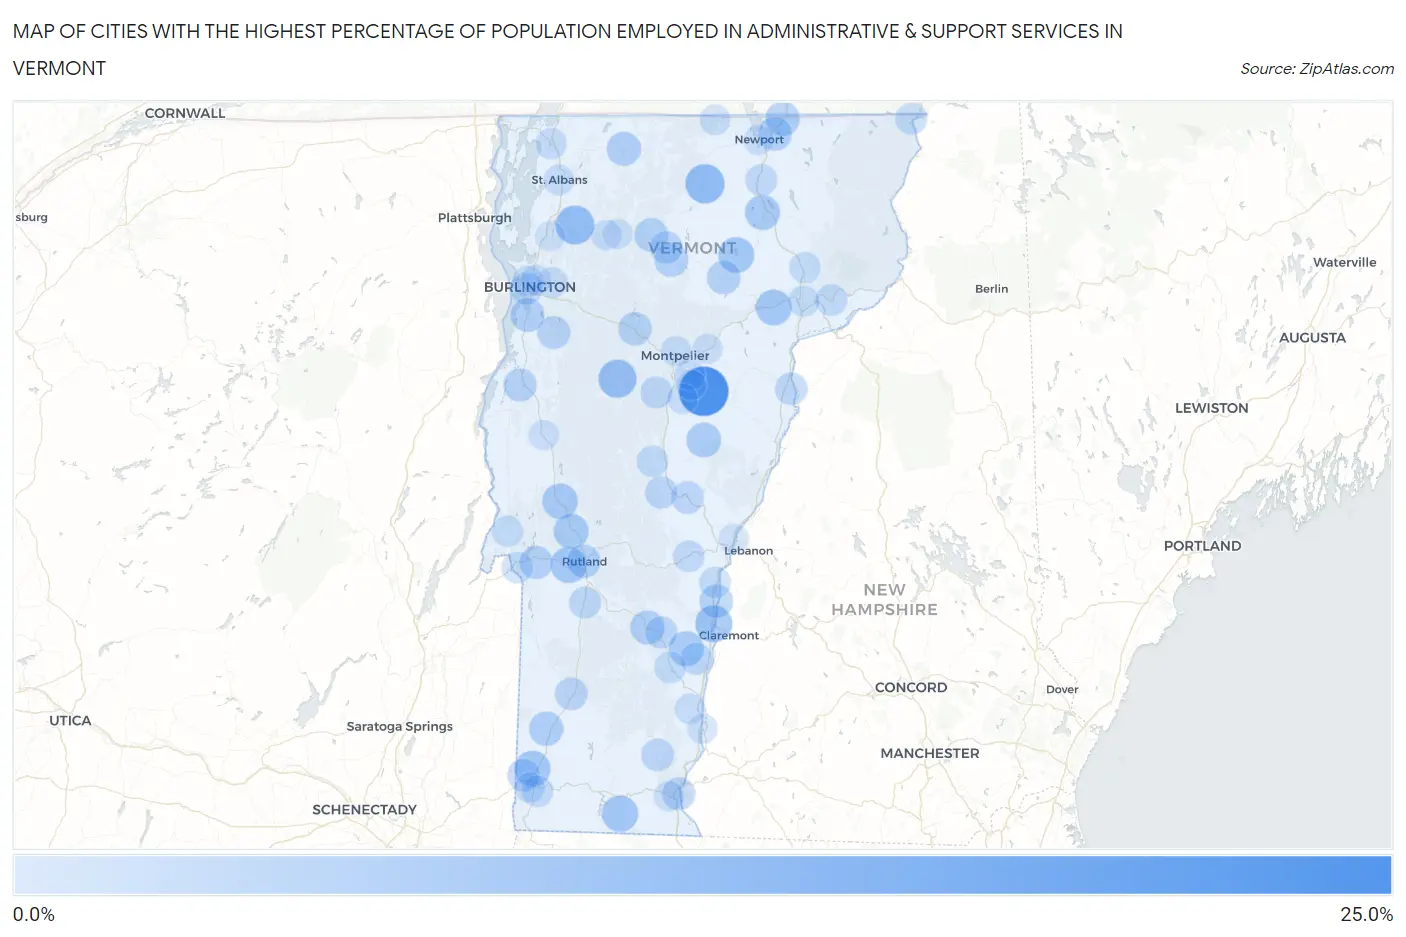
Map of Cities with the Highest Percentage of Population Employed in Administrative & Support Services in Vermont
0.0%
25.0%
Cities with the Highest Percentage of Population Employed in Administrative & Support Services in Vermont
| City | % Employed | vs State | vs National | |
| 1. | East Barre | 22.5% | 3.0%(+19.5)#1 | 4.1%(+18.3)#360 |
| 2. | Pownal Center | 16.6% | 3.0%(+13.6)#2 | 4.1%(+12.4)#642 |
| 3. | Chittenden | 15.5% | 3.0%(+12.5)#3 | 4.1%(+11.3)#742 |
| 4. | Middletown Springs | 14.5% | 3.0%(+11.5)#4 | 4.1%(+10.3)#867 |
| 5. | Danby | 13.1% | 3.0%(+10.1)#5 | 4.1%(+8.98)#1,092 |
| 6. | New Haven | 13.0% | 3.0%(+9.99)#6 | 4.1%(+8.83)#1,124 |
| 7. | Londonderry | 12.9% | 3.0%(+9.92)#7 | 4.1%(+8.75)#1,139 |
| 8. | Lowell | 10.8% | 3.0%(+7.77)#8 | 4.1%(+6.60)#1,625 |
| 9. | Sutton | 10.8% | 3.0%(+7.77)#9 | 4.1%(+6.60)#1,626 |
| 10. | Fairfax | 10.3% | 3.0%(+7.28)#10 | 4.1%(+6.12)#1,790 |
| 11. | Bolton | 10.0% | 3.0%(+7.02)#11 | 4.1%(+5.85)#1,919 |
| 12. | Waitsfield | 9.5% | 3.0%(+6.50)#12 | 4.1%(+5.33)#2,130 |
| 13. | East Dorset | 8.9% | 3.0%(+5.89)#13 | 4.1%(+4.73)#2,454 |
| 14. | Ascutney | 8.3% | 3.0%(+5.35)#14 | 4.1%(+4.18)#2,779 |
| 15. | St. George | 7.7% | 3.0%(+4.67)#15 | 4.1%(+3.51)#3,263 |
| 16. | Waterbury Center | 7.6% | 3.0%(+4.66)#16 | 4.1%(+3.49)#3,272 |
| 17. | Harmonyville | 7.6% | 3.0%(+4.66)#17 | 4.1%(+3.49)#3,273 |
| 18. | West Rutland | 7.5% | 3.0%(+4.55)#18 | 4.1%(+3.39)#3,355 |
| 19. | Jacksonville | 7.5% | 3.0%(+4.54)#19 | 4.1%(+3.38)#3,366 |
| 20. | South Shaftsbury | 7.2% | 3.0%(+4.24)#20 | 4.1%(+3.07)#3,662 |
| 21. | Greensboro | 7.1% | 3.0%(+4.16)#21 | 4.1%(+2.99)#3,760 |
| 22. | Danville | 7.0% | 3.0%(+4.05)#22 | 4.1%(+2.88)#3,880 |
| 23. | Brandon | 6.8% | 3.0%(+3.83)#23 | 4.1%(+2.67)#4,072 |
| 24. | Castleton Four Corners | 6.8% | 3.0%(+3.83)#24 | 4.1%(+2.66)#4,081 |
| 25. | South Hero | 6.6% | 3.0%(+3.61)#25 | 4.1%(+2.44)#4,330 |
| 26. | West Charlotte | 6.2% | 3.0%(+3.22)#26 | 4.1%(+2.05)#4,834 |
| 27. | Pittsford | 6.2% | 3.0%(+3.21)#27 | 4.1%(+2.05)#4,841 |
| 28. | Glover | 6.2% | 3.0%(+3.17)#28 | 4.1%(+2.00)#4,904 |
| 29. | North Springfield | 6.1% | 3.0%(+3.15)#29 | 4.1%(+1.99)#4,927 |
| 30. | Chelsea | 5.9% | 3.0%(+2.90)#30 | 4.1%(+1.73)#5,326 |
| 31. | Bakersfield | 5.6% | 3.0%(+2.62)#31 | 4.1%(+1.45)#5,792 |
| 32. | Derby Line | 5.5% | 3.0%(+2.51)#32 | 4.1%(+1.35)#6,003 |
| 33. | Arlington | 5.5% | 3.0%(+2.50)#33 | 4.1%(+1.33)#6,040 |
| 34. | Enosburg Falls | 5.2% | 3.0%(+2.25)#34 | 4.1%(+1.09)#6,542 |
| 35. | Ludlow | 5.2% | 3.0%(+2.24)#35 | 4.1%(+1.07)#6,580 |
| 36. | Shelburne | 5.0% | 3.0%(+2.04)#36 | 4.1%(+0.872)#6,999 |
| 37. | Derby Center | 5.0% | 3.0%(+1.99)#37 | 4.1%(+0.825)#7,110 |
| 38. | South Londonderry | 4.8% | 3.0%(+1.85)#38 | 4.1%(+0.689)#7,421 |
| 39. | Johnson | 4.8% | 3.0%(+1.84)#39 | 4.1%(+0.680)#7,448 |
| 40. | Morrisville | 4.8% | 3.0%(+1.83)#40 | 4.1%(+0.669)#7,468 |
| 41. | Rutland | 4.8% | 3.0%(+1.79)#41 | 4.1%(+0.622)#7,589 |
| 42. | Hardwick | 4.6% | 3.0%(+1.63)#42 | 4.1%(+0.468)#7,990 |
| 43. | Windsor | 4.5% | 3.0%(+1.56)#43 | 4.1%(+0.396)#8,167 |
| 44. | Castleton | 4.4% | 3.0%(+1.45)#44 | 4.1%(+0.288)#8,487 |
| 45. | Waterbury | 4.4% | 3.0%(+1.43)#45 | 4.1%(+0.264)#8,543 |
| 46. | Vergennes | 4.3% | 3.0%(+1.32)#46 | 4.1%(+0.158)#8,898 |
| 47. | Wolcott | 4.2% | 3.0%(+1.18)#47 | 4.1%(+0.017)#9,337 |
| 48. | Hinesburg | 4.0% | 3.0%(+1.06)#48 | 4.1%(-0.109)#9,706 |
| 49. | Brattleboro | 3.9% | 3.0%(+0.928)#49 | 4.1%(-0.237)#10,141 |
| 50. | Hyde Park | 3.8% | 3.0%(+0.771)#50 | 4.1%(-0.394)#10,676 |
| 51. | Manchester Center | 3.7% | 3.0%(+0.707)#51 | 4.1%(-0.458)#10,900 |
| 52. | North Bennington | 3.6% | 3.0%(+0.617)#52 | 4.1%(-0.548)#11,240 |
| 53. | South Royalton | 3.5% | 3.0%(+0.561)#53 | 4.1%(-0.604)#11,439 |
| 54. | Newfane | 3.5% | 3.0%(+0.524)#54 | 4.1%(-0.641)#11,580 |
| 55. | Proctorsville | 3.4% | 3.0%(+0.413)#55 | 4.1%(-0.752)#11,991 |
| 56. | Wells River | 3.4% | 3.0%(+0.405)#56 | 4.1%(-0.760)#12,027 |
| 57. | Pawlet | 3.4% | 3.0%(+0.377)#57 | 4.1%(-0.788)#12,127 |
| 58. | Bethel | 3.3% | 3.0%(+0.321)#58 | 4.1%(-0.844)#12,341 |
| 59. | North Clarendon | 3.2% | 3.0%(+0.215)#59 | 4.1%(-0.950)#12,715 |
| 60. | Lunenburg | 3.1% | 3.0%(+0.165)#60 | 4.1%(-1.00)#12,900 |
| 61. | South Burlington | 3.1% | 3.0%(+0.092)#61 | 4.1%(-1.07)#13,137 |
| 62. | Northfield | 3.0% | 3.0%(-0.005)#62 | 4.1%(-1.17)#13,527 |
| 63. | Springfield | 2.9% | 3.0%(-0.096)#63 | 4.1%(-1.26)#13,867 |
| 64. | Wallingford | 2.9% | 3.0%(-0.128)#64 | 4.1%(-1.29)#13,989 |
| 65. | Canaan | 2.8% | 3.0%(-0.207)#65 | 4.1%(-1.37)#14,320 |
| 66. | Orleans | 2.7% | 3.0%(-0.259)#66 | 4.1%(-1.42)#14,521 |
| 67. | Concord | 2.7% | 3.0%(-0.282)#67 | 4.1%(-1.45)#14,607 |
| 68. | Randolph | 2.6% | 3.0%(-0.363)#68 | 4.1%(-1.53)#14,937 |
| 69. | Woodstock | 2.6% | 3.0%(-0.405)#69 | 4.1%(-1.57)#15,110 |
| 70. | Chester | 2.5% | 3.0%(-0.513)#70 | 4.1%(-1.68)#15,537 |
| 71. | Huntington | 2.4% | 3.0%(-0.546)#71 | 4.1%(-1.71)#15,642 |
| 72. | Bennington | 2.4% | 3.0%(-0.585)#72 | 4.1%(-1.75)#15,814 |
| 73. | Fair Haven | 2.4% | 3.0%(-0.600)#73 | 4.1%(-1.76)#15,852 |
| 74. | Hartland | 2.3% | 3.0%(-0.712)#74 | 4.1%(-1.88)#16,286 |
| 75. | Benson | 2.3% | 3.0%(-0.712)#75 | 4.1%(-1.88)#16,296 |
| 76. | Bolton Valley | 2.3% | 3.0%(-0.729)#76 | 4.1%(-1.89)#16,359 |
| 77. | Lyndonville | 2.1% | 3.0%(-0.847)#77 | 4.1%(-2.01)#16,797 |
| 78. | St Johnsbury | 2.1% | 3.0%(-0.848)#78 | 4.1%(-2.01)#16,801 |
| 79. | Stamford | 2.1% | 3.0%(-0.866)#79 | 4.1%(-2.03)#16,873 |
| 80. | Swanton | 2.1% | 3.0%(-0.886)#80 | 4.1%(-2.05)#16,956 |
| 81. | Burlington | 1.8% | 3.0%(-1.15)#81 | 4.1%(-2.32)#17,965 |
| 82. | Barre | 1.7% | 3.0%(-1.25)#82 | 4.1%(-2.41)#18,297 |
| 83. | Essex Junction | 1.7% | 3.0%(-1.30)#83 | 4.1%(-2.47)#18,497 |
| 84. | Montpelier | 1.6% | 3.0%(-1.36)#84 | 4.1%(-2.53)#18,716 |
| 85. | St Albans | 1.5% | 3.0%(-1.47)#85 | 4.1%(-2.64)#19,111 |
| 86. | Saxtons River | 1.5% | 3.0%(-1.48)#86 | 4.1%(-2.64)#19,126 |
| 87. | North Troy | 1.5% | 3.0%(-1.49)#87 | 4.1%(-2.66)#19,182 |
| 88. | Cambridge | 1.5% | 3.0%(-1.50)#88 | 4.1%(-2.67)#19,229 |
| 89. | Winooski | 1.4% | 3.0%(-1.62)#89 | 4.1%(-2.78)#19,597 |
| 90. | Middlebury | 1.2% | 3.0%(-1.75)#90 | 4.1%(-2.91)#20,022 |
| 91. | Williamstown | 1.2% | 3.0%(-1.77)#91 | 4.1%(-2.94)#20,114 |
| 92. | Old Bennington | 1.2% | 3.0%(-1.78)#92 | 4.1%(-2.94)#20,135 |
| 93. | Plainfield | 1.2% | 3.0%(-1.79)#93 | 4.1%(-2.96)#20,174 |
| 94. | Newport | 1.1% | 3.0%(-1.84)#94 | 4.1%(-3.01)#20,304 |
| 95. | Westminster | 1.1% | 3.0%(-1.87)#95 | 4.1%(-3.03)#20,393 |
| 96. | West Brattleboro | 1.1% | 3.0%(-1.88)#96 | 4.1%(-3.04)#20,411 |
| 97. | South Barre | 1.1% | 3.0%(-1.89)#97 | 4.1%(-3.05)#20,432 |
| 98. | Jeffersonville | 0.93% | 3.0%(-2.05)#98 | 4.1%(-3.22)#20,954 |
| 99. | Wilder | 0.90% | 3.0%(-2.09)#99 | 4.1%(-3.25)#21,048 |
| 100. | Milton | 0.88% | 3.0%(-2.11)#100 | 4.1%(-3.27)#21,111 |
1
2Common Questions
What are the Top 10 Cities with the Highest Percentage of Population Employed in Administrative & Support Services in Vermont?
Top 10 Cities with the Highest Percentage of Population Employed in Administrative & Support Services in Vermont are:
#1
22.5%
#2
10.8%
#3
10.3%
#4
9.5%
#5
8.3%
#6
7.5%
#7
7.5%
#8
7.2%
#9
7.1%
#10
7.0%
What city has the Highest Percentage of Population Employed in Administrative & Support Services in Vermont?
East Barre has the Highest Percentage of Population Employed in Administrative & Support Services in Vermont with 22.5%.
What is the Percentage of Population Employed in Administrative & Support Services in the State of Vermont?
Percentage of Population Employed in Administrative & Support Services in Vermont is 3.0%.
What is the Percentage of Population Employed in Administrative & Support Services in the United States?
Percentage of Population Employed in Administrative & Support Services in the United States is 4.1%.