Lumber City, PA Map & Demographics
Lumber City Map
Lumber City Overview
$38,259
PER CAPITA INCOME
0.50
INEQUALITY / GINI INDEX
252
TOTAL POPULATION
164
MALE POPULATION
88
FEMALE POPULATION
186.36
MALES / 100 FEMALES
53.66
FEMALES / 100 MALES
56.9
MEDIAN AGE
2.3
AVG FAMILY SIZE
2.0
AVG HOUSEHOLD SIZE
109
LABOR FORCE [ PEOPLE ]
43.3%
PERCENT IN LABOR FORCE
29.4%
UNEMPLOYMENT RATE
Income in Lumber City
Income Overview in Lumber City
| Characteristic | Number | Measure |
| Per Capita Income | 252 | $38,259 |
| Median Family Income | 83 | $0 |
| Mean Family Income | 83 | $53,561 |
| Median Household Income | 124 | $0 |
| Mean Household Income | 124 | $70,962 |
| Income Deficit | 83 | $0 |
| Wage / Income Gap (%) | 252 | 0.00% |
| Wage / Income Gap ($) | 252 | 100.00¢ per $1 |
| Gini / Inequality Index | 252 | 0.50 |
Earnings by Sex in Lumber City
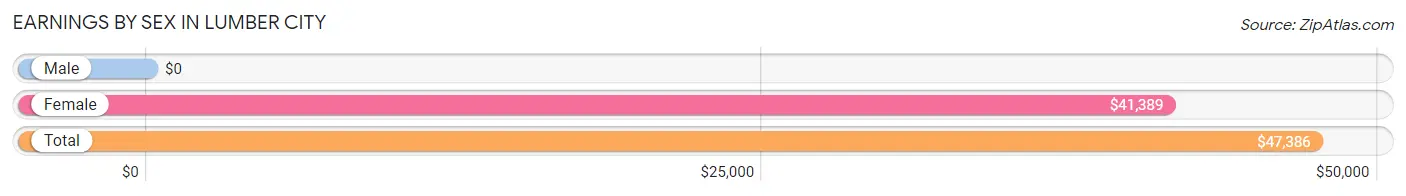
| Sex | Number | Average Earnings |
| Male | 29 (37.7%) | $0 |
| Female | 48 (62.3%) | $41,389 |
| Total | 77 (100.0%) | $47,386 |
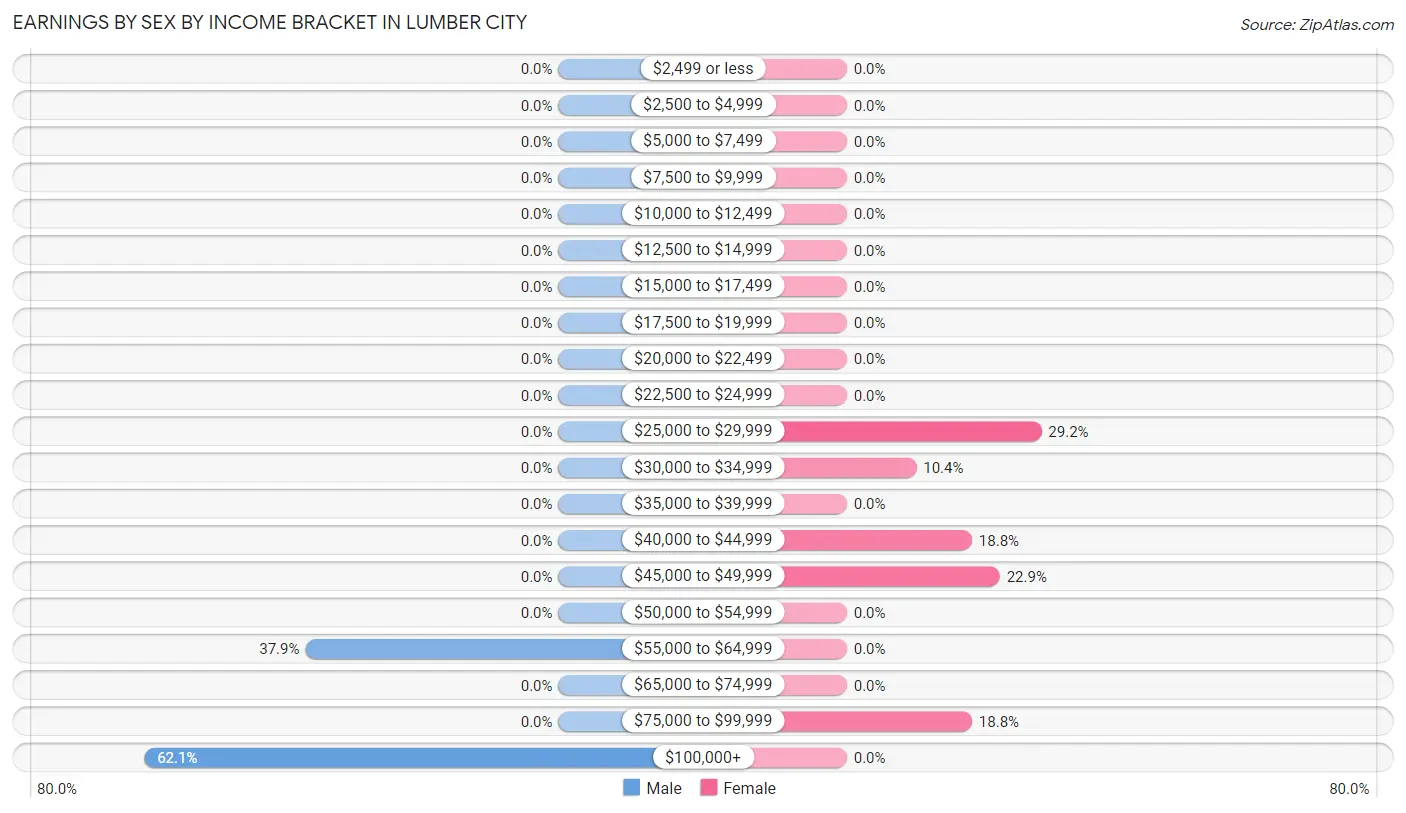
Earnings by Sex by Income Bracket in Lumber City
The most common earnings brackets in Lumber City are $100,000+ for men (18 | 62.1%) and $25,000 to $29,999 for women (14 | 29.2%).
| Income | Male | Female |
| $2,499 or less | 0 (0.0%) | 0 (0.0%) |
| $2,500 to $4,999 | 0 (0.0%) | 0 (0.0%) |
| $5,000 to $7,499 | 0 (0.0%) | 0 (0.0%) |
| $7,500 to $9,999 | 0 (0.0%) | 0 (0.0%) |
| $10,000 to $12,499 | 0 (0.0%) | 0 (0.0%) |
| $12,500 to $14,999 | 0 (0.0%) | 0 (0.0%) |
| $15,000 to $17,499 | 0 (0.0%) | 0 (0.0%) |
| $17,500 to $19,999 | 0 (0.0%) | 0 (0.0%) |
| $20,000 to $22,499 | 0 (0.0%) | 0 (0.0%) |
| $22,500 to $24,999 | 0 (0.0%) | 0 (0.0%) |
| $25,000 to $29,999 | 0 (0.0%) | 14 (29.2%) |
| $30,000 to $34,999 | 0 (0.0%) | 5 (10.4%) |
| $35,000 to $39,999 | 0 (0.0%) | 0 (0.0%) |
| $40,000 to $44,999 | 0 (0.0%) | 9 (18.8%) |
| $45,000 to $49,999 | 0 (0.0%) | 11 (22.9%) |
| $50,000 to $54,999 | 0 (0.0%) | 0 (0.0%) |
| $55,000 to $64,999 | 11 (37.9%) | 0 (0.0%) |
| $65,000 to $74,999 | 0 (0.0%) | 0 (0.0%) |
| $75,000 to $99,999 | 0 (0.0%) | 9 (18.8%) |
| $100,000+ | 18 (62.1%) | 0 (0.0%) |
| Total | 29 (100.0%) | 48 (100.0%) |
Earnings by Sex by Educational Attainment in Lumber City
| Educational Attainment | Male Income | Female Income |
| Less than High School | - | - |
| High School Diploma | - | - |
| College or Associate's Degree | - | - |
| Bachelor's Degree | - | - |
| Graduate Degree | - | - |
| Total | - | - |
Family Income in Lumber City
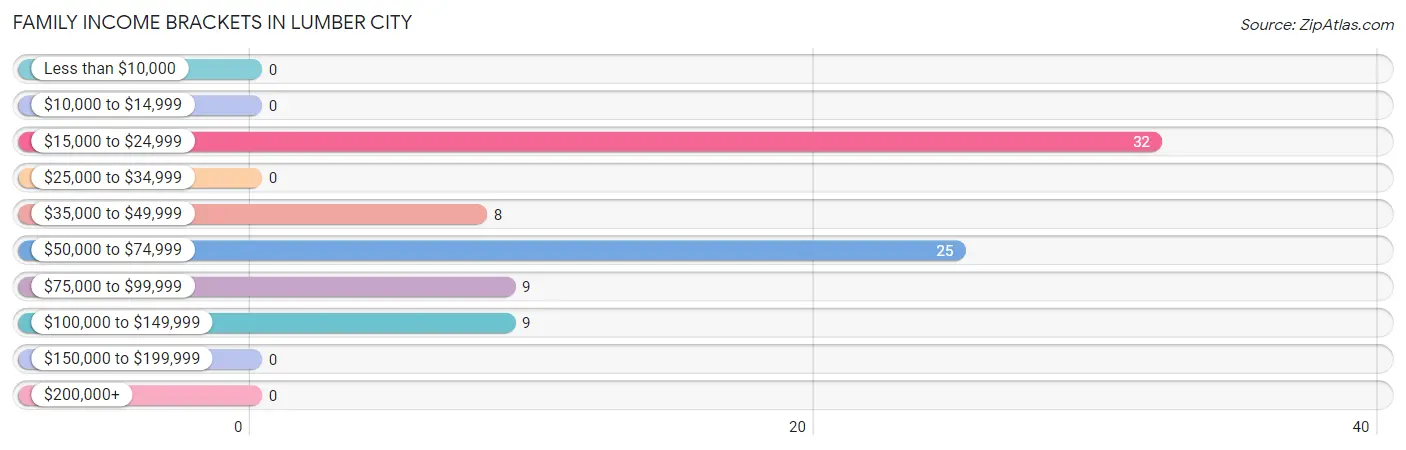
Family Income Brackets in Lumber City
According to the Lumber City family income data, there are 32 families falling into the $15,000 to $24,999 income range, which is the most common income bracket and makes up 38.6% of all families.
| Income Bracket | # Families | % Families |
| Less than $10,000 | 0 | 0.0% |
| $10,000 to $14,999 | 0 | 0.0% |
| $15,000 to $24,999 | 32 | 38.6% |
| $25,000 to $34,999 | 0 | 0.0% |
| $35,000 to $49,999 | 8 | 9.6% |
| $50,000 to $74,999 | 25 | 30.1% |
| $75,000 to $99,999 | 9 | 10.8% |
| $100,000 to $149,999 | 9 | 10.8% |
| $150,000 to $199,999 | 0 | 0.0% |
| $200,000+ | 0 | 0.0% |
Family Income by Famaliy Size in Lumber City
| Income Bracket | # Families | Median Income |
| 2-Person Families | 69 (83.1%) | $0 |
| 3-Person Families | 5 (6.0%) | $0 |
| 4-Person Families | 9 (10.8%) | $0 |
| 5-Person Families | 0 (0.0%) | $0 |
| 6-Person Families | 0 (0.0%) | $0 |
| 7+ Person Families | 0 (0.0%) | $0 |
| Total | 83 (100.0%) | $0 |
Family Income by Number of Earners in Lumber City
| Number of Earners | # Families | Median Income |
| No Earners | 58 (69.9%) | $0 |
| 1 Earner | 16 (19.3%) | $0 |
| 2 Earners | 9 (10.8%) | $0 |
| 3+ Earners | 0 (0.0%) | $0 |
| Total | 83 (100.0%) | $0 |
Household Income in Lumber City
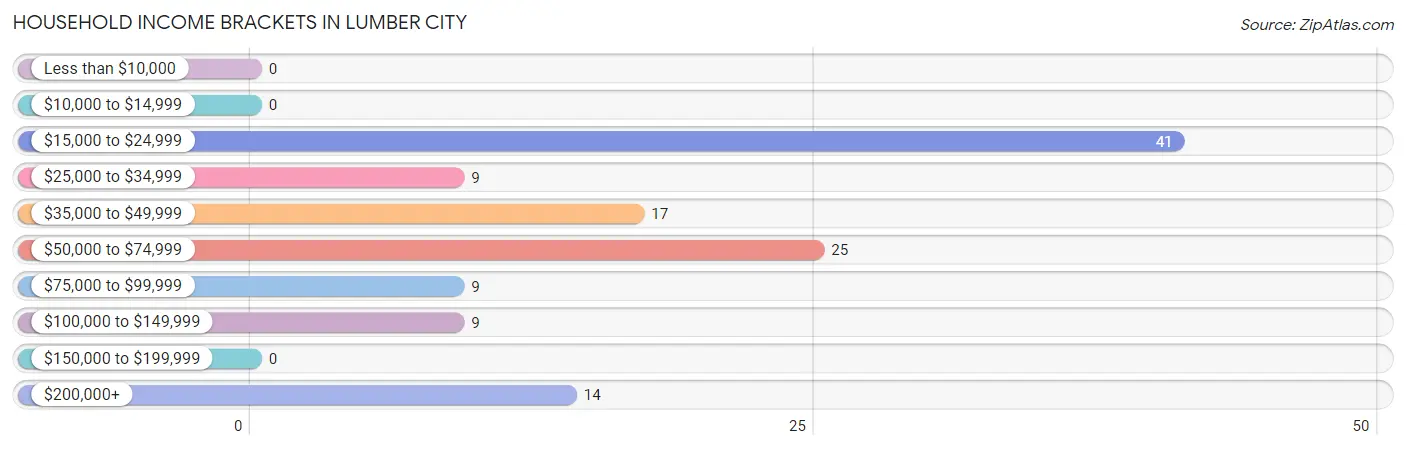
Household Income Brackets in Lumber City
With 41 households falling in the category, the $15,000 to $24,999 income range is the most frequent in Lumber City, accounting for 33.1% of all households.
| Income Bracket | # Households | % Households |
| Less than $10,000 | 0 | 0.0% |
| $10,000 to $14,999 | 0 | 0.0% |
| $15,000 to $24,999 | 41 | 33.1% |
| $25,000 to $34,999 | 9 | 7.3% |
| $35,000 to $49,999 | 17 | 13.7% |
| $50,000 to $74,999 | 25 | 20.2% |
| $75,000 to $99,999 | 9 | 7.3% |
| $100,000 to $149,999 | 9 | 7.3% |
| $150,000 to $199,999 | 0 | 0.0% |
| $200,000+ | 14 | 11.3% |
Household Income by Householder Age in Lumber City
| Income Bracket | # Households | Median Income |
| 15 to 24 Years | 32 (25.8%) | $0 |
| 25 to 44 Years | 0 (0.0%) | $0 |
| 45 to 64 Years | 43 (34.7%) | $0 |
| 65+ Years | 49 (39.5%) | $0 |
| Total | 124 (100.0%) | $0 |
Poverty in Lumber City
Income Below Poverty by Sex and Age in Lumber City
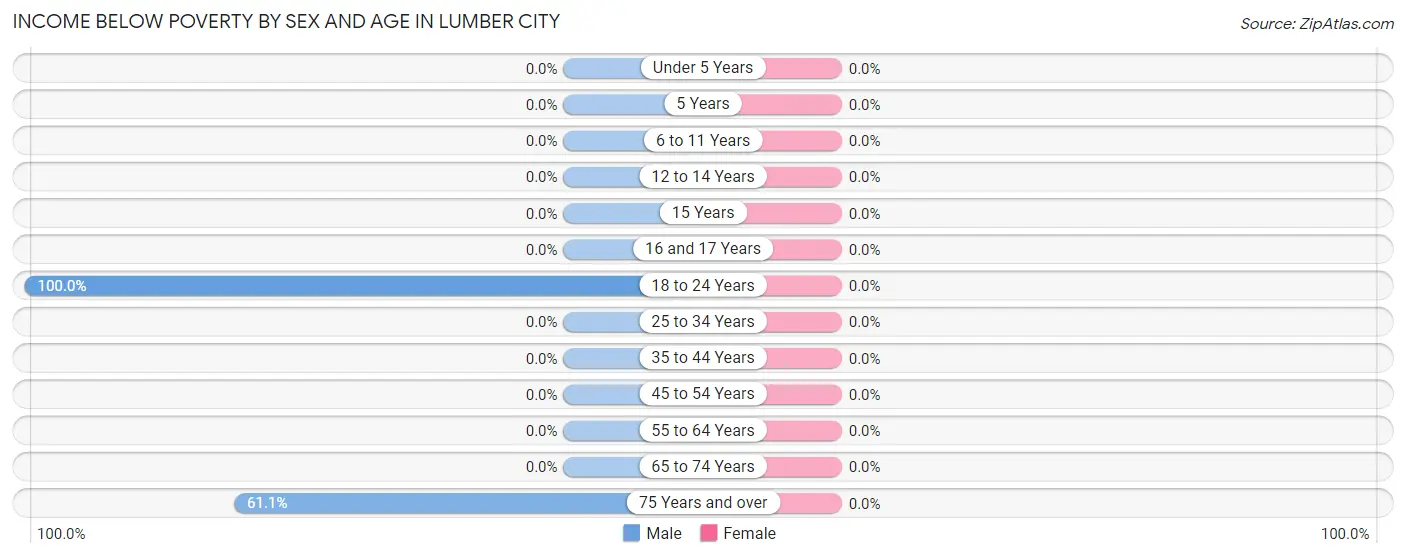
| Age Bracket | Male | Female |
| Under 5 Years | 0 (0.0%) | 0 (0.0%) |
| 5 Years | 0 (0.0%) | 0 (0.0%) |
| 6 to 11 Years | 0 (0.0%) | 0 (0.0%) |
| 12 to 14 Years | 0 (0.0%) | 0 (0.0%) |
| 15 Years | 0 (0.0%) | 0 (0.0%) |
| 16 and 17 Years | 0 (0.0%) | 0 (0.0%) |
| 18 to 24 Years | 32 (100.0%) | 0 (0.0%) |
| 25 to 34 Years | 0 (0.0%) | 0 (0.0%) |
| 35 to 44 Years | 0 (0.0%) | 0 (0.0%) |
| 45 to 54 Years | 0 (0.0%) | 0 (0.0%) |
| 55 to 64 Years | 0 (0.0%) | 0 (0.0%) |
| 65 to 74 Years | 0 (0.0%) | 0 (0.0%) |
| 75 Years and over | 22 (61.1%) | 0 (0.0%) |
| Total | 54 (32.9%) | 0 (0.0%) |
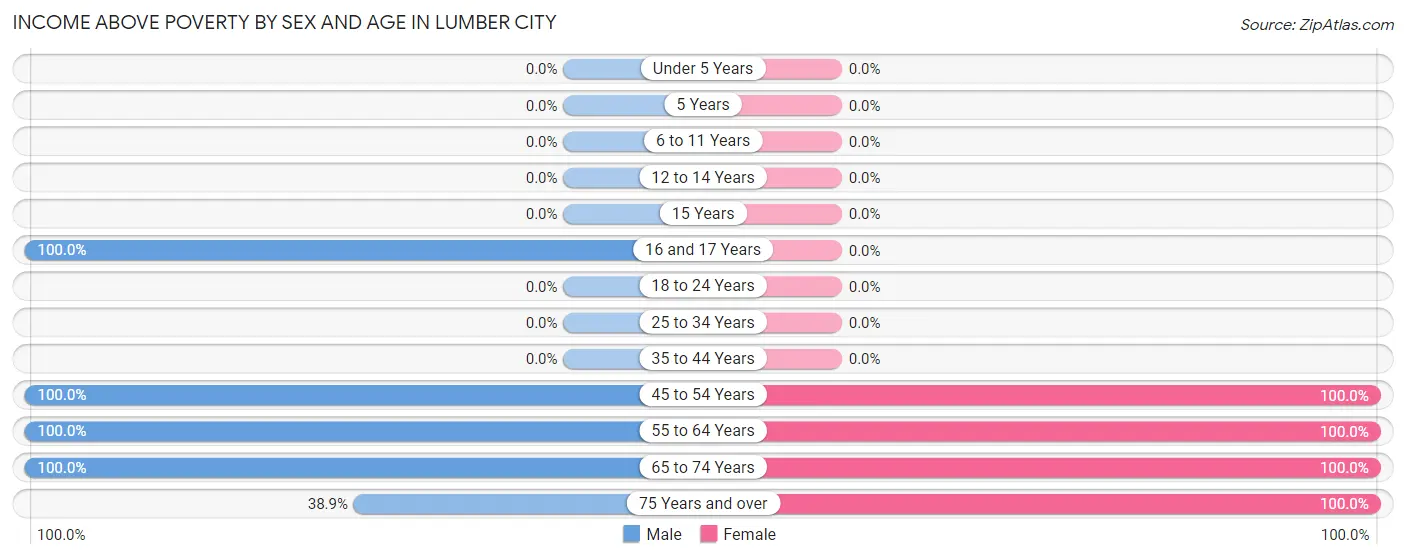
Income Above Poverty by Sex and Age in Lumber City
According to the poverty statistics in Lumber City, males aged 16 and 17 years and females aged 45 to 54 years are the age groups that are most secure financially, with 100.0% of males and 100.0% of females in these age groups living above the poverty line.
| Age Bracket | Male | Female |
| Under 5 Years | 0 (0.0%) | 0 (0.0%) |
| 5 Years | 0 (0.0%) | 0 (0.0%) |
| 6 to 11 Years | 0 (0.0%) | 0 (0.0%) |
| 12 to 14 Years | 0 (0.0%) | 0 (0.0%) |
| 15 Years | 0 (0.0%) | 0 (0.0%) |
| 16 and 17 Years | 28 (100.0%) | 0 (0.0%) |
| 18 to 24 Years | 0 (0.0%) | 0 (0.0%) |
| 25 to 34 Years | 0 (0.0%) | 0 (0.0%) |
| 35 to 44 Years | 0 (0.0%) | 0 (0.0%) |
| 45 to 54 Years | 29 (100.0%) | 25 (100.0%) |
| 55 to 64 Years | 14 (100.0%) | 23 (100.0%) |
| 65 to 74 Years | 25 (100.0%) | 25 (100.0%) |
| 75 Years and over | 14 (38.9%) | 15 (100.0%) |
| Total | 110 (67.1%) | 88 (100.0%) |
Income Below Poverty Among Married-Couple Families in Lumber City
| Children | Above Poverty | Below Poverty |
| No Children | 31 (100.0%) | 0 (0.0%) |
| 1 or 2 Children | 9 (100.0%) | 0 (0.0%) |
| 3 or 4 Children | 0 (0.0%) | 0 (0.0%) |
| 5 or more Children | 0 (0.0%) | 0 (0.0%) |
| Total | 40 (100.0%) | 0 (0.0%) |
Income Below Poverty Among Single-Parent Households in Lumber City
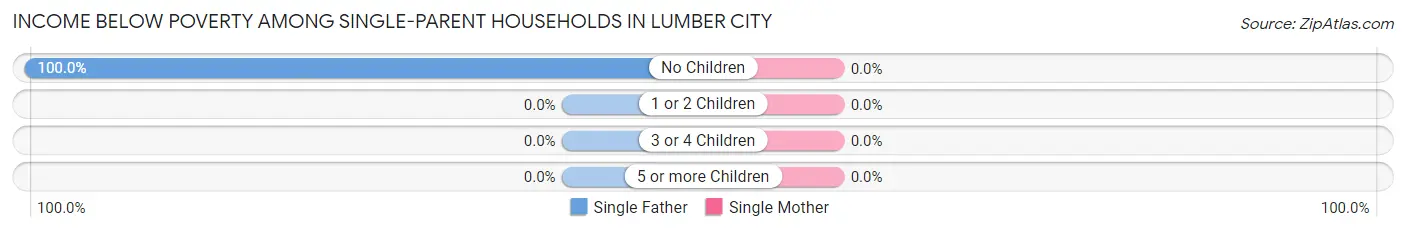
| Children | Single Father | Single Mother |
| No Children | 32 (100.0%) | 0 (0.0%) |
| 1 or 2 Children | 0 (0.0%) | 0 (0.0%) |
| 3 or 4 Children | 0 (0.0%) | 0 (0.0%) |
| 5 or more Children | 0 (0.0%) | 0 (0.0%) |
| Total | 32 (100.0%) | 0 (0.0%) |
Income Below Poverty Among Married-Couple vs Single-Parent Households in Lumber City
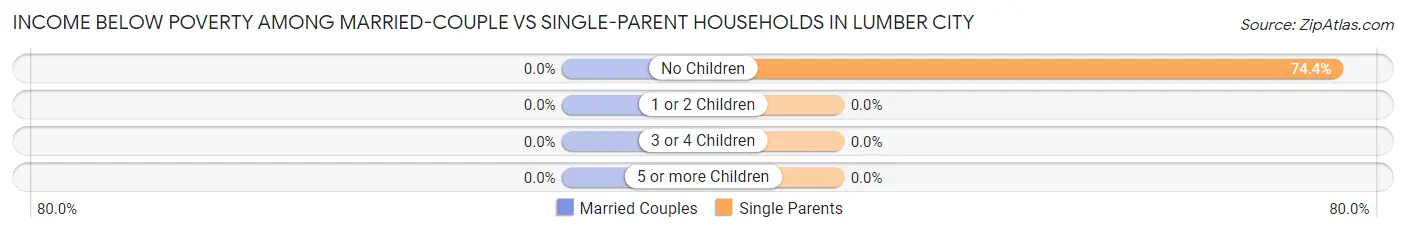
| Children | Married-Couple Families | Single-Parent Households |
| No Children | 0 (0.0%) | 32 (74.4%) |
| 1 or 2 Children | 0 (0.0%) | 0 (0.0%) |
| 3 or 4 Children | 0 (0.0%) | 0 (0.0%) |
| 5 or more Children | 0 (0.0%) | 0 (0.0%) |
| Total | 0 (0.0%) | 32 (74.4%) |
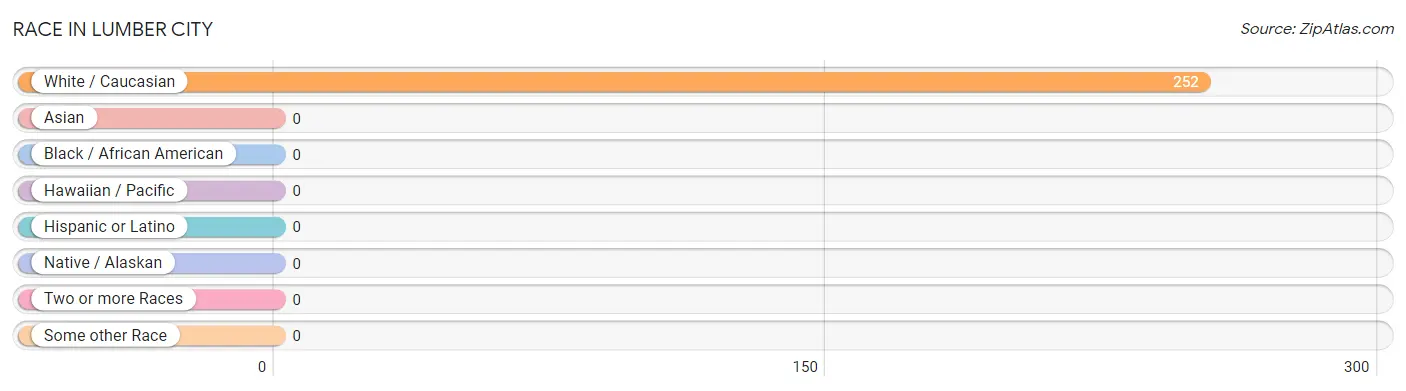
Race in Lumber City
The most populous races in Lumber City are , and White / Caucasian (252 | 100.0%).
| Race | # Population | % Population |
| Asian | 0 | 0.0% |
| Black / African American | 0 | 0.0% |
| Hawaiian / Pacific | 0 | 0.0% |
| Hispanic or Latino | 0 | 0.0% |
| Native / Alaskan | 0 | 0.0% |
| White / Caucasian | 252 | 100.0% |
| Two or more Races | 0 | 0.0% |
| Some other Race | 0 | 0.0% |
| Total | 252 | 100.0% |
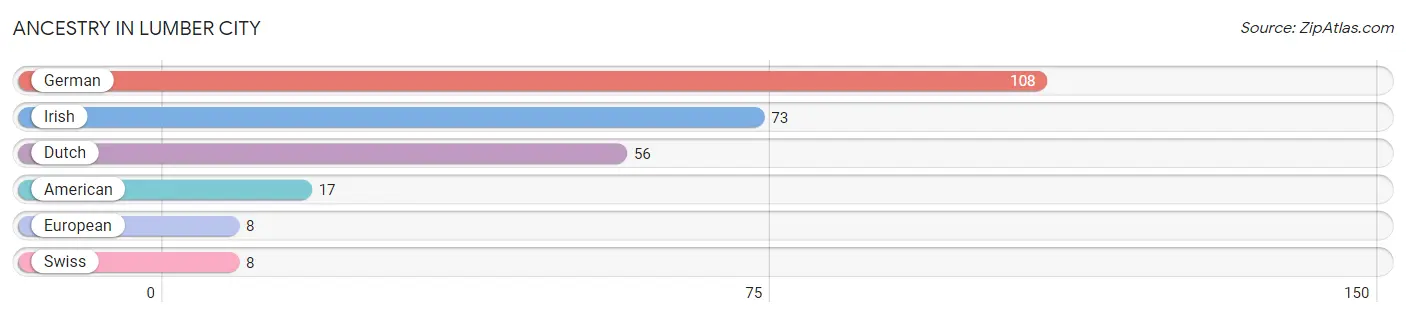
Ancestry in Lumber City
The most populous ancestries reported in Lumber City are German (108 | 42.9%), Irish (73 | 29.0%), Dutch (56 | 22.2%), American (17 | 6.8%), and European (8 | 3.2%), together accounting for 104.0% of all Lumber City residents.
| Ancestry | # Population | % Population |
| American | 17 | 6.8% |
| Dutch | 56 | 22.2% |
| European | 8 | 3.2% |
| German | 108 | 42.9% |
| Irish | 73 | 29.0% |
| Swiss | 8 | 3.2% | View All 6 Rows |
Immigrants in Lumber City

| Immigration Origin | # Population | % Population | View All 0 Rows |
Sex and Age in Lumber City
Sex and Age in Lumber City
The most populous age groups in Lumber City are 20 to 24 Years (32 | 19.5%) for men and 50 to 54 Years (25 | 28.4%) for women.
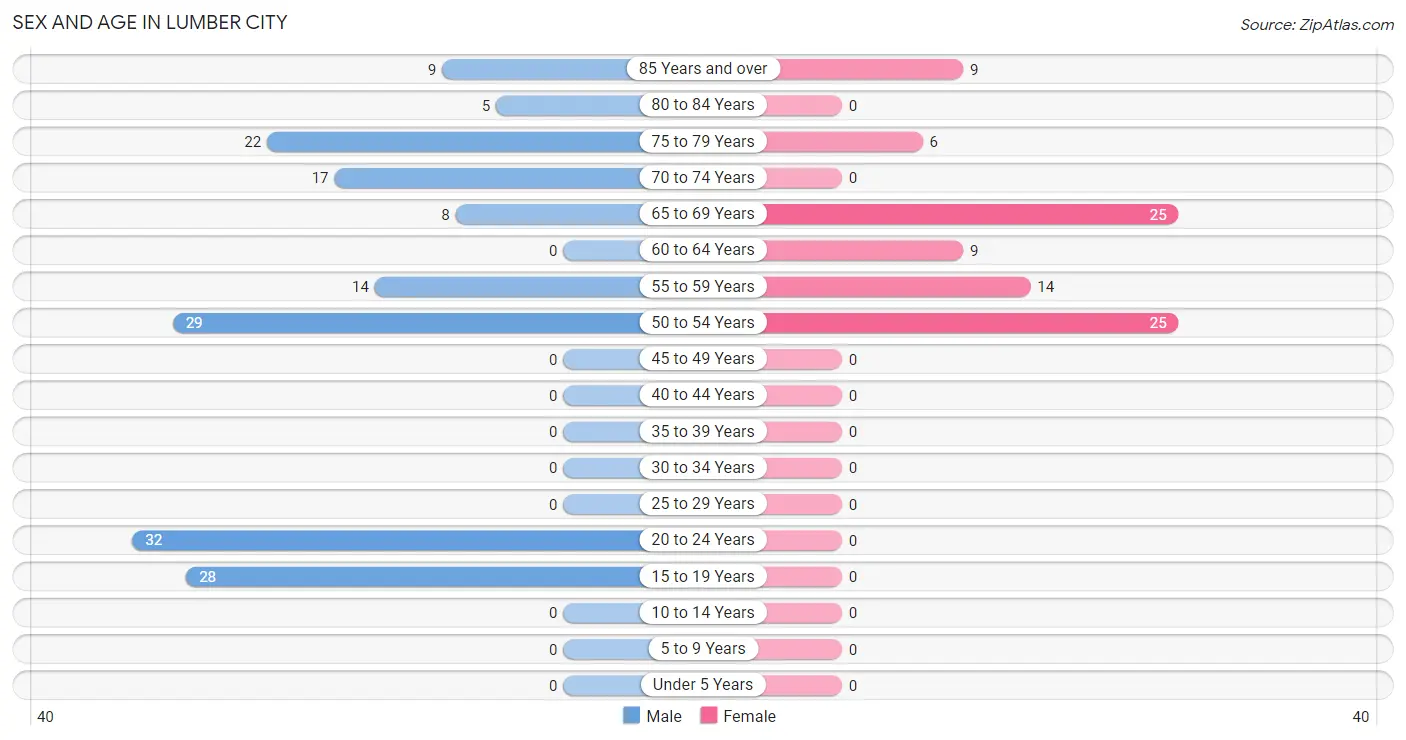
| Age Bracket | Male | Female |
| Under 5 Years | 0 (0.0%) | 0 (0.0%) |
| 5 to 9 Years | 0 (0.0%) | 0 (0.0%) |
| 10 to 14 Years | 0 (0.0%) | 0 (0.0%) |
| 15 to 19 Years | 28 (17.1%) | 0 (0.0%) |
| 20 to 24 Years | 32 (19.5%) | 0 (0.0%) |
| 25 to 29 Years | 0 (0.0%) | 0 (0.0%) |
| 30 to 34 Years | 0 (0.0%) | 0 (0.0%) |
| 35 to 39 Years | 0 (0.0%) | 0 (0.0%) |
| 40 to 44 Years | 0 (0.0%) | 0 (0.0%) |
| 45 to 49 Years | 0 (0.0%) | 0 (0.0%) |
| 50 to 54 Years | 29 (17.7%) | 25 (28.4%) |
| 55 to 59 Years | 14 (8.5%) | 14 (15.9%) |
| 60 to 64 Years | 0 (0.0%) | 9 (10.2%) |
| 65 to 69 Years | 8 (4.9%) | 25 (28.4%) |
| 70 to 74 Years | 17 (10.4%) | 0 (0.0%) |
| 75 to 79 Years | 22 (13.4%) | 6 (6.8%) |
| 80 to 84 Years | 5 (3.0%) | 0 (0.0%) |
| 85 Years and over | 9 (5.5%) | 9 (10.2%) |
| Total | 164 (100.0%) | 88 (100.0%) |
Families and Households in Lumber City
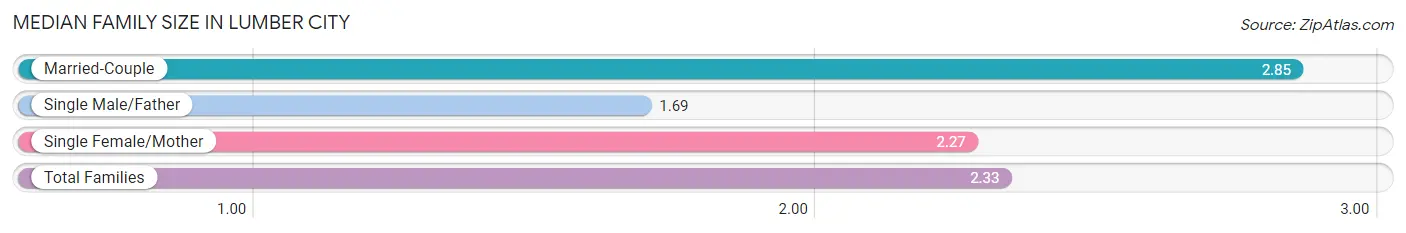
Median Family Size in Lumber City
The median family size in Lumber City is 2.33 persons per family, with married-couple families (40 | 48.2%) accounting for the largest median family size of 2.85 persons per family. On the other hand, single male/father families (32 | 38.6%) represent the smallest median family size with 1.69 persons per family.
| Family Type | # Families | Family Size |
| Married-Couple | 40 (48.2%) | 2.85 |
| Single Male/Father | 32 (38.6%) | 1.69 |
| Single Female/Mother | 11 (13.3%) | 2.27 |
| Total Families | 83 (100.0%) | 2.33 |
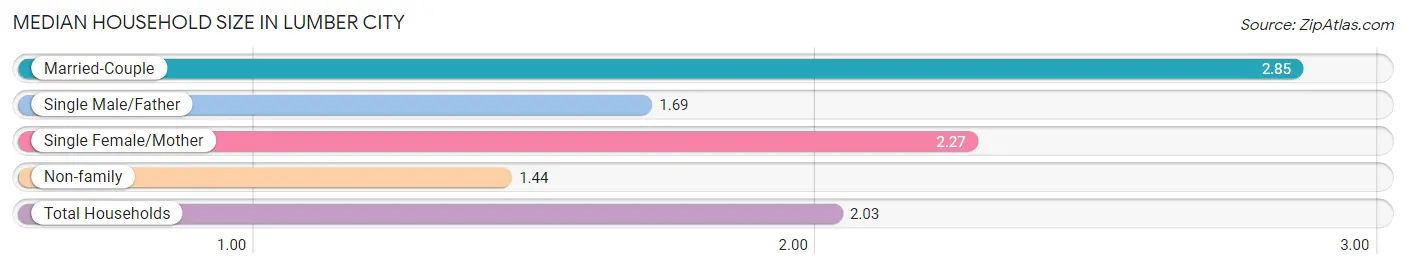
Median Household Size in Lumber City
The median household size in Lumber City is 2.03 persons per household, with married-couple households (40 | 32.3%) accounting for the largest median household size of 2.85 persons per household. non-family households (41 | 33.1%) represent the smallest median household size with 1.44 persons per household.
| Household Type | # Households | Household Size |
| Married-Couple | 40 (32.3%) | 2.85 |
| Single Male/Father | 32 (25.8%) | 1.69 |
| Single Female/Mother | 11 (8.9%) | 2.27 |
| Non-family | 41 (33.1%) | 1.44 |
| Total Households | 124 (100.0%) | 2.03 |
Household Size by Marriage Status in Lumber City
Out of a total of 124 households in Lumber City, 83 (66.9%) are family households, while 41 (33.1%) are nonfamily households. The most numerous type of family households are 2-person households, comprising 69, and the most common type of nonfamily households are 1-person households, comprising 27.
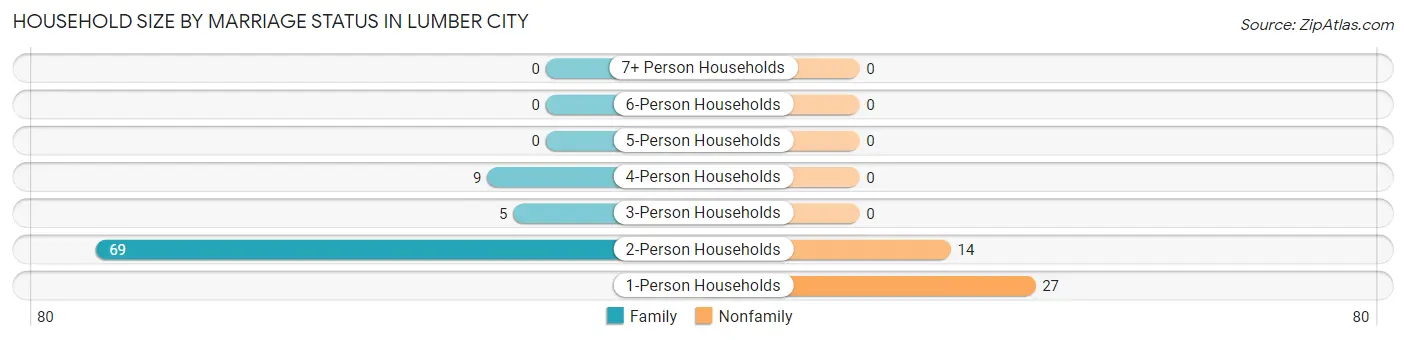
| Household Size | Family Households | Nonfamily Households |
| 1-Person Households | - | 27 (21.8%) |
| 2-Person Households | 69 (55.6%) | 14 (11.3%) |
| 3-Person Households | 5 (4.0%) | 0 (0.0%) |
| 4-Person Households | 9 (7.3%) | 0 (0.0%) |
| 5-Person Households | 0 (0.0%) | 0 (0.0%) |
| 6-Person Households | 0 (0.0%) | 0 (0.0%) |
| 7+ Person Households | 0 (0.0%) | 0 (0.0%) |
| Total | 83 (66.9%) | 41 (33.1%) |
Female Fertility in Lumber City
Fertility by Age in Lumber City
| Age Bracket | Women with Births | Births / 1,000 Women |
| 15 to 19 years | 0 (0.0%) | 0.0 |
| 20 to 34 years | 0 (0.0%) | 0.0 |
| 35 to 50 years | 0 (0.0%) | 0.0 |
| Total | 0 (0.0%) | 0.0 |
Fertility by Age by Marriage Status in Lumber City
| Age Bracket | Married | Unmarried |
| 15 to 19 years | 0 (0.0%) | 0 (0.0%) |
| 20 to 34 years | 0 (0.0%) | 0 (0.0%) |
| 35 to 50 years | 0 (0.0%) | 0 (0.0%) |
| Total | 0 (0.0%) | 0 (0.0%) |
Fertility by Education in Lumber City
| Educational Attainment | Women with Births | Births / 1,000 Women |
| Less than High School | 0 (0.0%) | 0.0 |
| High School Diploma | 0 (0.0%) | 0.0 |
| College or Associate's Degree | 0 (0.0%) | 0.0 |
| Bachelor's Degree | 0 (0.0%) | 0.0 |
| Graduate Degree | 0 (0.0%) | 0.0 |
| Total | 0 (0.0%) | 0.0 |
Fertility by Education by Marriage Status in Lumber City
| Educational Attainment | Married | Unmarried |
| Less than High School | 0 (0.0%) | 0 (0.0%) |
| High School Diploma | 0 (0.0%) | 0 (0.0%) |
| College or Associate's Degree | 0 (0.0%) | 0 (0.0%) |
| Bachelor's Degree | 0 (0.0%) | 0 (0.0%) |
| Graduate Degree | 0 (0.0%) | 0 (0.0%) |
| Total | 0 (0.0%) | 0 (0.0%) |
Employment Characteristics in Lumber City
Employment by Class of Employer in Lumber City
Among the 77 employed individuals in Lumber City, private company employees (34 | 44.2%), self-employed (not incorporated) (18 | 23.4%), and not-for-profit organizations (14 | 18.2%) make up the most common classes of employment.
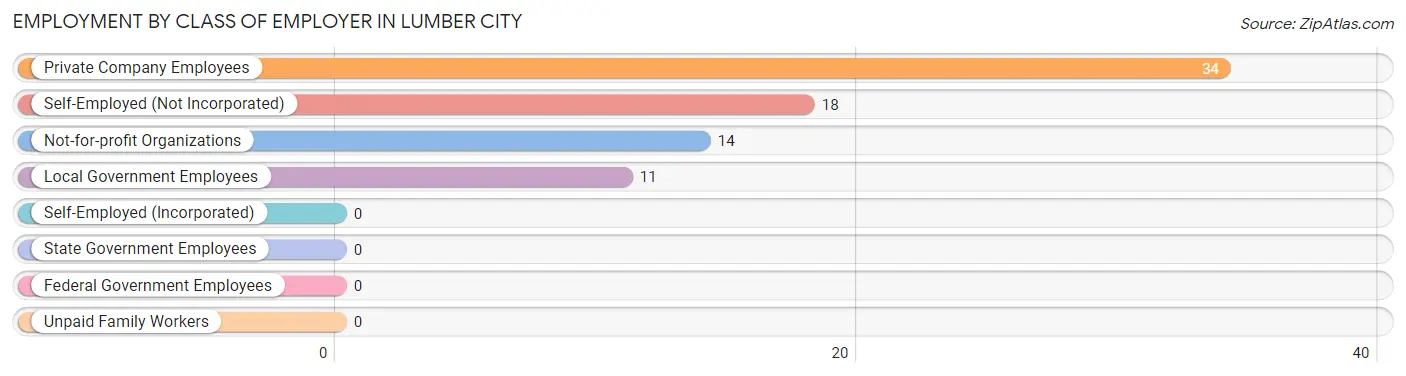
| Employer Class | # Employees | % Employees |
| Private Company Employees | 34 | 44.2% |
| Self-Employed (Incorporated) | 0 | 0.0% |
| Self-Employed (Not Incorporated) | 18 | 23.4% |
| Not-for-profit Organizations | 14 | 18.2% |
| Local Government Employees | 11 | 14.3% |
| State Government Employees | 0 | 0.0% |
| Federal Government Employees | 0 | 0.0% |
| Unpaid Family Workers | 0 | 0.0% |
| Total | 77 | 100.0% |
Employment Status by Age in Lumber City
According to the labor force statistics for Lumber City, out of the total population over 16 years of age (252), 43.3% or 109 individuals are in the labor force, with 29.4% or 32 of them unemployed. The age group with the highest labor force participation rate is 20 to 24 years, with 100.0% or 32 individuals in the labor force. Within the labor force, the 20 to 24 years age range has the highest percentage of unemployed individuals, with 100.0% or 32 of them being unemployed.
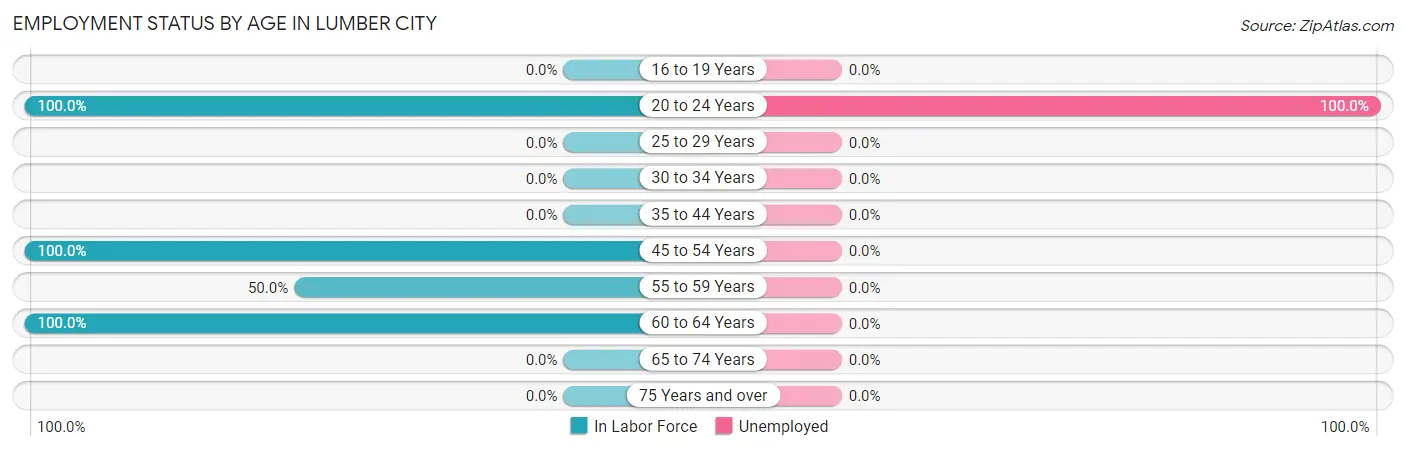
| Age Bracket | In Labor Force | Unemployed |
| 16 to 19 Years | 0 (0.0%) | 0 (0.0%) |
| 20 to 24 Years | 32 (100.0%) | 32 (100.0%) |
| 25 to 29 Years | 0 (0.0%) | 0 (0.0%) |
| 30 to 34 Years | 0 (0.0%) | 0 (0.0%) |
| 35 to 44 Years | 0 (0.0%) | 0 (0.0%) |
| 45 to 54 Years | 54 (100.0%) | 0 (0.0%) |
| 55 to 59 Years | 14 (50.0%) | 0 (0.0%) |
| 60 to 64 Years | 9 (100.0%) | 0 (0.0%) |
| 65 to 74 Years | 0 (0.0%) | 0 (0.0%) |
| 75 Years and over | 0 (0.0%) | 0 (0.0%) |
| Total | 109 (43.3%) | 32 (29.4%) |
Employment Status by Educational Attainment in Lumber City
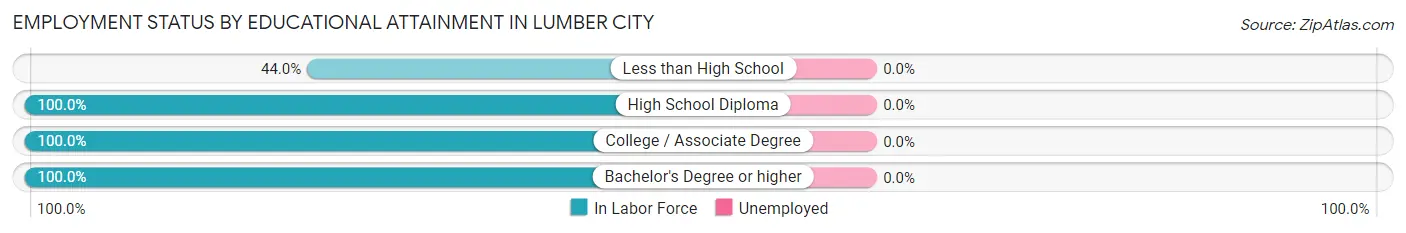
| Educational Attainment | In Labor Force | Unemployed |
| Less than High School | 11 (44.0%) | 0 (0.0%) |
| High School Diploma | 37 (100.0%) | 0 (0.0%) |
| College / Associate Degree | 20 (100.0%) | 0 (0.0%) |
| Bachelor's Degree or higher | 9 (100.0%) | 0 (0.0%) |
| Total | 77 (84.6%) | 0 (0.0%) |
Employment Occupations by Sex in Lumber City
Management, Business, Science and Arts Occupations
The most common Management, Business, Science and Arts occupations in Lumber City are , and Health Diagnosing & Treating (9 | 11.7%).
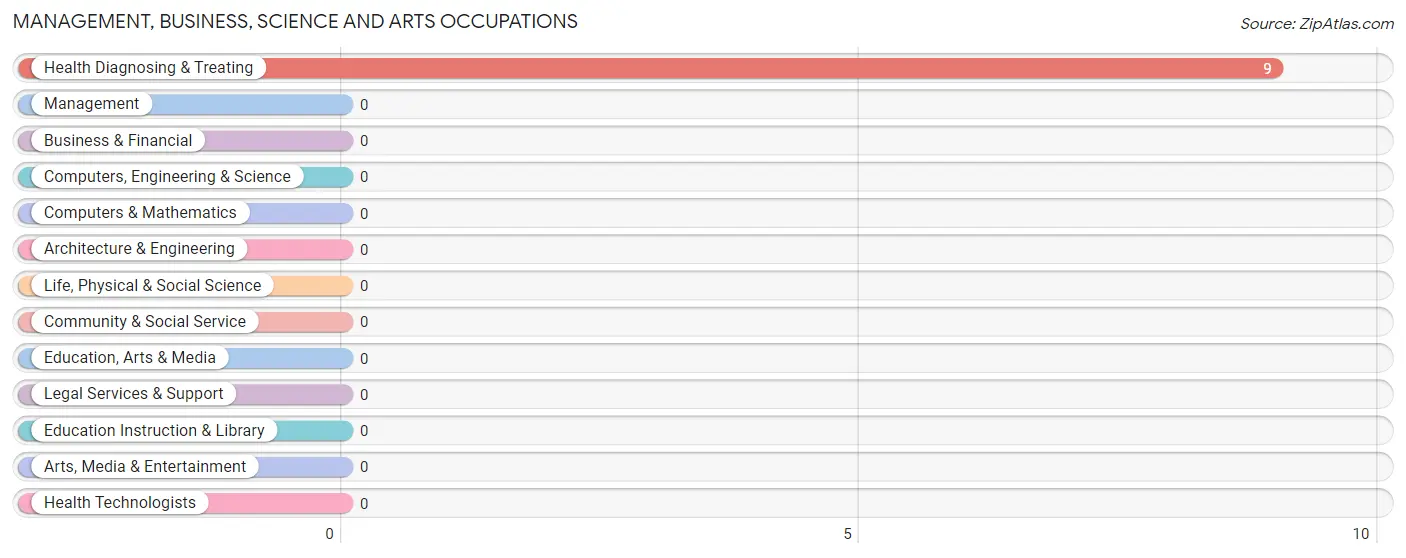
Management, Business, Science and Arts Occupations by Sex
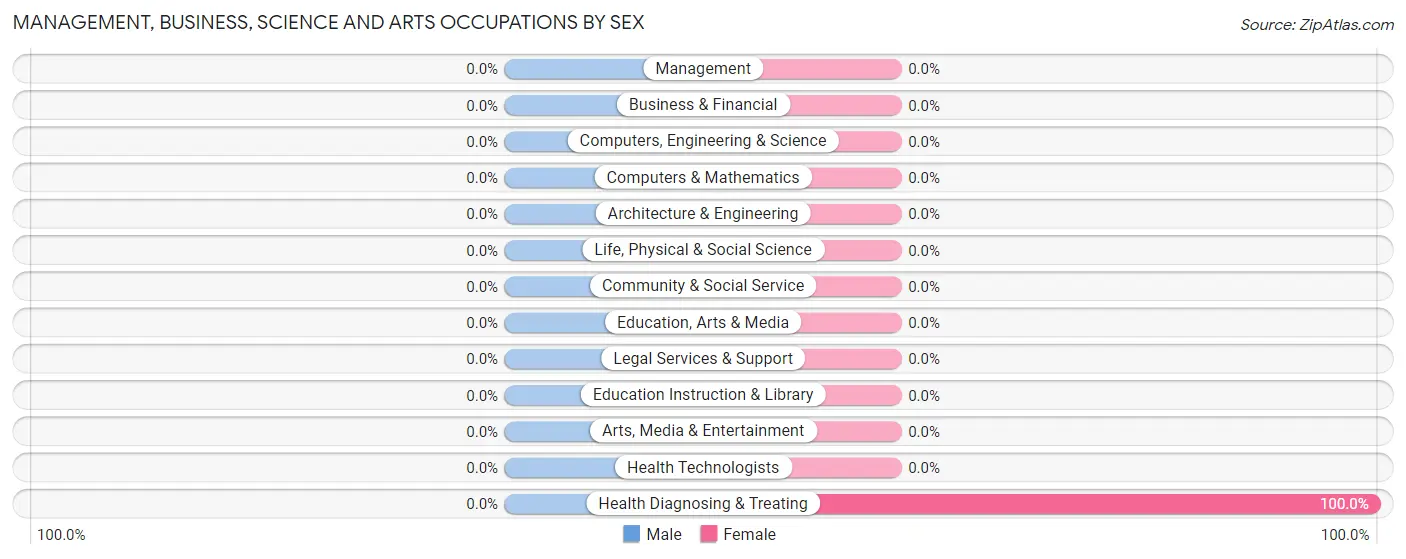
| Occupation | Male | Female |
| Management | 0 (0.0%) | 0 (0.0%) |
| Business & Financial | 0 (0.0%) | 0 (0.0%) |
| Computers, Engineering & Science | 0 (0.0%) | 0 (0.0%) |
| Computers & Mathematics | 0 (0.0%) | 0 (0.0%) |
| Architecture & Engineering | 0 (0.0%) | 0 (0.0%) |
| Life, Physical & Social Science | 0 (0.0%) | 0 (0.0%) |
| Community & Social Service | 0 (0.0%) | 0 (0.0%) |
| Education, Arts & Media | 0 (0.0%) | 0 (0.0%) |
| Legal Services & Support | 0 (0.0%) | 0 (0.0%) |
| Education Instruction & Library | 0 (0.0%) | 0 (0.0%) |
| Arts, Media & Entertainment | 0 (0.0%) | 0 (0.0%) |
| Health Diagnosing & Treating | 0 (0.0%) | 9 (100.0%) |
| Health Technologists | 0 (0.0%) | 0 (0.0%) |
| Total (Category) | 0 (0.0%) | 9 (100.0%) |
| Total (Overall) | 29 (37.7%) | 48 (62.3%) |
Services Occupations
The most common Services occupations in Lumber City are , and Cleaning & Maintenance (40 | 51.9%).
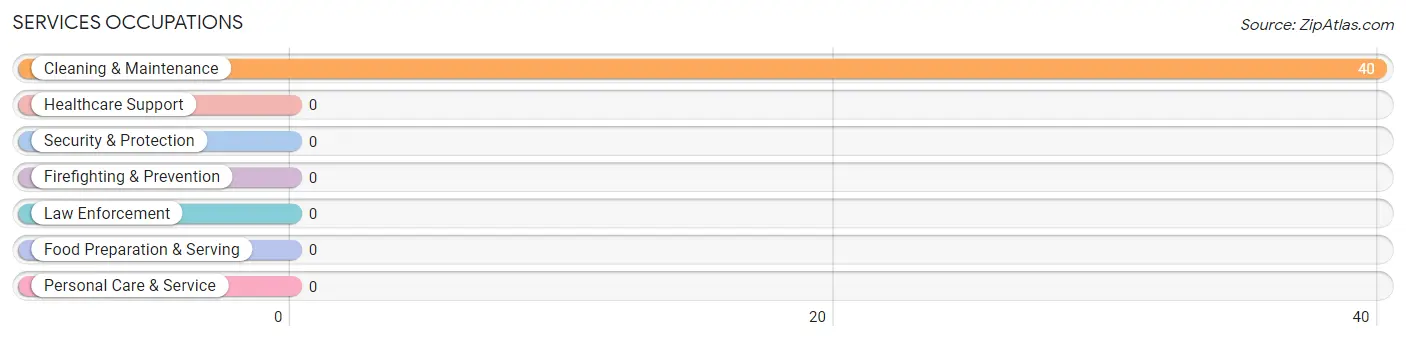
Services Occupations by Sex
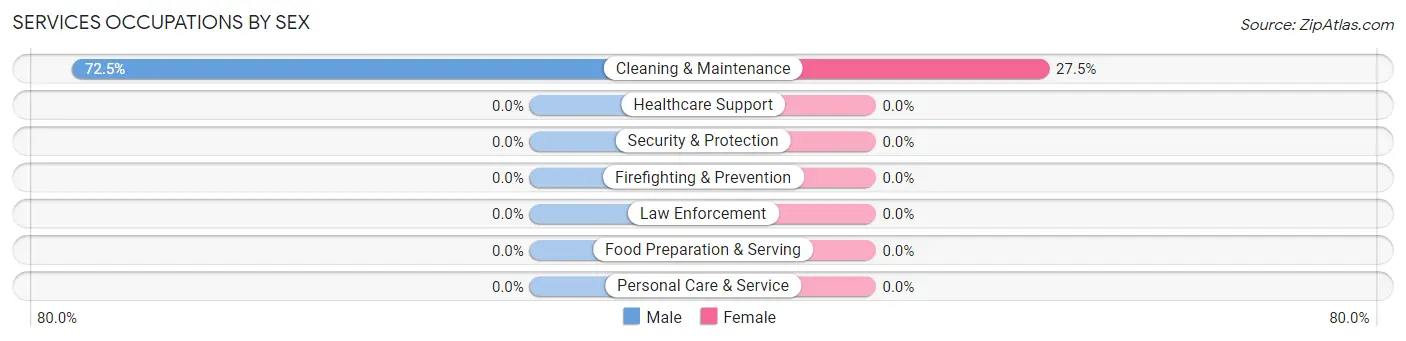
| Occupation | Male | Female |
| Healthcare Support | 0 (0.0%) | 0 (0.0%) |
| Security & Protection | 0 (0.0%) | 0 (0.0%) |
| Firefighting & Prevention | 0 (0.0%) | 0 (0.0%) |
| Law Enforcement | 0 (0.0%) | 0 (0.0%) |
| Food Preparation & Serving | 0 (0.0%) | 0 (0.0%) |
| Cleaning & Maintenance | 29 (72.5%) | 11 (27.5%) |
| Personal Care & Service | 0 (0.0%) | 0 (0.0%) |
| Total (Category) | 29 (72.5%) | 11 (27.5%) |
| Total (Overall) | 29 (37.7%) | 48 (62.3%) |
Sales and Office Occupations
The most common Sales and Office occupations in Lumber City are , and Office & Administration (14 | 18.2%).
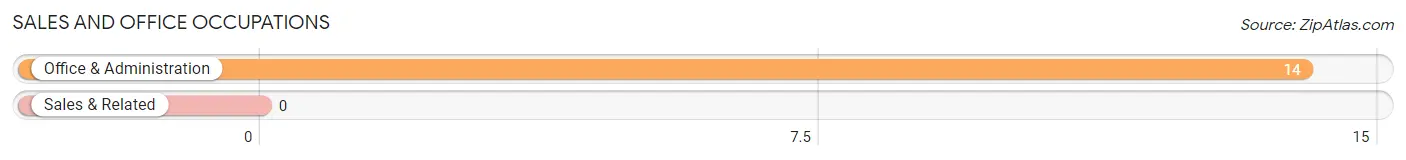
Sales and Office Occupations by Sex
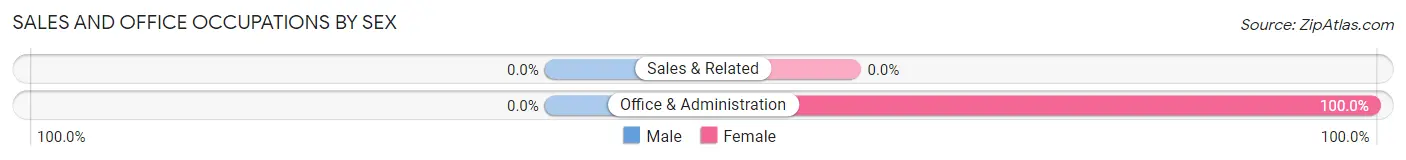
| Occupation | Male | Female |
| Sales & Related | 0 (0.0%) | 0 (0.0%) |
| Office & Administration | 0 (0.0%) | 14 (100.0%) |
| Total (Category) | 0 (0.0%) | 14 (100.0%) |
| Total (Overall) | 29 (37.7%) | 48 (62.3%) |
Natural Resources, Construction and Maintenance Occupations
Natural Resources, Construction and Maintenance Occupations by Sex
| Occupation | Male | Female |
| Farming, Fishing & Forestry | 0 (0.0%) | 0 (0.0%) |
| Construction & Extraction | 0 (0.0%) | 0 (0.0%) |
| Installation, Maintenance & Repair | 0 (0.0%) | 0 (0.0%) |
| Total (Category) | 0 (0.0%) | 0 (0.0%) |
| Total (Overall) | 29 (37.7%) | 48 (62.3%) |
Production, Transportation and Moving Occupations
The most common Production, Transportation and Moving occupations in Lumber City are , and Material Moving (14 | 18.2%).
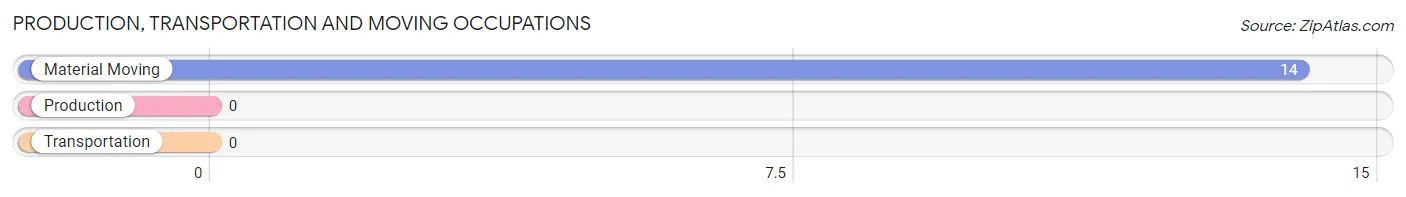
Production, Transportation and Moving Occupations by Sex
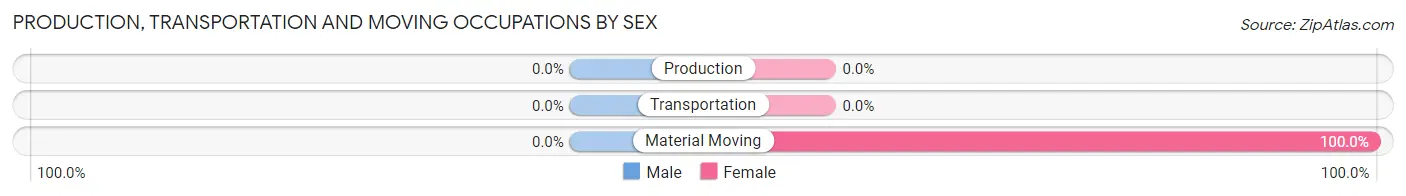
| Occupation | Male | Female |
| Production | 0 (0.0%) | 0 (0.0%) |
| Transportation | 0 (0.0%) | 0 (0.0%) |
| Material Moving | 0 (0.0%) | 14 (100.0%) |
| Total (Category) | 0 (0.0%) | 14 (100.0%) |
| Total (Overall) | 29 (37.7%) | 48 (62.3%) |
Employment Industries by Sex in Lumber City
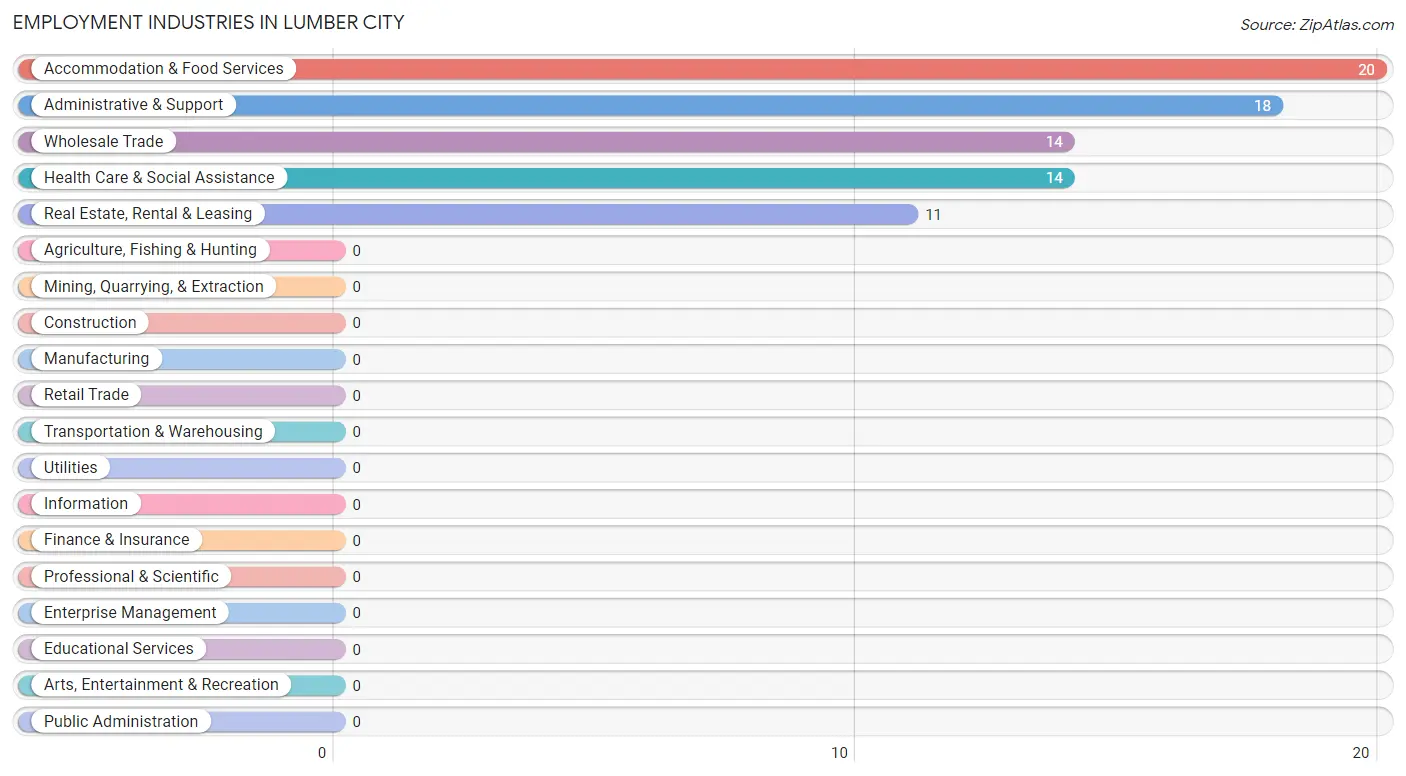
Employment Industries in Lumber City
The major employment industries in Lumber City include Accommodation & Food Services (20 | 26.0%), Administrative & Support (18 | 23.4%), Wholesale Trade (14 | 18.2%), Health Care & Social Assistance (14 | 18.2%), and Real Estate, Rental & Leasing (11 | 14.3%).
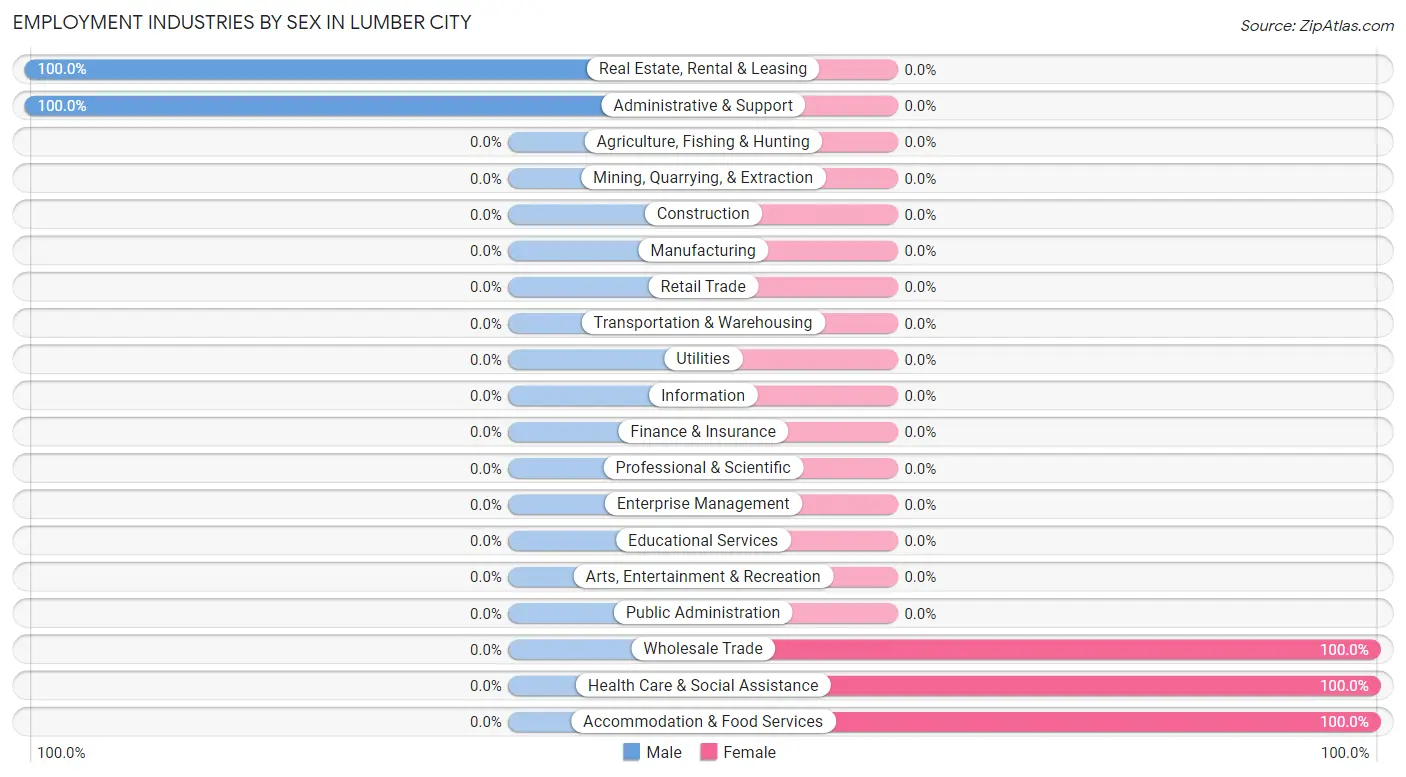
Employment Industries by Sex in Lumber City
The Lumber City industries that see more men than women are Real Estate, Rental & Leasing (100.0%), and Administrative & Support (100.0%), whereas the industries that tend to have a higher number of women are Wholesale Trade (100.0%), Health Care & Social Assistance (100.0%), and Accommodation & Food Services (100.0%).
| Industry | Male | Female |
| Agriculture, Fishing & Hunting | 0 (0.0%) | 0 (0.0%) |
| Mining, Quarrying, & Extraction | 0 (0.0%) | 0 (0.0%) |
| Construction | 0 (0.0%) | 0 (0.0%) |
| Manufacturing | 0 (0.0%) | 0 (0.0%) |
| Wholesale Trade | 0 (0.0%) | 14 (100.0%) |
| Retail Trade | 0 (0.0%) | 0 (0.0%) |
| Transportation & Warehousing | 0 (0.0%) | 0 (0.0%) |
| Utilities | 0 (0.0%) | 0 (0.0%) |
| Information | 0 (0.0%) | 0 (0.0%) |
| Finance & Insurance | 0 (0.0%) | 0 (0.0%) |
| Real Estate, Rental & Leasing | 11 (100.0%) | 0 (0.0%) |
| Professional & Scientific | 0 (0.0%) | 0 (0.0%) |
| Enterprise Management | 0 (0.0%) | 0 (0.0%) |
| Administrative & Support | 18 (100.0%) | 0 (0.0%) |
| Educational Services | 0 (0.0%) | 0 (0.0%) |
| Health Care & Social Assistance | 0 (0.0%) | 14 (100.0%) |
| Arts, Entertainment & Recreation | 0 (0.0%) | 0 (0.0%) |
| Accommodation & Food Services | 0 (0.0%) | 20 (100.0%) |
| Public Administration | 0 (0.0%) | 0 (0.0%) |
| Total | 29 (37.7%) | 48 (62.3%) |
Education in Lumber City
School Enrollment in Lumber City
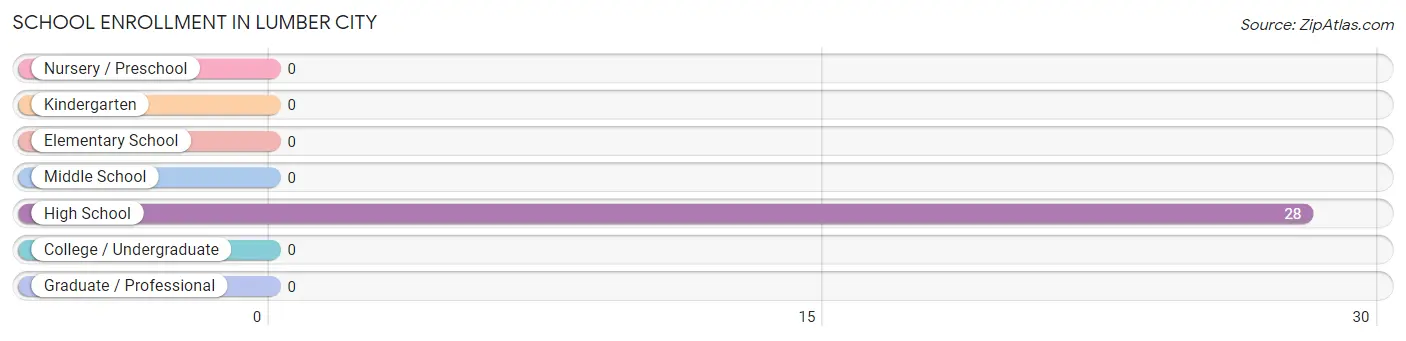
| School Level | # Students | % Students |
| Nursery / Preschool | 0 | 0.0% |
| Kindergarten | 0 | 0.0% |
| Elementary School | 0 | 0.0% |
| Middle School | 0 | 0.0% |
| High School | 28 | 100.0% |
| College / Undergraduate | 0 | 0.0% |
| Graduate / Professional | 0 | 0.0% |
| Total | 28 | 100.0% |
School Enrollment by Age by Funding Source in Lumber City
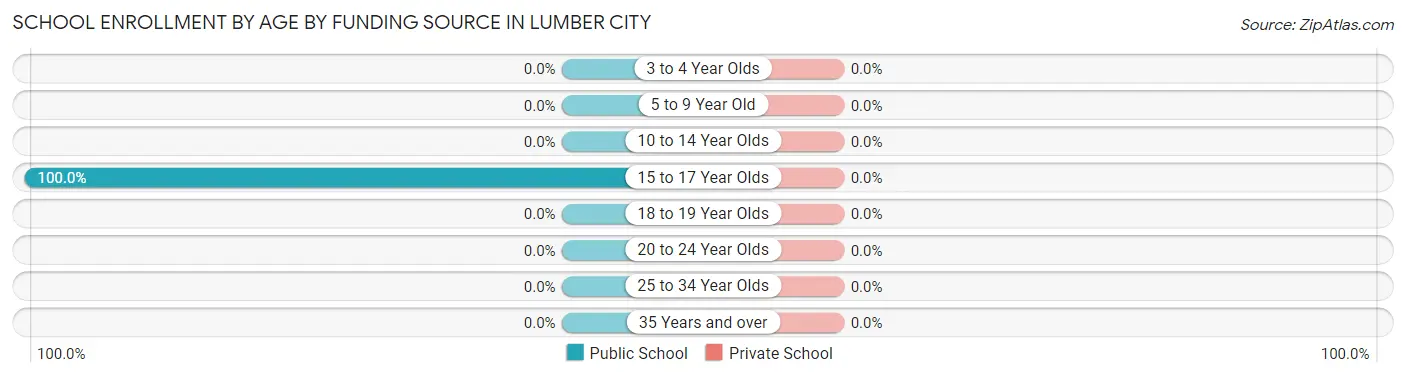
| Age Bracket | Public School | Private School |
| 3 to 4 Year Olds | 0 (0.0%) | 0 (0.0%) |
| 5 to 9 Year Old | 0 (0.0%) | 0 (0.0%) |
| 10 to 14 Year Olds | 0 (0.0%) | 0 (0.0%) |
| 15 to 17 Year Olds | 28 (100.0%) | 0 (0.0%) |
| 18 to 19 Year Olds | 0 (0.0%) | 0 (0.0%) |
| 20 to 24 Year Olds | 0 (0.0%) | 0 (0.0%) |
| 25 to 34 Year Olds | 0 (0.0%) | 0 (0.0%) |
| 35 Years and over | 0 (0.0%) | 0 (0.0%) |
| Total | 28 (100.0%) | 0 (0.0%) |
Educational Attainment by Field of Study in Lumber City
, and education (9 | 100.0%) are the most common fields of study among 9 individuals in Lumber City who have obtained a bachelor's degree or higher.
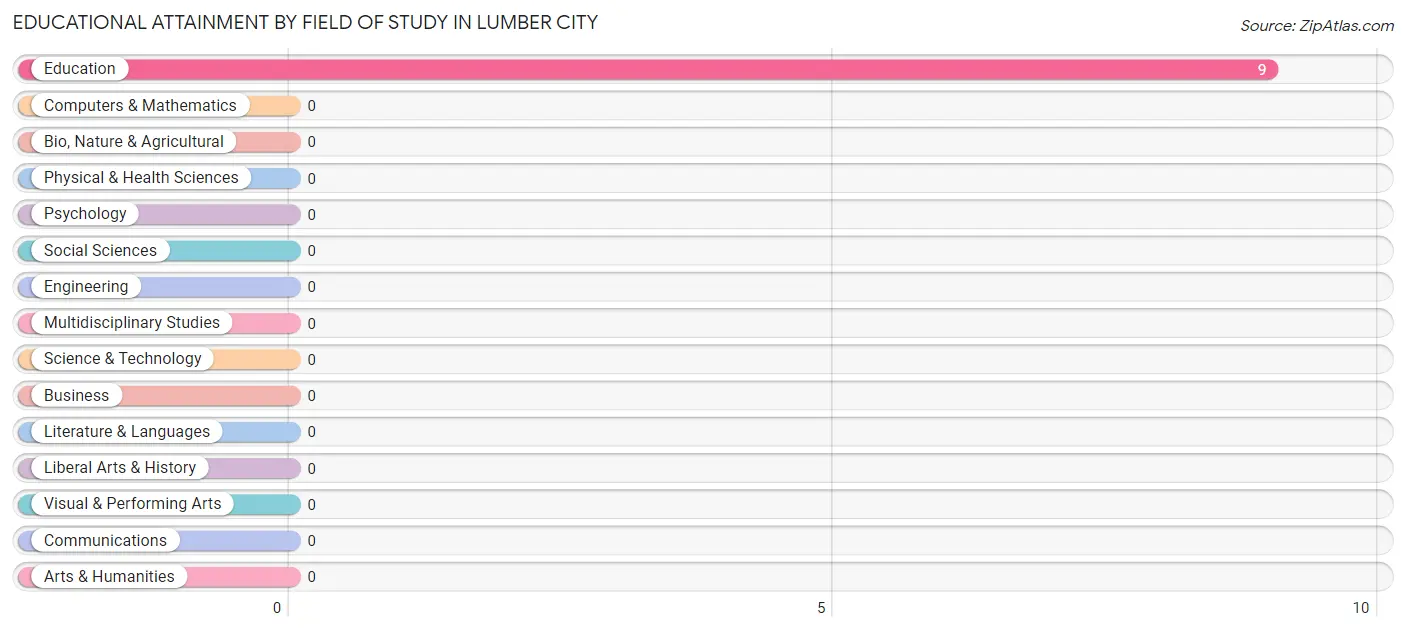
| Field of Study | # Graduates | % Graduates |
| Computers & Mathematics | 0 | 0.0% |
| Bio, Nature & Agricultural | 0 | 0.0% |
| Physical & Health Sciences | 0 | 0.0% |
| Psychology | 0 | 0.0% |
| Social Sciences | 0 | 0.0% |
| Engineering | 0 | 0.0% |
| Multidisciplinary Studies | 0 | 0.0% |
| Science & Technology | 0 | 0.0% |
| Business | 0 | 0.0% |
| Education | 9 | 100.0% |
| Literature & Languages | 0 | 0.0% |
| Liberal Arts & History | 0 | 0.0% |
| Visual & Performing Arts | 0 | 0.0% |
| Communications | 0 | 0.0% |
| Arts & Humanities | 0 | 0.0% |
| Total | 9 | 100.0% |
Transportation & Commute in Lumber City
Vehicle Availability by Sex in Lumber City
The most prevalent vehicle ownership categories in Lumber City are males with 3 vehicles (29, accounting for 100.0%) and females with 3 vehicles (28, making up 60.4%).
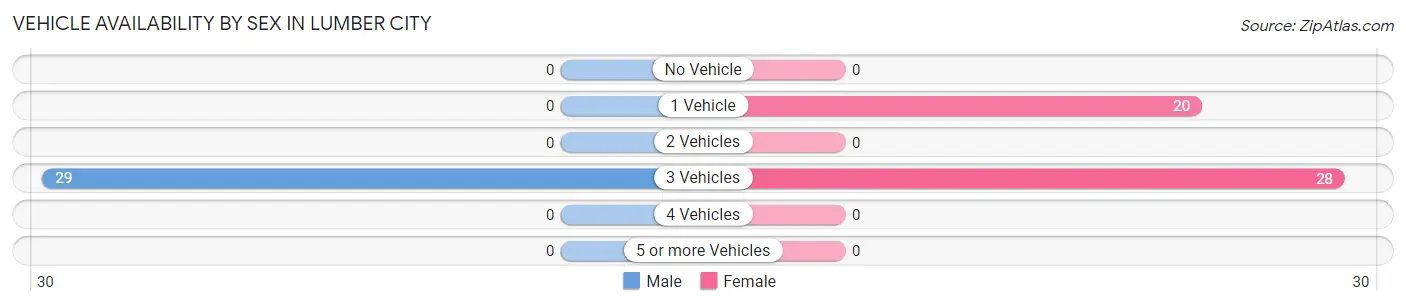
| Vehicles Available | Male | Female |
| No Vehicle | 0 (0.0%) | 0 (0.0%) |
| 1 Vehicle | 0 (0.0%) | 20 (41.7%) |
| 2 Vehicles | 0 (0.0%) | 0 (0.0%) |
| 3 Vehicles | 29 (100.0%) | 28 (58.3%) |
| 4 Vehicles | 0 (0.0%) | 0 (0.0%) |
| 5 or more Vehicles | 0 (0.0%) | 0 (0.0%) |
| Total | 29 (100.0%) | 48 (100.0%) |
Commute Time in Lumber City
The most frequently occuring commute durations in Lumber City are 15 to 19 minutes (36 commuters, 46.8%), 25 to 29 minutes (18 commuters, 23.4%), and 5 to 9 minutes (14 commuters, 18.2%).
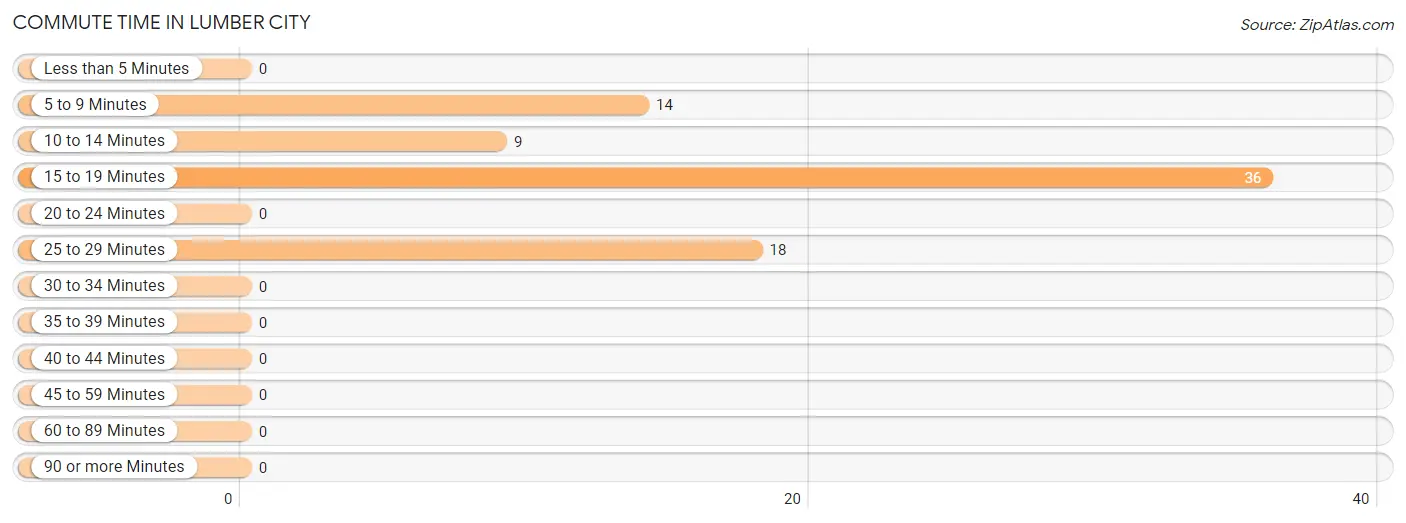
| Commute Time | # Commuters | % Commuters |
| Less than 5 Minutes | 0 | 0.0% |
| 5 to 9 Minutes | 14 | 18.2% |
| 10 to 14 Minutes | 9 | 11.7% |
| 15 to 19 Minutes | 36 | 46.8% |
| 20 to 24 Minutes | 0 | 0.0% |
| 25 to 29 Minutes | 18 | 23.4% |
| 30 to 34 Minutes | 0 | 0.0% |
| 35 to 39 Minutes | 0 | 0.0% |
| 40 to 44 Minutes | 0 | 0.0% |
| 45 to 59 Minutes | 0 | 0.0% |
| 60 to 89 Minutes | 0 | 0.0% |
| 90 or more Minutes | 0 | 0.0% |
Commute Time by Sex in Lumber City
The most common commute times in Lumber City are 25 to 29 minutes (18 commuters, 62.1%) for males and 15 to 19 minutes (25 commuters, 52.1%) for females.
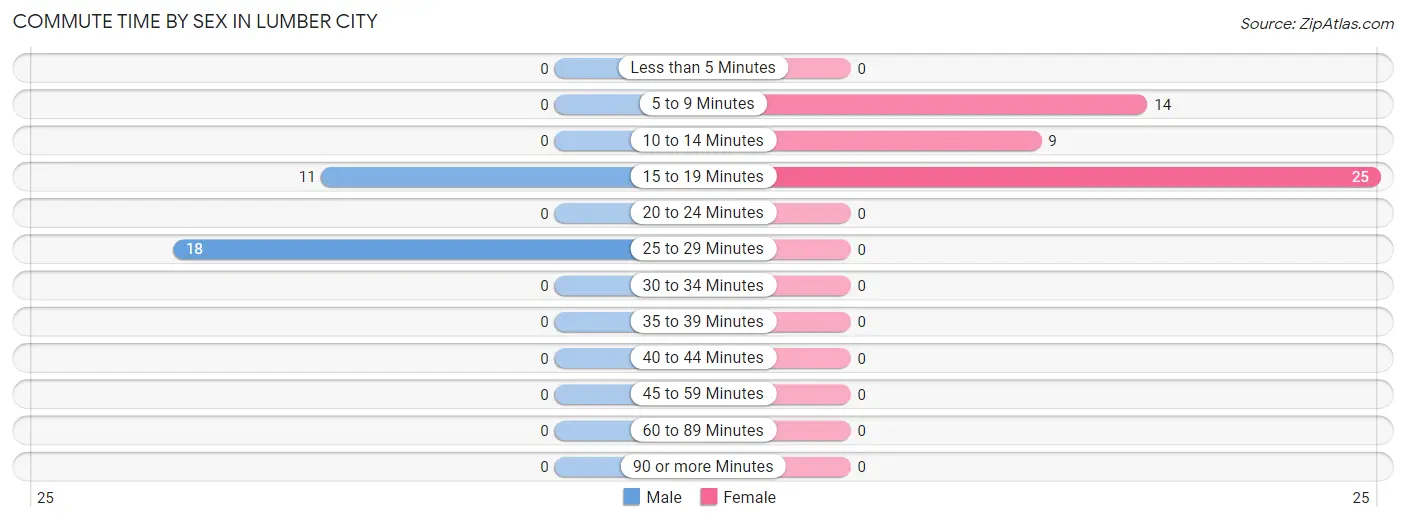
| Commute Time | Male | Female |
| Less than 5 Minutes | 0 (0.0%) | 0 (0.0%) |
| 5 to 9 Minutes | 0 (0.0%) | 14 (29.2%) |
| 10 to 14 Minutes | 0 (0.0%) | 9 (18.8%) |
| 15 to 19 Minutes | 11 (37.9%) | 25 (52.1%) |
| 20 to 24 Minutes | 0 (0.0%) | 0 (0.0%) |
| 25 to 29 Minutes | 18 (62.1%) | 0 (0.0%) |
| 30 to 34 Minutes | 0 (0.0%) | 0 (0.0%) |
| 35 to 39 Minutes | 0 (0.0%) | 0 (0.0%) |
| 40 to 44 Minutes | 0 (0.0%) | 0 (0.0%) |
| 45 to 59 Minutes | 0 (0.0%) | 0 (0.0%) |
| 60 to 89 Minutes | 0 (0.0%) | 0 (0.0%) |
| 90 or more Minutes | 0 (0.0%) | 0 (0.0%) |
Time of Departure to Work by Sex in Lumber City
The most frequent times of departure to work in Lumber City are 6:30 AM to 6:59 AM (29, 100.0%) for males and 6:00 AM to 6:29 AM (14, 29.2%) for females.
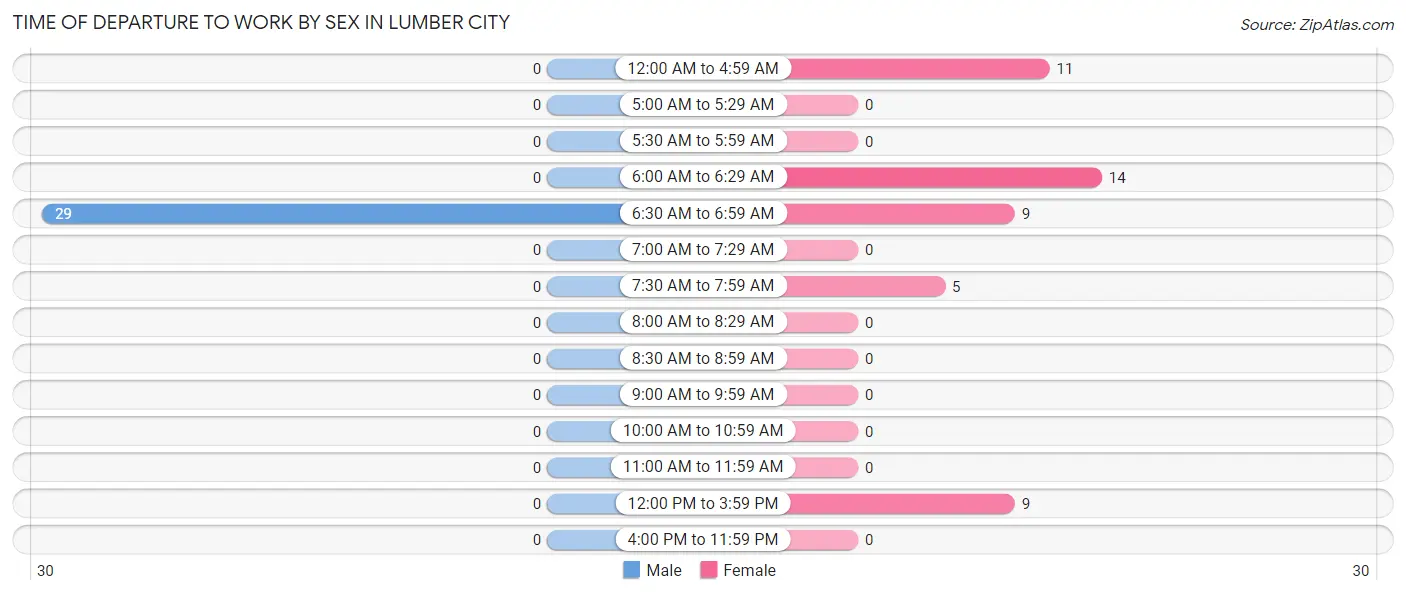
| Time of Departure | Male | Female |
| 12:00 AM to 4:59 AM | 0 (0.0%) | 11 (22.9%) |
| 5:00 AM to 5:29 AM | 0 (0.0%) | 0 (0.0%) |
| 5:30 AM to 5:59 AM | 0 (0.0%) | 0 (0.0%) |
| 6:00 AM to 6:29 AM | 0 (0.0%) | 14 (29.2%) |
| 6:30 AM to 6:59 AM | 29 (100.0%) | 9 (18.8%) |
| 7:00 AM to 7:29 AM | 0 (0.0%) | 0 (0.0%) |
| 7:30 AM to 7:59 AM | 0 (0.0%) | 5 (10.4%) |
| 8:00 AM to 8:29 AM | 0 (0.0%) | 0 (0.0%) |
| 8:30 AM to 8:59 AM | 0 (0.0%) | 0 (0.0%) |
| 9:00 AM to 9:59 AM | 0 (0.0%) | 0 (0.0%) |
| 10:00 AM to 10:59 AM | 0 (0.0%) | 0 (0.0%) |
| 11:00 AM to 11:59 AM | 0 (0.0%) | 0 (0.0%) |
| 12:00 PM to 3:59 PM | 0 (0.0%) | 9 (18.8%) |
| 4:00 PM to 11:59 PM | 0 (0.0%) | 0 (0.0%) |
| Total | 29 (100.0%) | 48 (100.0%) |
Housing Occupancy in Lumber City
Occupancy by Ownership in Lumber City
Of the total 124 dwellings in Lumber City, owner-occupied units account for 124 (100.0%), while renter-occupied units make up 0 (0.0%).
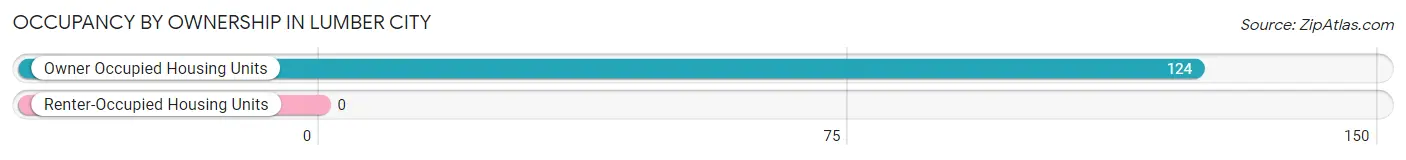
| Occupancy | # Housing Units | % Housing Units |
| Owner Occupied Housing Units | 124 | 100.0% |
| Renter-Occupied Housing Units | 0 | 0.0% |
| Total Occupied Housing Units | 124 | 100.0% |
Occupancy by Household Size in Lumber City
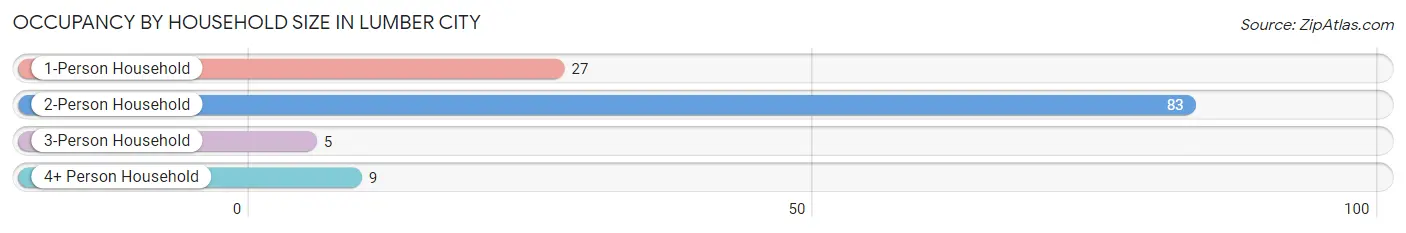
| Household Size | # Housing Units | % Housing Units |
| 1-Person Household | 27 | 21.8% |
| 2-Person Household | 83 | 66.9% |
| 3-Person Household | 5 | 4.0% |
| 4+ Person Household | 9 | 7.3% |
| Total Housing Units | 124 | 100.0% |
Occupancy by Ownership by Household Size in Lumber City
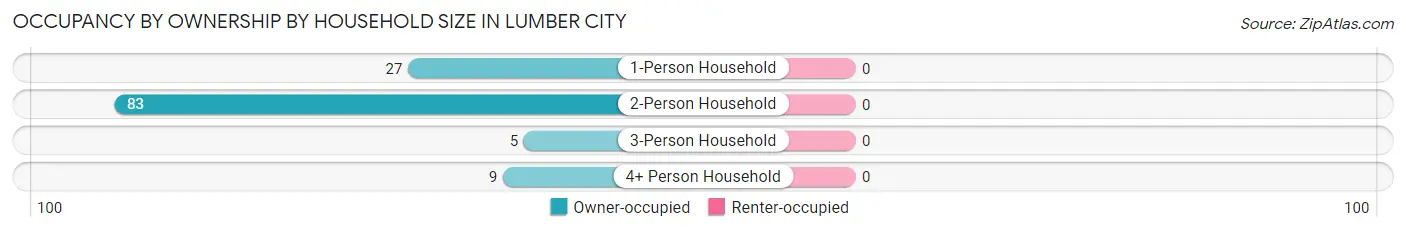
| Household Size | Owner-occupied | Renter-occupied |
| 1-Person Household | 27 (100.0%) | 0 (0.0%) |
| 2-Person Household | 83 (100.0%) | 0 (0.0%) |
| 3-Person Household | 5 (100.0%) | 0 (0.0%) |
| 4+ Person Household | 9 (100.0%) | 0 (0.0%) |
| Total Housing Units | 124 (100.0%) | 0 (0.0%) |
Occupancy by Educational Attainment in Lumber City
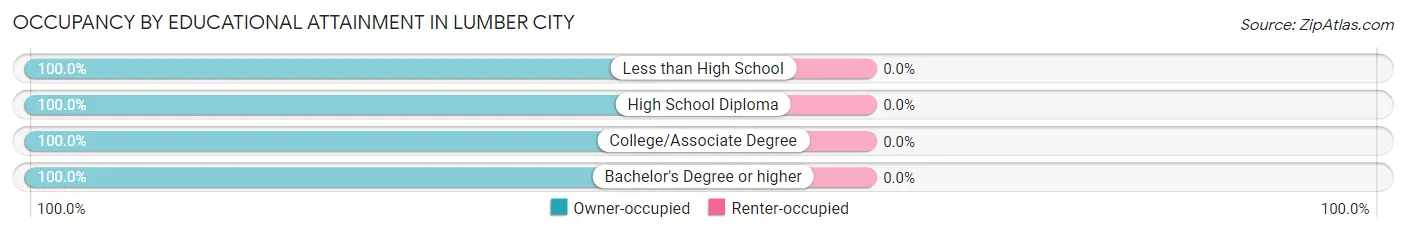
| Household Size | Owner-occupied | Renter-occupied |
| Less than High School | 20 (100.0%) | 0 (0.0%) |
| High School Diploma | 77 (100.0%) | 0 (0.0%) |
| College/Associate Degree | 18 (100.0%) | 0 (0.0%) |
| Bachelor's Degree or higher | 9 (100.0%) | 0 (0.0%) |
Occupancy by Age of Householder in Lumber City
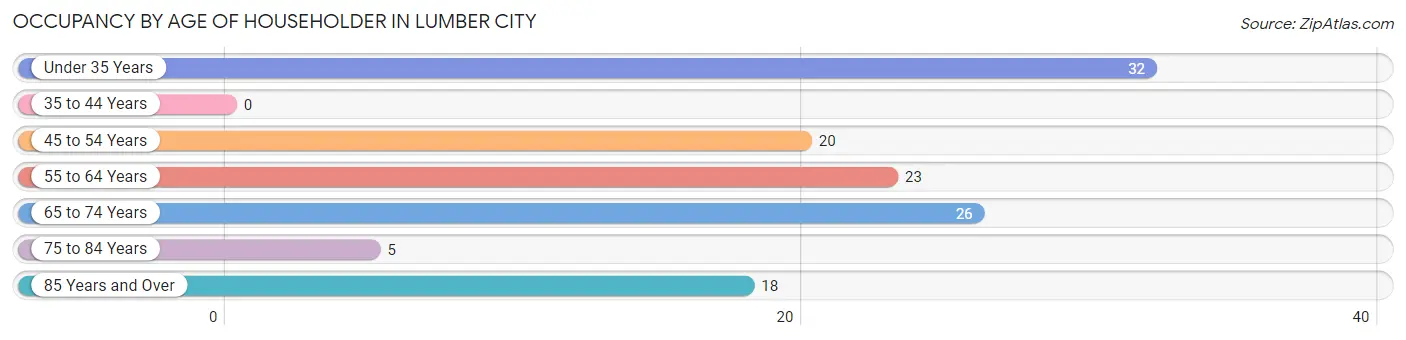
| Age Bracket | # Households | % Households |
| Under 35 Years | 32 | 25.8% |
| 35 to 44 Years | 0 | 0.0% |
| 45 to 54 Years | 20 | 16.1% |
| 55 to 64 Years | 23 | 18.5% |
| 65 to 74 Years | 26 | 21.0% |
| 75 to 84 Years | 5 | 4.0% |
| 85 Years and Over | 18 | 14.5% |
| Total | 124 | 100.0% |
Housing Finances in Lumber City
Median Income by Occupancy in Lumber City
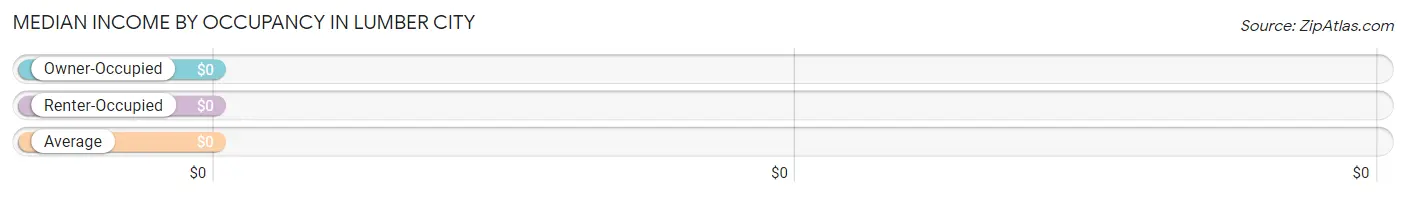
| Occupancy Type | # Households | Median Income |
| Owner-Occupied | 124 (100.0%) | $0 |
| Renter-Occupied | 0 (0.0%) | $0 |
| Average | 124 (100.0%) | $0 |
Occupancy by Householder Income Bracket in Lumber City
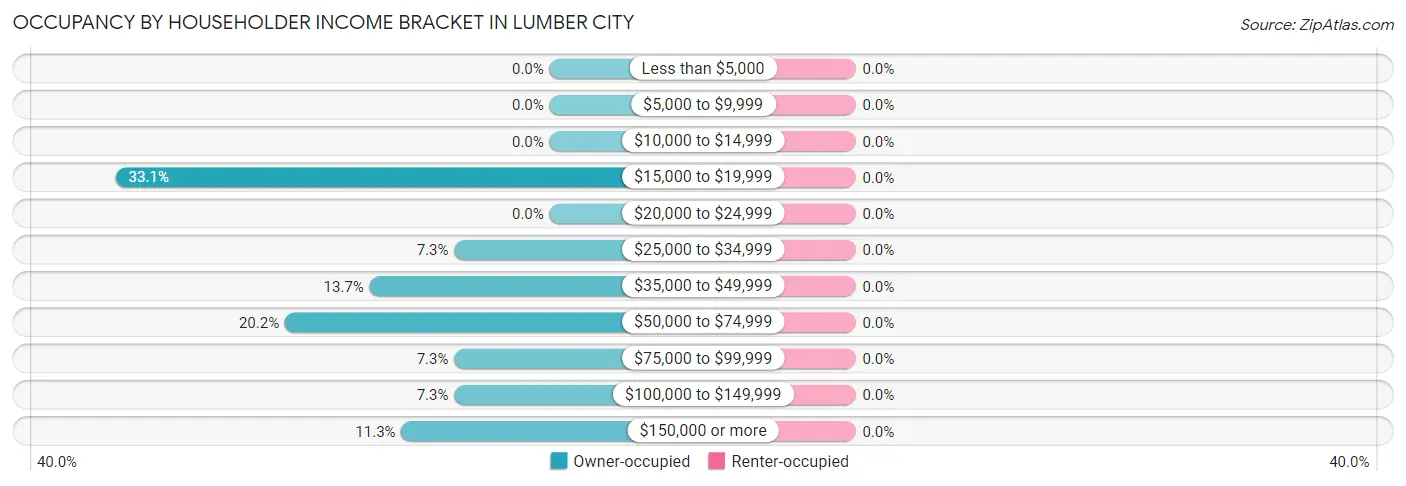
| Income Bracket | Owner-occupied | Renter-occupied |
| Less than $5,000 | 0 (0.0%) | 0 (0.0%) |
| $5,000 to $9,999 | 0 (0.0%) | 0 (0.0%) |
| $10,000 to $14,999 | 0 (0.0%) | 0 (0.0%) |
| $15,000 to $19,999 | 41 (33.1%) | 0 (0.0%) |
| $20,000 to $24,999 | 0 (0.0%) | 0 (0.0%) |
| $25,000 to $34,999 | 9 (7.3%) | 0 (0.0%) |
| $35,000 to $49,999 | 17 (13.7%) | 0 (0.0%) |
| $50,000 to $74,999 | 25 (20.2%) | 0 (0.0%) |
| $75,000 to $99,999 | 9 (7.3%) | 0 (0.0%) |
| $100,000 to $149,999 | 9 (7.3%) | 0 (0.0%) |
| $150,000 or more | 14 (11.3%) | 0 (0.0%) |
| Total | 124 (100.0%) | 0 (0.0%) |
Monthly Housing Cost Tiers in Lumber City
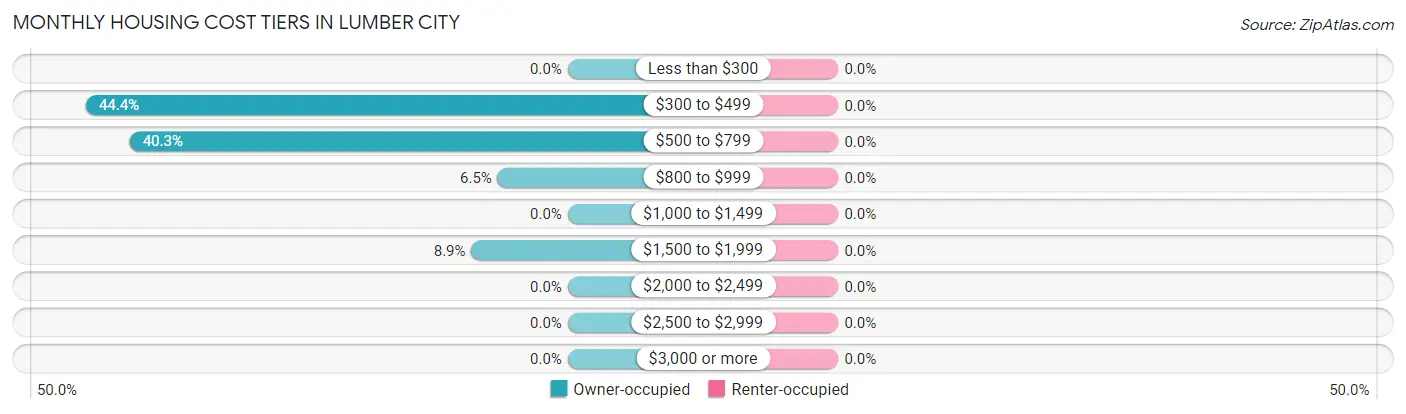
| Monthly Cost | Owner-occupied | Renter-occupied |
| Less than $300 | 0 (0.0%) | 0 (0.0%) |
| $300 to $499 | 55 (44.4%) | 0 (0.0%) |
| $500 to $799 | 50 (40.3%) | 0 (0.0%) |
| $800 to $999 | 8 (6.5%) | 0 (0.0%) |
| $1,000 to $1,499 | 0 (0.0%) | 0 (0.0%) |
| $1,500 to $1,999 | 11 (8.9%) | 0 (0.0%) |
| $2,000 to $2,499 | 0 (0.0%) | 0 (0.0%) |
| $2,500 to $2,999 | 0 (0.0%) | 0 (0.0%) |
| $3,000 or more | 0 (0.0%) | 0 (0.0%) |
| Total | 124 (100.0%) | 0 (0.0%) |
Physical Housing Characteristics in Lumber City
Housing Structures in Lumber City
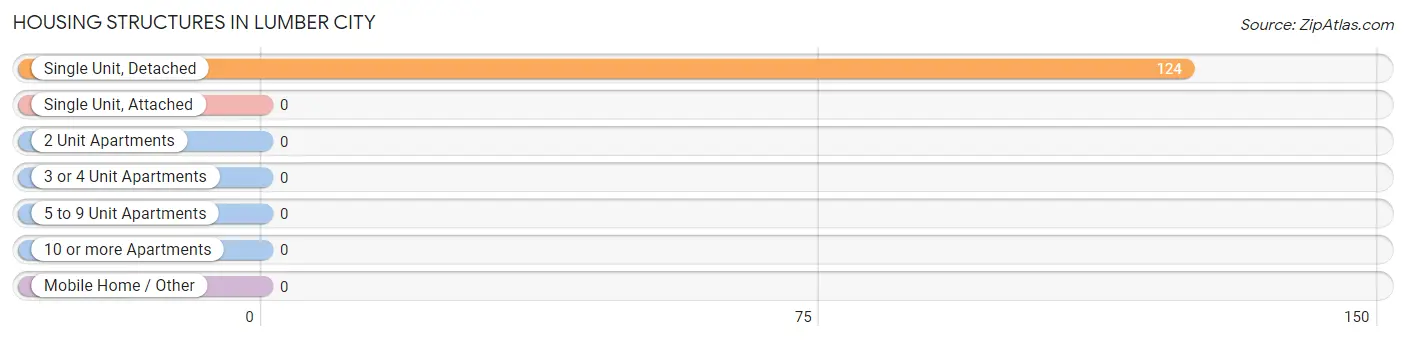
| Structure Type | # Housing Units | % Housing Units |
| Single Unit, Detached | 124 | 100.0% |
| Single Unit, Attached | 0 | 0.0% |
| 2 Unit Apartments | 0 | 0.0% |
| 3 or 4 Unit Apartments | 0 | 0.0% |
| 5 to 9 Unit Apartments | 0 | 0.0% |
| 10 or more Apartments | 0 | 0.0% |
| Mobile Home / Other | 0 | 0.0% |
| Total | 124 | 100.0% |
Housing Structures by Occupancy in Lumber City
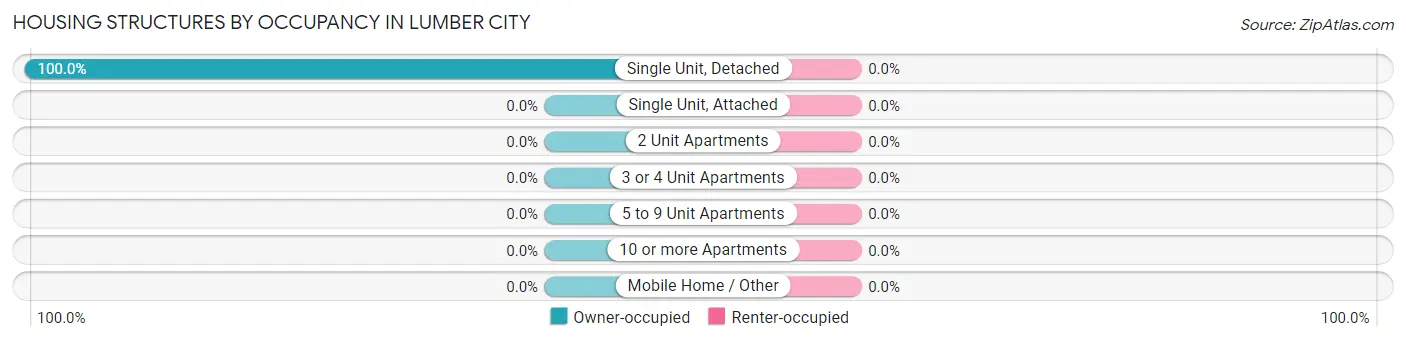
| Structure Type | Owner-occupied | Renter-occupied |
| Single Unit, Detached | 124 (100.0%) | 0 (0.0%) |
| Single Unit, Attached | 0 (0.0%) | 0 (0.0%) |
| 2 Unit Apartments | 0 (0.0%) | 0 (0.0%) |
| 3 or 4 Unit Apartments | 0 (0.0%) | 0 (0.0%) |
| 5 to 9 Unit Apartments | 0 (0.0%) | 0 (0.0%) |
| 10 or more Apartments | 0 (0.0%) | 0 (0.0%) |
| Mobile Home / Other | 0 (0.0%) | 0 (0.0%) |
| Total | 124 (100.0%) | 0 (0.0%) |
Housing Structures by Number of Rooms in Lumber City
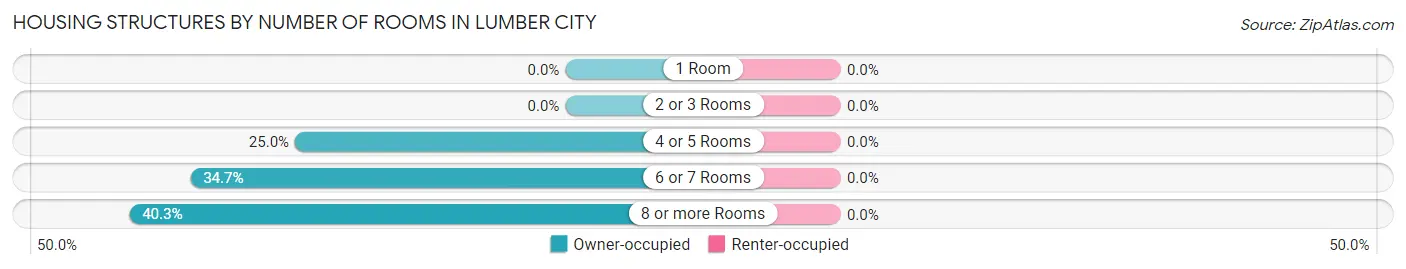
| Number of Rooms | Owner-occupied | Renter-occupied |
| 1 Room | 0 (0.0%) | 0 (0.0%) |
| 2 or 3 Rooms | 0 (0.0%) | 0 (0.0%) |
| 4 or 5 Rooms | 31 (25.0%) | 0 (0.0%) |
| 6 or 7 Rooms | 43 (34.7%) | 0 (0.0%) |
| 8 or more Rooms | 50 (40.3%) | 0 (0.0%) |
| Total | 124 (100.0%) | 0 (0.0%) |
Housing Structure by Heating Type in Lumber City
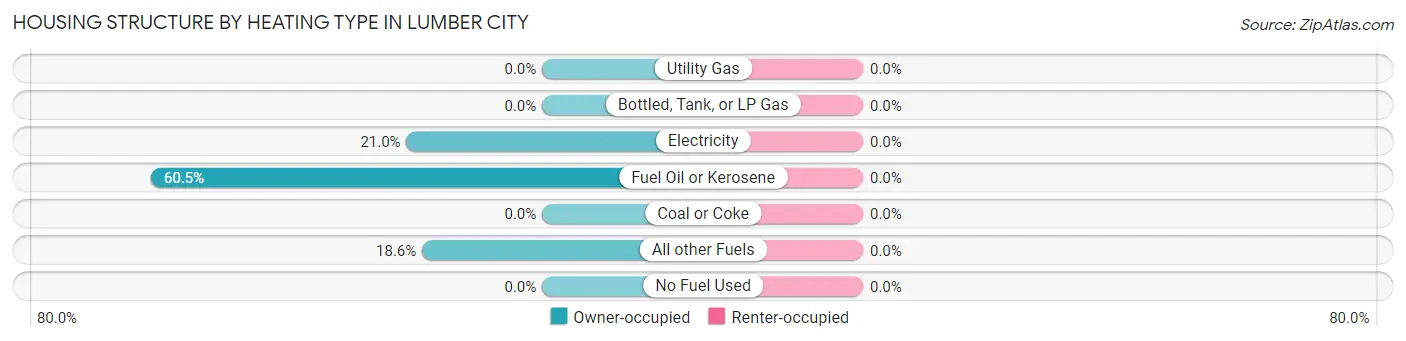
| Heating Type | Owner-occupied | Renter-occupied |
| Utility Gas | 0 (0.0%) | 0 (0.0%) |
| Bottled, Tank, or LP Gas | 0 (0.0%) | 0 (0.0%) |
| Electricity | 26 (21.0%) | 0 (0.0%) |
| Fuel Oil or Kerosene | 75 (60.5%) | 0 (0.0%) |
| Coal or Coke | 0 (0.0%) | 0 (0.0%) |
| All other Fuels | 23 (18.5%) | 0 (0.0%) |
| No Fuel Used | 0 (0.0%) | 0 (0.0%) |
| Total | 124 (100.0%) | 0 (0.0%) |
Household Vehicle Usage in Lumber City
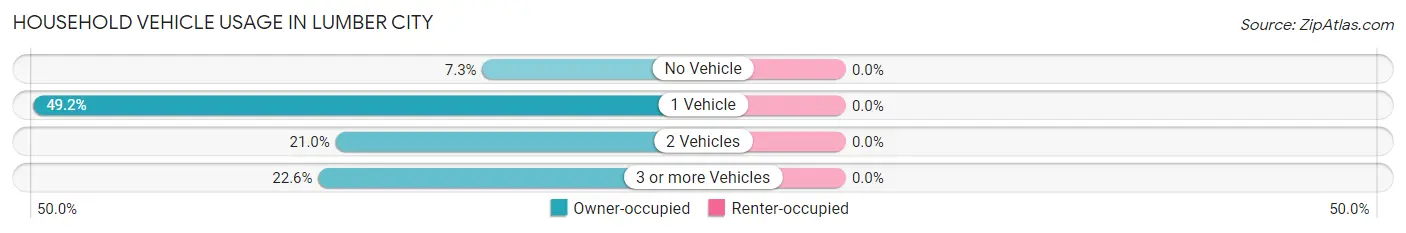
| Vehicles per Household | Owner-occupied | Renter-occupied |
| No Vehicle | 9 (7.3%) | 0 (0.0%) |
| 1 Vehicle | 61 (49.2%) | 0 (0.0%) |
| 2 Vehicles | 26 (21.0%) | 0 (0.0%) |
| 3 or more Vehicles | 28 (22.6%) | 0 (0.0%) |
| Total | 124 (100.0%) | 0 (0.0%) |
Real Estate & Mortgages in Lumber City
Real Estate and Mortgage Overview in Lumber City
| Characteristic | Without Mortgage | With Mortgage |
| Housing Units | 99 | 25 |
| Median Property Value | $105,300 | $0 |
| Median Household Income | - | - |
| Monthly Housing Costs | $488 | $0 |
| Real Estate Taxes | $1,565 | $0 |
Property Value by Mortgage Status in Lumber City
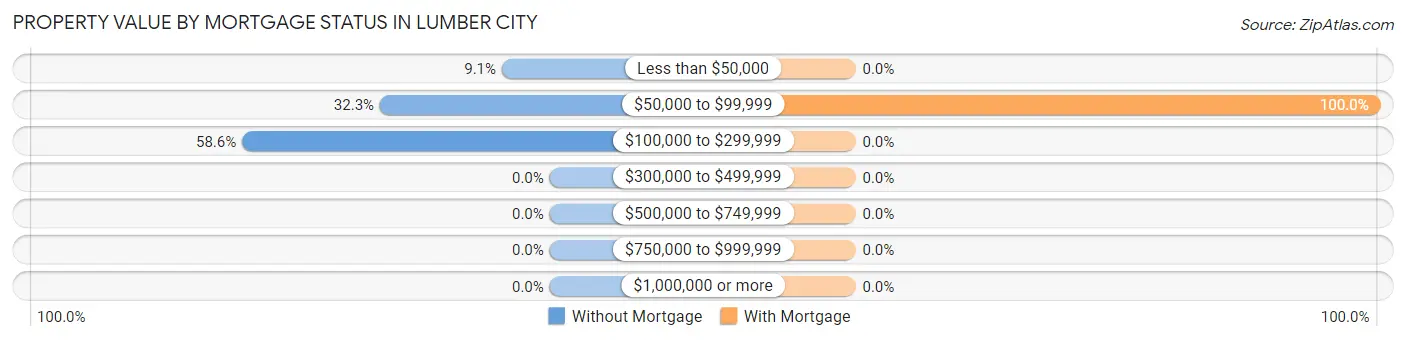
| Property Value | Without Mortgage | With Mortgage |
| Less than $50,000 | 9 (9.1%) | 0 (0.0%) |
| $50,000 to $99,999 | 32 (32.3%) | 25 (100.0%) |
| $100,000 to $299,999 | 58 (58.6%) | 0 (0.0%) |
| $300,000 to $499,999 | 0 (0.0%) | 0 (0.0%) |
| $500,000 to $749,999 | 0 (0.0%) | 0 (0.0%) |
| $750,000 to $999,999 | 0 (0.0%) | 0 (0.0%) |
| $1,000,000 or more | 0 (0.0%) | 0 (0.0%) |
| Total | 99 (100.0%) | 25 (100.0%) |
Household Income by Mortgage Status in Lumber City
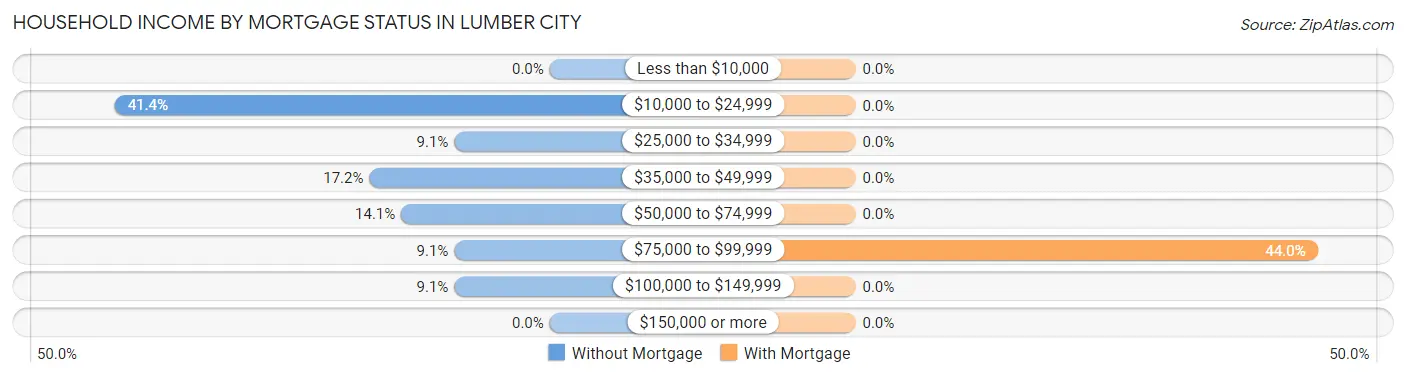
| Household Income | Without Mortgage | With Mortgage |
| Less than $10,000 | 0 (0.0%) | 0 (0.0%) |
| $10,000 to $24,999 | 41 (41.4%) | 0 (0.0%) |
| $25,000 to $34,999 | 9 (9.1%) | 0 (0.0%) |
| $35,000 to $49,999 | 17 (17.2%) | 0 (0.0%) |
| $50,000 to $74,999 | 14 (14.1%) | 0 (0.0%) |
| $75,000 to $99,999 | 9 (9.1%) | 11 (44.0%) |
| $100,000 to $149,999 | 9 (9.1%) | 0 (0.0%) |
| $150,000 or more | 0 (0.0%) | 0 (0.0%) |
| Total | 99 (100.0%) | 25 (100.0%) |
Property Value to Household Income Ratio in Lumber City
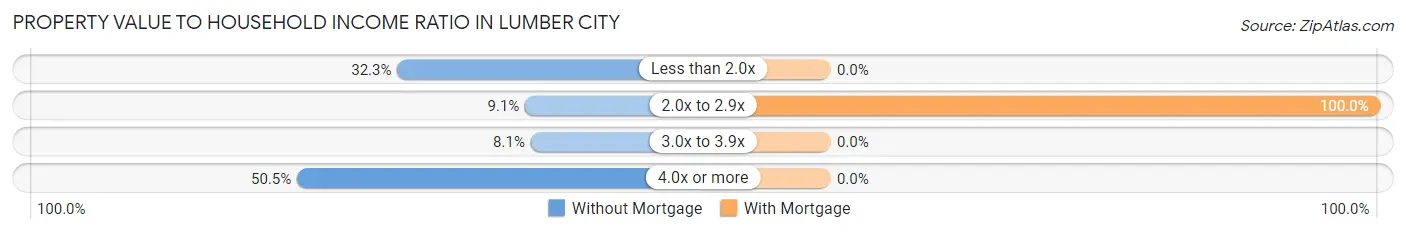
| Value-to-Income Ratio | Without Mortgage | With Mortgage |
| Less than 2.0x | 32 (32.3%) | 0 (0.0%) |
| 2.0x to 2.9x | 9 (9.1%) | 25 (100.0%) |
| 3.0x to 3.9x | 8 (8.1%) | 0 (0.0%) |
| 4.0x or more | 50 (50.5%) | 0 (0.0%) |
| Total | 99 (100.0%) | 25 (100.0%) |
Real Estate Taxes by Mortgage Status in Lumber City
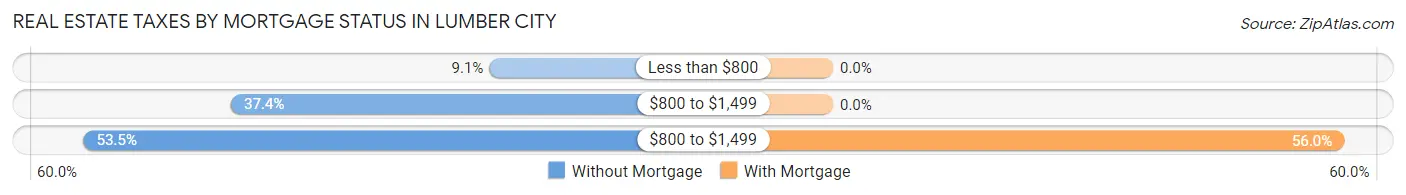
| Property Taxes | Without Mortgage | With Mortgage |
| Less than $800 | 9 (9.1%) | 0 (0.0%) |
| $800 to $1,499 | 37 (37.4%) | 0 (0.0%) |
| $800 to $1,499 | 53 (53.5%) | 14 (56.0%) |
| Total | 99 (100.0%) | 25 (100.0%) |
Health & Disability in Lumber City
Health Insurance Coverage by Age in Lumber City
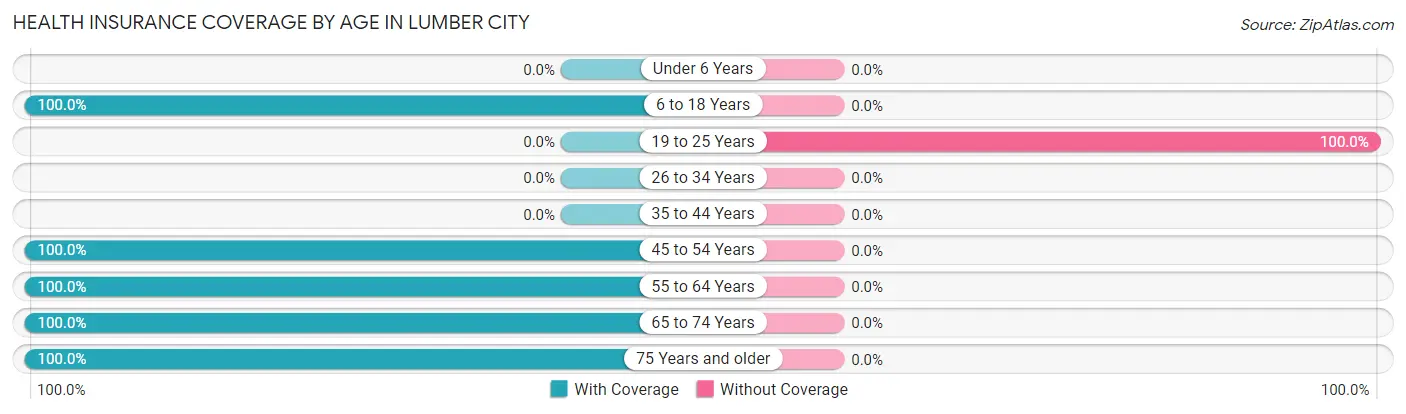
| Age Bracket | With Coverage | Without Coverage |
| Under 6 Years | 0 (0.0%) | 0 (0.0%) |
| 6 to 18 Years | 28 (100.0%) | 0 (0.0%) |
| 19 to 25 Years | 0 (0.0%) | 32 (100.0%) |
| 26 to 34 Years | 0 (0.0%) | 0 (0.0%) |
| 35 to 44 Years | 0 (0.0%) | 0 (0.0%) |
| 45 to 54 Years | 54 (100.0%) | 0 (0.0%) |
| 55 to 64 Years | 37 (100.0%) | 0 (0.0%) |
| 65 to 74 Years | 50 (100.0%) | 0 (0.0%) |
| 75 Years and older | 51 (100.0%) | 0 (0.0%) |
| Total | 220 (87.3%) | 32 (12.7%) |
Health Insurance Coverage by Citizenship Status in Lumber City
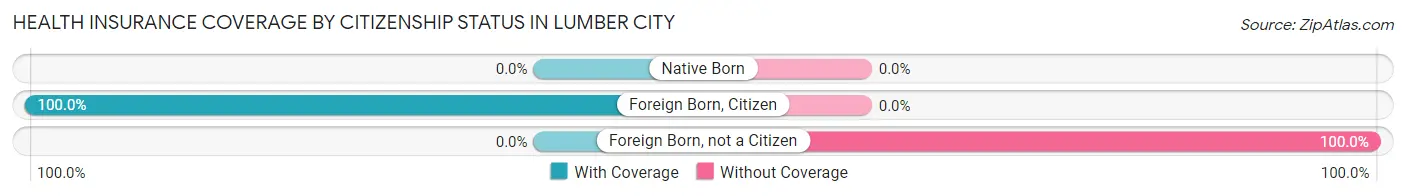
| Citizenship Status | With Coverage | Without Coverage |
| Native Born | 0 (0.0%) | 0 (0.0%) |
| Foreign Born, Citizen | 28 (100.0%) | 0 (0.0%) |
| Foreign Born, not a Citizen | 0 (0.0%) | 32 (100.0%) |
Health Insurance Coverage by Household Income in Lumber City
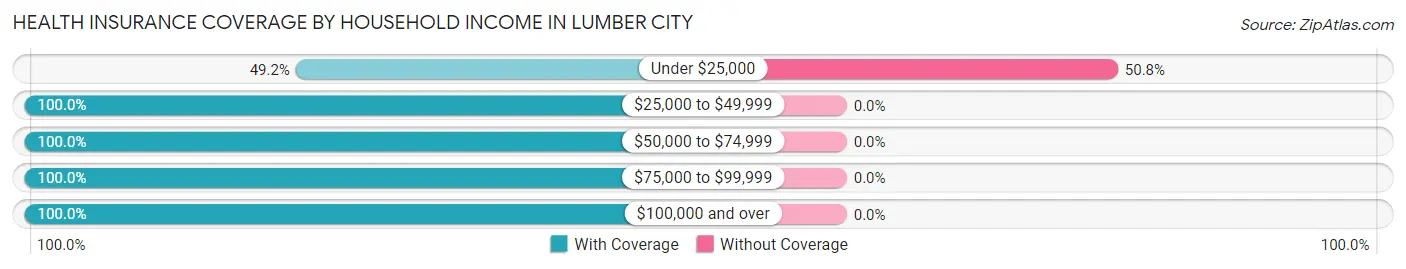
| Household Income | With Coverage | Without Coverage |
| Under $25,000 | 31 (49.2%) | 32 (50.8%) |
| $25,000 to $49,999 | 34 (100.0%) | 0 (0.0%) |
| $50,000 to $74,999 | 58 (100.0%) | 0 (0.0%) |
| $75,000 to $99,999 | 17 (100.0%) | 0 (0.0%) |
| $100,000 and over | 80 (100.0%) | 0 (0.0%) |
Public vs Private Health Insurance Coverage by Age in Lumber City
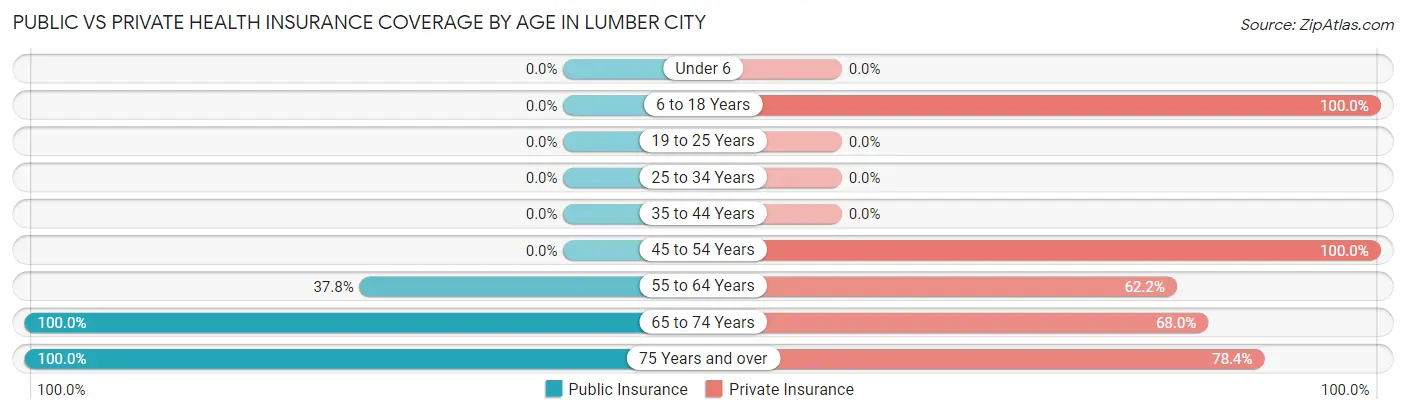
| Age Bracket | Public Insurance | Private Insurance |
| Under 6 | 0 (0.0%) | 0 (0.0%) |
| 6 to 18 Years | 0 (0.0%) | 28 (100.0%) |
| 19 to 25 Years | 0 (0.0%) | 0 (0.0%) |
| 25 to 34 Years | 0 (0.0%) | 0 (0.0%) |
| 35 to 44 Years | 0 (0.0%) | 0 (0.0%) |
| 45 to 54 Years | 0 (0.0%) | 54 (100.0%) |
| 55 to 64 Years | 14 (37.8%) | 23 (62.2%) |
| 65 to 74 Years | 50 (100.0%) | 34 (68.0%) |
| 75 Years and over | 51 (100.0%) | 40 (78.4%) |
| Total | 115 (45.6%) | 179 (71.0%) |
Disability Status by Sex by Age in Lumber City
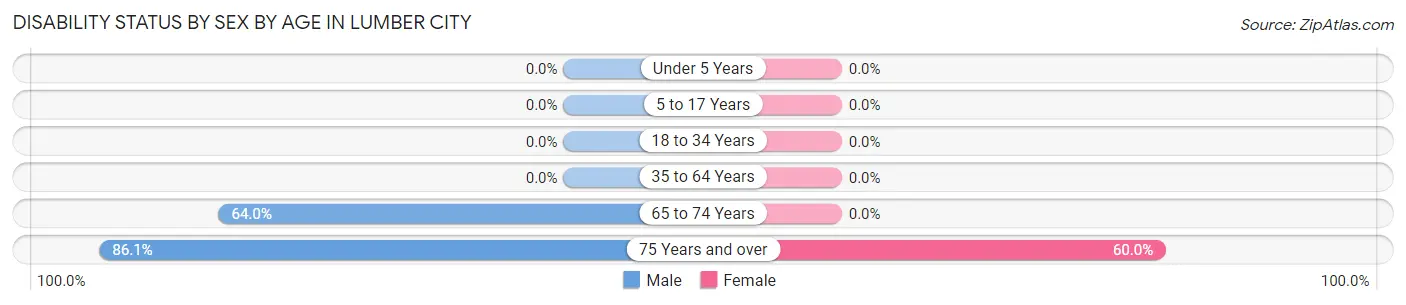
| Age Bracket | Male | Female |
| Under 5 Years | 0 (0.0%) | 0 (0.0%) |
| 5 to 17 Years | 0 (0.0%) | 0 (0.0%) |
| 18 to 34 Years | 0 (0.0%) | 0 (0.0%) |
| 35 to 64 Years | 0 (0.0%) | 0 (0.0%) |
| 65 to 74 Years | 16 (64.0%) | 0 (0.0%) |
| 75 Years and over | 31 (86.1%) | 9 (60.0%) |
Disability Class by Sex by Age in Lumber City
Disability Class: Hearing Difficulty
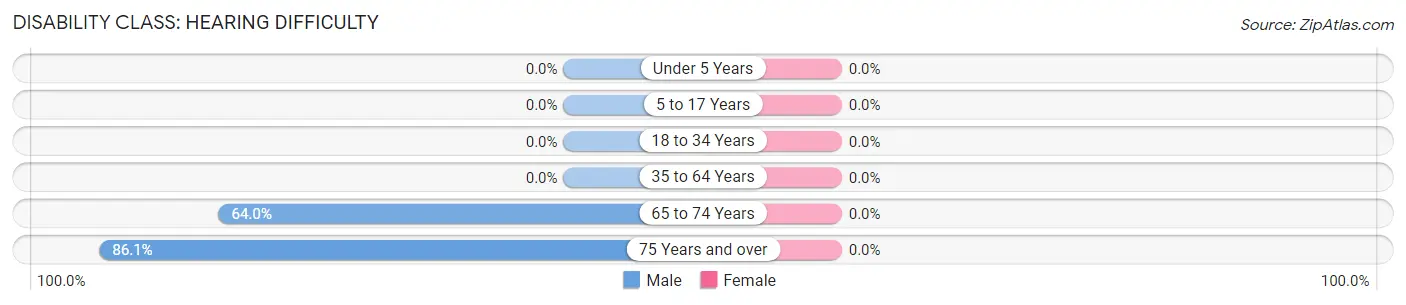
| Age Bracket | Male | Female |
| Under 5 Years | 0 (0.0%) | 0 (0.0%) |
| 5 to 17 Years | 0 (0.0%) | 0 (0.0%) |
| 18 to 34 Years | 0 (0.0%) | 0 (0.0%) |
| 35 to 64 Years | 0 (0.0%) | 0 (0.0%) |
| 65 to 74 Years | 16 (64.0%) | 0 (0.0%) |
| 75 Years and over | 31 (86.1%) | 0 (0.0%) |
Disability Class: Vision Difficulty
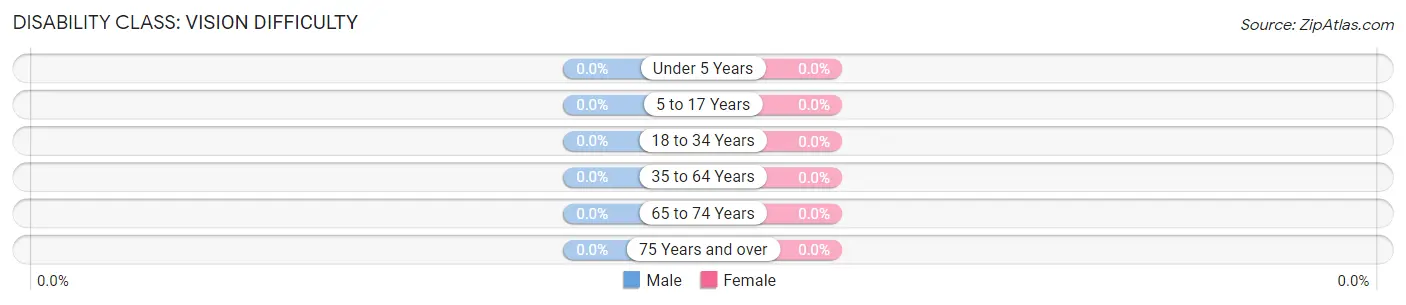
| Age Bracket | Male | Female |
| Under 5 Years | 0 (0.0%) | 0 (0.0%) |
| 5 to 17 Years | 0 (0.0%) | 0 (0.0%) |
| 18 to 34 Years | 0 (0.0%) | 0 (0.0%) |
| 35 to 64 Years | 0 (0.0%) | 0 (0.0%) |
| 65 to 74 Years | 0 (0.0%) | 0 (0.0%) |
| 75 Years and over | 0 (0.0%) | 0 (0.0%) |
Disability Class: Cognitive Difficulty
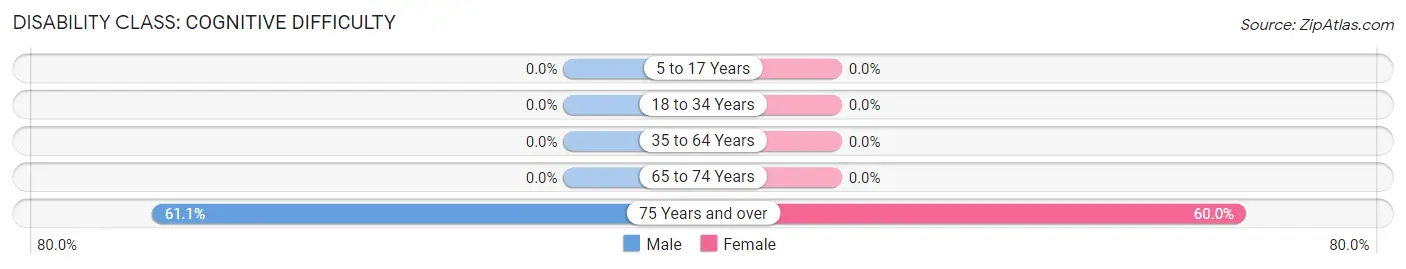
| Age Bracket | Male | Female |
| 5 to 17 Years | 0 (0.0%) | 0 (0.0%) |
| 18 to 34 Years | 0 (0.0%) | 0 (0.0%) |
| 35 to 64 Years | 0 (0.0%) | 0 (0.0%) |
| 65 to 74 Years | 0 (0.0%) | 0 (0.0%) |
| 75 Years and over | 22 (61.1%) | 9 (60.0%) |
Disability Class: Ambulatory Difficulty
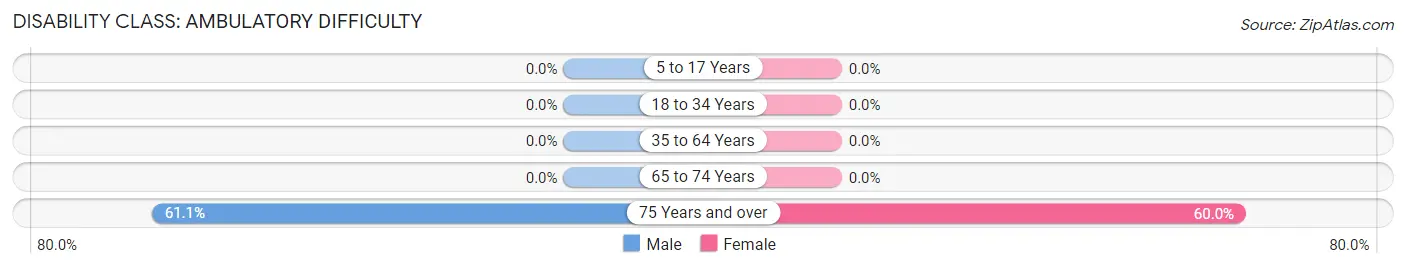
| Age Bracket | Male | Female |
| 5 to 17 Years | 0 (0.0%) | 0 (0.0%) |
| 18 to 34 Years | 0 (0.0%) | 0 (0.0%) |
| 35 to 64 Years | 0 (0.0%) | 0 (0.0%) |
| 65 to 74 Years | 0 (0.0%) | 0 (0.0%) |
| 75 Years and over | 22 (61.1%) | 9 (60.0%) |
Disability Class: Self-Care Difficulty
| Age Bracket | Male | Female |
| 5 to 17 Years | 0 (0.0%) | 0 (0.0%) |
| 18 to 34 Years | 0 (0.0%) | 0 (0.0%) |
| 35 to 64 Years | 0 (0.0%) | 0 (0.0%) |
| 65 to 74 Years | 0 (0.0%) | 0 (0.0%) |
| 75 Years and over | 0 (0.0%) | 0 (0.0%) |
Technology Access in Lumber City
Computing Device Access in Lumber City
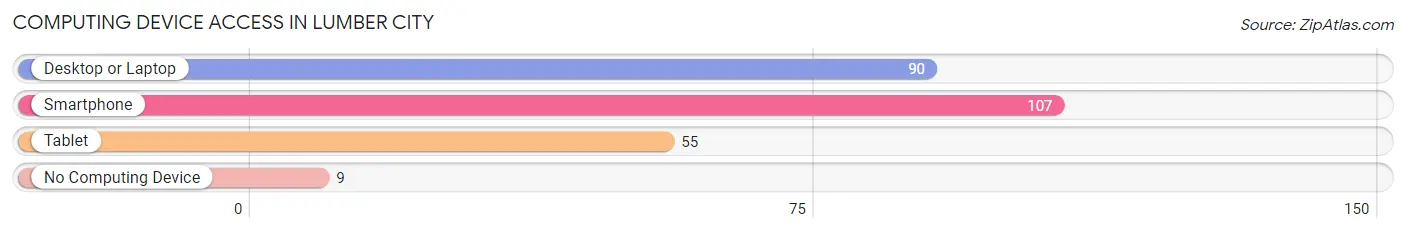
| Device Type | # Households | % Households |
| Desktop or Laptop | 90 | 72.6% |
| Smartphone | 107 | 86.3% |
| Tablet | 55 | 44.4% |
| No Computing Device | 9 | 7.3% |
| Total | 124 | 100.0% |
Internet Access in Lumber City
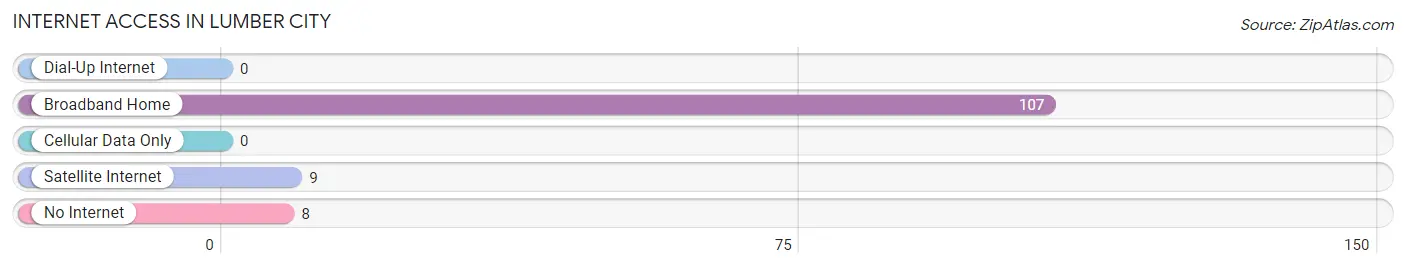
| Internet Type | # Households | % Households |
| Dial-Up Internet | 0 | 0.0% |
| Broadband Home | 107 | 86.3% |
| Cellular Data Only | 0 | 0.0% |
| Satellite Internet | 9 | 7.3% |
| No Internet | 8 | 6.5% |
| Total | 124 | 100.0% |
Lumber City Summary
Lumber City, Pennsylvania is a small borough located in Clearfield County, Pennsylvania. It is situated in the foothills of the Allegheny Mountains, approximately 30 miles east of the city of Altoona. The population of Lumber City was 1,093 at the 2010 census.
History
Lumber City was founded in 1872 by a group of lumbermen from the nearby town of Clearfield. The lumbermen were looking for a place to build a sawmill and the area around Lumber City was ideal for the purpose. The sawmill was built and the town quickly grew around it. The town was originally known as "Lumber City" due to the abundance of lumber in the area.
The town was incorporated in 1876 and the first mayor was elected in 1877. The town quickly grew and by the early 1900s, it had become a bustling community with a variety of businesses, including a hotel, a bank, a post office, and several stores.
The town was also home to a number of churches, including the First Presbyterian Church, which was founded in 1877. The church is still active today and is the oldest church in Lumber City.
Geography
Lumber City is located in Clearfield County, Pennsylvania. It is situated in the foothills of the Allegheny Mountains, approximately 30 miles east of the city of Altoona. The town is located along the West Branch Susquehanna River and is surrounded by forests and rolling hills.
The climate in Lumber City is humid continental, with cold winters and hot, humid summers. The average annual temperature is around 50 degrees Fahrenheit.
Economy
The economy of Lumber City is largely based on the lumber industry. The town is home to several sawmills and lumber yards, as well as a number of other businesses related to the lumber industry.
In addition to the lumber industry, Lumber City is also home to a number of other businesses, including a grocery store, a hardware store, a pharmacy, and several restaurants.
Demographics
As of the 2010 census, the population of Lumber City was 1,093. The racial makeup of the town was 97.3% White, 0.7% African American, 0.2% Native American, 0.2% Asian, and 1.6% from two or more races.
The median household income in Lumber City was $35,625, and the median family income was $41,250. The per capita income was $17,845. About 11.3% of the population was below the poverty line.
Conclusion
Lumber City, Pennsylvania is a small borough located in Clearfield County, Pennsylvania. It is situated in the foothills of the Allegheny Mountains, approximately 30 miles east of the city of Altoona. The population of Lumber City was 1,093 at the 2010 census. The economy of Lumber City is largely based on the lumber industry, and the town is home to several sawmills and lumber yards, as well as a number of other businesses related to the lumber industry. The racial makeup of the town was 97.3% White, 0.7% African American, 0.2% Native American, 0.2% Asian, and 1.6% from two or more races. The median household income in Lumber City was $35,625, and the median family income was $41,250. The per capita income was $17,845. About 11.3% of the population was below the poverty line.
Common Questions
What is Per Capita Income in Lumber City?
Per Capita income in Lumber City is $38,259.
What is Inequality or Gini Index in Lumber City?
Inequality or Gini Index in Lumber City is 0.50.
What is the Total Population of Lumber City?
Total Population of Lumber City is 252.
What is the Total Male Population of Lumber City?
Total Male Population of Lumber City is 164.
What is the Total Female Population of Lumber City?
Total Female Population of Lumber City is 88.
What is the Ratio of Males per 100 Females in Lumber City?
There are 186.36 Males per 100 Females in Lumber City.
What is the Ratio of Females per 100 Males in Lumber City?
There are 53.66 Females per 100 Males in Lumber City.
What is the Median Population Age in Lumber City?
Median Population Age in Lumber City is 56.9 Years.
What is the Average Family Size in Lumber City
Average Family Size in Lumber City is 2.3 People.
What is the Average Household Size in Lumber City
Average Household Size in Lumber City is 2.0 People.
How Large is the Labor Force in Lumber City?
There are 109 People in the Labor Forcein in Lumber City.
What is the Percentage of People in the Labor Force in Lumber City?
43.3% of People are in the Labor Force in Lumber City.
What is the Unemployment Rate in Lumber City?
Unemployment Rate in Lumber City is 29.4%.