Cities with the Highest Percentage of Population Employed in Administrative & Support Services in the United States
RELATED REPORTS & OPTIONS
Administrative & Support Services
United States
Compare Cities
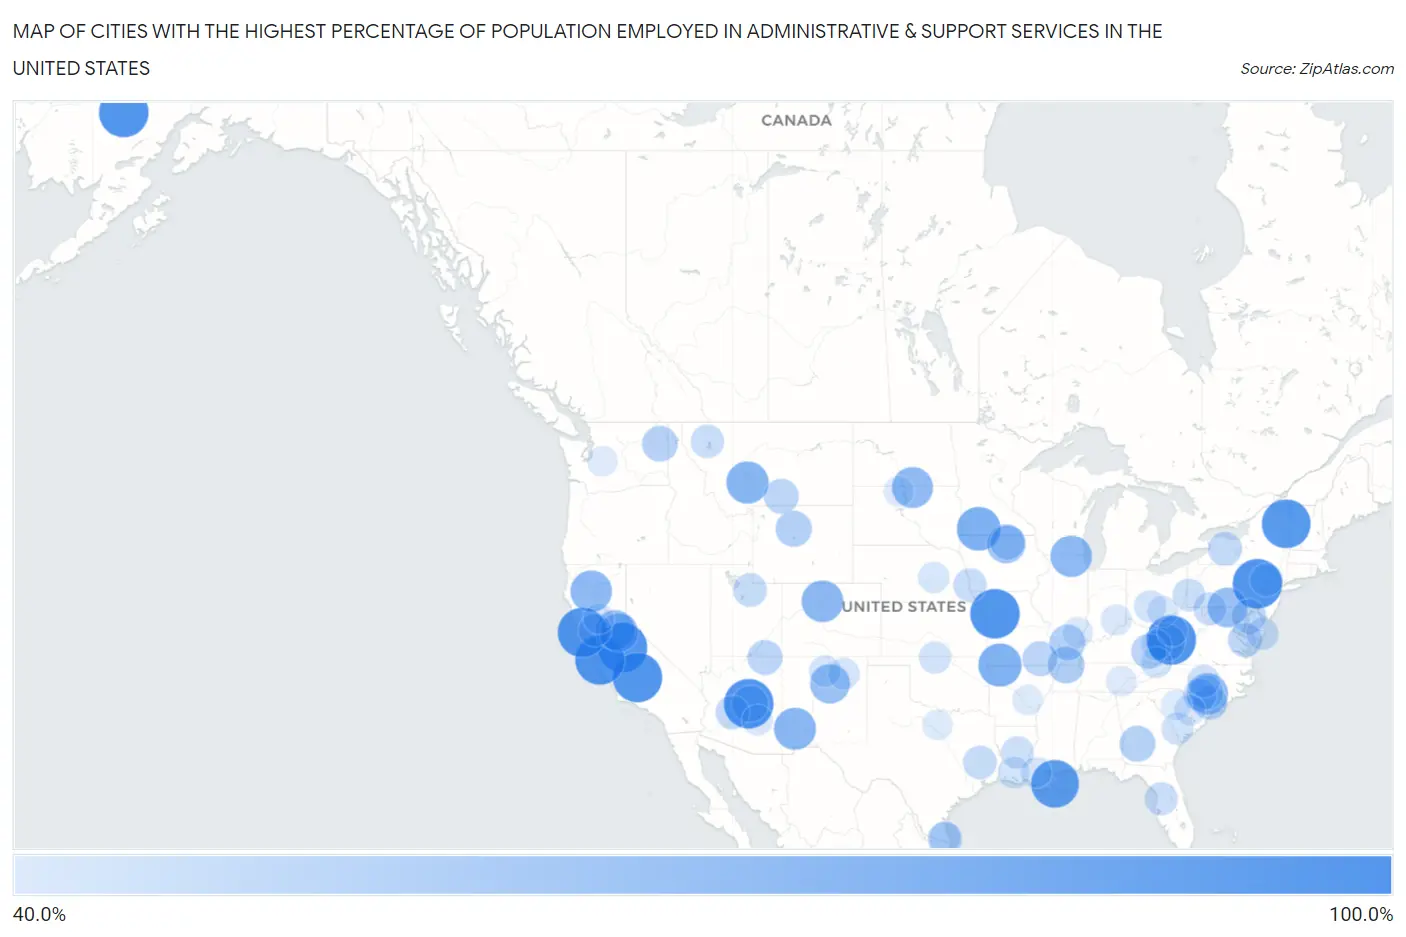
Map of Cities with the Highest Percentage of Population Employed in Administrative & Support Services in the United States
0.0%
100.0%
Cities with the Highest Percentage of Population Employed in Administrative & Support Services in the United States
| City | % Employed | vs State | vs National | |
| 1. | Rayville | 100.0% | 3.6%(+96.4)#1 | 4.1%(+95.9)#1 |
| 2. | Albrightsville | 100.0% | 3.6%(+96.4)#1 | 4.1%(+95.9)#2 |
| 3. | Huron | 100.0% | 3.5%(+96.5)#1 | 4.1%(+95.9)#3 |
| 4. | Twilight | 100.0% | 3.4%(+96.6)#1 | 4.1%(+95.9)#4 |
| 5. | Mt. Bullion | 100.0% | 4.6%(+95.4)#1 | 4.1%(+95.9)#5 |
| 6. | Flowing Springs | 100.0% | 5.4%(+94.6)#1 | 4.1%(+95.9)#6 |
| 7. | Hornitos | 100.0% | 4.6%(+95.4)#2 | 4.1%(+95.9)#7 |
| 8. | Rodriguez Camp | 100.0% | 4.6%(+95.4)#3 | 4.1%(+95.9)#8 |
| 9. | Lime Village | 100.0% | 3.0%(+97.0)#1 | 4.1%(+95.9)#9 |
| 10. | Moss Landing | 100.0% | 4.6%(+95.4)#4 | 4.1%(+95.9)#10 |
| 11. | Salmon Creek | 100.0% | 4.6%(+95.4)#5 | 4.1%(+95.9)#11 |
| 12. | Witherbee | 97.4% | 3.7%(+93.7)#1 | 4.1%(+93.3)#12 |
| 13. | Pointe A La Hache | 94.4% | 3.8%(+90.6)#1 | 4.1%(+90.2)#13 |
| 14. | Wilder | 81.8% | 3.0%(+78.8)#1 | 4.1%(+77.7)#14 |
| 15. | Chain O Lakes | 80.4% | 3.6%(+76.8)#2 | 4.1%(+76.2)#15 |
| 16. | Farlington | 77.5% | 3.2%(+74.3)#1 | 4.1%(+73.4)#16 |
| 17. | Toston | 77.1% | 3.3%(+73.9)#1 | 4.1%(+73.0)#17 |
| 18. | Hanover | 76.5% | 3.9%(+72.5)#1 | 4.1%(+72.3)#18 |
| 19. | Parshall | 75.5% | 4.1%(+71.4)#1 | 4.1%(+71.3)#19 |
| 20. | Chemung | 75.0% | 4.0%(+71.0)#1 | 4.1%(+70.9)#20 |
| 21. | Keswick | 75.0% | 4.6%(+70.4)#6 | 4.1%(+70.9)#21 |
| 22. | Lumber Bridge | 73.9% | 4.3%(+69.6)#1 | 4.1%(+69.8)#22 |
| 23. | Artas | 73.3% | 2.6%(+70.7)#1 | 4.1%(+69.2)#23 |
| 24. | Fiddletown | 70.0% | 4.6%(+65.4)#7 | 4.1%(+65.9)#24 |
| 25. | Reid | 69.4% | 4.2%(+65.2)#1 | 4.1%(+65.3)#25 |
| 26. | Rowe | 69.3% | 3.9%(+65.4)#2 | 4.1%(+65.2)#26 |
| 27. | Hamorton | 66.7% | 3.6%(+63.1)#2 | 4.1%(+62.5)#27 |
| 28. | Rail Road Flat | 66.7% | 4.6%(+62.1)#8 | 4.1%(+62.5)#28 |
| 29. | Nelagoney | 66.7% | 3.6%(+63.0)#1 | 4.1%(+62.5)#29 |
| 30. | Burchinal | 66.7% | 3.0%(+63.6)#1 | 4.1%(+62.5)#30 |
| 31. | Switzer | 63.3% | 3.4%(+59.9)#2 | 4.1%(+59.2)#31 |
| 32. | Cayce | 60.0% | 4.0%(+56.0)#1 | 4.1%(+55.9)#32 |
| 33. | Freedom Acres | 59.3% | 5.4%(+53.9)#2 | 4.1%(+55.1)#33 |
| 34. | Kirby | 58.3% | 2.4%(+55.9)#1 | 4.1%(+54.2)#34 |
| 35. | De Soto | 58.1% | 4.8%(+53.2)#1 | 4.1%(+53.9)#35 |
| 36. | Farner | 57.5% | 4.4%(+53.1)#1 | 4.1%(+53.4)#36 |
| 37. | Whiteash | 57.4% | 4.0%(+53.4)#2 | 4.1%(+53.3)#37 |
| 38. | Clayton | 57.3% | 3.8%(+53.6)#1 | 4.1%(+53.2)#38 |
| 39. | Hunter | 54.9% | 3.6%(+51.3)#3 | 4.1%(+50.8)#39 |
| 40. | Wedron | 54.7% | 4.0%(+50.6)#3 | 4.1%(+50.5)#40 |
| 41. | Oljato Monument Valley | 54.5% | 5.4%(+49.2)#3 | 4.1%(+50.4)#41 |
| 42. | Boyd | 54.5% | 3.3%(+51.3)#2 | 4.1%(+50.4)#42 |
| 43. | Combs | 54.5% | 4.0%(+50.6)#2 | 4.1%(+50.4)#43 |
| 44. | Evergreen | 53.6% | 4.3%(+49.3)#2 | 4.1%(+49.4)#44 |
| 45. | Georgetown | 53.6% | 4.2%(+49.3)#2 | 4.1%(+49.4)#45 |
| 46. | Portland | 53.3% | 3.0%(+50.3)#2 | 4.1%(+49.2)#46 |
| 47. | Green Valley Farms | 53.0% | 4.4%(+48.6)#1 | 4.1%(+48.8)#47 |
| 48. | Dundarrach | 52.9% | 4.3%(+48.7)#3 | 4.1%(+48.8)#48 |
| 49. | Heathsville | 52.6% | 4.1%(+48.5)#1 | 4.1%(+48.5)#49 |
| 50. | Bogota | 52.5% | 4.4%(+48.2)#2 | 4.1%(+48.4)#50 |
| 51. | Wittmann | 52.0% | 5.4%(+46.6)#4 | 4.1%(+47.8)#51 |
| 52. | Wadsworth | 51.9% | 3.7%(+48.2)#2 | 4.1%(+47.7)#52 |
| 53. | Beaver Dam | 51.9% | 3.5%(+48.3)#2 | 4.1%(+47.7)#53 |
| 54. | Samak | 51.2% | 4.3%(+46.9)#1 | 4.1%(+47.0)#54 |
| 55. | Cedar Point | 50.9% | 4.4%(+46.5)#2 | 4.1%(+46.8)#55 |
| 56. | Somers | 50.0% | 3.3%(+46.7)#3 | 4.1%(+45.9)#56 |
| 57. | Old Hundred | 50.0% | 4.3%(+45.7)#4 | 4.1%(+45.9)#57 |
| 58. | Essary Springs | 50.0% | 4.4%(+45.6)#3 | 4.1%(+45.9)#58 |
| 59. | Reese | 50.0% | 3.6%(+46.4)#3 | 4.1%(+45.9)#59 |
| 60. | Kep'el | 50.0% | 4.6%(+45.4)#9 | 4.1%(+45.9)#60 |
| 61. | Bartlett | 50.0% | 3.0%(+47.0)#3 | 4.1%(+45.9)#61 |
| 62. | Moskowite Corner | 49.4% | 4.6%(+44.8)#10 | 4.1%(+45.2)#62 |
| 63. | Klondike | 49.3% | 4.2%(+45.0)#3 | 4.1%(+45.1)#63 |
| 64. | Lake Lindsey | 49.1% | 5.9%(+43.2)#1 | 4.1%(+44.9)#64 |
| 65. | Frankstown | 48.9% | 3.6%(+45.4)#4 | 4.1%(+44.8)#65 |
| 66. | Pocono Mountain Lake Estates | 48.5% | 3.6%(+44.9)#5 | 4.1%(+44.3)#66 |
| 67. | Goldston | 48.2% | 4.3%(+44.0)#5 | 4.1%(+44.1)#67 |
| 68. | Slovan | 48.1% | 3.6%(+44.6)#6 | 4.1%(+44.0)#68 |
| 69. | Prospect | 47.7% | 3.8%(+44.0)#2 | 4.1%(+43.6)#69 |
| 70. | Midland | 47.3% | 3.5%(+43.8)#3 | 4.1%(+43.1)#70 |
| 71. | Newark | 47.2% | 4.2%(+42.9)#4 | 4.1%(+43.0)#71 |
| 72. | Gifford | 46.5% | 4.8%(+41.7)#1 | 4.1%(+42.4)#72 |
| 73. | Amorita | 46.2% | 3.6%(+42.5)#2 | 4.1%(+42.0)#73 |
| 74. | Orient | 45.8% | 3.7%(+42.1)#1 | 4.1%(+41.7)#74 |
| 75. | Roanoke | 45.5% | 3.8%(+41.7)#3 | 4.1%(+41.3)#75 |
| 76. | Wagon Mound | 45.2% | 3.9%(+41.2)#3 | 4.1%(+41.0)#76 |
| 77. | Kamaili | 45.0% | 4.7%(+40.3)#1 | 4.1%(+40.9)#77 |
| 78. | Canova | 44.9% | 3.9%(+41.0)#4 | 4.1%(+40.8)#78 |
| 79. | Wilburn | 44.7% | 3.4%(+41.3)#1 | 4.1%(+40.6)#79 |
| 80. | Lozano | 44.5% | 4.4%(+40.1)#3 | 4.1%(+40.4)#80 |
| 81. | Clinchport | 44.4% | 4.1%(+40.3)#2 | 4.1%(+40.3)#81 |
| 82. | Cushing | 44.0% | 3.4%(+40.6)#1 | 4.1%(+39.9)#82 |
| 83. | Carbon Hill | 43.5% | 3.7%(+39.8)#2 | 4.1%(+39.3)#83 |
| 84. | Butlerville | 43.2% | 3.5%(+39.7)#4 | 4.1%(+39.1)#84 |
| 85. | East Globe | 43.0% | 5.4%(+37.7)#5 | 4.1%(+38.9)#85 |
| 86. | Bayou Goula | 42.9% | 3.8%(+39.1)#4 | 4.1%(+38.7)#86 |
| 87. | Mulberry | 42.9% | 4.8%(+38.0)#2 | 4.1%(+38.7)#87 |
| 88. | Cottageville | 42.9% | 3.4%(+39.4)#3 | 4.1%(+38.7)#88 |
| 89. | Dwale | 42.9% | 4.0%(+38.9)#3 | 4.1%(+38.7)#89 |
| 90. | Pendroy | 42.9% | 3.3%(+39.6)#4 | 4.1%(+38.7)#90 |
| 91. | Grimes | 42.7% | 4.6%(+38.1)#11 | 4.1%(+38.5)#91 |
| 92. | Golden Gate | 42.1% | 4.0%(+38.1)#4 | 4.1%(+38.0)#92 |
| 93. | Big Chimney | 41.8% | 3.4%(+38.4)#4 | 4.1%(+37.7)#93 |
| 94. | Little Eagle | 41.7% | 2.6%(+39.1)#2 | 4.1%(+37.5)#94 |
| 95. | Allport | 41.7% | 3.4%(+38.2)#2 | 4.1%(+37.5)#95 |
| 96. | Pikeville | 41.6% | 4.4%(+37.3)#4 | 4.1%(+37.5)#96 |
| 97. | Greenwater | 41.4% | 3.8%(+37.7)#2 | 4.1%(+37.3)#97 |
| 98. | Perrin | 41.3% | 4.4%(+36.9)#4 | 4.1%(+37.2)#98 |
| 99. | Rarity Bay | 41.2% | 4.4%(+36.9)#5 | 4.1%(+37.1)#99 |
| 100. | Peak | 41.2% | 4.8%(+36.3)#3 | 4.1%(+37.0)#100 |
Common Questions
What are the Top 10 Cities with the Highest Percentage of Population Employed in Administrative & Support Services in the United States?
Top 10 Cities with the Highest Percentage of Population Employed in Administrative & Support Services in the United States are:
#1
100.0%
#2
100.0%
#3
100.0%
#4
100.0%
#5
100.0%
#6
100.0%
#7
100.0%
#8
100.0%
#9
100.0%
#10
97.4%
What city has the Highest Percentage of Population Employed in Administrative & Support Services in the United States?
Rayville has the Highest Percentage of Population Employed in Administrative & Support Services in the United States with 100.0%.
What is the Percentage of Population Employed in Administrative & Support Services in the United States?
Percentage of Population Employed in Administrative & Support Services in the United States is 4.1%.