Cities with the Highest Percentage of Population Employed in Administrative & Support Services in New Hampshire
RELATED REPORTS & OPTIONS
Administrative & Support Services
New Hampshire
Compare Cities
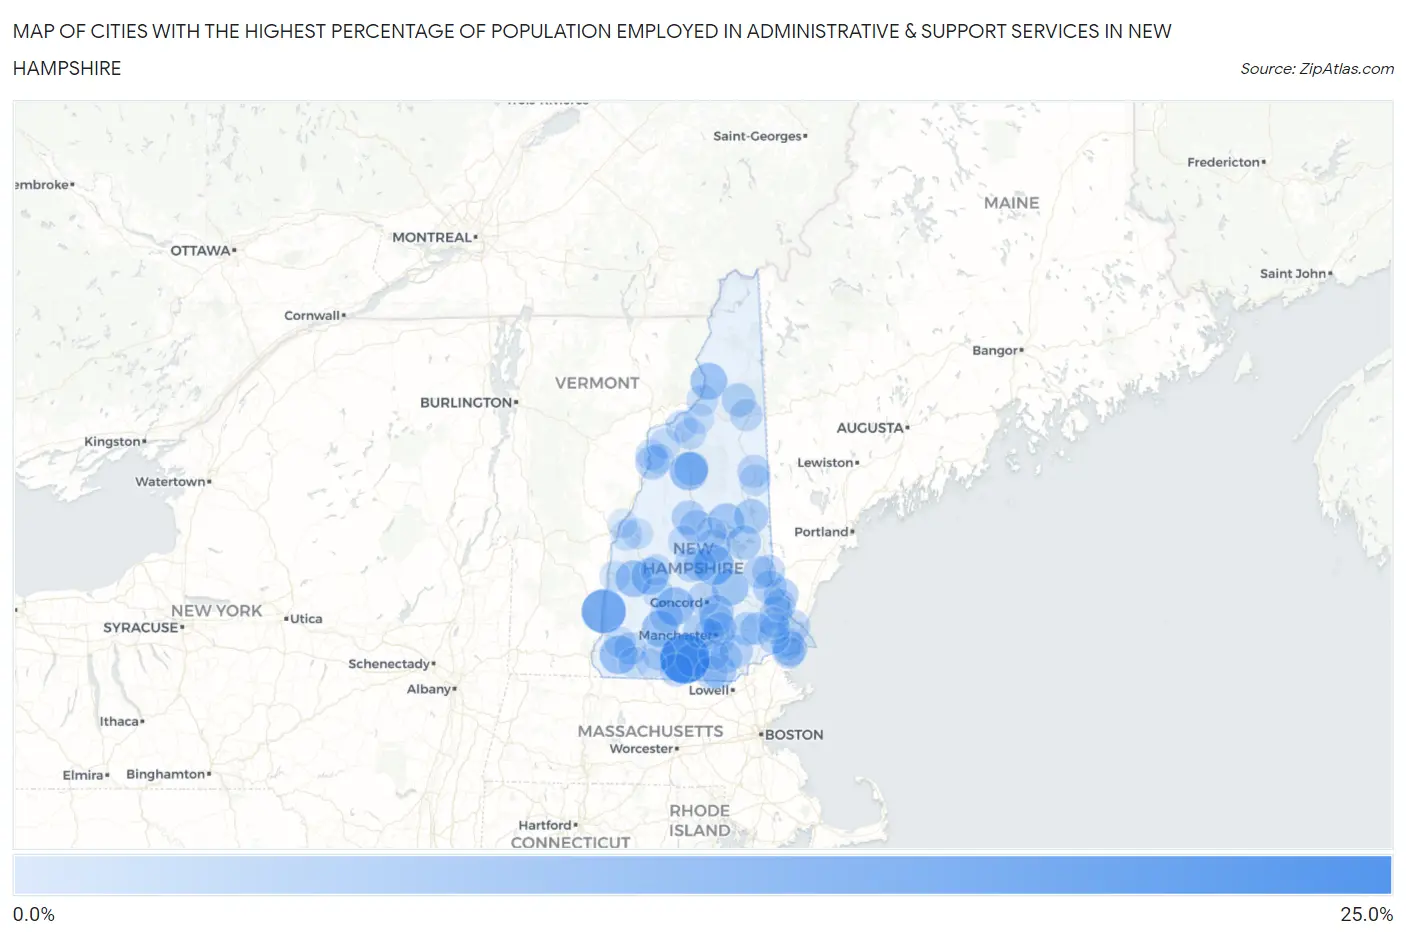
Map of Cities with the Highest Percentage of Population Employed in Administrative & Support Services in New Hampshire
0.0%
25.0%
Cities with the Highest Percentage of Population Employed in Administrative & Support Services in New Hampshire
| City | % Employed | vs State | vs National | |
| 1. | Wilton | 25.0% | 3.7%(+21.3)#1 | 4.1%(+20.8)#293 |
| 2. | North Walpole | 17.8% | 3.7%(+14.1)#2 | 4.1%(+13.6)#556 |
| 3. | Belmont | 12.4% | 3.7%(+8.76)#3 | 4.1%(+8.29)#1,222 |
| 4. | West Swanzey | 10.1% | 3.7%(+6.42)#4 | 4.1%(+5.95)#1,861 |
| 5. | Henniker | 10.0% | 3.7%(+6.36)#5 | 4.1%(+5.89)#1,883 |
| 6. | North Woodstock | 9.9% | 3.7%(+6.25)#6 | 4.1%(+5.78)#1,941 |
| 7. | Groveton | 8.4% | 3.7%(+4.67)#7 | 4.1%(+4.20)#2,758 |
| 8. | Blodgett Landing | 8.3% | 3.7%(+4.65)#8 | 4.1%(+4.18)#2,796 |
| 9. | Newport | 8.2% | 3.7%(+4.53)#9 | 4.1%(+4.06)#2,867 |
| 10. | Pittsfield | 8.1% | 3.7%(+4.38)#10 | 4.1%(+3.91)#2,949 |
| 11. | Antrim | 7.8% | 3.7%(+4.15)#11 | 4.1%(+3.68)#3,124 |
| 12. | Suissevale | 7.5% | 3.7%(+3.82)#12 | 4.1%(+3.35)#3,395 |
| 13. | Suncook | 6.2% | 3.7%(+2.51)#13 | 4.1%(+2.03)#4,861 |
| 14. | Hudson | 5.9% | 3.7%(+2.17)#14 | 4.1%(+1.70)#5,380 |
| 15. | Center Ossipee | 5.8% | 3.7%(+2.14)#15 | 4.1%(+1.67)#5,422 |
| 16. | Hampton Beach | 5.6% | 3.7%(+1.94)#16 | 4.1%(+1.47)#5,755 |
| 17. | Wolfeboro | 5.6% | 3.7%(+1.91)#17 | 4.1%(+1.44)#5,819 |
| 18. | Somersworth | 5.5% | 3.7%(+1.80)#18 | 4.1%(+1.33)#6,037 |
| 19. | Lincoln | 5.4% | 3.7%(+1.68)#19 | 4.1%(+1.21)#6,254 |
| 20. | Plymouth | 5.2% | 3.7%(+1.49)#20 | 4.1%(+1.02)#6,671 |
| 21. | Manchester | 5.1% | 3.7%(+1.44)#21 | 4.1%(+0.970)#6,774 |
| 22. | North Haverhill | 5.0% | 3.7%(+1.27)#22 | 4.1%(+0.801)#7,161 |
| 23. | Milford | 4.9% | 3.7%(+1.18)#23 | 4.1%(+0.713)#7,379 |
| 24. | Franklin | 4.8% | 3.7%(+1.08)#24 | 4.1%(+0.605)#7,646 |
| 25. | Laconia | 4.7% | 3.7%(+1.06)#25 | 4.1%(+0.593)#7,670 |
| 26. | Berlin | 4.7% | 3.7%(+0.971)#26 | 4.1%(+0.501)#7,918 |
| 27. | Raymond | 4.6% | 3.7%(+0.960)#27 | 4.1%(+0.490)#7,942 |
| 28. | Goffstown | 4.5% | 3.7%(+0.829)#28 | 4.1%(+0.358)#8,278 |
| 29. | Hooksett | 4.5% | 3.7%(+0.818)#29 | 4.1%(+0.347)#8,309 |
| 30. | Rochester | 4.5% | 3.7%(+0.783)#30 | 4.1%(+0.312)#8,408 |
| 31. | Derry | 4.1% | 3.7%(+0.386)#31 | 4.1%(-0.085)#9,630 |
| 32. | Peterborough | 4.0% | 3.7%(+0.345)#32 | 4.1%(-0.126)#9,767 |
| 33. | Hillsborough | 4.0% | 3.7%(+0.305)#33 | 4.1%(-0.165)#9,912 |
| 34. | South Hooksett | 3.9% | 3.7%(+0.241)#34 | 4.1%(-0.229)#10,121 |
| 35. | Greenville | 3.9% | 3.7%(+0.183)#35 | 4.1%(-0.287)#10,296 |
| 36. | Durham | 3.8% | 3.7%(+0.133)#36 | 4.1%(-0.337)#10,470 |
| 37. | Nashua | 3.8% | 3.7%(+0.091)#37 | 4.1%(-0.380)#10,628 |
| 38. | Ashland | 3.7% | 3.7%(+0.029)#38 | 4.1%(-0.441)#10,832 |
| 39. | Concord | 3.6% | 3.7%(-0.103)#39 | 4.1%(-0.574)#11,314 |
| 40. | North Conway | 3.6% | 3.7%(-0.114)#40 | 4.1%(-0.584)#11,370 |
| 41. | Portsmouth | 3.5% | 3.7%(-0.144)#41 | 4.1%(-0.614)#11,472 |
| 42. | Milton | 3.5% | 3.7%(-0.186)#42 | 4.1%(-0.656)#11,623 |
| 43. | Tilton Northfield | 3.4% | 3.7%(-0.285)#43 | 4.1%(-0.756)#12,011 |
| 44. | Hampton | 3.4% | 3.7%(-0.315)#44 | 4.1%(-0.785)#12,116 |
| 45. | Farmington | 3.3% | 3.7%(-0.388)#45 | 4.1%(-0.858)#12,387 |
| 46. | Epping | 3.2% | 3.7%(-0.490)#46 | 4.1%(-0.961)#12,750 |
| 47. | Marlborough | 3.2% | 3.7%(-0.496)#47 | 4.1%(-0.966)#12,769 |
| 48. | Gorham | 3.1% | 3.7%(-0.569)#48 | 4.1%(-1.04)#13,024 |
| 49. | Seabrook Beach | 3.0% | 3.7%(-0.724)#49 | 4.1%(-1.19)#13,621 |
| 50. | Exeter | 2.8% | 3.7%(-0.919)#50 | 4.1%(-1.39)#14,388 |
| 51. | Londonderry | 2.8% | 3.7%(-0.925)#51 | 4.1%(-1.40)#14,409 |
| 52. | Dover | 2.5% | 3.7%(-1.15)#52 | 4.1%(-1.62)#15,315 |
| 53. | Lancaster | 2.3% | 3.7%(-1.42)#53 | 4.1%(-1.89)#16,334 |
| 54. | Littleton | 2.2% | 3.7%(-1.49)#54 | 4.1%(-1.96)#16,610 |
| 55. | Bethlehem | 2.2% | 3.7%(-1.49)#55 | 4.1%(-1.96)#16,630 |
| 56. | Woodsville | 2.1% | 3.7%(-1.58)#56 | 4.1%(-2.05)#16,969 |
| 57. | Bristol | 2.0% | 3.7%(-1.63)#57 | 4.1%(-2.10)#17,161 |
| 58. | Conway | 2.0% | 3.7%(-1.65)#58 | 4.1%(-2.12)#17,203 |
| 59. | Keene | 1.9% | 3.7%(-1.78)#59 | 4.1%(-2.25)#17,693 |
| 60. | Lebanon | 1.8% | 3.7%(-1.89)#60 | 4.1%(-2.36)#18,121 |
| 61. | Newfields | 1.8% | 3.7%(-1.93)#61 | 4.1%(-2.40)#18,248 |
| 62. | New London | 1.6% | 3.7%(-2.10)#62 | 4.1%(-2.58)#18,871 |
| 63. | Claremont | 1.5% | 3.7%(-2.16)#63 | 4.1%(-2.63)#19,096 |
| 64. | Newmarket | 1.5% | 3.7%(-2.21)#64 | 4.1%(-2.68)#19,264 |
| 65. | Bradford | 1.3% | 3.7%(-2.40)#65 | 4.1%(-2.87)#19,886 |
| 66. | Lisbon | 1.2% | 3.7%(-2.46)#66 | 4.1%(-2.93)#20,079 |
| 67. | Enfield | 1.1% | 3.7%(-2.55)#67 | 4.1%(-3.02)#20,358 |
| 68. | Whitefield | 1.1% | 3.7%(-2.63)#68 | 4.1%(-3.10)#20,575 |
| 69. | Mountain Lakes | 1.0% | 3.7%(-2.67)#69 | 4.1%(-3.14)#20,710 |
| 70. | Troy | 0.96% | 3.7%(-2.72)#70 | 4.1%(-3.19)#20,884 |
| 71. | Meredith | 0.94% | 3.7%(-2.74)#71 | 4.1%(-3.21)#20,926 |
| 72. | Pinardville | 0.91% | 3.7%(-2.77)#72 | 4.1%(-3.24)#20,994 |
| 73. | East Merrimack | 0.46% | 3.7%(-3.22)#73 | 4.1%(-3.69)#22,154 |
| 74. | Hanover | 0.24% | 3.7%(-3.44)#74 | 4.1%(-3.91)#22,435 |
| 75. | Jaffrey | 0.065% | 3.7%(-3.61)#75 | 4.1%(-4.08)#22,495 |
1
Common Questions
What are the Top 10 Cities with the Highest Percentage of Population Employed in Administrative & Support Services in New Hampshire?
Top 10 Cities with the Highest Percentage of Population Employed in Administrative & Support Services in New Hampshire are:
#1
25.0%
#2
17.8%
#3
12.4%
#4
10.1%
#5
10.0%
#6
9.9%
#7
8.4%
#8
8.3%
#9
8.2%
#10
8.1%
What city has the Highest Percentage of Population Employed in Administrative & Support Services in New Hampshire?
Wilton has the Highest Percentage of Population Employed in Administrative & Support Services in New Hampshire with 25.0%.
What is the Percentage of Population Employed in Administrative & Support Services in the State of New Hampshire?
Percentage of Population Employed in Administrative & Support Services in New Hampshire is 3.7%.
What is the Percentage of Population Employed in Administrative & Support Services in the United States?
Percentage of Population Employed in Administrative & Support Services in the United States is 4.1%.