Cities with the Highest Percentage of Population Employed in Administrative & Support Services in West Virginia
RELATED REPORTS & OPTIONS
Administrative & Support Services
West Virginia
Compare Cities
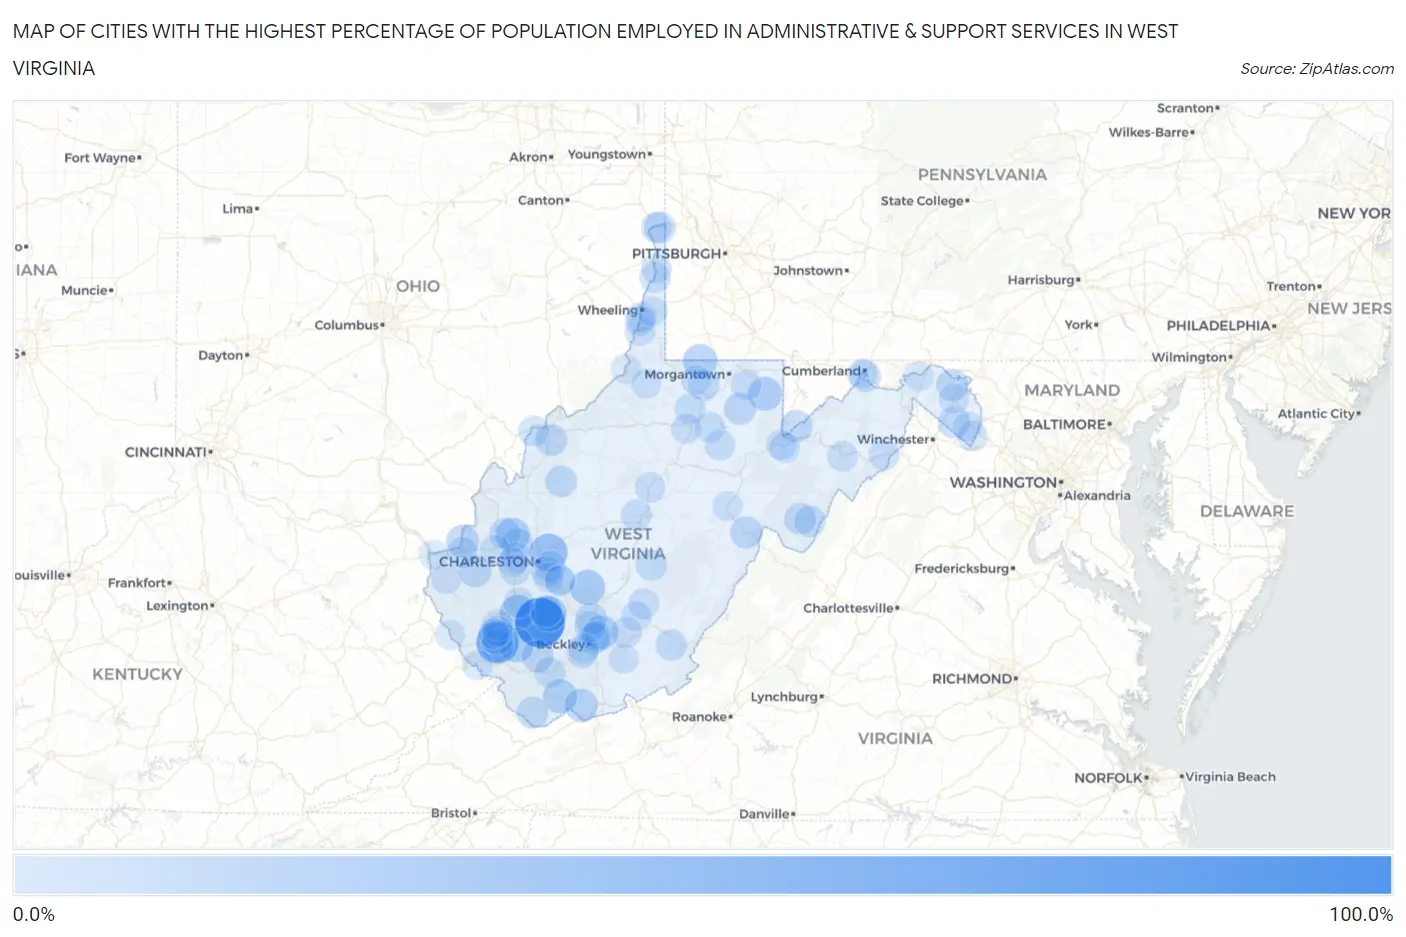
Map of Cities with the Highest Percentage of Population Employed in Administrative & Support Services in West Virginia
0.0%
100.0%
Cities with the Highest Percentage of Population Employed in Administrative & Support Services in West Virginia
| City | % Employed | vs State | vs National | |
| 1. | Twilight | 100.0% | 3.4%(+96.6)#1 | 4.1%(+95.9)#4 |
| 2. | Switzer | 63.3% | 3.4%(+59.9)#2 | 4.1%(+59.2)#31 |
| 3. | Cottageville | 42.9% | 3.4%(+39.4)#3 | 4.1%(+38.7)#88 |
| 4. | Big Chimney | 41.8% | 3.4%(+38.4)#4 | 4.1%(+37.7)#93 |
| 5. | Whitesville | 31.2% | 3.4%(+27.8)#5 | 4.1%(+27.1)#168 |
| 6. | Greenview | 29.0% | 3.4%(+25.6)#6 | 4.1%(+24.8)#206 |
| 7. | Gauley Bridge | 28.6% | 3.4%(+25.1)#7 | 4.1%(+24.4)#214 |
| 8. | Accoville | 25.5% | 3.4%(+22.0)#8 | 4.1%(+21.3)#267 |
| 9. | Hometown | 25.0% | 3.4%(+21.6)#9 | 4.1%(+20.9)#273 |
| 10. | Blacksville | 25.0% | 3.4%(+21.6)#10 | 4.1%(+20.9)#285 |
| 11. | Prince | 23.5% | 3.4%(+20.1)#11 | 4.1%(+19.4)#326 |
| 12. | Albright | 23.2% | 3.4%(+19.7)#12 | 4.1%(+19.0)#336 |
| 13. | Keystone | 22.7% | 3.4%(+19.3)#13 | 4.1%(+18.6)#355 |
| 14. | Montcalm | 19.1% | 3.4%(+15.6)#14 | 4.1%(+14.9)#483 |
| 15. | Lesage | 17.1% | 3.4%(+13.7)#15 | 4.1%(+13.0)#597 |
| 16. | Bayard | 15.4% | 3.4%(+12.0)#16 | 4.1%(+11.2)#753 |
| 17. | West Hamlin | 15.3% | 3.4%(+11.9)#17 | 4.1%(+11.1)#766 |
| 18. | Justice Addition | 14.9% | 3.4%(+11.5)#18 | 4.1%(+10.8)#800 |
| 19. | Frank | 14.9% | 3.4%(+11.5)#19 | 4.1%(+10.7)#811 |
| 20. | Chauncey | 14.8% | 3.4%(+11.4)#20 | 4.1%(+10.7)#823 |
| 21. | Oceana | 14.6% | 3.4%(+11.2)#21 | 4.1%(+10.5)#842 |
| 22. | Hedgesville | 14.6% | 3.4%(+11.2)#22 | 4.1%(+10.5)#847 |
| 23. | Newburg | 14.0% | 3.4%(+10.6)#23 | 4.1%(+9.89)#938 |
| 24. | Gatewood | 13.7% | 3.4%(+10.3)#24 | 4.1%(+9.59)#985 |
| 25. | Mineralwells | 13.5% | 3.4%(+10.0)#25 | 4.1%(+9.31)#1,038 |
| 26. | Rock Cave | 13.5% | 3.4%(+10.0)#26 | 4.1%(+9.31)#1,040 |
| 27. | Middleway | 13.2% | 3.4%(+9.81)#27 | 4.1%(+9.09)#1,073 |
| 28. | Poca | 13.1% | 3.4%(+9.71)#28 | 4.1%(+8.98)#1,093 |
| 29. | Malden | 12.7% | 3.4%(+9.23)#29 | 4.1%(+8.51)#1,183 |
| 30. | Sylvester | 12.5% | 3.4%(+9.08)#30 | 4.1%(+8.35)#1,206 |
| 31. | Wiley Ford | 12.5% | 3.4%(+9.03)#31 | 4.1%(+8.30)#1,221 |
| 32. | War | 12.2% | 3.4%(+8.82)#32 | 4.1%(+8.10)#1,255 |
| 33. | Monaville | 12.1% | 3.4%(+8.72)#33 | 4.1%(+7.99)#1,278 |
| 34. | Reedy | 12.1% | 3.4%(+8.70)#34 | 4.1%(+7.97)#1,284 |
| 35. | Franklin | 12.0% | 3.4%(+8.61)#35 | 4.1%(+7.88)#1,304 |
| 36. | Scarbro | 11.8% | 3.4%(+8.34)#36 | 4.1%(+7.61)#1,362 |
| 37. | Eleanor | 11.2% | 3.4%(+7.76)#37 | 4.1%(+7.03)#1,493 |
| 38. | Chester | 11.2% | 3.4%(+7.76)#38 | 4.1%(+7.03)#1,494 |
| 39. | Grant Town | 11.0% | 3.4%(+7.61)#39 | 4.1%(+6.88)#1,545 |
| 40. | Craigsville | 10.9% | 3.4%(+7.53)#40 | 4.1%(+6.80)#1,567 |
| 41. | Stanaford | 10.9% | 3.4%(+7.49)#41 | 4.1%(+6.76)#1,579 |
| 42. | Sophia | 10.9% | 3.4%(+7.46)#42 | 4.1%(+6.74)#1,586 |
| 43. | Brandywine | 10.7% | 3.4%(+7.24)#43 | 4.1%(+6.52)#1,643 |
| 44. | Fairlea | 10.5% | 3.4%(+7.07)#44 | 4.1%(+6.34)#1,701 |
| 45. | Mitchell Heights | 9.9% | 3.4%(+6.52)#45 | 4.1%(+5.80)#1,934 |
| 46. | Pineville | 9.8% | 3.4%(+6.38)#46 | 4.1%(+5.65)#1,988 |
| 47. | Mount Hope | 9.7% | 3.4%(+6.29)#47 | 4.1%(+5.57)#2,027 |
| 48. | Wellsburg | 9.7% | 3.4%(+6.27)#48 | 4.1%(+5.54)#2,036 |
| 49. | Barboursville | 9.4% | 3.4%(+5.95)#49 | 4.1%(+5.23)#2,181 |
| 50. | Gassaway | 9.2% | 3.4%(+5.82)#50 | 4.1%(+5.09)#2,240 |
| 51. | Piney View | 8.8% | 3.4%(+5.42)#51 | 4.1%(+4.70)#2,469 |
| 52. | Washington | 8.7% | 3.4%(+5.25)#52 | 4.1%(+4.52)#2,574 |
| 53. | Shinnston | 8.6% | 3.4%(+5.16)#53 | 4.1%(+4.43)#2,627 |
| 54. | Coal Fork | 8.6% | 3.4%(+5.16)#54 | 4.1%(+4.43)#2,628 |
| 55. | Quinwood | 8.3% | 3.4%(+4.91)#55 | 4.1%(+4.18)#2,791 |
| 56. | Moorefield | 8.2% | 3.4%(+4.81)#56 | 4.1%(+4.08)#2,845 |
| 57. | Kanawha | 8.2% | 3.4%(+4.79)#57 | 4.1%(+4.06)#2,866 |
| 58. | Newell | 8.2% | 3.4%(+4.76)#58 | 4.1%(+4.04)#2,875 |
| 59. | Meadow Bridge | 8.1% | 3.4%(+4.68)#59 | 4.1%(+3.96)#2,920 |
| 60. | Crab Orchard | 8.0% | 3.4%(+4.53)#60 | 4.1%(+3.81)#3,021 |
| 61. | West Logan | 7.9% | 3.4%(+4.52)#61 | 4.1%(+3.80)#3,028 |
| 62. | Rand | 7.8% | 3.4%(+4.36)#62 | 4.1%(+3.63)#3,158 |
| 63. | Philippi | 7.7% | 3.4%(+4.26)#63 | 4.1%(+3.54)#3,237 |
| 64. | Flemington | 7.5% | 3.4%(+4.10)#64 | 4.1%(+3.38)#3,365 |
| 65. | Hurricane | 7.4% | 3.4%(+3.96)#65 | 4.1%(+3.23)#3,515 |
| 66. | East Bank | 7.4% | 3.4%(+3.95)#66 | 4.1%(+3.23)#3,518 |
| 67. | Mount Gay Shamrock | 7.3% | 3.4%(+3.92)#67 | 4.1%(+3.19)#3,553 |
| 68. | Alum Creek | 7.2% | 3.4%(+3.79)#68 | 4.1%(+3.06)#3,671 |
| 69. | Burnsville | 7.2% | 3.4%(+3.76)#69 | 4.1%(+3.03)#3,700 |
| 70. | Davis | 7.1% | 3.4%(+3.64)#70 | 4.1%(+2.92)#3,828 |
| 71. | Masontown | 7.0% | 3.4%(+3.59)#71 | 4.1%(+2.87)#3,893 |
| 72. | Martinsburg | 6.9% | 3.4%(+3.46)#72 | 4.1%(+2.74)#4,008 |
| 73. | Wardensville | 6.8% | 3.4%(+3.38)#73 | 4.1%(+2.65)#4,094 |
| 74. | Rainelle | 6.5% | 3.4%(+3.11)#74 | 4.1%(+2.38)#4,389 |
| 75. | Wayne | 6.5% | 3.4%(+3.05)#75 | 4.1%(+2.32)#4,470 |
| 76. | St Albans | 6.3% | 3.4%(+2.89)#76 | 4.1%(+2.17)#4,677 |
| 77. | Moundsville | 6.0% | 3.4%(+2.62)#77 | 4.1%(+1.90)#5,059 |
| 78. | Mcmechen | 5.9% | 3.4%(+2.49)#78 | 4.1%(+1.76)#5,287 |
| 79. | Madison | 5.8% | 3.4%(+2.38)#79 | 4.1%(+1.66)#5,448 |
| 80. | Benwood | 5.8% | 3.4%(+2.33)#80 | 4.1%(+1.60)#5,525 |
| 81. | Nutter Fort | 5.7% | 3.4%(+2.25)#81 | 4.1%(+1.52)#5,682 |
| 82. | Shannondale | 5.6% | 3.4%(+2.21)#82 | 4.1%(+1.48)#5,741 |
| 83. | Triadelphia | 5.6% | 3.4%(+2.20)#83 | 4.1%(+1.48)#5,753 |
| 84. | Follansbee | 5.3% | 3.4%(+1.88)#84 | 4.1%(+1.16)#6,380 |
| 85. | Belle | 5.3% | 3.4%(+1.87)#85 | 4.1%(+1.14)#6,412 |
| 86. | Hinton | 5.3% | 3.4%(+1.86)#86 | 4.1%(+1.14)#6,421 |
| 87. | Thomas | 5.3% | 3.4%(+1.84)#87 | 4.1%(+1.11)#6,467 |
| 88. | Fairview | 5.3% | 3.4%(+1.84)#88 | 4.1%(+1.11)#6,478 |
| 89. | Ranson Corporation | 5.2% | 3.4%(+1.73)#89 | 4.1%(+1.01)#6,689 |
| 90. | Cedar Grove | 5.2% | 3.4%(+1.73)#90 | 4.1%(+1.00)#6,697 |
| 91. | Ceredo | 5.1% | 3.4%(+1.67)#91 | 4.1%(+0.939)#6,848 |
| 92. | Pine Grove | 5.1% | 3.4%(+1.64)#92 | 4.1%(+0.913)#6,899 |
| 93. | Matewan | 5.0% | 3.4%(+1.58)#93 | 4.1%(+0.850)#7,050 |
| 94. | Great Cacapon | 5.0% | 3.4%(+1.53)#94 | 4.1%(+0.801)#7,162 |
| 95. | New Martinsville | 4.8% | 3.4%(+1.35)#95 | 4.1%(+0.624)#7,586 |
| 96. | Kermit | 4.8% | 3.4%(+1.34)#96 | 4.1%(+0.612)#7,619 |
| 97. | Mill Creek | 4.7% | 3.4%(+1.25)#97 | 4.1%(+0.526)#7,836 |
| 98. | Carpendale | 4.7% | 3.4%(+1.23)#98 | 4.1%(+0.501)#7,905 |
| 99. | Tornado | 4.6% | 3.4%(+1.14)#99 | 4.1%(+0.415)#8,130 |
| 100. | Charles Town | 4.5% | 3.4%(+1.11)#100 | 4.1%(+0.382)#8,221 |
Common Questions
What are the Top 10 Cities with the Highest Percentage of Population Employed in Administrative & Support Services in West Virginia?
Top 10 Cities with the Highest Percentage of Population Employed in Administrative & Support Services in West Virginia are:
#1
100.0%
#2
63.3%
#3
41.8%
#4
31.2%
#5
29.0%
#6
28.6%
#7
25.5%
#8
25.0%
#9
25.0%
#10
23.5%
What city has the Highest Percentage of Population Employed in Administrative & Support Services in West Virginia?
Twilight has the Highest Percentage of Population Employed in Administrative & Support Services in West Virginia with 100.0%.
What is the Percentage of Population Employed in Administrative & Support Services in the State of West Virginia?
Percentage of Population Employed in Administrative & Support Services in West Virginia is 3.4%.
What is the Percentage of Population Employed in Administrative & Support Services in the United States?
Percentage of Population Employed in Administrative & Support Services in the United States is 4.1%.