Weedville, PA Map & Demographics
Weedville Map
Weedville Overview
$22,523
PER CAPITA INCOME
$64,615
AVG FAMILY INCOME
$58,672
AVG HOUSEHOLD INCOME
52.1%
WAGE / INCOME GAP [ % ]
47.9¢/ $1
WAGE / INCOME GAP [ $ ]
0.37
INEQUALITY / GINI INDEX
652
TOTAL POPULATION
288
MALE POPULATION
364
FEMALE POPULATION
79.12
MALES / 100 FEMALES
126.39
FEMALES / 100 MALES
44.1
MEDIAN AGE
3.4
AVG FAMILY SIZE
3.0
AVG HOUSEHOLD SIZE
263
LABOR FORCE [ PEOPLE ]
51.5%
PERCENT IN LABOR FORCE
13.7%
UNEMPLOYMENT RATE
Weedville Zip Codes
Weedville Area Codes
Income in Weedville
Income Overview in Weedville
Per Capita Income in Weedville is $22,523, while median incomes of families and households are $64,615 and $58,672 respectively.
| Characteristic | Number | Measure |
| Per Capita Income | 652 | $22,523 |
| Median Family Income | 166 | $64,615 |
| Mean Family Income | 166 | $72,898 |
| Median Household Income | 217 | $58,672 |
| Mean Household Income | 217 | $64,545 |
| Income Deficit | 166 | $0 |
| Wage / Income Gap (%) | 652 | 52.06% |
| Wage / Income Gap ($) | 652 | 47.94¢ per $1 |
| Gini / Inequality Index | 652 | 0.37 |
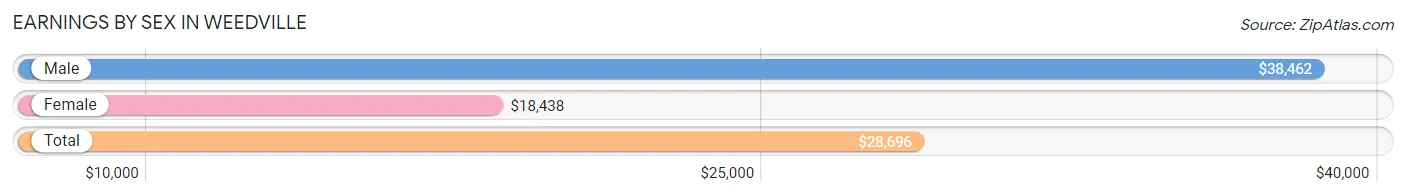
Earnings by Sex in Weedville
Average Earnings in Weedville are $28,696, $38,462 for men and $18,438 for women, a difference of 52.1%.
| Sex | Number | Average Earnings |
| Male | 136 (50.0%) | $38,462 |
| Female | 136 (50.0%) | $18,438 |
| Total | 272 (100.0%) | $28,696 |
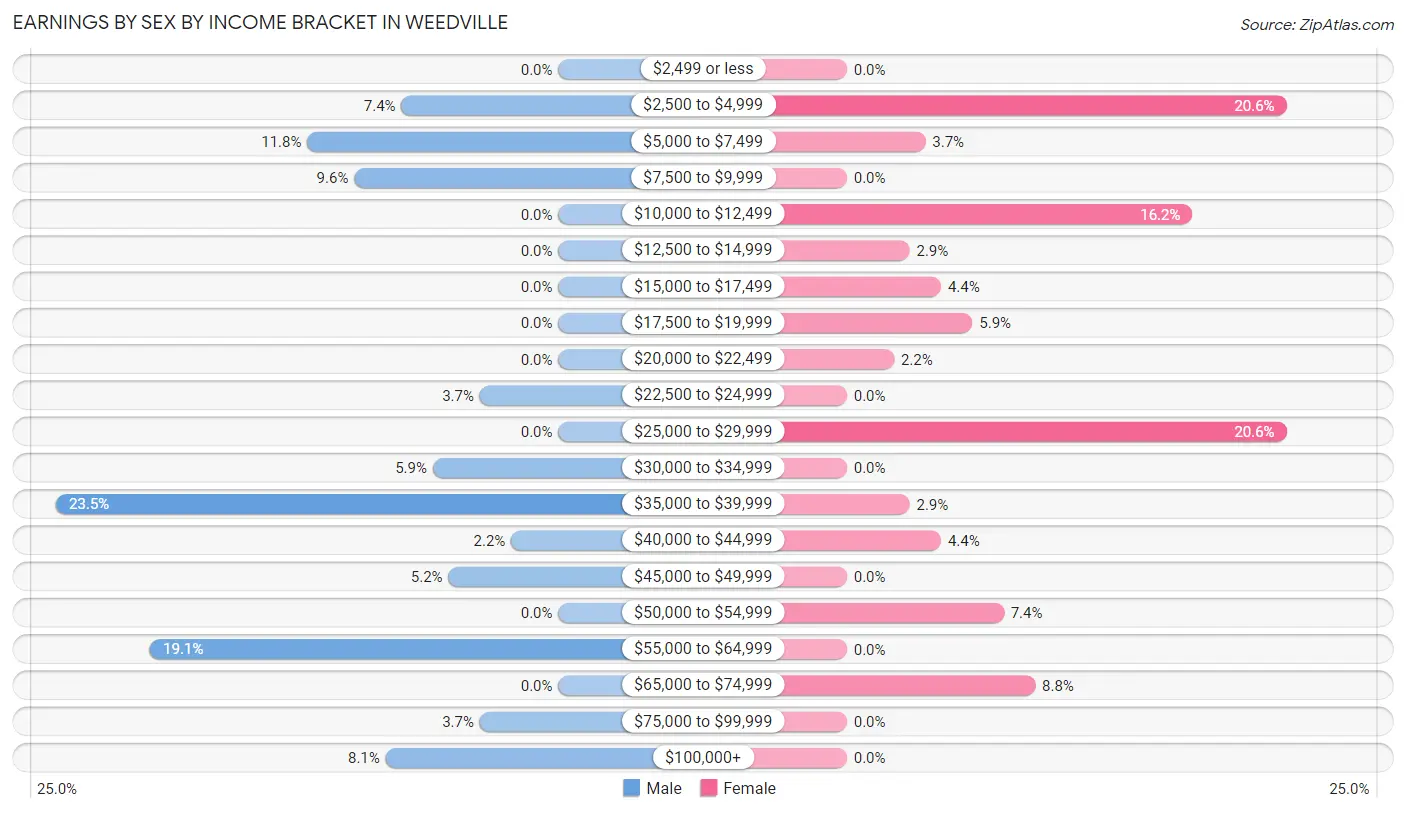
Earnings by Sex by Income Bracket in Weedville
The most common earnings brackets in Weedville are $35,000 to $39,999 for men (32 | 23.5%) and $2,500 to $4,999 for women (28 | 20.6%).
| Income | Male | Female |
| $2,499 or less | 0 (0.0%) | 0 (0.0%) |
| $2,500 to $4,999 | 10 (7.3%) | 28 (20.6%) |
| $5,000 to $7,499 | 16 (11.8%) | 5 (3.7%) |
| $7,500 to $9,999 | 13 (9.6%) | 0 (0.0%) |
| $10,000 to $12,499 | 0 (0.0%) | 22 (16.2%) |
| $12,500 to $14,999 | 0 (0.0%) | 4 (2.9%) |
| $15,000 to $17,499 | 0 (0.0%) | 6 (4.4%) |
| $17,500 to $19,999 | 0 (0.0%) | 8 (5.9%) |
| $20,000 to $22,499 | 0 (0.0%) | 3 (2.2%) |
| $22,500 to $24,999 | 5 (3.7%) | 0 (0.0%) |
| $25,000 to $29,999 | 0 (0.0%) | 28 (20.6%) |
| $30,000 to $34,999 | 8 (5.9%) | 0 (0.0%) |
| $35,000 to $39,999 | 32 (23.5%) | 4 (2.9%) |
| $40,000 to $44,999 | 3 (2.2%) | 6 (4.4%) |
| $45,000 to $49,999 | 7 (5.1%) | 0 (0.0%) |
| $50,000 to $54,999 | 0 (0.0%) | 10 (7.3%) |
| $55,000 to $64,999 | 26 (19.1%) | 0 (0.0%) |
| $65,000 to $74,999 | 0 (0.0%) | 12 (8.8%) |
| $75,000 to $99,999 | 5 (3.7%) | 0 (0.0%) |
| $100,000+ | 11 (8.1%) | 0 (0.0%) |
| Total | 136 (100.0%) | 136 (100.0%) |
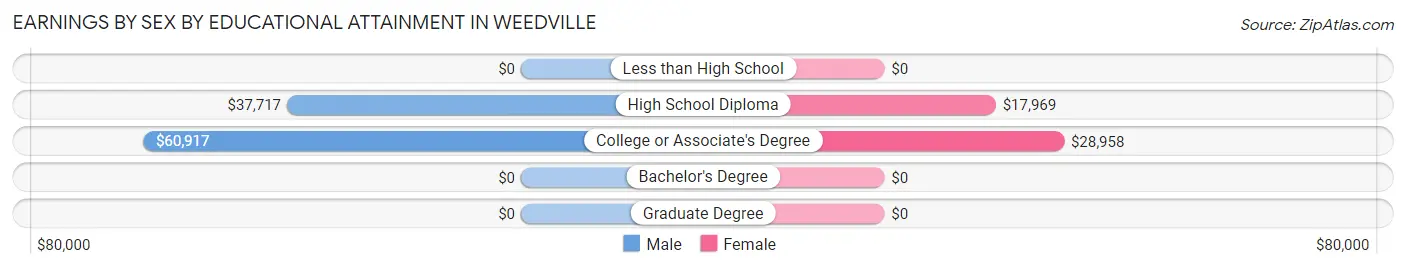
Earnings by Sex by Educational Attainment in Weedville
Average earnings in Weedville are $39,375 for men and $25,500 for women, a difference of 35.2%. Men with an educational attainment of college or associate's degree enjoy the highest average annual earnings of $60,917, while those with high school diploma education earn the least with $37,717. Women with an educational attainment of college or associate's degree earn the most with the average annual earnings of $28,958, while those with high school diploma education have the smallest earnings of $17,969.
| Educational Attainment | Male Income | Female Income |
| Less than High School | - | - |
| High School Diploma | $37,717 | $17,969 |
| College or Associate's Degree | $60,917 | $28,958 |
| Bachelor's Degree | - | - |
| Graduate Degree | - | - |
| Total | $39,375 | $25,500 |
Family Income in Weedville
Family Income Brackets in Weedville
According to the Weedville family income data, there are 72 families falling into the $50,000 to $74,999 income range, which is the most common income bracket and makes up 43.4% of all families.
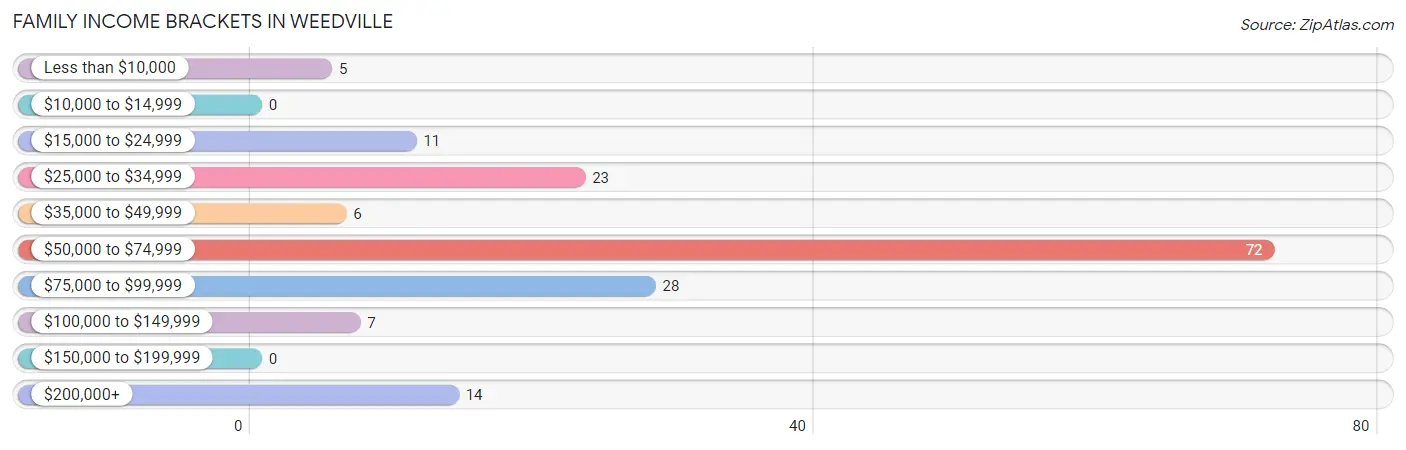
| Income Bracket | # Families | % Families |
| Less than $10,000 | 5 | 3.0% |
| $10,000 to $14,999 | 0 | 0.0% |
| $15,000 to $24,999 | 11 | 6.6% |
| $25,000 to $34,999 | 23 | 13.9% |
| $35,000 to $49,999 | 6 | 3.6% |
| $50,000 to $74,999 | 72 | 43.4% |
| $75,000 to $99,999 | 28 | 16.9% |
| $100,000 to $149,999 | 7 | 4.2% |
| $150,000 to $199,999 | 0 | 0.0% |
| $200,000+ | 14 | 8.4% |
Family Income by Famaliy Size in Weedville
4-person families (36 | 21.7%) account for the highest median family income in Weedville with $66,000 per family, while 2-person families (89 | 53.6%) have the highest median income of $32,260 per family member.
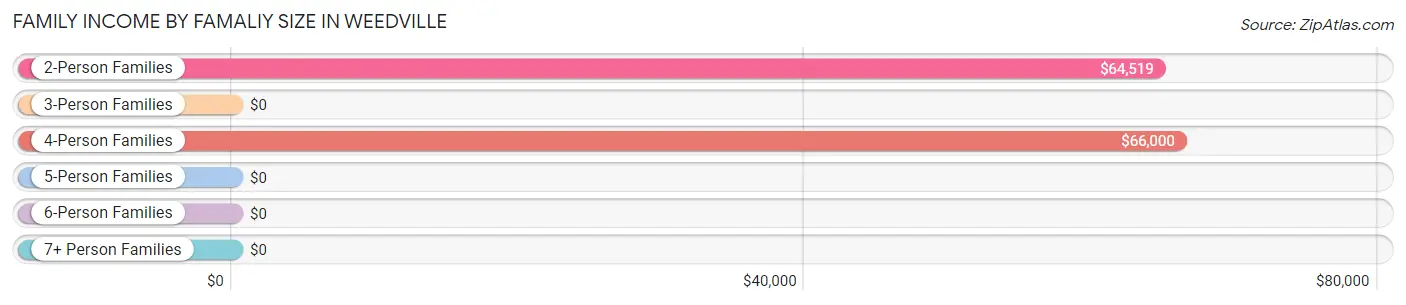
| Income Bracket | # Families | Median Income |
| 2-Person Families | 89 (53.6%) | $64,519 |
| 3-Person Families | 18 (10.8%) | $0 |
| 4-Person Families | 36 (21.7%) | $66,000 |
| 5-Person Families | 17 (10.2%) | $0 |
| 6-Person Families | 6 (3.6%) | $0 |
| 7+ Person Families | 0 (0.0%) | $0 |
| Total | 166 (100.0%) | $64,615 |
Family Income by Number of Earners in Weedville
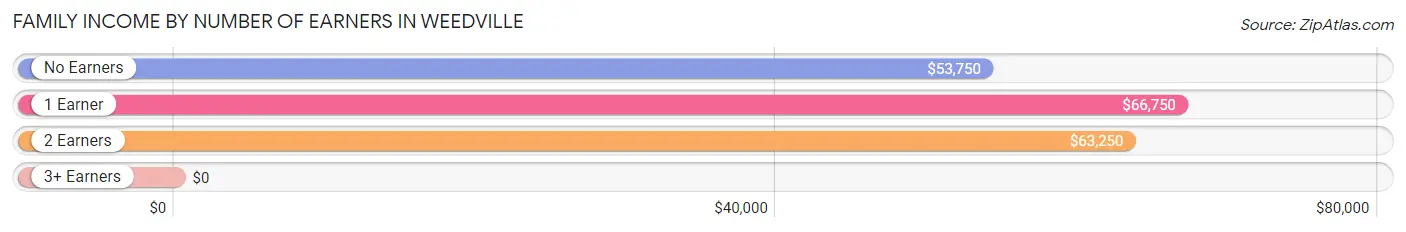
| Number of Earners | # Families | Median Income |
| No Earners | 56 (33.7%) | $53,750 |
| 1 Earner | 35 (21.1%) | $66,750 |
| 2 Earners | 57 (34.3%) | $63,250 |
| 3+ Earners | 18 (10.8%) | $0 |
| Total | 166 (100.0%) | $64,615 |
Household Income in Weedville
Household Income Brackets in Weedville
With 71 households falling in the category, the $50,000 to $74,999 income range is the most frequent in Weedville, accounting for 32.7% of all households.
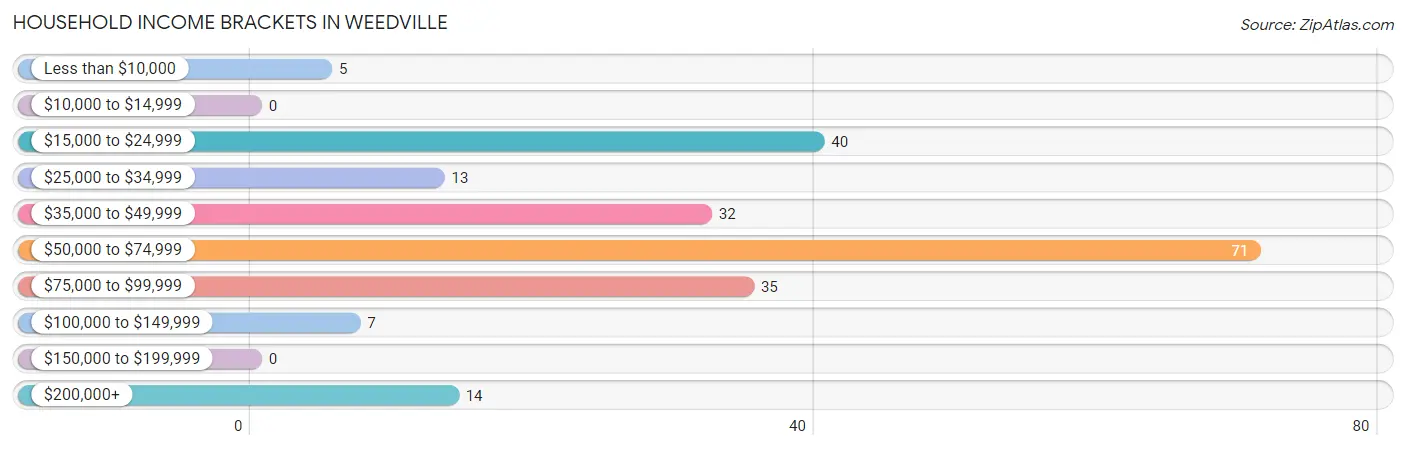
| Income Bracket | # Households | % Households |
| Less than $10,000 | 5 | 2.3% |
| $10,000 to $14,999 | 0 | 0.0% |
| $15,000 to $24,999 | 40 | 18.4% |
| $25,000 to $34,999 | 13 | 6.0% |
| $35,000 to $49,999 | 32 | 14.7% |
| $50,000 to $74,999 | 71 | 32.7% |
| $75,000 to $99,999 | 35 | 16.1% |
| $100,000 to $149,999 | 7 | 3.2% |
| $150,000 to $199,999 | 0 | 0.0% |
| $200,000+ | 14 | 6.5% |
Household Income by Householder Age in Weedville
The median household income in Weedville is $58,672, with the highest median household income of $72,917 found in the 25 to 44 years age bracket for the primary householder. A total of 60 households (27.7%) fall into this category.
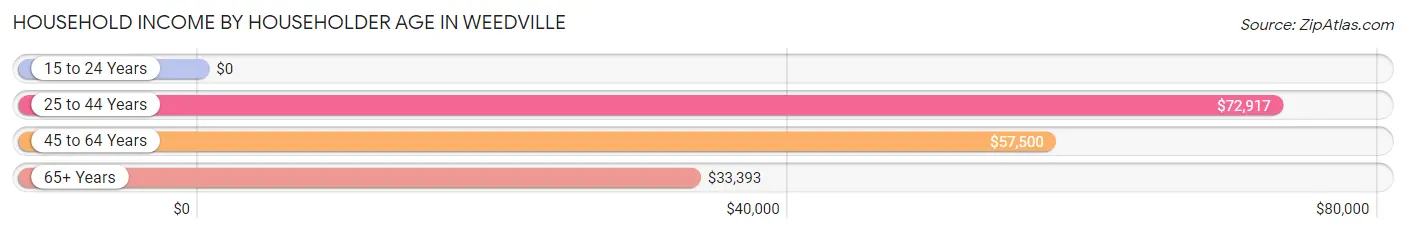
| Income Bracket | # Households | Median Income |
| 15 to 24 Years | 0 (0.0%) | $0 |
| 25 to 44 Years | 60 (27.7%) | $72,917 |
| 45 to 64 Years | 60 (27.7%) | $57,500 |
| 65+ Years | 97 (44.7%) | $33,393 |
| Total | 217 (100.0%) | $58,672 |
Poverty in Weedville
Income Below Poverty by Sex and Age in Weedville
With 19.4% poverty level for males and 21.4% for females among the residents of Weedville, 12 to 14 year old males and 18 to 24 year old females are the most vulnerable to poverty, with 11 males (100.0%) and 28 females (73.7%) in their respective age groups living below the poverty level.
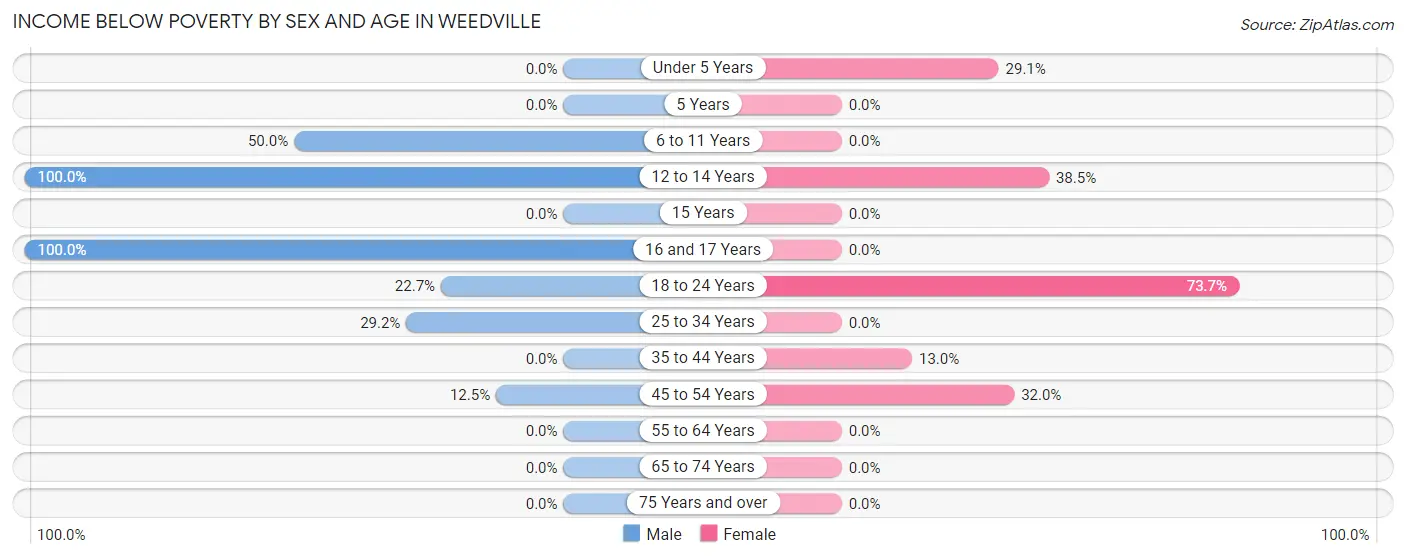
| Age Bracket | Male | Female |
| Under 5 Years | 0 (0.0%) | 23 (29.1%) |
| 5 Years | 0 (0.0%) | 0 (0.0%) |
| 6 to 11 Years | 7 (50.0%) | 0 (0.0%) |
| 12 to 14 Years | 11 (100.0%) | 5 (38.5%) |
| 15 Years | 0 (0.0%) | 0 (0.0%) |
| 16 and 17 Years | 12 (100.0%) | 0 (0.0%) |
| 18 to 24 Years | 10 (22.7%) | 28 (73.7%) |
| 25 to 34 Years | 7 (29.2%) | 0 (0.0%) |
| 35 to 44 Years | 0 (0.0%) | 6 (13.0%) |
| 45 to 54 Years | 9 (12.5%) | 16 (32.0%) |
| 55 to 64 Years | 0 (0.0%) | 0 (0.0%) |
| 65 to 74 Years | 0 (0.0%) | 0 (0.0%) |
| 75 Years and over | 0 (0.0%) | 0 (0.0%) |
| Total | 56 (19.4%) | 78 (21.4%) |
Income Above Poverty by Sex and Age in Weedville
According to the poverty statistics in Weedville, males aged under 5 years and females aged 25 to 34 years are the age groups that are most secure financially, with 100.0% of males and 100.0% of females in these age groups living above the poverty line.
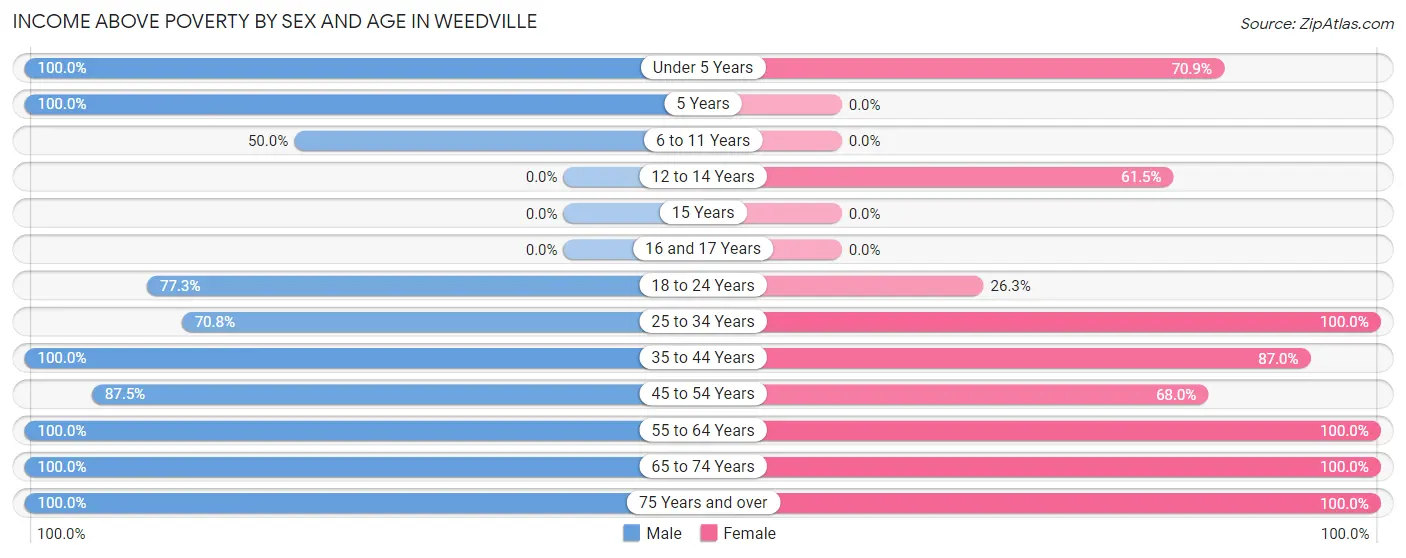
| Age Bracket | Male | Female |
| Under 5 Years | 18 (100.0%) | 56 (70.9%) |
| 5 Years | 6 (100.0%) | 0 (0.0%) |
| 6 to 11 Years | 7 (50.0%) | 0 (0.0%) |
| 12 to 14 Years | 0 (0.0%) | 8 (61.5%) |
| 15 Years | 0 (0.0%) | 0 (0.0%) |
| 16 and 17 Years | 0 (0.0%) | 0 (0.0%) |
| 18 to 24 Years | 34 (77.3%) | 10 (26.3%) |
| 25 to 34 Years | 17 (70.8%) | 15 (100.0%) |
| 35 to 44 Years | 27 (100.0%) | 40 (87.0%) |
| 45 to 54 Years | 63 (87.5%) | 34 (68.0%) |
| 55 to 64 Years | 14 (100.0%) | 18 (100.0%) |
| 65 to 74 Years | 29 (100.0%) | 65 (100.0%) |
| 75 Years and over | 17 (100.0%) | 40 (100.0%) |
| Total | 232 (80.6%) | 286 (78.6%) |
Income Below Poverty Among Married-Couple Families in Weedville
The poverty statistics for married-couple families in Weedville show that 8.7% or 11 of the total 126 families live below the poverty line. Families with 1 or 2 children have the highest poverty rate of 23.4%, comprising of 11 families. On the other hand, families with no children have the lowest poverty rate of 0.0%, which includes 0 families.
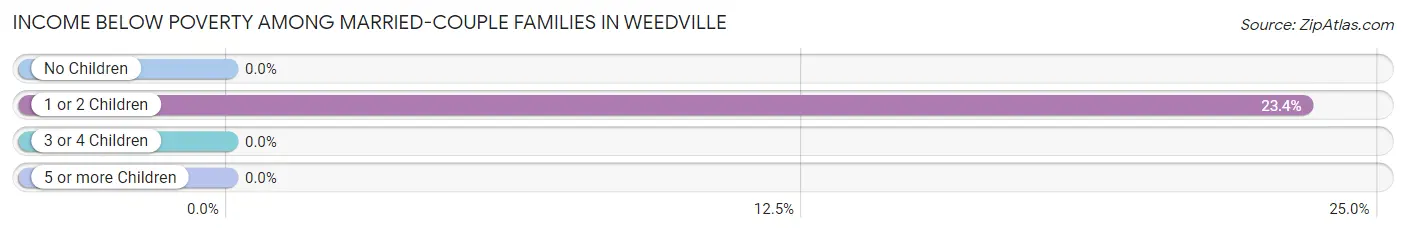
| Children | Above Poverty | Below Poverty |
| No Children | 73 (100.0%) | 0 (0.0%) |
| 1 or 2 Children | 36 (76.6%) | 11 (23.4%) |
| 3 or 4 Children | 6 (100.0%) | 0 (0.0%) |
| 5 or more Children | 0 (0.0%) | 0 (0.0%) |
| Total | 115 (91.3%) | 11 (8.7%) |
Income Below Poverty Among Single-Parent Households in Weedville
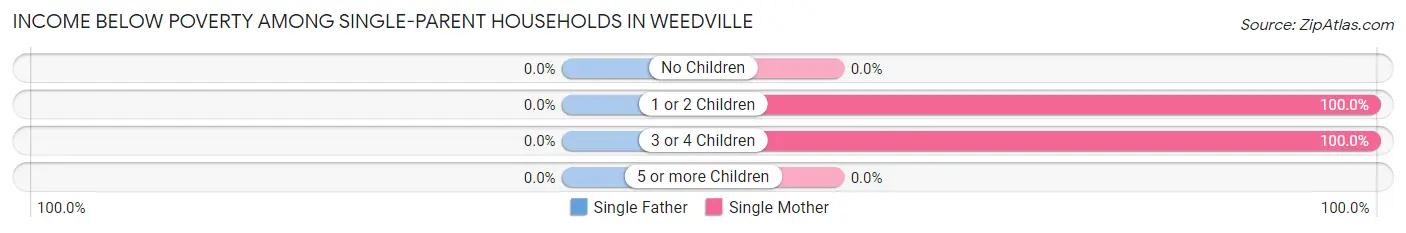
| Children | Single Father | Single Mother |
| No Children | 0 (0.0%) | 0 (0.0%) |
| 1 or 2 Children | 0 (0.0%) | 5 (100.0%) |
| 3 or 4 Children | 0 (0.0%) | 6 (100.0%) |
| 5 or more Children | 0 (0.0%) | 0 (0.0%) |
| Total | 0 (0.0%) | 11 (37.9%) |
Income Below Poverty Among Married-Couple vs Single-Parent Households in Weedville
The poverty data for Weedville shows that 11 of the married-couple family households (8.7%) and 11 of the single-parent households (27.5%) are living below the poverty level. Within the married-couple family households, those with 1 or 2 children have the highest poverty rate, with 11 households (23.4%) falling below the poverty line. Among the single-parent households, those with 1 or 2 children have the highest poverty rate, with 5 household (100.0%) living below poverty.
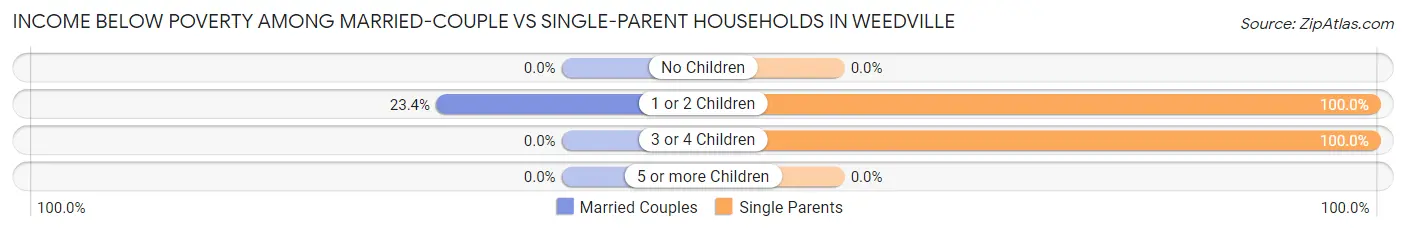
| Children | Married-Couple Families | Single-Parent Households |
| No Children | 0 (0.0%) | 0 (0.0%) |
| 1 or 2 Children | 11 (23.4%) | 5 (100.0%) |
| 3 or 4 Children | 0 (0.0%) | 6 (100.0%) |
| 5 or more Children | 0 (0.0%) | 0 (0.0%) |
| Total | 11 (8.7%) | 11 (27.5%) |
Race in Weedville
The most populous races in Weedville are White / Caucasian (602 | 92.3%), and Two or more Races (50 | 7.7%).
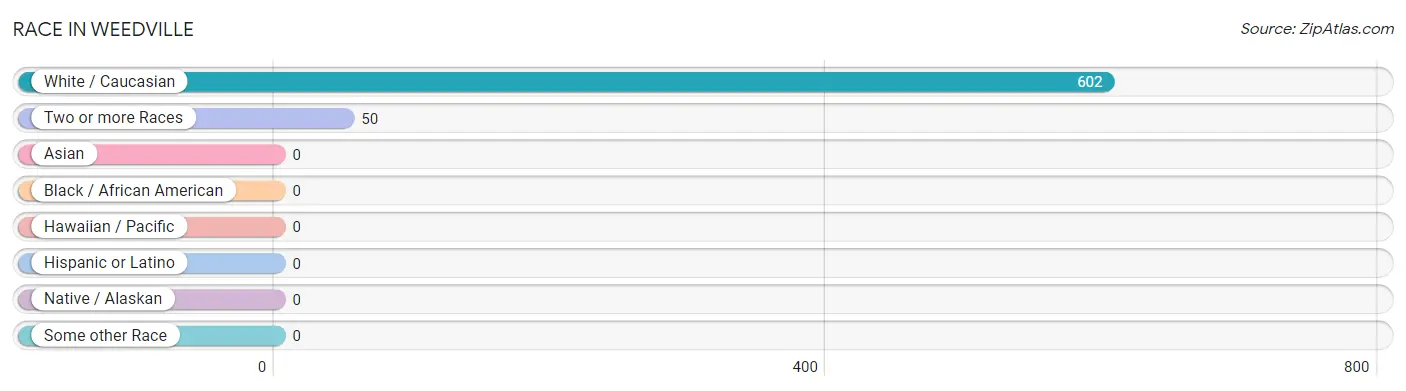
| Race | # Population | % Population |
| Asian | 0 | 0.0% |
| Black / African American | 0 | 0.0% |
| Hawaiian / Pacific | 0 | 0.0% |
| Hispanic or Latino | 0 | 0.0% |
| Native / Alaskan | 0 | 0.0% |
| White / Caucasian | 602 | 92.3% |
| Two or more Races | 50 | 7.7% |
| Some other Race | 0 | 0.0% |
| Total | 652 | 100.0% |
Ancestry in Weedville
The most populous ancestries reported in Weedville are German (232 | 35.6%), Italian (216 | 33.1%), Irish (137 | 21.0%), English (47 | 7.2%), and Polish (47 | 7.2%), together accounting for 104.1% of all Weedville residents.
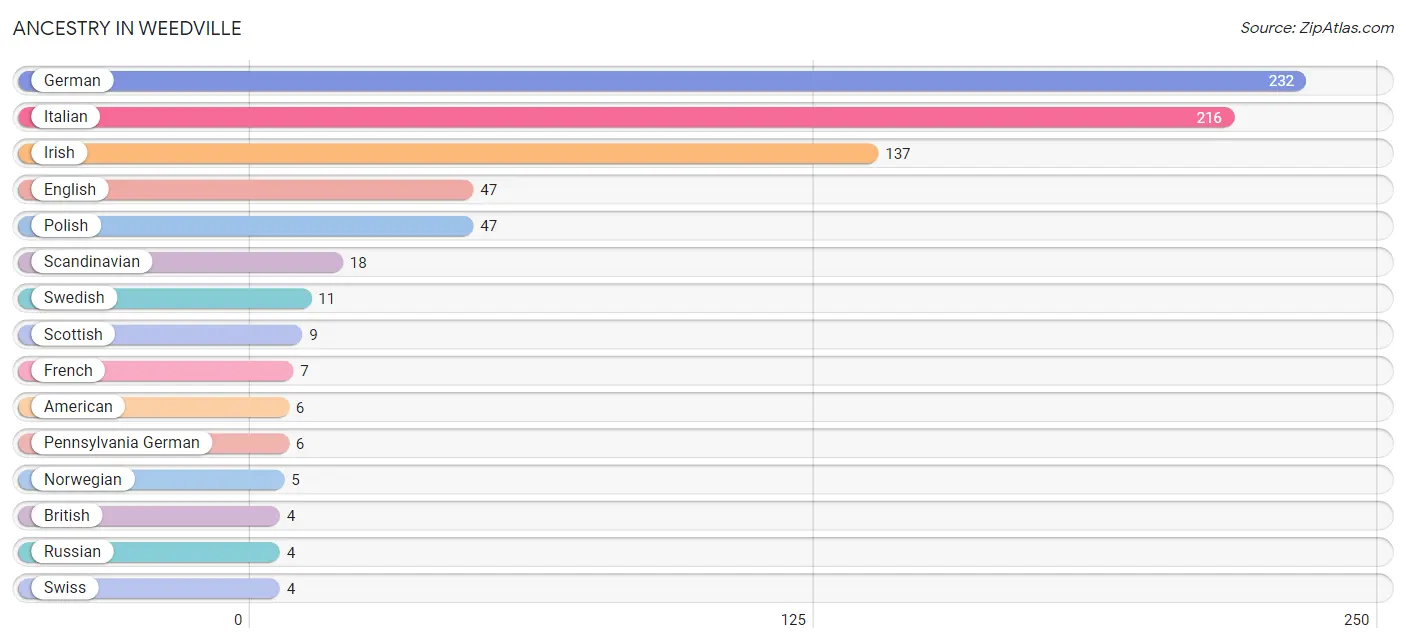
| Ancestry | # Population | % Population |
| American | 6 | 0.9% |
| British | 4 | 0.6% |
| English | 47 | 7.2% |
| French | 7 | 1.1% |
| German | 232 | 35.6% |
| Irish | 137 | 21.0% |
| Italian | 216 | 33.1% |
| Norwegian | 5 | 0.8% |
| Pennsylvania German | 6 | 0.9% |
| Polish | 47 | 7.2% |
| Russian | 4 | 0.6% |
| Scandinavian | 18 | 2.8% |
| Scottish | 9 | 1.4% |
| Swedish | 11 | 1.7% |
| Swiss | 4 | 0.6% |
| Welsh | 3 | 0.5% | View All 16 Rows |
Immigrants in Weedville

| Immigration Origin | # Population | % Population | View All 0 Rows |
Sex and Age in Weedville
Sex and Age in Weedville
The most populous age groups in Weedville are 45 to 49 Years (42 | 14.6%) for men and Under 5 Years (79 | 21.7%) for women.
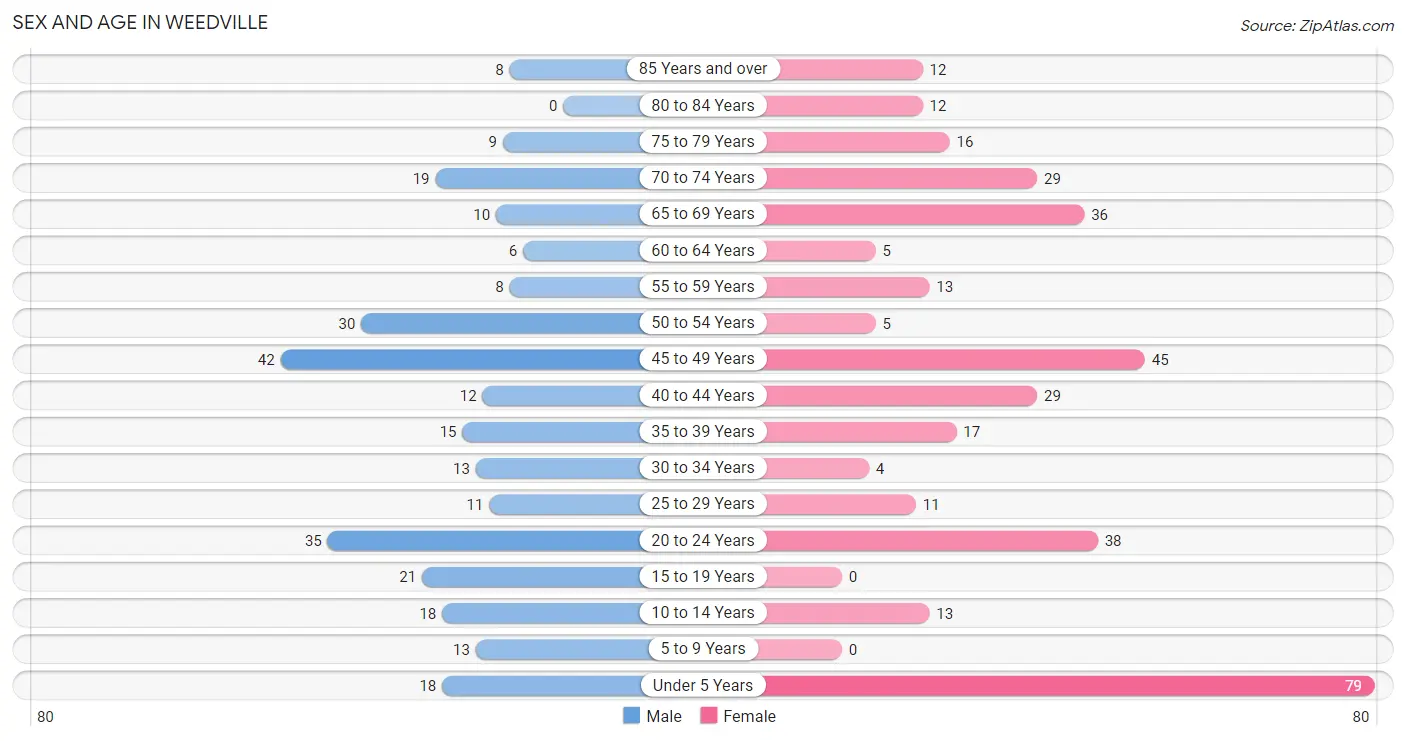
| Age Bracket | Male | Female |
| Under 5 Years | 18 (6.2%) | 79 (21.7%) |
| 5 to 9 Years | 13 (4.5%) | 0 (0.0%) |
| 10 to 14 Years | 18 (6.2%) | 13 (3.6%) |
| 15 to 19 Years | 21 (7.3%) | 0 (0.0%) |
| 20 to 24 Years | 35 (12.1%) | 38 (10.4%) |
| 25 to 29 Years | 11 (3.8%) | 11 (3.0%) |
| 30 to 34 Years | 13 (4.5%) | 4 (1.1%) |
| 35 to 39 Years | 15 (5.2%) | 17 (4.7%) |
| 40 to 44 Years | 12 (4.2%) | 29 (8.0%) |
| 45 to 49 Years | 42 (14.6%) | 45 (12.4%) |
| 50 to 54 Years | 30 (10.4%) | 5 (1.4%) |
| 55 to 59 Years | 8 (2.8%) | 13 (3.6%) |
| 60 to 64 Years | 6 (2.1%) | 5 (1.4%) |
| 65 to 69 Years | 10 (3.5%) | 36 (9.9%) |
| 70 to 74 Years | 19 (6.6%) | 29 (8.0%) |
| 75 to 79 Years | 9 (3.1%) | 16 (4.4%) |
| 80 to 84 Years | 0 (0.0%) | 12 (3.3%) |
| 85 Years and over | 8 (2.8%) | 12 (3.3%) |
| Total | 288 (100.0%) | 364 (100.0%) |
Families and Households in Weedville
Median Family Size in Weedville
The median family size in Weedville is 3.35 persons per family, with single female/mother families (29 | 17.5%) accounting for the largest median family size of 3.55 persons per family. On the other hand, single male/father families (11 | 6.6%) represent the smallest median family size with 2.00 persons per family.
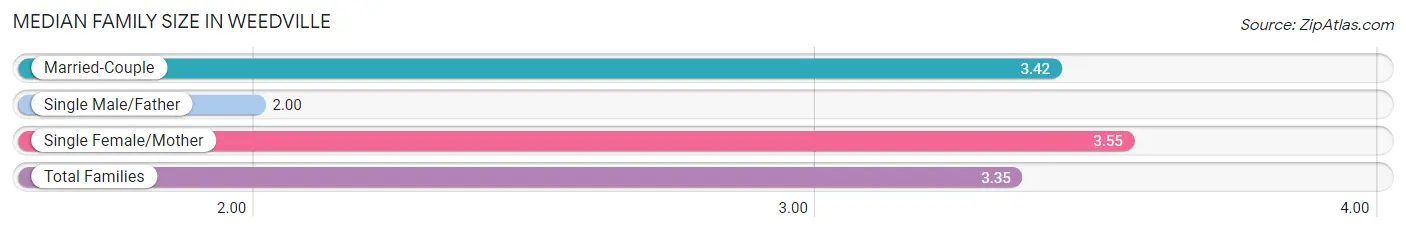
| Family Type | # Families | Family Size |
| Married-Couple | 126 (75.9%) | 3.42 |
| Single Male/Father | 11 (6.6%) | 2.00 |
| Single Female/Mother | 29 (17.5%) | 3.55 |
| Total Families | 166 (100.0%) | 3.35 |
Median Household Size in Weedville
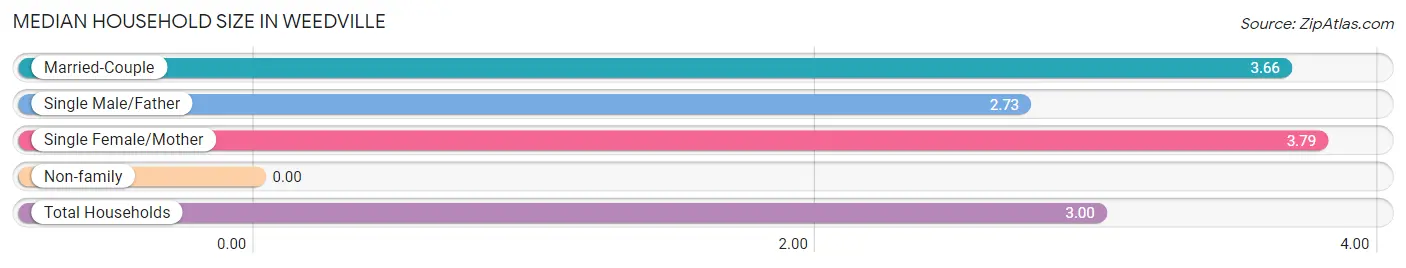
| Household Type | # Households | Household Size |
| Married-Couple | 126 (58.1%) | 3.66 |
| Single Male/Father | 11 (5.1%) | 2.73 |
| Single Female/Mother | 29 (13.4%) | 3.79 |
| Non-family | 51 (23.5%) | - |
| Total Households | 217 (100.0%) | 3.00 |
Household Size by Marriage Status in Weedville
Out of a total of 217 households in Weedville, 166 (76.5%) are family households, while 51 (23.5%) are nonfamily households. The most numerous type of family households are 2-person households, comprising 82, and the most common type of nonfamily households are 1-person households, comprising 51.
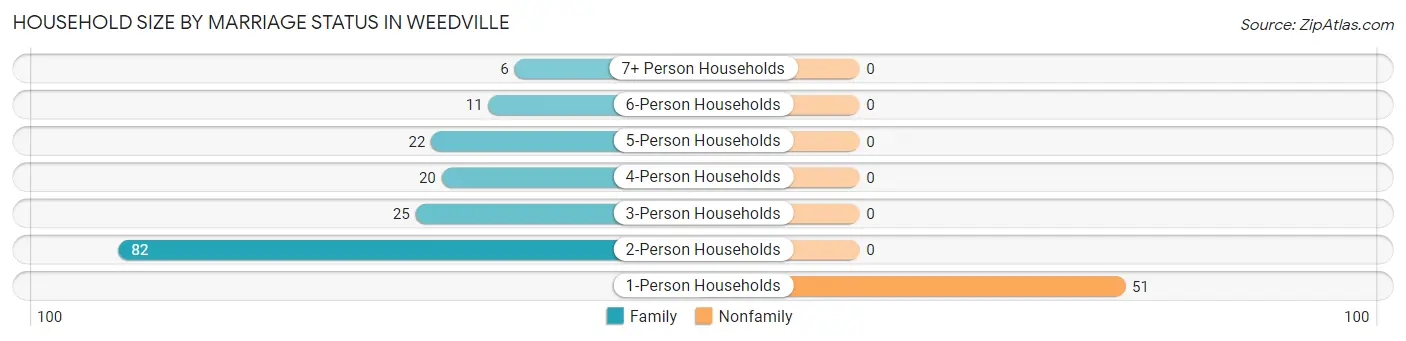
| Household Size | Family Households | Nonfamily Households |
| 1-Person Households | - | 51 (23.5%) |
| 2-Person Households | 82 (37.8%) | 0 (0.0%) |
| 3-Person Households | 25 (11.5%) | 0 (0.0%) |
| 4-Person Households | 20 (9.2%) | 0 (0.0%) |
| 5-Person Households | 22 (10.1%) | 0 (0.0%) |
| 6-Person Households | 11 (5.1%) | 0 (0.0%) |
| 7+ Person Households | 6 (2.8%) | 0 (0.0%) |
| Total | 166 (76.5%) | 51 (23.5%) |
Female Fertility in Weedville
Fertility by Age in Weedville
Average fertility rate in Weedville is 76.0 births per 1,000 women. Women in the age bracket of 35 to 50 years have the highest fertility rate with 121.0 births per 1,000 women. Women in the age bracket of 35 to 50 years acount for 100.0% of all women with births.
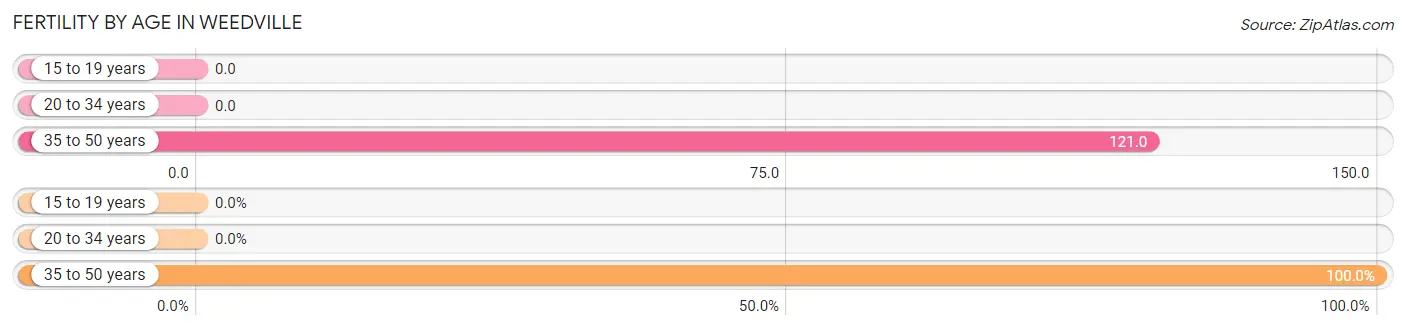
| Age Bracket | Women with Births | Births / 1,000 Women |
| 15 to 19 years | 0 (0.0%) | 0.0 |
| 20 to 34 years | 0 (0.0%) | 0.0 |
| 35 to 50 years | 11 (100.0%) | 121.0 |
| Total | 11 (100.0%) | 76.0 |
Fertility by Age by Marriage Status in Weedville
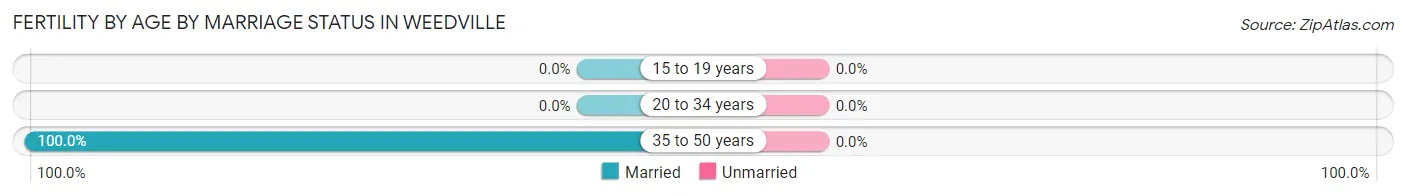
| Age Bracket | Married | Unmarried |
| 15 to 19 years | 0 (0.0%) | 0 (0.0%) |
| 20 to 34 years | 0 (0.0%) | 0 (0.0%) |
| 35 to 50 years | 11 (100.0%) | 0 (0.0%) |
| Total | 11 (100.0%) | 0 (0.0%) |
Fertility by Education in Weedville
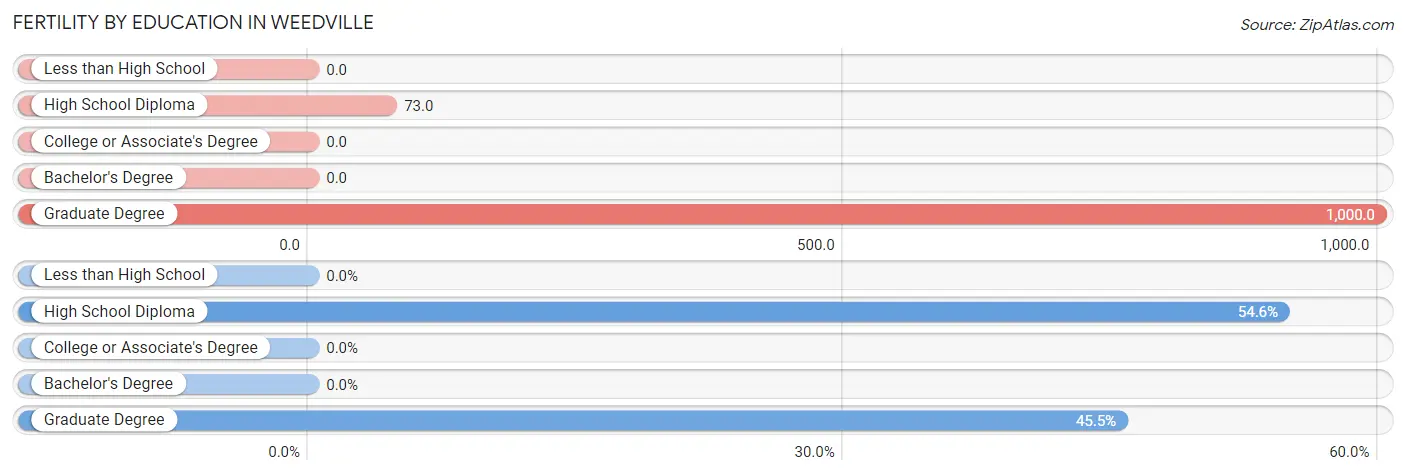
| Educational Attainment | Women with Births | Births / 1,000 Women |
| Less than High School | 0 (0.0%) | 0.0 |
| High School Diploma | 6 (54.5%) | 73.0 |
| College or Associate's Degree | 0 (0.0%) | 0.0 |
| Bachelor's Degree | 0 (0.0%) | 0.0 |
| Graduate Degree | 5 (45.5%) | 1,000.0 |
| Total | 11 (100.0%) | 76.0 |
Fertility by Education by Marriage Status in Weedville
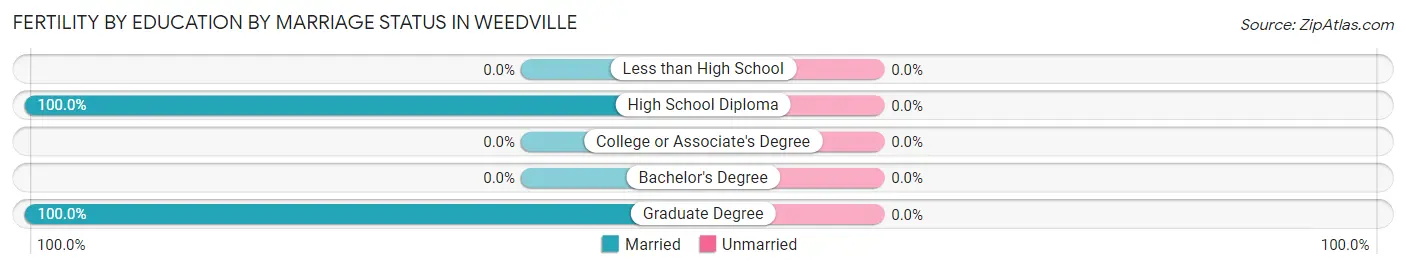
| Educational Attainment | Married | Unmarried |
| Less than High School | 0 (0.0%) | 0 (0.0%) |
| High School Diploma | 6 (100.0%) | 0 (0.0%) |
| College or Associate's Degree | 0 (0.0%) | 0 (0.0%) |
| Bachelor's Degree | 0 (0.0%) | 0 (0.0%) |
| Graduate Degree | 5 (100.0%) | 0 (0.0%) |
| Total | 11 (100.0%) | 0 (0.0%) |
Employment Characteristics in Weedville
Employment by Class of Employer in Weedville
Among the 227 employed individuals in Weedville, private company employees (197 | 86.8%), local government employees (19 | 8.4%), and federal government employees (6 | 2.6%) make up the most common classes of employment.
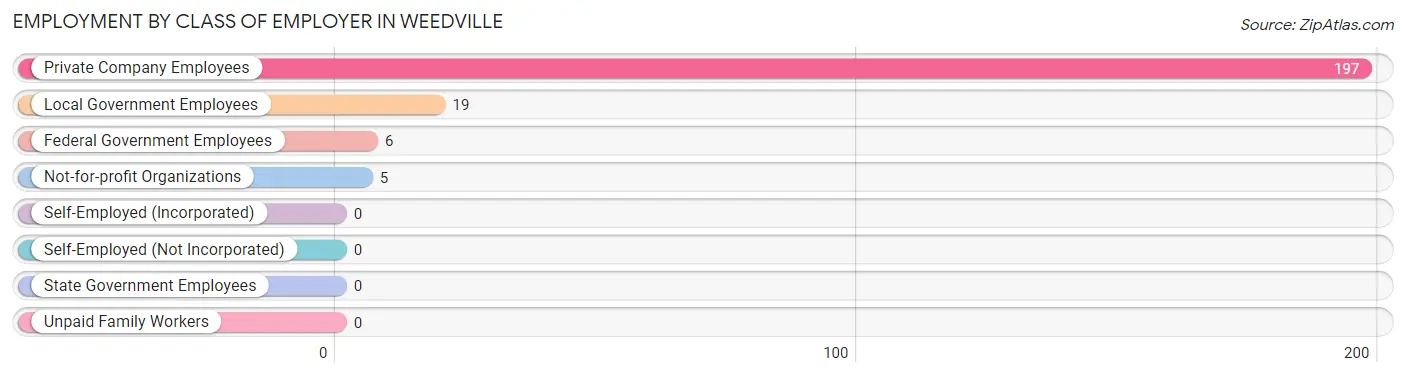
| Employer Class | # Employees | % Employees |
| Private Company Employees | 197 | 86.8% |
| Self-Employed (Incorporated) | 0 | 0.0% |
| Self-Employed (Not Incorporated) | 0 | 0.0% |
| Not-for-profit Organizations | 5 | 2.2% |
| Local Government Employees | 19 | 8.4% |
| State Government Employees | 0 | 0.0% |
| Federal Government Employees | 6 | 2.6% |
| Unpaid Family Workers | 0 | 0.0% |
| Total | 227 | 100.0% |
Employment Status by Age in Weedville
According to the labor force statistics for Weedville, out of the total population over 16 years of age (511), 51.5% or 263 individuals are in the labor force, with 13.7% or 36 of them unemployed. The age group with the highest labor force participation rate is 30 to 34 years, with 100.0% or 17 individuals in the labor force. Within the labor force, the 30 to 34 years age range has the highest percentage of unemployed individuals, with 29.4% or 5 of them being unemployed.
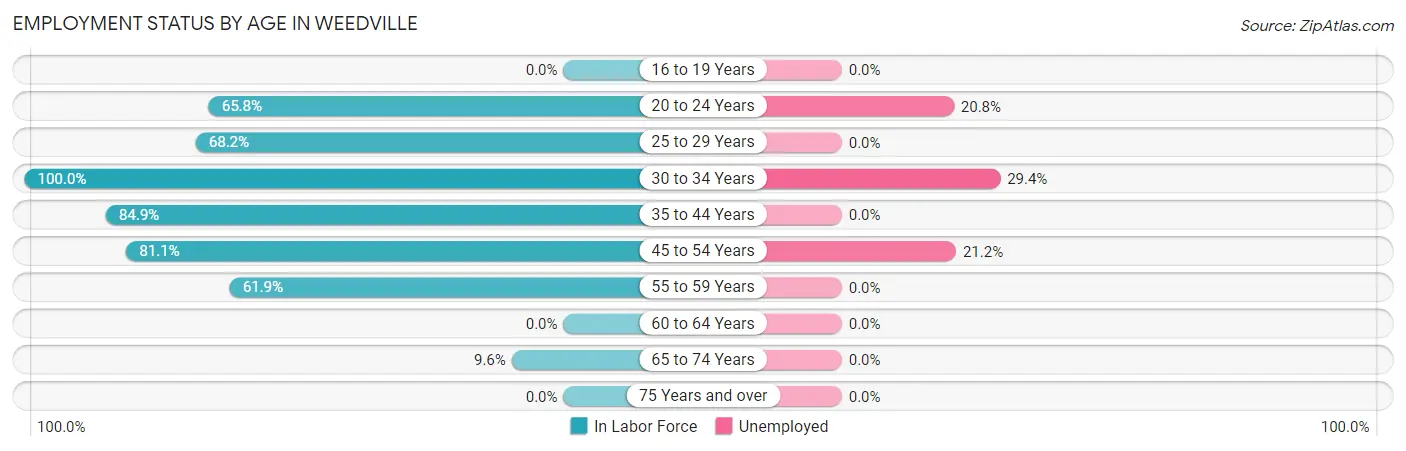
| Age Bracket | In Labor Force | Unemployed |
| 16 to 19 Years | 0 (0.0%) | 0 (0.0%) |
| 20 to 24 Years | 48 (65.8%) | 10 (20.8%) |
| 25 to 29 Years | 15 (68.2%) | 0 (0.0%) |
| 30 to 34 Years | 17 (100.0%) | 5 (29.4%) |
| 35 to 44 Years | 62 (84.9%) | 0 (0.0%) |
| 45 to 54 Years | 99 (81.1%) | 21 (21.2%) |
| 55 to 59 Years | 13 (61.9%) | 0 (0.0%) |
| 60 to 64 Years | 0 (0.0%) | 0 (0.0%) |
| 65 to 74 Years | 9 (9.6%) | 0 (0.0%) |
| 75 Years and over | 0 (0.0%) | 0 (0.0%) |
| Total | 263 (51.5%) | 36 (13.7%) |
Employment Status by Educational Attainment in Weedville
According to labor force statistics for Weedville, 77.4% of individuals (206) out of the total population between 25 and 64 years of age (266) are in the labor force, with 12.6% or 26 of them being unemployed. The group with the highest labor force participation rate are those with the educational attainment of bachelor's degree or higher, with 100.0% or 19 individuals in the labor force. Within the labor force, individuals with high school diploma education have the highest percentage of unemployment, with 17.2% or 21 of them being unemployed.
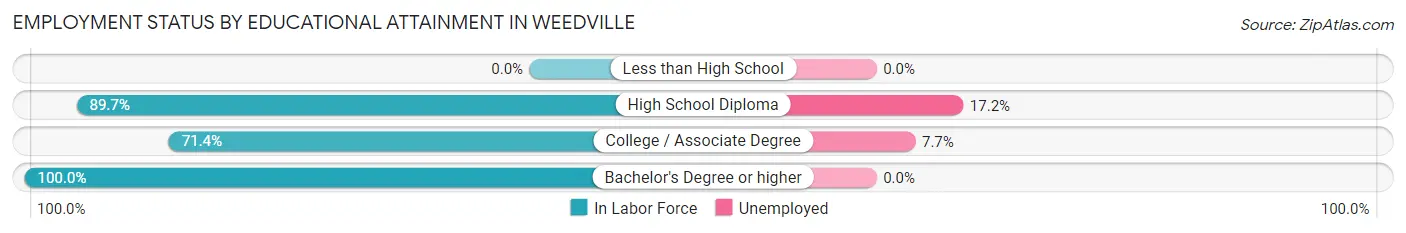
| Educational Attainment | In Labor Force | Unemployed |
| Less than High School | 0 (0.0%) | 0 (0.0%) |
| High School Diploma | 122 (89.7%) | 23 (17.2%) |
| College / Associate Degree | 65 (71.4%) | 7 (7.7%) |
| Bachelor's Degree or higher | 19 (100.0%) | 0 (0.0%) |
| Total | 206 (77.4%) | 34 (12.6%) |
Employment Occupations by Sex in Weedville
Management, Business, Science and Arts Occupations
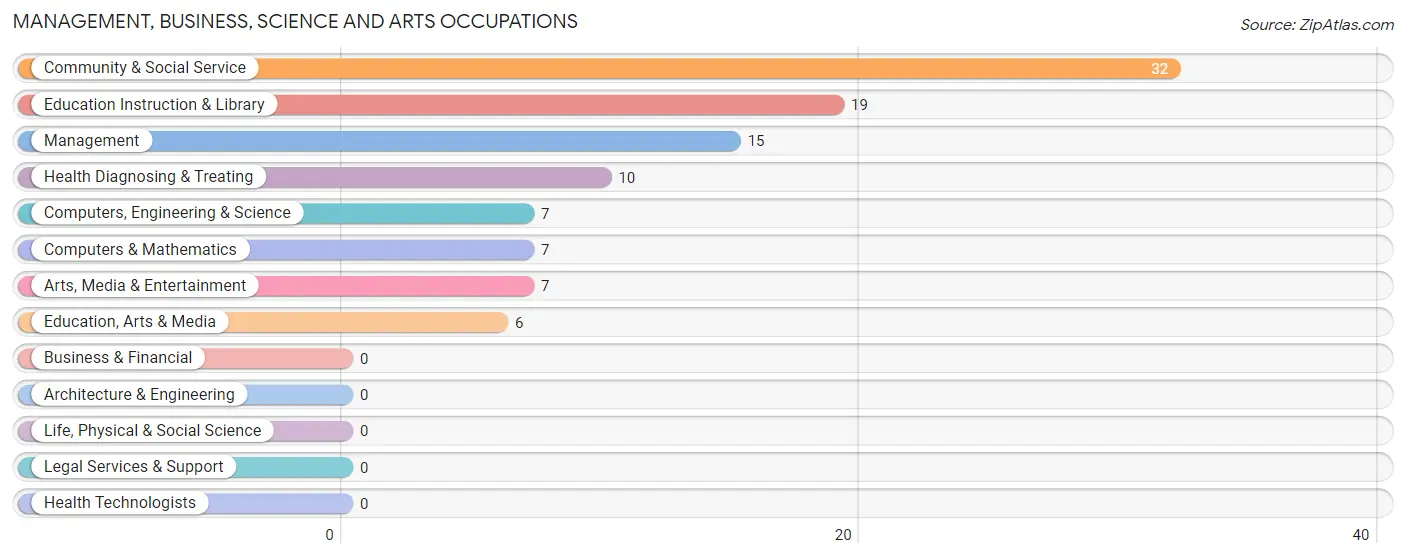
The most common Management, Business, Science and Arts occupations in Weedville are Community & Social Service (32 | 14.1%), Education Instruction & Library (19 | 8.4%), Management (15 | 6.6%), Health Diagnosing & Treating (10 | 4.4%), and Computers, Engineering & Science (7 | 3.1%).
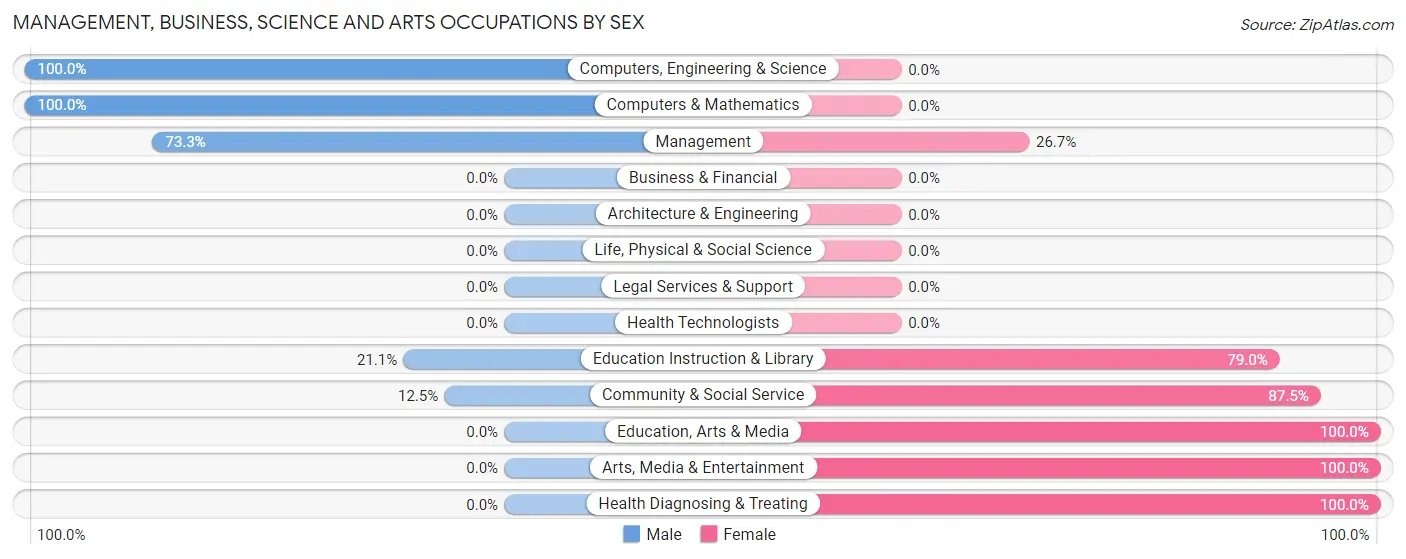
Management, Business, Science and Arts Occupations by Sex
Within the Management, Business, Science and Arts occupations in Weedville, the most male-oriented occupations are Computers, Engineering & Science (100.0%), Computers & Mathematics (100.0%), and Management (73.3%), while the most female-oriented occupations are Education, Arts & Media (100.0%), Arts, Media & Entertainment (100.0%), and Health Diagnosing & Treating (100.0%).
| Occupation | Male | Female |
| Management | 11 (73.3%) | 4 (26.7%) |
| Business & Financial | 0 (0.0%) | 0 (0.0%) |
| Computers, Engineering & Science | 7 (100.0%) | 0 (0.0%) |
| Computers & Mathematics | 7 (100.0%) | 0 (0.0%) |
| Architecture & Engineering | 0 (0.0%) | 0 (0.0%) |
| Life, Physical & Social Science | 0 (0.0%) | 0 (0.0%) |
| Community & Social Service | 4 (12.5%) | 28 (87.5%) |
| Education, Arts & Media | 0 (0.0%) | 6 (100.0%) |
| Legal Services & Support | 0 (0.0%) | 0 (0.0%) |
| Education Instruction & Library | 4 (21.0%) | 15 (78.9%) |
| Arts, Media & Entertainment | 0 (0.0%) | 7 (100.0%) |
| Health Diagnosing & Treating | 0 (0.0%) | 10 (100.0%) |
| Health Technologists | 0 (0.0%) | 0 (0.0%) |
| Total (Category) | 22 (34.4%) | 42 (65.6%) |
| Total (Overall) | 99 (43.6%) | 128 (56.4%) |
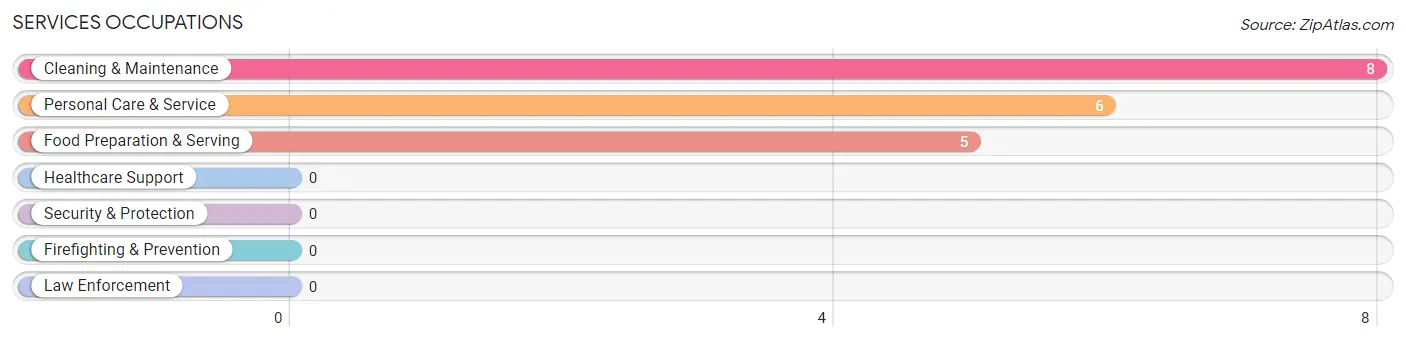
Services Occupations
The most common Services occupations in Weedville are Cleaning & Maintenance (8 | 3.5%), Personal Care & Service (6 | 2.6%), and Food Preparation & Serving (5 | 2.2%).
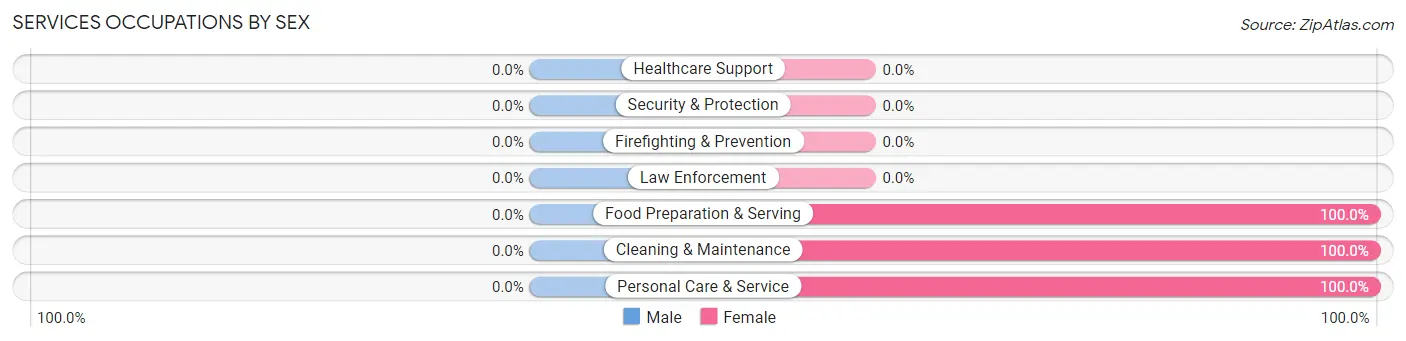
Services Occupations by Sex
| Occupation | Male | Female |
| Healthcare Support | 0 (0.0%) | 0 (0.0%) |
| Security & Protection | 0 (0.0%) | 0 (0.0%) |
| Firefighting & Prevention | 0 (0.0%) | 0 (0.0%) |
| Law Enforcement | 0 (0.0%) | 0 (0.0%) |
| Food Preparation & Serving | 0 (0.0%) | 5 (100.0%) |
| Cleaning & Maintenance | 0 (0.0%) | 8 (100.0%) |
| Personal Care & Service | 0 (0.0%) | 6 (100.0%) |
| Total (Category) | 0 (0.0%) | 19 (100.0%) |
| Total (Overall) | 99 (43.6%) | 128 (56.4%) |
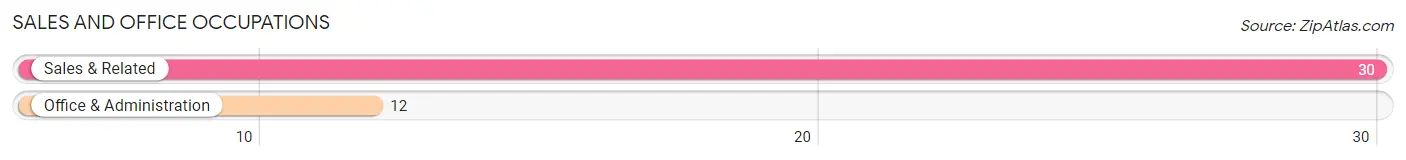
Sales and Office Occupations
The most common Sales and Office occupations in Weedville are Sales & Related (30 | 13.2%), and Office & Administration (12 | 5.3%).
Sales and Office Occupations by Sex
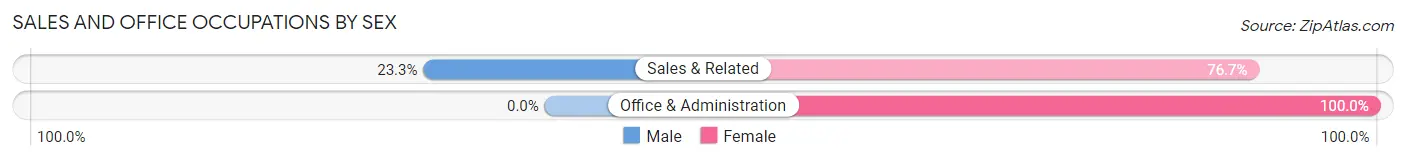
| Occupation | Male | Female |
| Sales & Related | 7 (23.3%) | 23 (76.7%) |
| Office & Administration | 0 (0.0%) | 12 (100.0%) |
| Total (Category) | 7 (16.7%) | 35 (83.3%) |
| Total (Overall) | 99 (43.6%) | 128 (56.4%) |
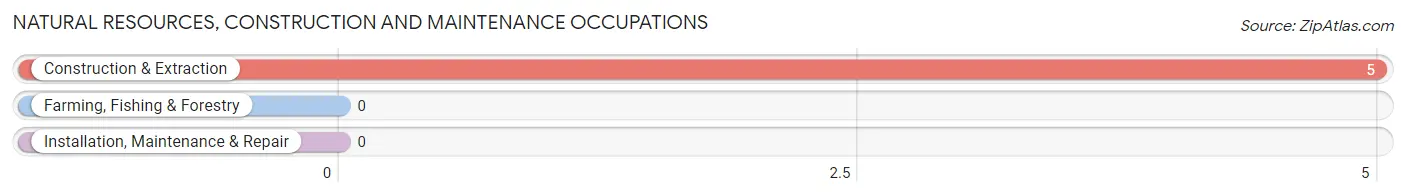
Natural Resources, Construction and Maintenance Occupations
The most common Natural Resources, Construction and Maintenance occupations in Weedville are , and Construction & Extraction (5 | 2.2%).
Natural Resources, Construction and Maintenance Occupations by Sex
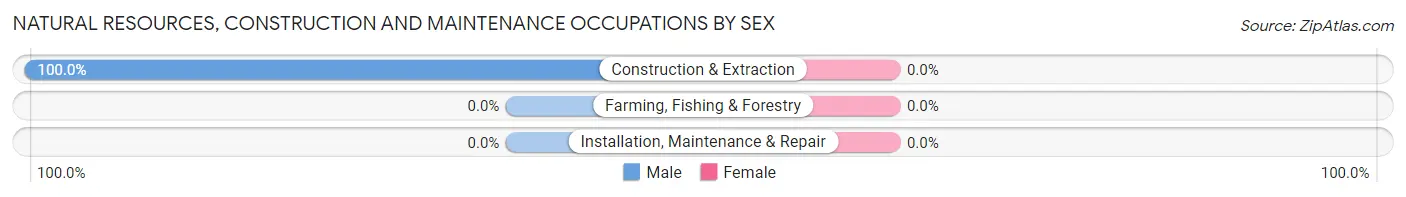
| Occupation | Male | Female |
| Farming, Fishing & Forestry | 0 (0.0%) | 0 (0.0%) |
| Construction & Extraction | 5 (100.0%) | 0 (0.0%) |
| Installation, Maintenance & Repair | 0 (0.0%) | 0 (0.0%) |
| Total (Category) | 5 (100.0%) | 0 (0.0%) |
| Total (Overall) | 99 (43.6%) | 128 (56.4%) |
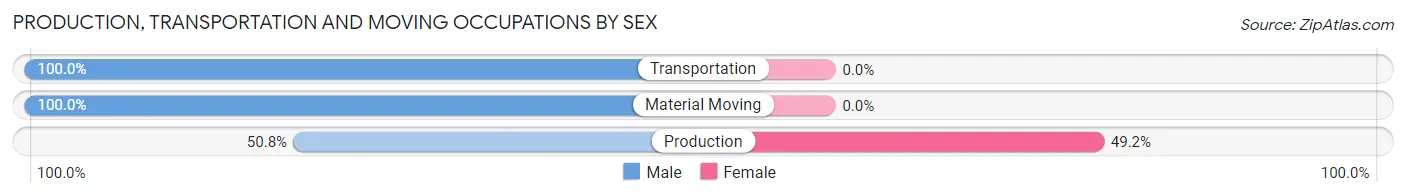
Production, Transportation and Moving Occupations
The most common Production, Transportation and Moving occupations in Weedville are Production (65 | 28.6%), Transportation (23 | 10.1%), and Material Moving (9 | 4.0%).
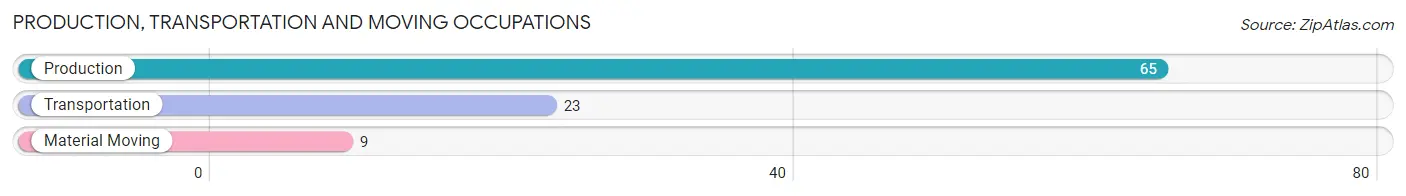
Production, Transportation and Moving Occupations by Sex
| Occupation | Male | Female |
| Production | 33 (50.8%) | 32 (49.2%) |
| Transportation | 23 (100.0%) | 0 (0.0%) |
| Material Moving | 9 (100.0%) | 0 (0.0%) |
| Total (Category) | 65 (67.0%) | 32 (33.0%) |
| Total (Overall) | 99 (43.6%) | 128 (56.4%) |
Employment Industries by Sex in Weedville
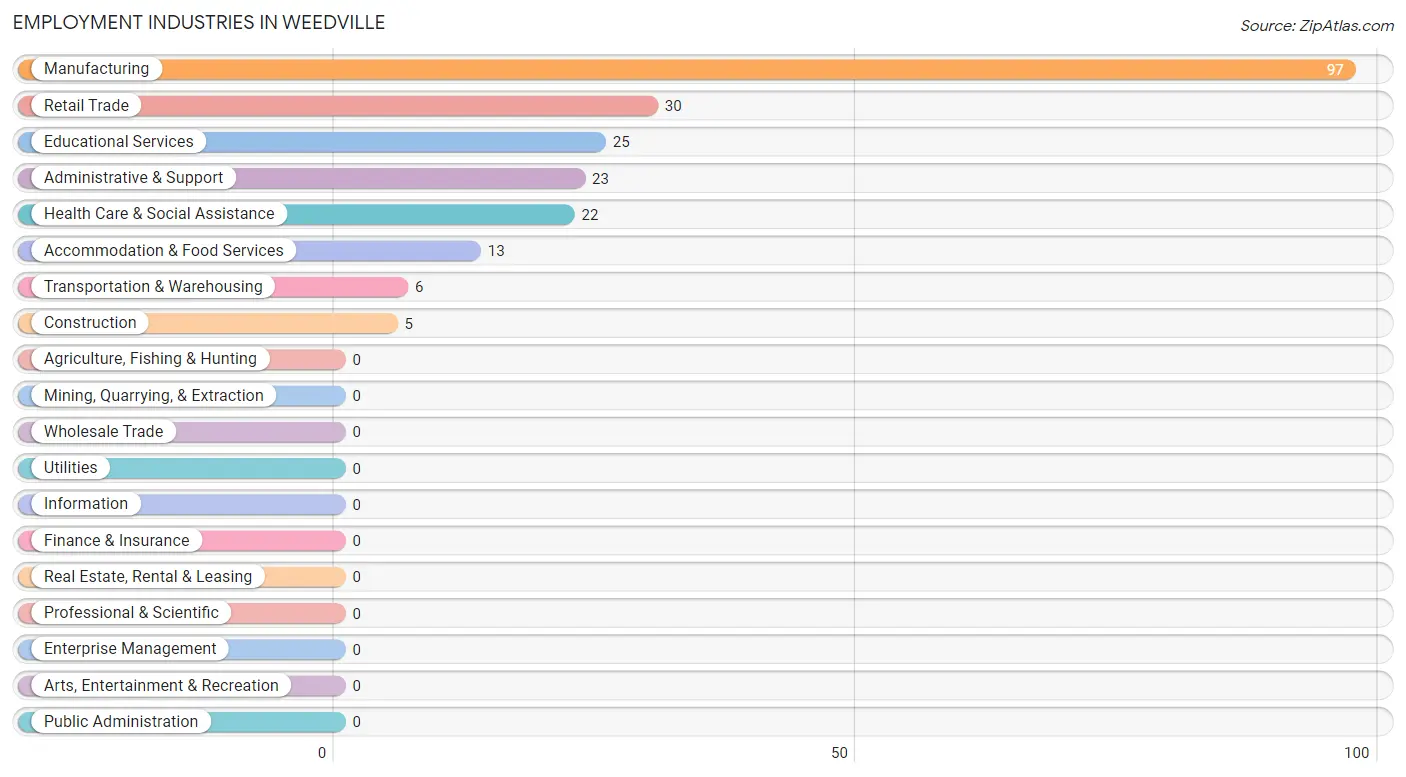
Employment Industries in Weedville
The major employment industries in Weedville include Manufacturing (97 | 42.7%), Retail Trade (30 | 13.2%), Educational Services (25 | 11.0%), Administrative & Support (23 | 10.1%), and Health Care & Social Assistance (22 | 9.7%).
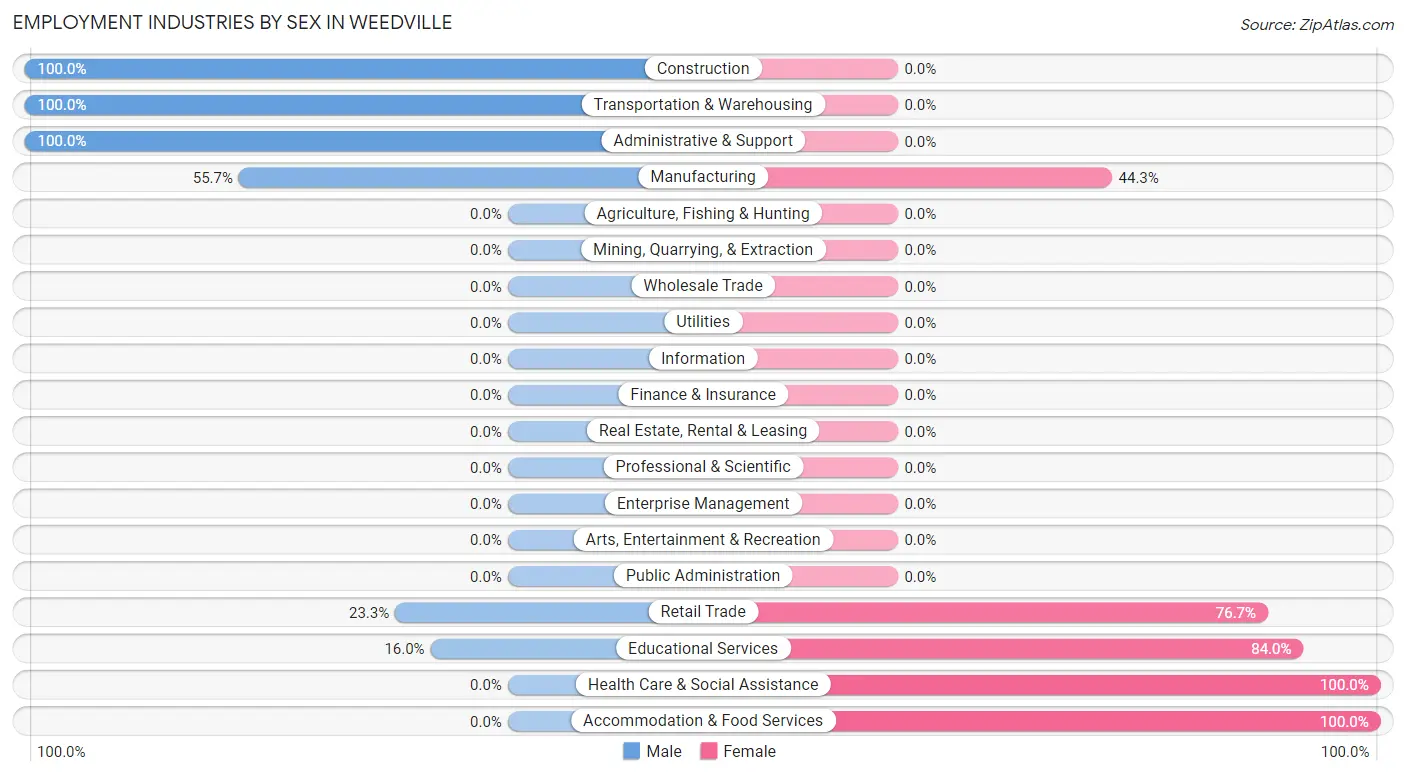
Employment Industries by Sex in Weedville
The Weedville industries that see more men than women are Construction (100.0%), Transportation & Warehousing (100.0%), and Administrative & Support (100.0%), whereas the industries that tend to have a higher number of women are Health Care & Social Assistance (100.0%), Accommodation & Food Services (100.0%), and Educational Services (84.0%).
| Industry | Male | Female |
| Agriculture, Fishing & Hunting | 0 (0.0%) | 0 (0.0%) |
| Mining, Quarrying, & Extraction | 0 (0.0%) | 0 (0.0%) |
| Construction | 5 (100.0%) | 0 (0.0%) |
| Manufacturing | 54 (55.7%) | 43 (44.3%) |
| Wholesale Trade | 0 (0.0%) | 0 (0.0%) |
| Retail Trade | 7 (23.3%) | 23 (76.7%) |
| Transportation & Warehousing | 6 (100.0%) | 0 (0.0%) |
| Utilities | 0 (0.0%) | 0 (0.0%) |
| Information | 0 (0.0%) | 0 (0.0%) |
| Finance & Insurance | 0 (0.0%) | 0 (0.0%) |
| Real Estate, Rental & Leasing | 0 (0.0%) | 0 (0.0%) |
| Professional & Scientific | 0 (0.0%) | 0 (0.0%) |
| Enterprise Management | 0 (0.0%) | 0 (0.0%) |
| Administrative & Support | 23 (100.0%) | 0 (0.0%) |
| Educational Services | 4 (16.0%) | 21 (84.0%) |
| Health Care & Social Assistance | 0 (0.0%) | 22 (100.0%) |
| Arts, Entertainment & Recreation | 0 (0.0%) | 0 (0.0%) |
| Accommodation & Food Services | 0 (0.0%) | 13 (100.0%) |
| Public Administration | 0 (0.0%) | 0 (0.0%) |
| Total | 99 (43.6%) | 128 (56.4%) |
Education in Weedville
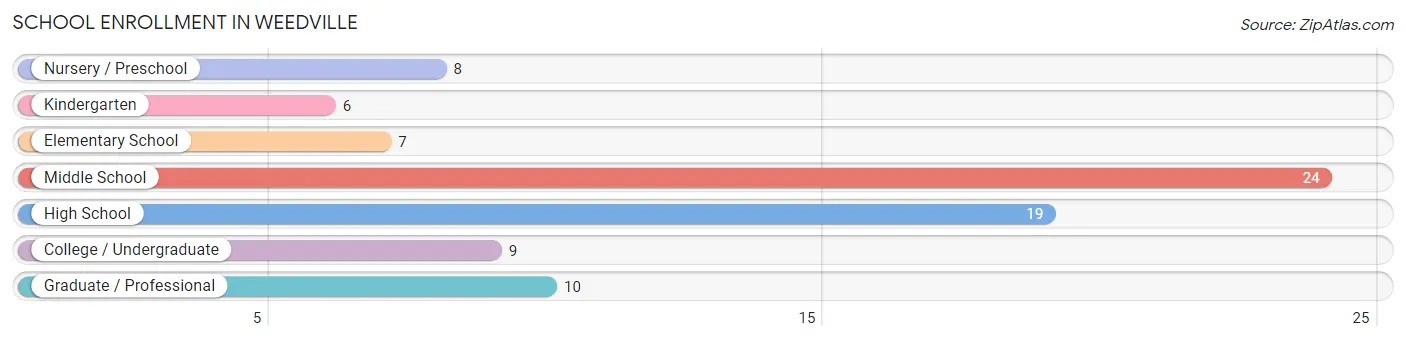
School Enrollment in Weedville
The most common levels of schooling among the 83 students in Weedville are middle school (24 | 28.9%), high school (19 | 22.9%), and graduate / professional (10 | 12.0%).
| School Level | # Students | % Students |
| Nursery / Preschool | 8 | 9.6% |
| Kindergarten | 6 | 7.2% |
| Elementary School | 7 | 8.4% |
| Middle School | 24 | 28.9% |
| High School | 19 | 22.9% |
| College / Undergraduate | 9 | 10.8% |
| Graduate / Professional | 10 | 12.0% |
| Total | 83 | 100.0% |
School Enrollment by Age by Funding Source in Weedville
Out of a total of 83 students who are enrolled in schools in Weedville, 16 (19.3%) attend a private institution, while the remaining 67 (80.7%) are enrolled in public schools. The age group of 3 to 4 year olds has the highest likelihood of being enrolled in private schools, with 8 (100.0% in the age bracket) enrolled. Conversely, the age group of 5 to 9 year old has the lowest likelihood of being enrolled in a private school, with 13 (100.0% in the age bracket) attending a public institution.
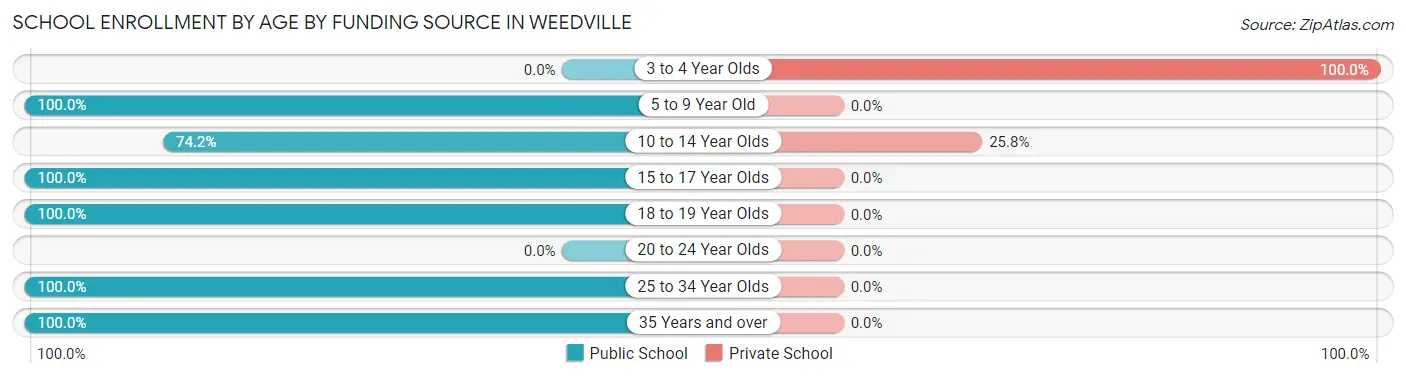
| Age Bracket | Public School | Private School |
| 3 to 4 Year Olds | 0 (0.0%) | 8 (100.0%) |
| 5 to 9 Year Old | 13 (100.0%) | 0 (0.0%) |
| 10 to 14 Year Olds | 23 (74.2%) | 8 (25.8%) |
| 15 to 17 Year Olds | 12 (100.0%) | 0 (0.0%) |
| 18 to 19 Year Olds | 9 (100.0%) | 0 (0.0%) |
| 20 to 24 Year Olds | 0 (0.0%) | 0 (0.0%) |
| 25 to 34 Year Olds | 4 (100.0%) | 0 (0.0%) |
| 35 Years and over | 6 (100.0%) | 0 (0.0%) |
| Total | 67 (80.7%) | 16 (19.3%) |
Educational Attainment by Field of Study in Weedville
Education (26 | 72.2%), psychology (7 | 19.4%), and liberal arts & history (3 | 8.3%) are the most common fields of study among 36 individuals in Weedville who have obtained a bachelor's degree or higher.
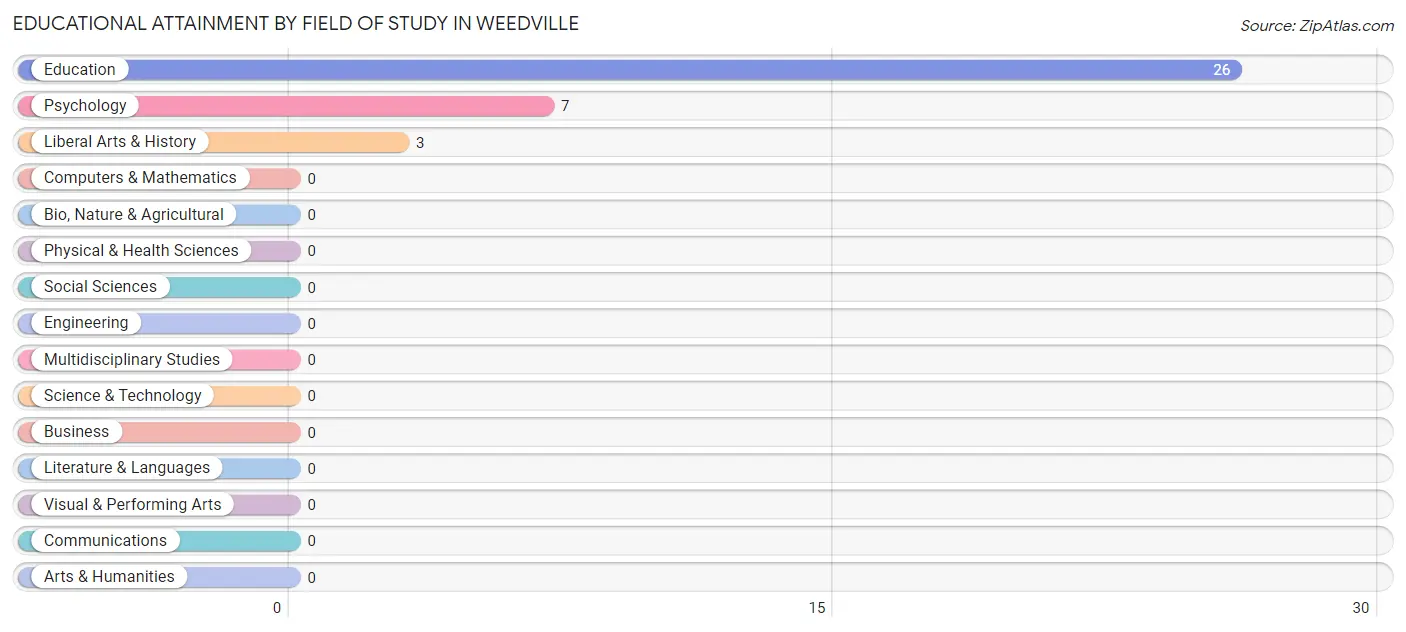
| Field of Study | # Graduates | % Graduates |
| Computers & Mathematics | 0 | 0.0% |
| Bio, Nature & Agricultural | 0 | 0.0% |
| Physical & Health Sciences | 0 | 0.0% |
| Psychology | 7 | 19.4% |
| Social Sciences | 0 | 0.0% |
| Engineering | 0 | 0.0% |
| Multidisciplinary Studies | 0 | 0.0% |
| Science & Technology | 0 | 0.0% |
| Business | 0 | 0.0% |
| Education | 26 | 72.2% |
| Literature & Languages | 0 | 0.0% |
| Liberal Arts & History | 3 | 8.3% |
| Visual & Performing Arts | 0 | 0.0% |
| Communications | 0 | 0.0% |
| Arts & Humanities | 0 | 0.0% |
| Total | 36 | 100.0% |
Transportation & Commute in Weedville
Vehicle Availability by Sex in Weedville
The most prevalent vehicle ownership categories in Weedville are males with 3 vehicles (35, accounting for 35.3%) and females with 3 vehicles (46, making up 27.3%).
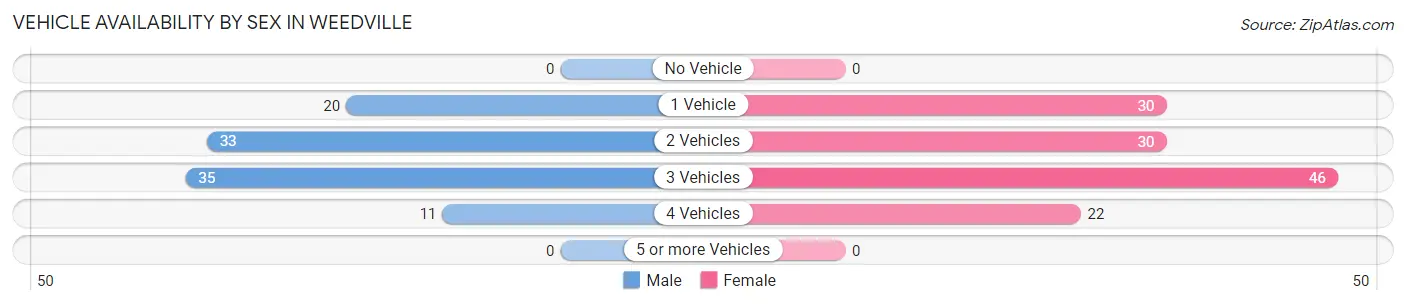
| Vehicles Available | Male | Female |
| No Vehicle | 0 (0.0%) | 0 (0.0%) |
| 1 Vehicle | 20 (20.2%) | 30 (23.4%) |
| 2 Vehicles | 33 (33.3%) | 30 (23.4%) |
| 3 Vehicles | 35 (35.3%) | 46 (35.9%) |
| 4 Vehicles | 11 (11.1%) | 22 (17.2%) |
| 5 or more Vehicles | 0 (0.0%) | 0 (0.0%) |
| Total | 99 (100.0%) | 128 (100.0%) |
Commute Time in Weedville
The most frequently occuring commute durations in Weedville are 25 to 29 minutes (49 commuters, 21.6%), 5 to 9 minutes (46 commuters, 20.3%), and 20 to 24 minutes (33 commuters, 14.5%).
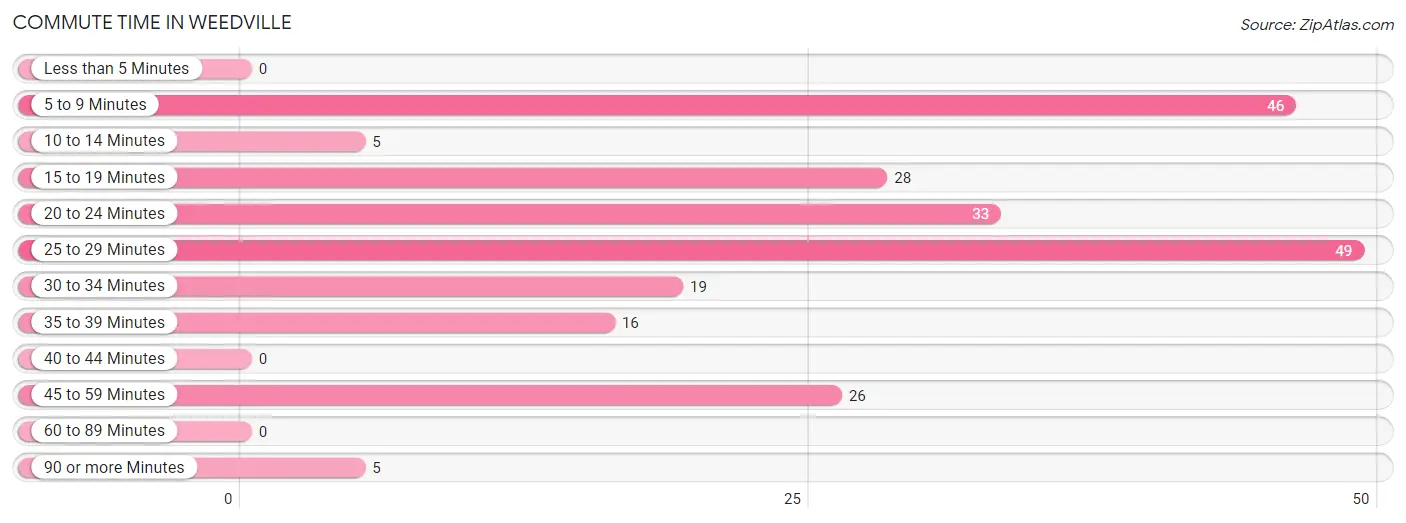
| Commute Time | # Commuters | % Commuters |
| Less than 5 Minutes | 0 | 0.0% |
| 5 to 9 Minutes | 46 | 20.3% |
| 10 to 14 Minutes | 5 | 2.2% |
| 15 to 19 Minutes | 28 | 12.3% |
| 20 to 24 Minutes | 33 | 14.5% |
| 25 to 29 Minutes | 49 | 21.6% |
| 30 to 34 Minutes | 19 | 8.4% |
| 35 to 39 Minutes | 16 | 7.0% |
| 40 to 44 Minutes | 0 | 0.0% |
| 45 to 59 Minutes | 26 | 11.5% |
| 60 to 89 Minutes | 0 | 0.0% |
| 90 or more Minutes | 5 | 2.2% |
Commute Time by Sex in Weedville
The most common commute times in Weedville are 5 to 9 minutes (23 commuters, 23.2%) for males and 25 to 29 minutes (27 commuters, 21.1%) for females.
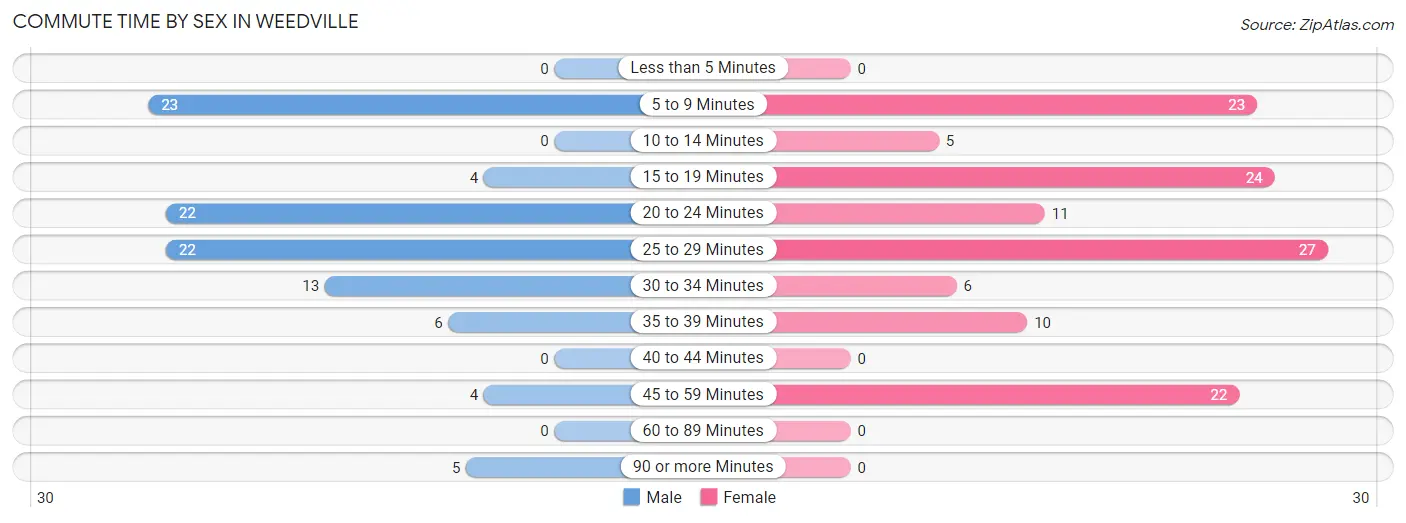
| Commute Time | Male | Female |
| Less than 5 Minutes | 0 (0.0%) | 0 (0.0%) |
| 5 to 9 Minutes | 23 (23.2%) | 23 (18.0%) |
| 10 to 14 Minutes | 0 (0.0%) | 5 (3.9%) |
| 15 to 19 Minutes | 4 (4.0%) | 24 (18.8%) |
| 20 to 24 Minutes | 22 (22.2%) | 11 (8.6%) |
| 25 to 29 Minutes | 22 (22.2%) | 27 (21.1%) |
| 30 to 34 Minutes | 13 (13.1%) | 6 (4.7%) |
| 35 to 39 Minutes | 6 (6.1%) | 10 (7.8%) |
| 40 to 44 Minutes | 0 (0.0%) | 0 (0.0%) |
| 45 to 59 Minutes | 4 (4.0%) | 22 (17.2%) |
| 60 to 89 Minutes | 0 (0.0%) | 0 (0.0%) |
| 90 or more Minutes | 5 (5.1%) | 0 (0.0%) |
Time of Departure to Work by Sex in Weedville
The most frequent times of departure to work in Weedville are 6:00 AM to 6:29 AM (24, 24.2%) for males and 6:00 AM to 6:29 AM (34, 26.6%) for females.
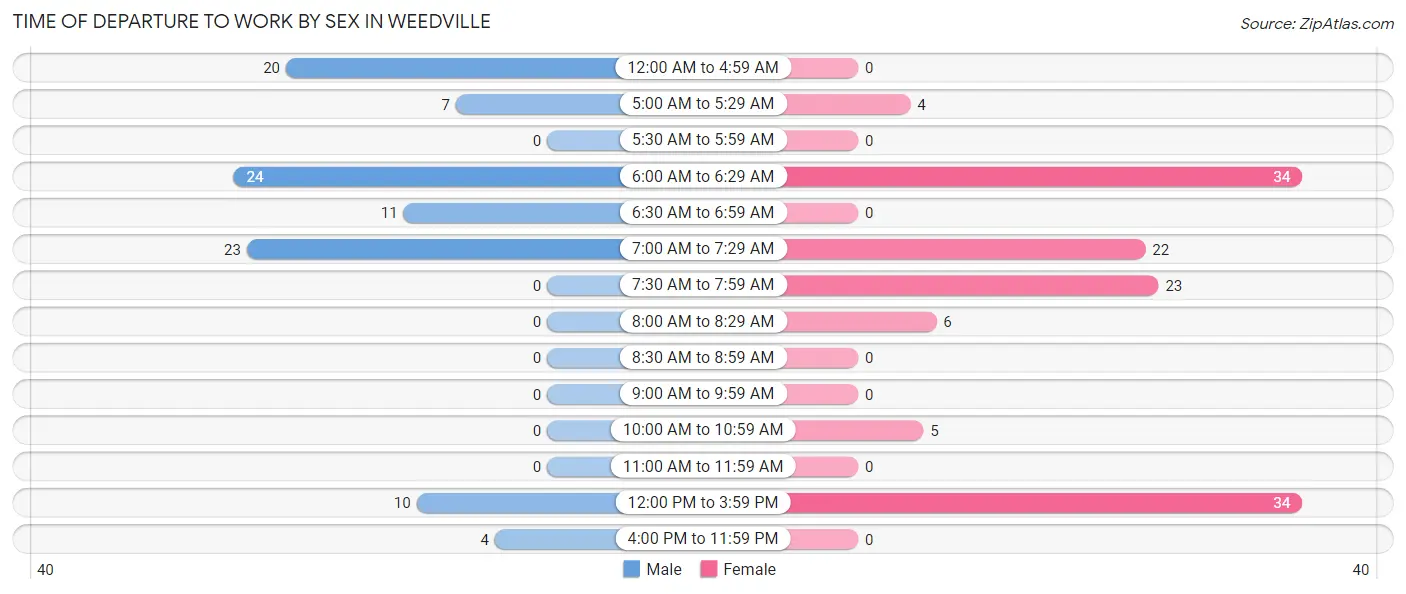
| Time of Departure | Male | Female |
| 12:00 AM to 4:59 AM | 20 (20.2%) | 0 (0.0%) |
| 5:00 AM to 5:29 AM | 7 (7.1%) | 4 (3.1%) |
| 5:30 AM to 5:59 AM | 0 (0.0%) | 0 (0.0%) |
| 6:00 AM to 6:29 AM | 24 (24.2%) | 34 (26.6%) |
| 6:30 AM to 6:59 AM | 11 (11.1%) | 0 (0.0%) |
| 7:00 AM to 7:29 AM | 23 (23.2%) | 22 (17.2%) |
| 7:30 AM to 7:59 AM | 0 (0.0%) | 23 (18.0%) |
| 8:00 AM to 8:29 AM | 0 (0.0%) | 6 (4.7%) |
| 8:30 AM to 8:59 AM | 0 (0.0%) | 0 (0.0%) |
| 9:00 AM to 9:59 AM | 0 (0.0%) | 0 (0.0%) |
| 10:00 AM to 10:59 AM | 0 (0.0%) | 5 (3.9%) |
| 11:00 AM to 11:59 AM | 0 (0.0%) | 0 (0.0%) |
| 12:00 PM to 3:59 PM | 10 (10.1%) | 34 (26.6%) |
| 4:00 PM to 11:59 PM | 4 (4.0%) | 0 (0.0%) |
| Total | 99 (100.0%) | 128 (100.0%) |
Housing Occupancy in Weedville
Occupancy by Ownership in Weedville
Of the total 217 dwellings in Weedville, owner-occupied units account for 191 (88.0%), while renter-occupied units make up 26 (12.0%).
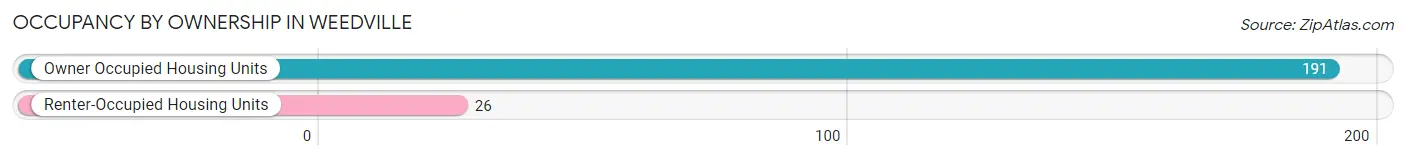
| Occupancy | # Housing Units | % Housing Units |
| Owner Occupied Housing Units | 191 | 88.0% |
| Renter-Occupied Housing Units | 26 | 12.0% |
| Total Occupied Housing Units | 217 | 100.0% |
Occupancy by Household Size in Weedville
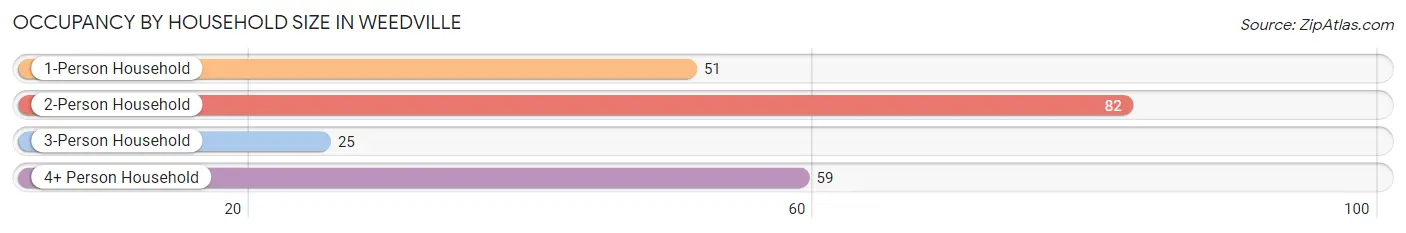
| Household Size | # Housing Units | % Housing Units |
| 1-Person Household | 51 | 23.5% |
| 2-Person Household | 82 | 37.8% |
| 3-Person Household | 25 | 11.5% |
| 4+ Person Household | 59 | 27.2% |
| Total Housing Units | 217 | 100.0% |
Occupancy by Ownership by Household Size in Weedville
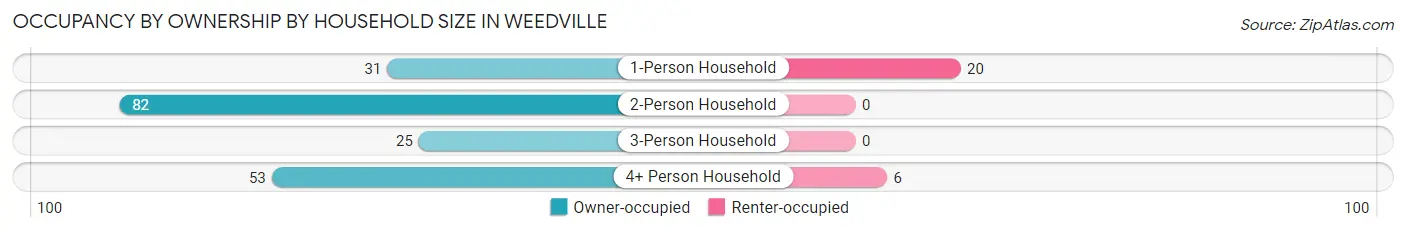
| Household Size | Owner-occupied | Renter-occupied |
| 1-Person Household | 31 (60.8%) | 20 (39.2%) |
| 2-Person Household | 82 (100.0%) | 0 (0.0%) |
| 3-Person Household | 25 (100.0%) | 0 (0.0%) |
| 4+ Person Household | 53 (89.8%) | 6 (10.2%) |
| Total Housing Units | 191 (88.0%) | 26 (12.0%) |
Occupancy by Educational Attainment in Weedville
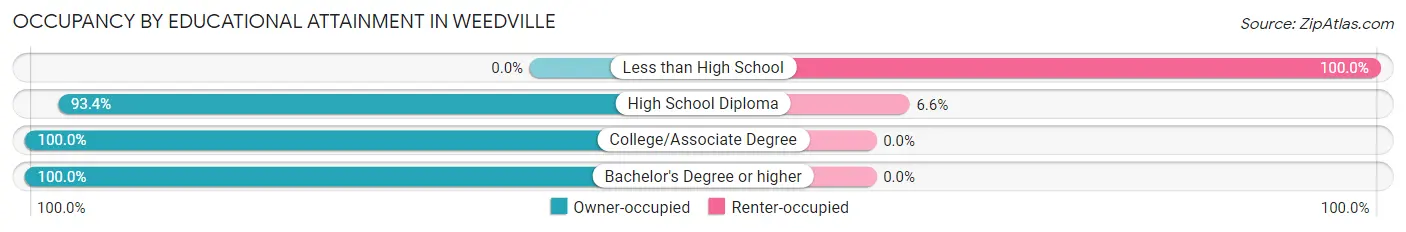
| Household Size | Owner-occupied | Renter-occupied |
| Less than High School | 0 (0.0%) | 19 (100.0%) |
| High School Diploma | 99 (93.4%) | 7 (6.6%) |
| College/Associate Degree | 64 (100.0%) | 0 (0.0%) |
| Bachelor's Degree or higher | 28 (100.0%) | 0 (0.0%) |
Occupancy by Age of Householder in Weedville
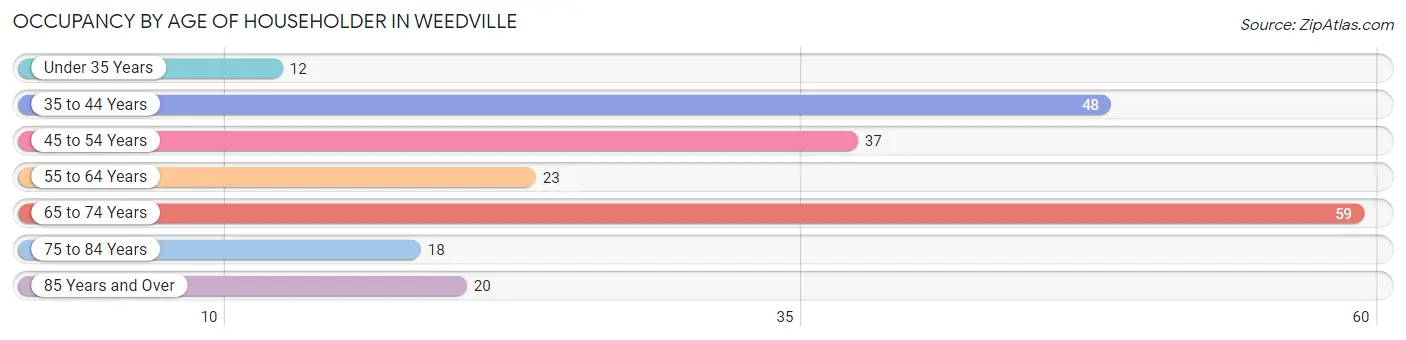
| Age Bracket | # Households | % Households |
| Under 35 Years | 12 | 5.5% |
| 35 to 44 Years | 48 | 22.1% |
| 45 to 54 Years | 37 | 17.1% |
| 55 to 64 Years | 23 | 10.6% |
| 65 to 74 Years | 59 | 27.2% |
| 75 to 84 Years | 18 | 8.3% |
| 85 Years and Over | 20 | 9.2% |
| Total | 217 | 100.0% |
Housing Finances in Weedville
Median Income by Occupancy in Weedville
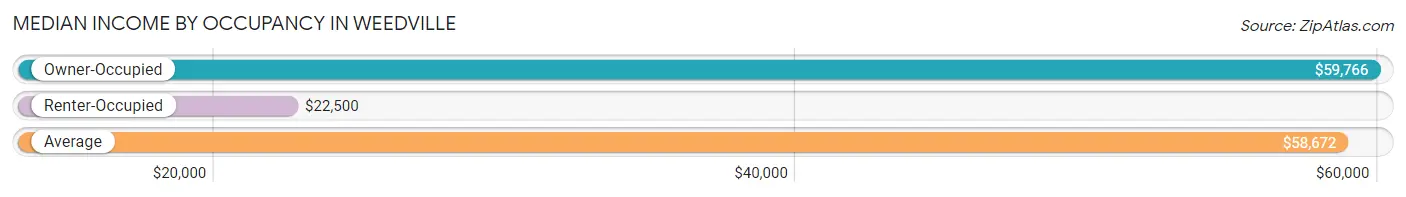
| Occupancy Type | # Households | Median Income |
| Owner-Occupied | 191 (88.0%) | $59,766 |
| Renter-Occupied | 26 (12.0%) | $22,500 |
| Average | 217 (100.0%) | $58,672 |
Occupancy by Householder Income Bracket in Weedville
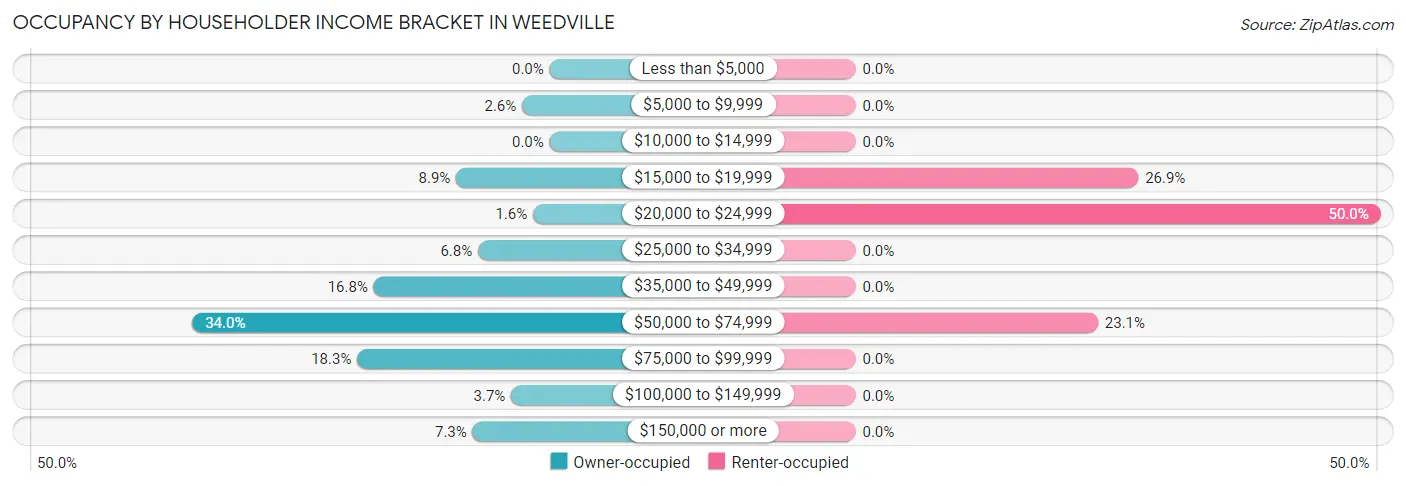
| Income Bracket | Owner-occupied | Renter-occupied |
| Less than $5,000 | 0 (0.0%) | 0 (0.0%) |
| $5,000 to $9,999 | 5 (2.6%) | 0 (0.0%) |
| $10,000 to $14,999 | 0 (0.0%) | 0 (0.0%) |
| $15,000 to $19,999 | 17 (8.9%) | 7 (26.9%) |
| $20,000 to $24,999 | 3 (1.6%) | 13 (50.0%) |
| $25,000 to $34,999 | 13 (6.8%) | 0 (0.0%) |
| $35,000 to $49,999 | 32 (16.8%) | 0 (0.0%) |
| $50,000 to $74,999 | 65 (34.0%) | 6 (23.1%) |
| $75,000 to $99,999 | 35 (18.3%) | 0 (0.0%) |
| $100,000 to $149,999 | 7 (3.7%) | 0 (0.0%) |
| $150,000 or more | 14 (7.3%) | 0 (0.0%) |
| Total | 191 (100.0%) | 26 (100.0%) |
Monthly Housing Cost Tiers in Weedville
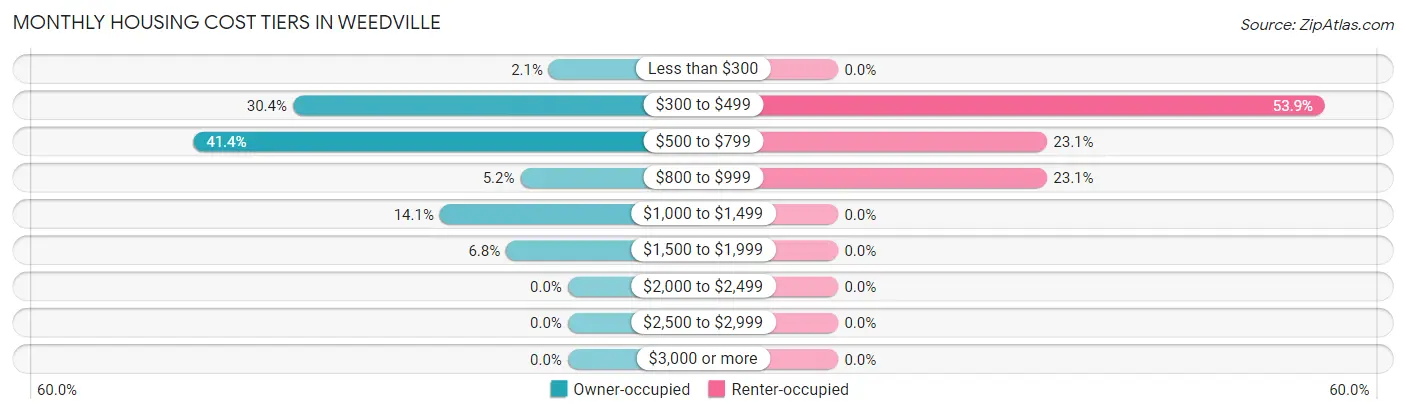
| Monthly Cost | Owner-occupied | Renter-occupied |
| Less than $300 | 4 (2.1%) | 0 (0.0%) |
| $300 to $499 | 58 (30.4%) | 14 (53.8%) |
| $500 to $799 | 79 (41.4%) | 6 (23.1%) |
| $800 to $999 | 10 (5.2%) | 6 (23.1%) |
| $1,000 to $1,499 | 27 (14.1%) | 0 (0.0%) |
| $1,500 to $1,999 | 13 (6.8%) | 0 (0.0%) |
| $2,000 to $2,499 | 0 (0.0%) | 0 (0.0%) |
| $2,500 to $2,999 | 0 (0.0%) | 0 (0.0%) |
| $3,000 or more | 0 (0.0%) | 0 (0.0%) |
| Total | 191 (100.0%) | 26 (100.0%) |
Physical Housing Characteristics in Weedville
Housing Structures in Weedville
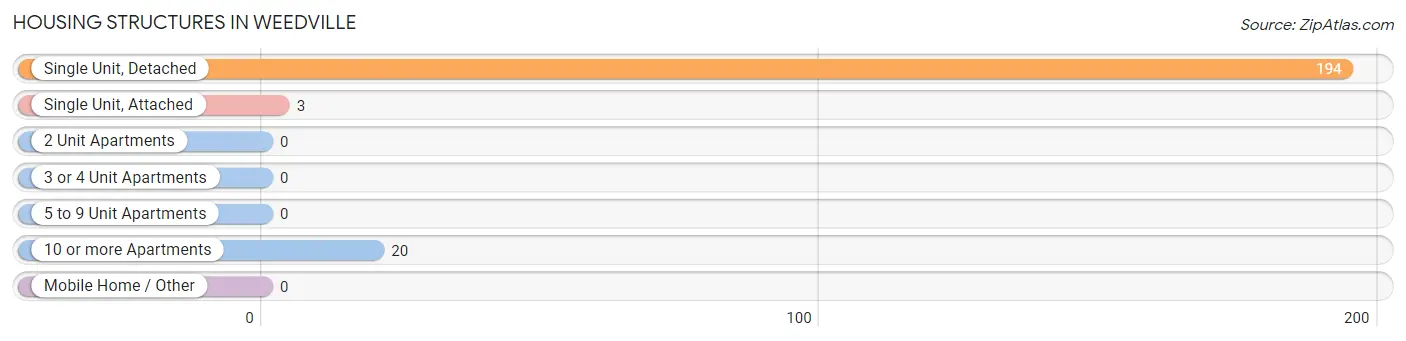
| Structure Type | # Housing Units | % Housing Units |
| Single Unit, Detached | 194 | 89.4% |
| Single Unit, Attached | 3 | 1.4% |
| 2 Unit Apartments | 0 | 0.0% |
| 3 or 4 Unit Apartments | 0 | 0.0% |
| 5 to 9 Unit Apartments | 0 | 0.0% |
| 10 or more Apartments | 20 | 9.2% |
| Mobile Home / Other | 0 | 0.0% |
| Total | 217 | 100.0% |
Housing Structures by Occupancy in Weedville
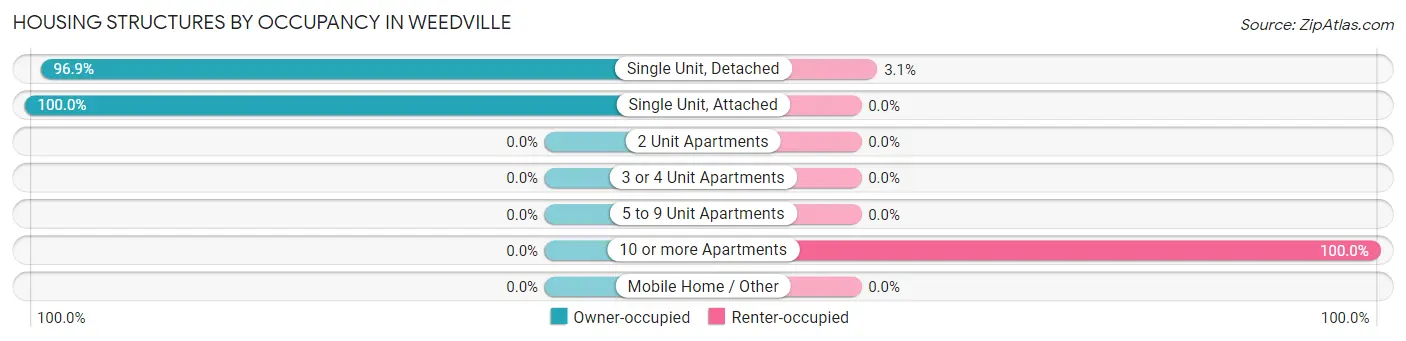
| Structure Type | Owner-occupied | Renter-occupied |
| Single Unit, Detached | 188 (96.9%) | 6 (3.1%) |
| Single Unit, Attached | 3 (100.0%) | 0 (0.0%) |
| 2 Unit Apartments | 0 (0.0%) | 0 (0.0%) |
| 3 or 4 Unit Apartments | 0 (0.0%) | 0 (0.0%) |
| 5 to 9 Unit Apartments | 0 (0.0%) | 0 (0.0%) |
| 10 or more Apartments | 0 (0.0%) | 20 (100.0%) |
| Mobile Home / Other | 0 (0.0%) | 0 (0.0%) |
| Total | 191 (88.0%) | 26 (12.0%) |
Housing Structures by Number of Rooms in Weedville
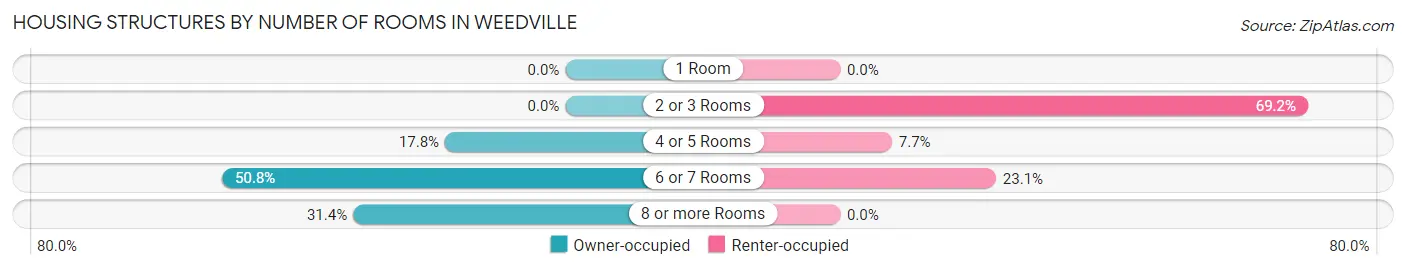
| Number of Rooms | Owner-occupied | Renter-occupied |
| 1 Room | 0 (0.0%) | 0 (0.0%) |
| 2 or 3 Rooms | 0 (0.0%) | 18 (69.2%) |
| 4 or 5 Rooms | 34 (17.8%) | 2 (7.7%) |
| 6 or 7 Rooms | 97 (50.8%) | 6 (23.1%) |
| 8 or more Rooms | 60 (31.4%) | 0 (0.0%) |
| Total | 191 (100.0%) | 26 (100.0%) |
Housing Structure by Heating Type in Weedville
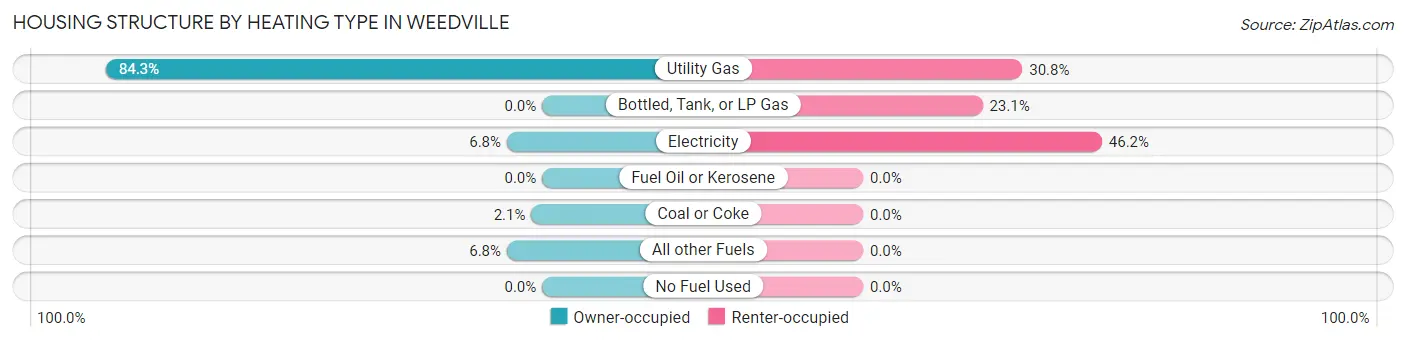
| Heating Type | Owner-occupied | Renter-occupied |
| Utility Gas | 161 (84.3%) | 8 (30.8%) |
| Bottled, Tank, or LP Gas | 0 (0.0%) | 6 (23.1%) |
| Electricity | 13 (6.8%) | 12 (46.2%) |
| Fuel Oil or Kerosene | 0 (0.0%) | 0 (0.0%) |
| Coal or Coke | 4 (2.1%) | 0 (0.0%) |
| All other Fuels | 13 (6.8%) | 0 (0.0%) |
| No Fuel Used | 0 (0.0%) | 0 (0.0%) |
| Total | 191 (100.0%) | 26 (100.0%) |
Household Vehicle Usage in Weedville
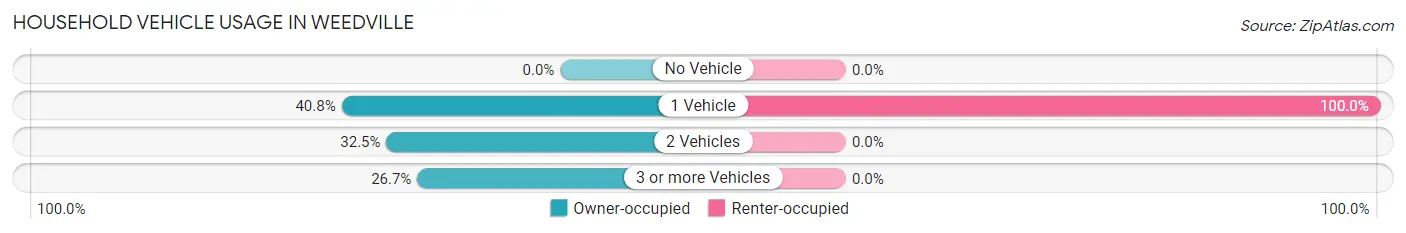
| Vehicles per Household | Owner-occupied | Renter-occupied |
| No Vehicle | 0 (0.0%) | 0 (0.0%) |
| 1 Vehicle | 78 (40.8%) | 26 (100.0%) |
| 2 Vehicles | 62 (32.5%) | 0 (0.0%) |
| 3 or more Vehicles | 51 (26.7%) | 0 (0.0%) |
| Total | 191 (100.0%) | 26 (100.0%) |
Real Estate & Mortgages in Weedville
Real Estate and Mortgage Overview in Weedville
| Characteristic | Without Mortgage | With Mortgage |
| Housing Units | 126 | 65 |
| Median Property Value | $121,200 | $121,900 |
| Median Household Income | $58,594 | $11 |
| Monthly Housing Costs | $504 | $0 |
| Real Estate Taxes | $1,650 | $0 |
Property Value by Mortgage Status in Weedville
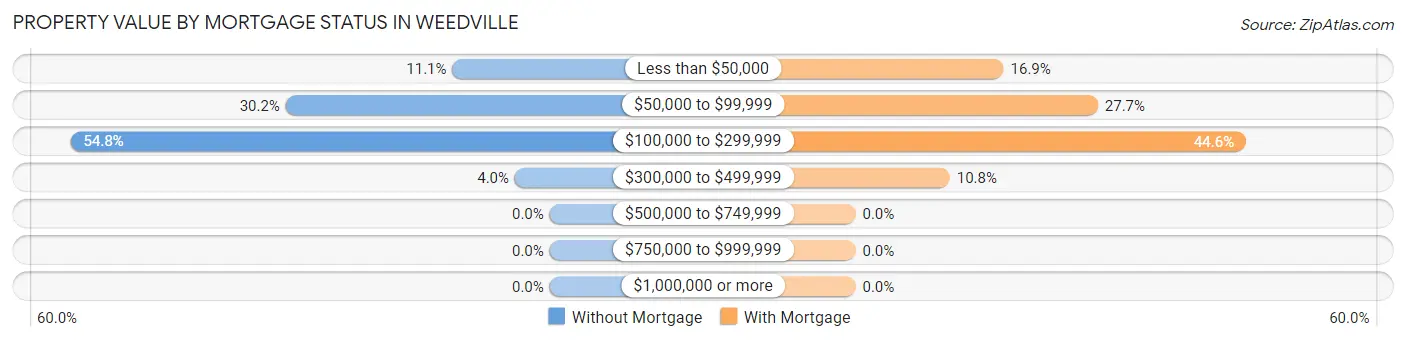
| Property Value | Without Mortgage | With Mortgage |
| Less than $50,000 | 14 (11.1%) | 11 (16.9%) |
| $50,000 to $99,999 | 38 (30.2%) | 18 (27.7%) |
| $100,000 to $299,999 | 69 (54.8%) | 29 (44.6%) |
| $300,000 to $499,999 | 5 (4.0%) | 7 (10.8%) |
| $500,000 to $749,999 | 0 (0.0%) | 0 (0.0%) |
| $750,000 to $999,999 | 0 (0.0%) | 0 (0.0%) |
| $1,000,000 or more | 0 (0.0%) | 0 (0.0%) |
| Total | 126 (100.0%) | 65 (100.0%) |
Household Income by Mortgage Status in Weedville
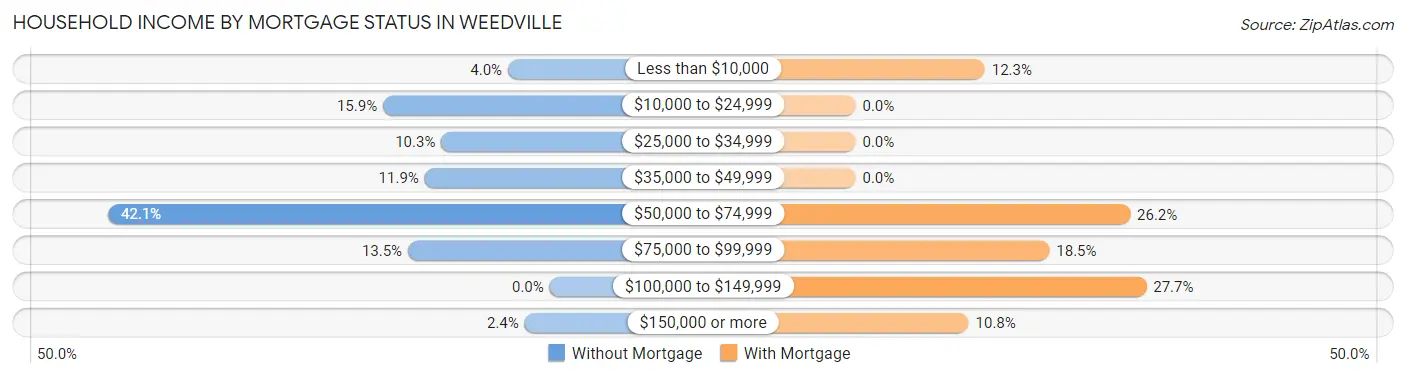
| Household Income | Without Mortgage | With Mortgage |
| Less than $10,000 | 5 (4.0%) | 8 (12.3%) |
| $10,000 to $24,999 | 20 (15.9%) | 0 (0.0%) |
| $25,000 to $34,999 | 13 (10.3%) | 0 (0.0%) |
| $35,000 to $49,999 | 15 (11.9%) | 0 (0.0%) |
| $50,000 to $74,999 | 53 (42.1%) | 17 (26.2%) |
| $75,000 to $99,999 | 17 (13.5%) | 12 (18.5%) |
| $100,000 to $149,999 | 0 (0.0%) | 18 (27.7%) |
| $150,000 or more | 3 (2.4%) | 7 (10.8%) |
| Total | 126 (100.0%) | 65 (100.0%) |
Property Value to Household Income Ratio in Weedville
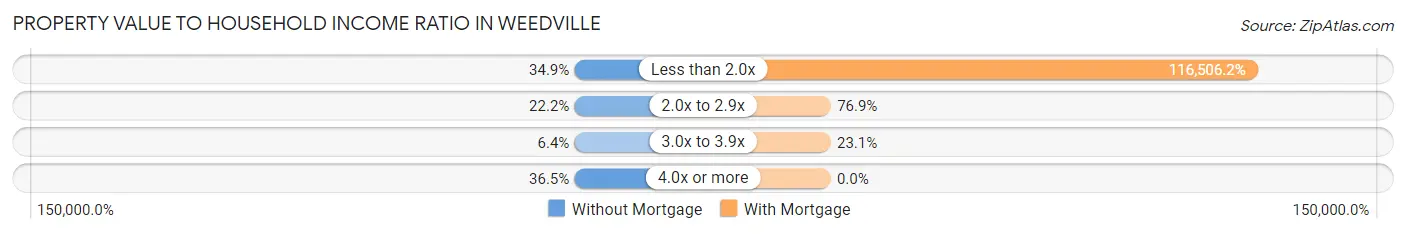
| Value-to-Income Ratio | Without Mortgage | With Mortgage |
| Less than 2.0x | 44 (34.9%) | 75,729 (116,506.2%) |
| 2.0x to 2.9x | 28 (22.2%) | 50 (76.9%) |
| 3.0x to 3.9x | 8 (6.4%) | 15 (23.1%) |
| 4.0x or more | 46 (36.5%) | 0 (0.0%) |
| Total | 126 (100.0%) | 65 (100.0%) |
Real Estate Taxes by Mortgage Status in Weedville
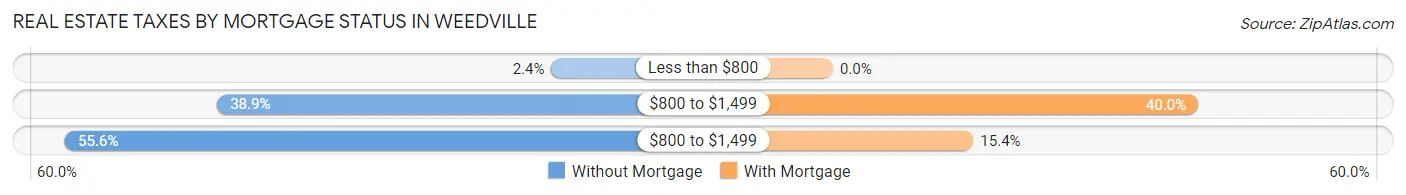
| Property Taxes | Without Mortgage | With Mortgage |
| Less than $800 | 3 (2.4%) | 0 (0.0%) |
| $800 to $1,499 | 49 (38.9%) | 26 (40.0%) |
| $800 to $1,499 | 70 (55.6%) | 10 (15.4%) |
| Total | 126 (100.0%) | 65 (100.0%) |
Health & Disability in Weedville
Health Insurance Coverage by Age in Weedville
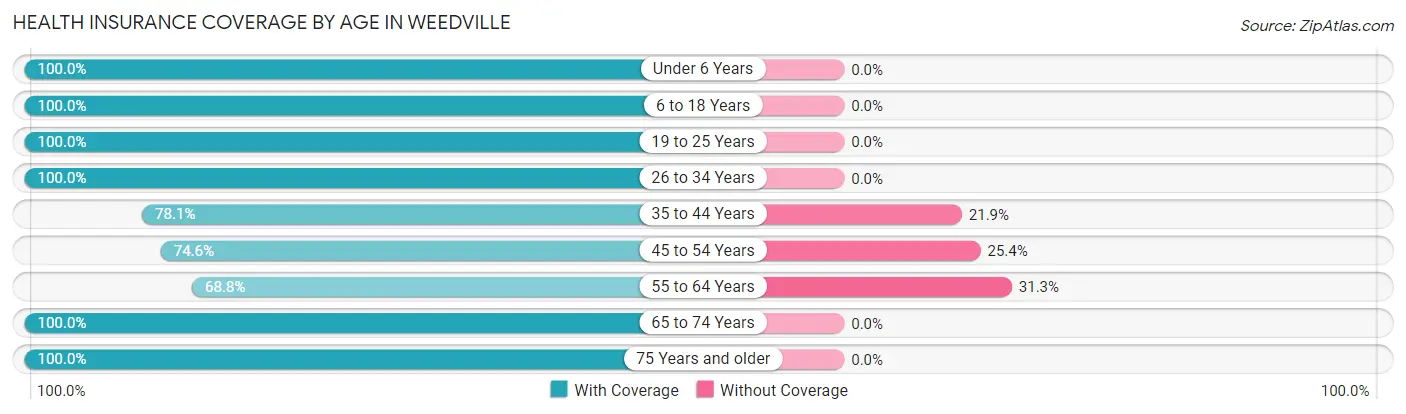
| Age Bracket | With Coverage | Without Coverage |
| Under 6 Years | 103 (100.0%) | 0 (0.0%) |
| 6 to 18 Years | 50 (100.0%) | 0 (0.0%) |
| 19 to 25 Years | 90 (100.0%) | 0 (0.0%) |
| 26 to 34 Years | 31 (100.0%) | 0 (0.0%) |
| 35 to 44 Years | 57 (78.1%) | 16 (21.9%) |
| 45 to 54 Years | 91 (74.6%) | 31 (25.4%) |
| 55 to 64 Years | 22 (68.8%) | 10 (31.2%) |
| 65 to 74 Years | 94 (100.0%) | 0 (0.0%) |
| 75 Years and older | 57 (100.0%) | 0 (0.0%) |
| Total | 595 (91.3%) | 57 (8.7%) |
Health Insurance Coverage by Citizenship Status in Weedville
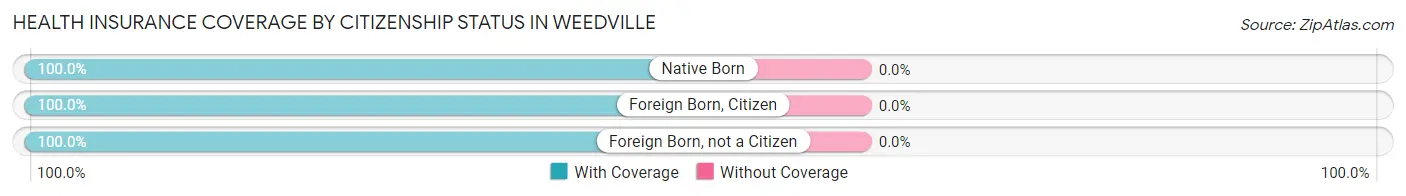
| Citizenship Status | With Coverage | Without Coverage |
| Native Born | 103 (100.0%) | 0 (0.0%) |
| Foreign Born, Citizen | 50 (100.0%) | 0 (0.0%) |
| Foreign Born, not a Citizen | 90 (100.0%) | 0 (0.0%) |
Health Insurance Coverage by Household Income in Weedville
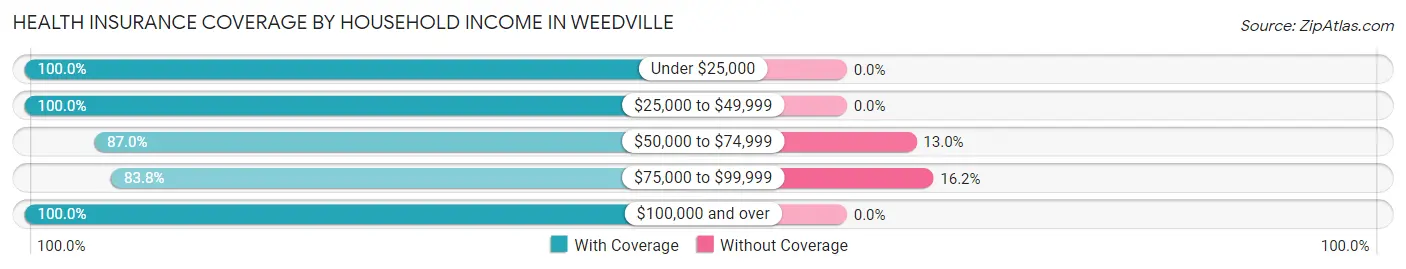
| Household Income | With Coverage | Without Coverage |
| Under $25,000 | 70 (100.0%) | 0 (0.0%) |
| $25,000 to $49,999 | 102 (100.0%) | 0 (0.0%) |
| $50,000 to $74,999 | 260 (87.0%) | 39 (13.0%) |
| $75,000 to $99,999 | 93 (83.8%) | 18 (16.2%) |
| $100,000 and over | 70 (100.0%) | 0 (0.0%) |
Public vs Private Health Insurance Coverage by Age in Weedville
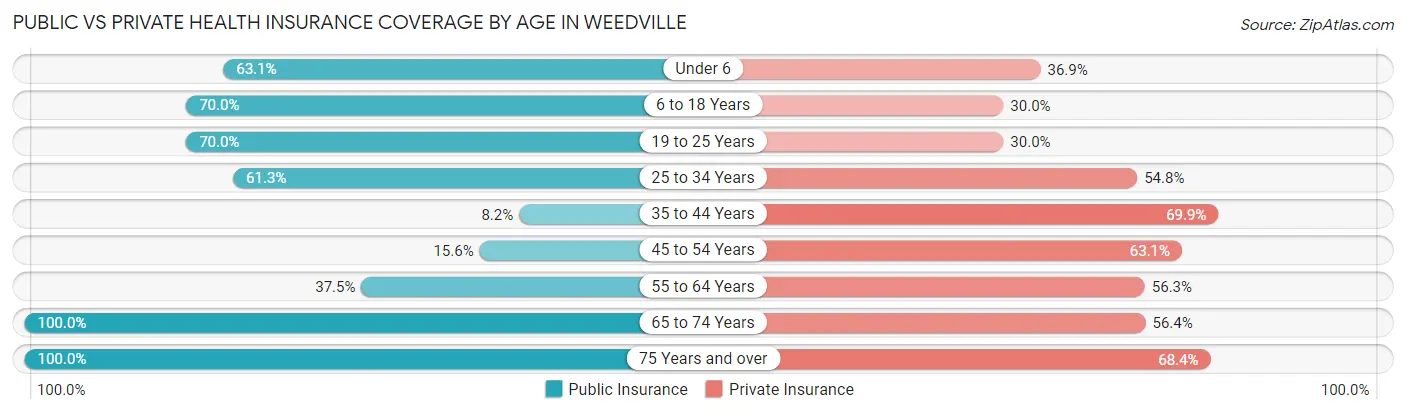
| Age Bracket | Public Insurance | Private Insurance |
| Under 6 | 65 (63.1%) | 38 (36.9%) |
| 6 to 18 Years | 35 (70.0%) | 15 (30.0%) |
| 19 to 25 Years | 63 (70.0%) | 27 (30.0%) |
| 25 to 34 Years | 19 (61.3%) | 17 (54.8%) |
| 35 to 44 Years | 6 (8.2%) | 51 (69.9%) |
| 45 to 54 Years | 19 (15.6%) | 77 (63.1%) |
| 55 to 64 Years | 12 (37.5%) | 18 (56.2%) |
| 65 to 74 Years | 94 (100.0%) | 53 (56.4%) |
| 75 Years and over | 57 (100.0%) | 39 (68.4%) |
| Total | 370 (56.8%) | 335 (51.4%) |
Disability Status by Sex by Age in Weedville
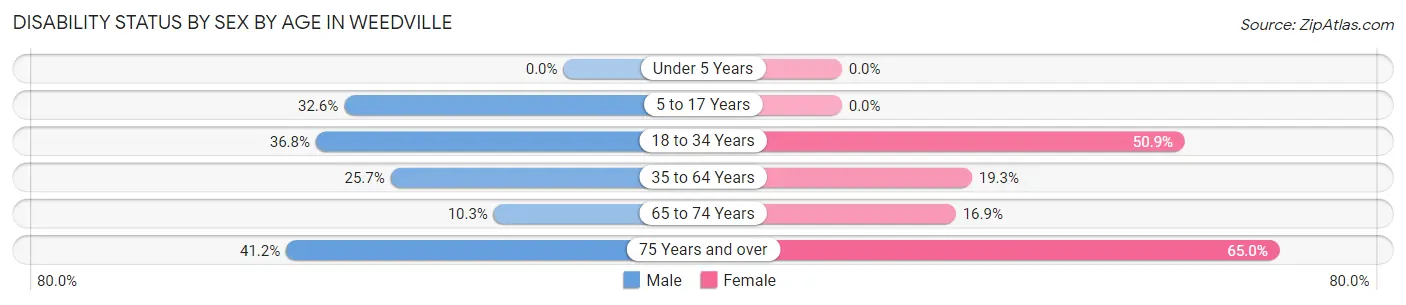
| Age Bracket | Male | Female |
| Under 5 Years | 0 (0.0%) | 0 (0.0%) |
| 5 to 17 Years | 14 (32.6%) | 0 (0.0%) |
| 18 to 34 Years | 25 (36.8%) | 27 (50.9%) |
| 35 to 64 Years | 29 (25.7%) | 22 (19.3%) |
| 65 to 74 Years | 3 (10.3%) | 11 (16.9%) |
| 75 Years and over | 7 (41.2%) | 26 (65.0%) |
Disability Class by Sex by Age in Weedville
Disability Class: Hearing Difficulty
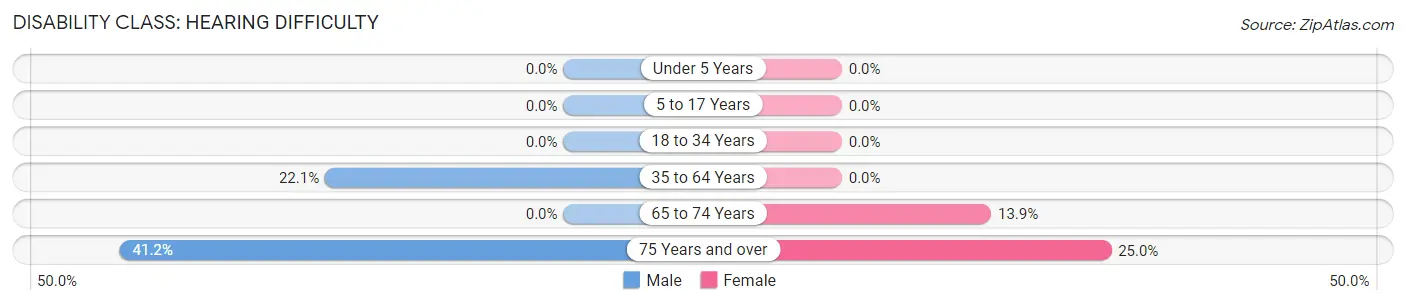
| Age Bracket | Male | Female |
| Under 5 Years | 0 (0.0%) | 0 (0.0%) |
| 5 to 17 Years | 0 (0.0%) | 0 (0.0%) |
| 18 to 34 Years | 0 (0.0%) | 0 (0.0%) |
| 35 to 64 Years | 25 (22.1%) | 0 (0.0%) |
| 65 to 74 Years | 0 (0.0%) | 9 (13.9%) |
| 75 Years and over | 7 (41.2%) | 10 (25.0%) |
Disability Class: Vision Difficulty
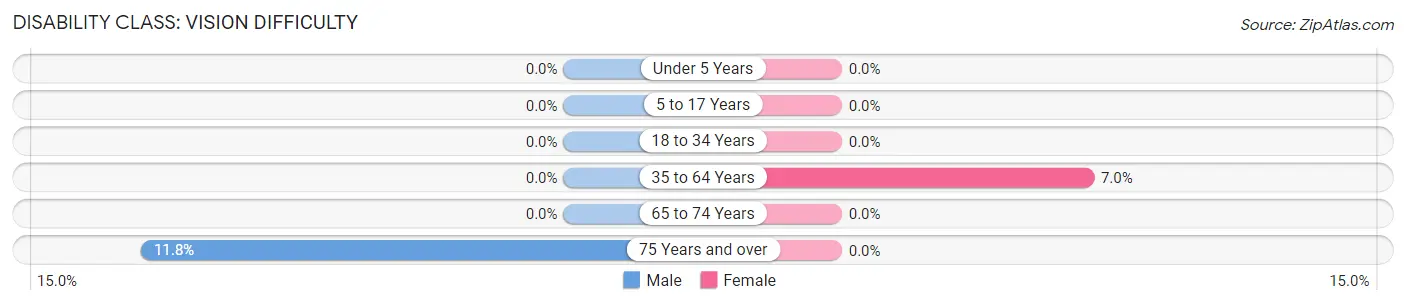
| Age Bracket | Male | Female |
| Under 5 Years | 0 (0.0%) | 0 (0.0%) |
| 5 to 17 Years | 0 (0.0%) | 0 (0.0%) |
| 18 to 34 Years | 0 (0.0%) | 0 (0.0%) |
| 35 to 64 Years | 0 (0.0%) | 8 (7.0%) |
| 65 to 74 Years | 0 (0.0%) | 0 (0.0%) |
| 75 Years and over | 2 (11.8%) | 0 (0.0%) |
Disability Class: Cognitive Difficulty
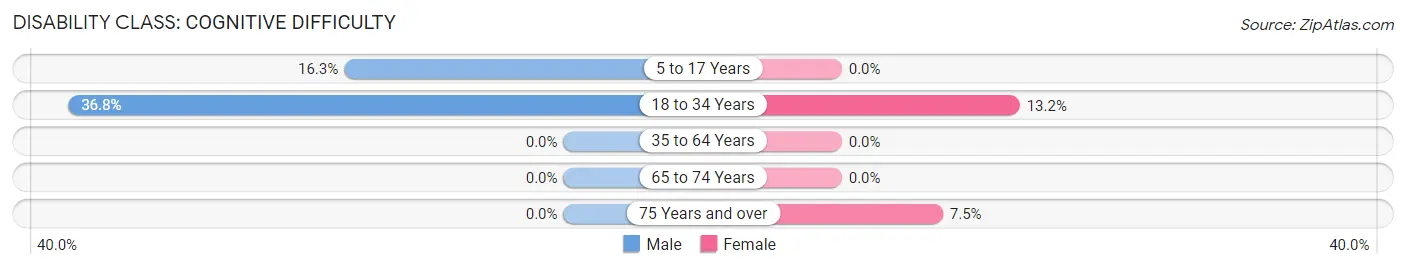
| Age Bracket | Male | Female |
| 5 to 17 Years | 7 (16.3%) | 0 (0.0%) |
| 18 to 34 Years | 25 (36.8%) | 7 (13.2%) |
| 35 to 64 Years | 0 (0.0%) | 0 (0.0%) |
| 65 to 74 Years | 0 (0.0%) | 0 (0.0%) |
| 75 Years and over | 0 (0.0%) | 3 (7.5%) |
Disability Class: Ambulatory Difficulty
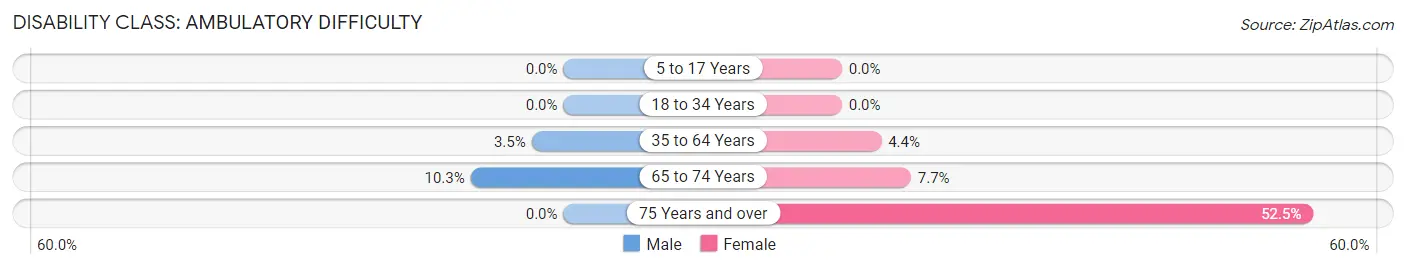
| Age Bracket | Male | Female |
| 5 to 17 Years | 0 (0.0%) | 0 (0.0%) |
| 18 to 34 Years | 0 (0.0%) | 0 (0.0%) |
| 35 to 64 Years | 4 (3.5%) | 5 (4.4%) |
| 65 to 74 Years | 3 (10.3%) | 5 (7.7%) |
| 75 Years and over | 0 (0.0%) | 21 (52.5%) |
Disability Class: Self-Care Difficulty
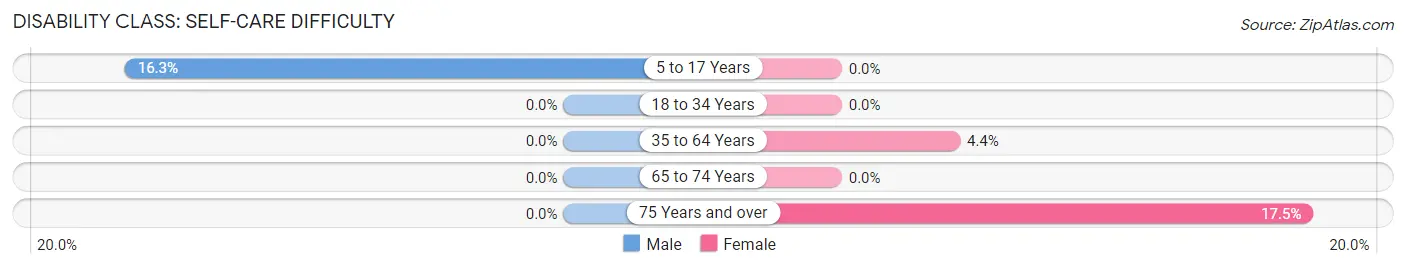
| Age Bracket | Male | Female |
| 5 to 17 Years | 7 (16.3%) | 0 (0.0%) |
| 18 to 34 Years | 0 (0.0%) | 0 (0.0%) |
| 35 to 64 Years | 0 (0.0%) | 5 (4.4%) |
| 65 to 74 Years | 0 (0.0%) | 0 (0.0%) |
| 75 Years and over | 0 (0.0%) | 7 (17.5%) |
Technology Access in Weedville
Computing Device Access in Weedville
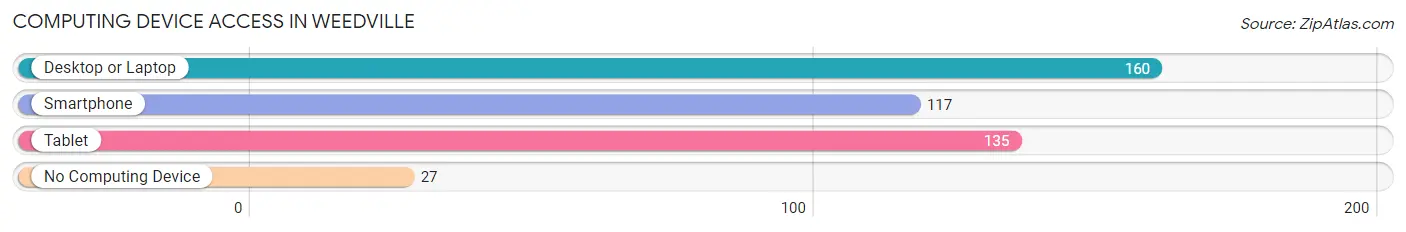
| Device Type | # Households | % Households |
| Desktop or Laptop | 160 | 73.7% |
| Smartphone | 117 | 53.9% |
| Tablet | 135 | 62.2% |
| No Computing Device | 27 | 12.4% |
| Total | 217 | 100.0% |
Internet Access in Weedville
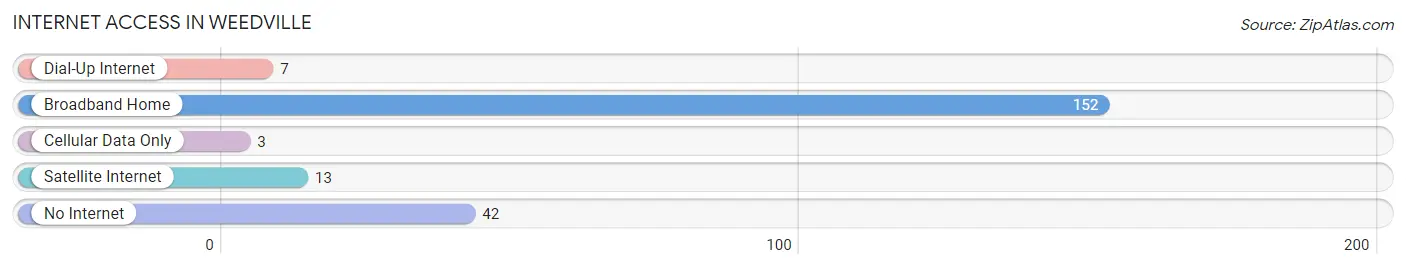
| Internet Type | # Households | % Households |
| Dial-Up Internet | 7 | 3.2% |
| Broadband Home | 152 | 70.1% |
| Cellular Data Only | 3 | 1.4% |
| Satellite Internet | 13 | 6.0% |
| No Internet | 42 | 19.4% |
| Total | 217 | 100.0% |
Weedville Summary
Weedville is a small borough located in Elk County, Pennsylvania. It is situated in the northwest corner of the state, about 20 miles south of the New York border. The population of Weedville was 545 at the 2010 census.
History
Weedville was founded in 1845 by William Weed, a lumberman from New York. He purchased a large tract of land in the area and began to develop it into a small town. The town was originally called “Weed’s Town”, but the name was changed to Weedville in 1848.
The town grew slowly but steadily over the years, and by the early 1900s it had become a thriving community. The town was home to several businesses, including a sawmill, a grist mill, a tannery, and a general store.
In the early 1900s, the town was also home to a large number of Italian immigrants who had come to the area to work in the lumber industry. These immigrants helped to shape the culture of Weedville, and many of their descendants still live in the area today.
Geography
Weedville is located in the northwest corner of Pennsylvania, about 20 miles south of the New York border. The town is situated in a valley surrounded by hills and mountains. The nearest major city is Erie, which is about 40 miles to the north.
The climate in Weedville is generally mild, with cold winters and warm summers. The average annual temperature is around 50 degrees Fahrenheit.
Economy
The economy of Weedville is largely based on the lumber industry. The town is home to several sawmills and other related businesses. In addition, there are several small businesses in the area, including a general store, a hardware store, and a few restaurants.
The town also has a small tourism industry with several bed and breakfasts and other attractions
Demographics
As of the 2010 census, the population of Weedville was 545. The racial makeup of the town was 97.3% White, 0.7% African American, 0.2% Native American, 0.2% Asian, and 1.6% from other races.
The median household income in Weedville was $35,625, and the median family income was $41,250. The per capita income was $17,813. About 11.3% of the population was below the poverty line.
Conclusion
Weedville is a small borough located in Elk County, Pennsylvania. It was founded in 1845 by William Weed, and has since grown into a thriving community. The economy of Weedville is largely based on the lumber industry, and the town is also home to several small businesses. The population of Weedville was 545 at the 2010 census, and the median household income was $35,625.
Common Questions
What is Per Capita Income in Weedville?
Per Capita income in Weedville is $22,523.
What is the Median Family Income in Weedville?
Median Family Income in Weedville is $64,615.
What is the Median Household income in Weedville?
Median Household Income in Weedville is $58,672.
What is Income or Wage Gap in Weedville?
Income or Wage Gap in Weedville is 52.1%.
Women in Weedville earn 47.9 cents for every dollar earned by a man.
What is Inequality or Gini Index in Weedville?
Inequality or Gini Index in Weedville is 0.37.
What is the Total Population of Weedville?
Total Population of Weedville is 652.
What is the Total Male Population of Weedville?
Total Male Population of Weedville is 288.
What is the Total Female Population of Weedville?
Total Female Population of Weedville is 364.
What is the Ratio of Males per 100 Females in Weedville?
There are 79.12 Males per 100 Females in Weedville.
What is the Ratio of Females per 100 Males in Weedville?
There are 126.39 Females per 100 Males in Weedville.
What is the Median Population Age in Weedville?
Median Population Age in Weedville is 44.1 Years.
What is the Average Family Size in Weedville
Average Family Size in Weedville is 3.4 People.
What is the Average Household Size in Weedville
Average Household Size in Weedville is 3.0 People.
How Large is the Labor Force in Weedville?
There are 263 People in the Labor Forcein in Weedville.
What is the Percentage of People in the Labor Force in Weedville?
51.5% of People are in the Labor Force in Weedville.
What is the Unemployment Rate in Weedville?
Unemployment Rate in Weedville is 13.7%.