Cities with the Highest Percentage of Population Employed in Administrative & Support Services in Tennessee
RELATED REPORTS & OPTIONS
Administrative & Support Services
Tennessee
Compare Cities
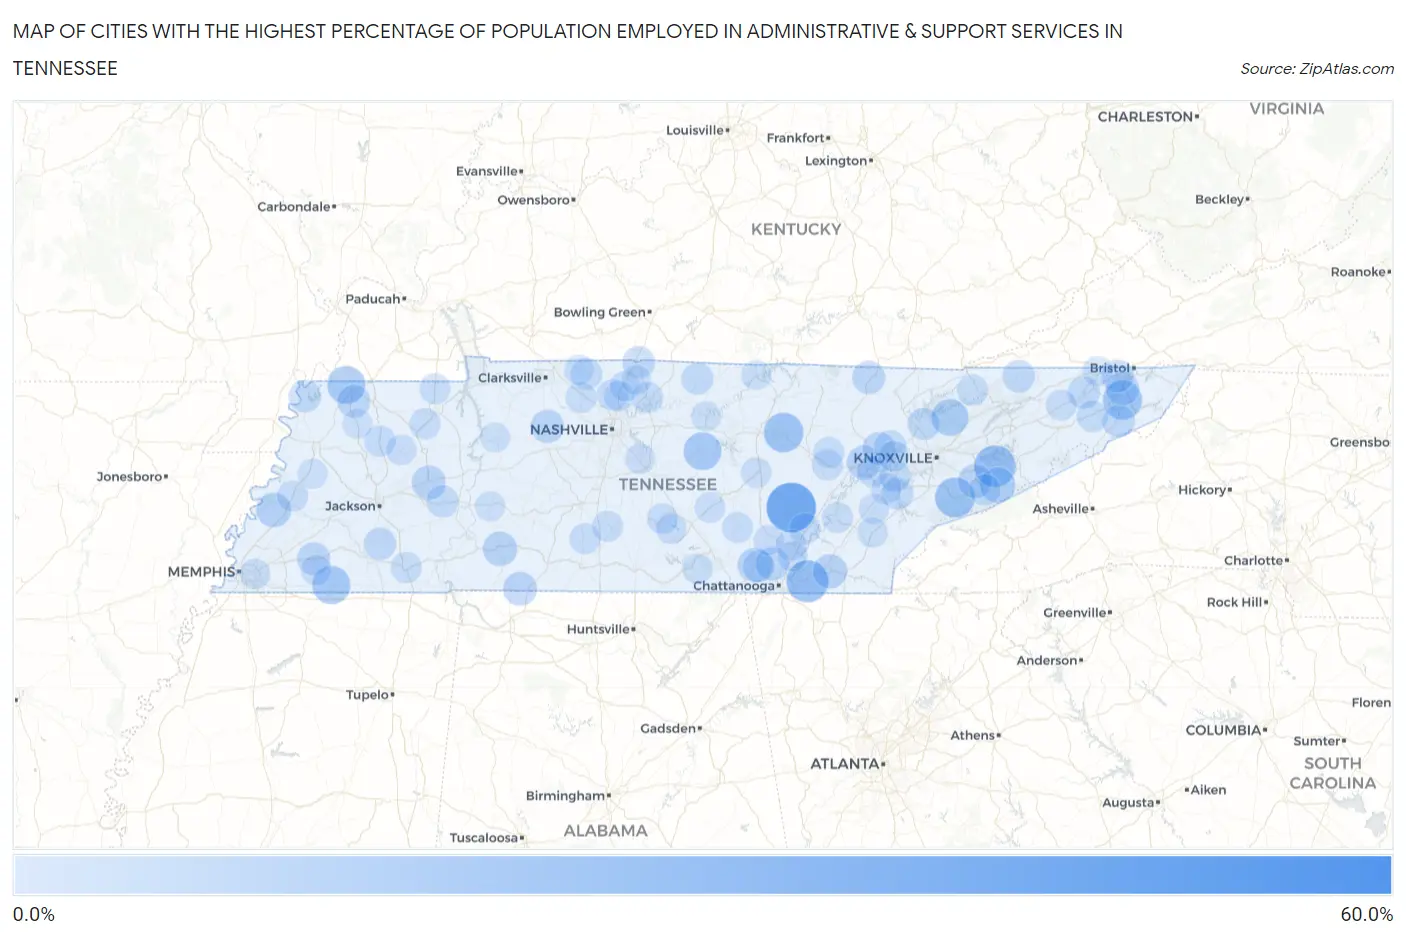
Map of Cities with the Highest Percentage of Population Employed in Administrative & Support Services in Tennessee
0.0%
60.0%
Cities with the Highest Percentage of Population Employed in Administrative & Support Services in Tennessee
| City | % Employed | vs State | vs National | |
| 1. | Farner | 57.5% | 4.4%(+53.1)#1 | 4.1%(+53.4)#36 |
| 2. | Bogota | 52.5% | 4.4%(+48.2)#2 | 4.1%(+48.4)#50 |
| 3. | Essary Springs | 50.0% | 4.4%(+45.6)#3 | 4.1%(+45.9)#58 |
| 4. | Pikeville | 41.6% | 4.4%(+37.3)#4 | 4.1%(+37.5)#96 |
| 5. | Rarity Bay | 41.2% | 4.4%(+36.9)#5 | 4.1%(+37.1)#99 |
| 6. | Ooltewah | 27.3% | 4.4%(+22.9)#6 | 4.1%(+23.1)#234 |
| 7. | Fairgarden | 26.4% | 4.4%(+22.1)#7 | 4.1%(+22.3)#249 |
| 8. | Townsend | 23.4% | 4.4%(+19.1)#8 | 4.1%(+19.3)#328 |
| 9. | Monterey | 22.8% | 4.4%(+18.5)#9 | 4.1%(+18.7)#350 |
| 10. | Watauga | 22.1% | 4.4%(+17.8)#10 | 4.1%(+18.0)#372 |
| 11. | La Grange | 20.0% | 4.4%(+15.6)#11 | 4.1%(+15.9)#439 |
| 12. | Woodland Mills | 19.8% | 4.4%(+15.4)#12 | 4.1%(+15.6)#451 |
| 13. | Liberty | 19.5% | 4.4%(+15.1)#13 | 4.1%(+15.3)#464 |
| 14. | Holladay | 19.4% | 4.4%(+15.0)#14 | 4.1%(+15.2)#470 |
| 15. | Big Rock | 19.2% | 4.4%(+14.8)#15 | 4.1%(+15.0)#479 |
| 16. | Maynardville | 17.7% | 4.4%(+13.4)#16 | 4.1%(+13.6)#557 |
| 17. | Pittman Center | 15.2% | 4.4%(+10.9)#17 | 4.1%(+11.1)#770 |
| 18. | Garland | 13.9% | 4.4%(+9.55)#18 | 4.1%(+9.76)#957 |
| 19. | Whitwell | 13.7% | 4.4%(+9.32)#19 | 4.1%(+9.53)#997 |
| 20. | Waynesboro | 13.1% | 4.4%(+8.76)#20 | 4.1%(+8.96)#1,097 |
| 21. | East Cleveland | 13.1% | 4.4%(+8.70)#21 | 4.1%(+8.91)#1,105 |
| 22. | Parker S Crossroads | 12.8% | 4.4%(+8.48)#22 | 4.1%(+8.68)#1,149 |
| 23. | Harriman | 12.8% | 4.4%(+8.44)#23 | 4.1%(+8.64)#1,156 |
| 24. | Pigeon Forge | 12.8% | 4.4%(+8.42)#24 | 4.1%(+8.62)#1,163 |
| 25. | Ocoee | 12.3% | 4.4%(+7.95)#25 | 4.1%(+8.16)#1,244 |
| 26. | Iron City | 12.1% | 4.4%(+7.77)#26 | 4.1%(+7.97)#1,285 |
| 27. | Bluff City | 11.8% | 4.4%(+7.46)#27 | 4.1%(+7.66)#1,351 |
| 28. | Lone Oak | 11.7% | 4.4%(+7.33)#28 | 4.1%(+7.53)#1,383 |
| 29. | Charlotte | 11.3% | 4.4%(+6.91)#29 | 4.1%(+7.11)#1,474 |
| 30. | Oneida | 11.1% | 4.4%(+6.71)#30 | 4.1%(+6.91)#1,536 |
| 31. | Coalfield | 10.7% | 4.4%(+6.31)#31 | 4.1%(+6.51)#1,645 |
| 32. | Somerville | 10.6% | 4.4%(+6.27)#32 | 4.1%(+6.47)#1,656 |
| 33. | Rives | 10.6% | 4.4%(+6.24)#33 | 4.1%(+6.44)#1,671 |
| 34. | Sneedville | 10.2% | 4.4%(+5.81)#34 | 4.1%(+6.01)#1,832 |
| 35. | Blountville | 9.9% | 4.4%(+5.52)#35 | 4.1%(+5.73)#1,960 |
| 36. | Silerton | 9.8% | 4.4%(+5.40)#36 | 4.1%(+5.61)#2,016 |
| 37. | Unicoi | 9.7% | 4.4%(+5.31)#37 | 4.1%(+5.52)#2,047 |
| 38. | Tiptonville | 9.7% | 4.4%(+5.30)#38 | 4.1%(+5.51)#2,050 |
| 39. | Andersonville | 9.6% | 4.4%(+5.27)#39 | 4.1%(+5.48)#2,061 |
| 40. | Mitchellville | 9.6% | 4.4%(+5.26)#40 | 4.1%(+5.47)#2,065 |
| 41. | Fall Branch | 9.6% | 4.4%(+5.24)#41 | 4.1%(+5.44)#2,079 |
| 42. | Powells Crossroads | 9.2% | 4.4%(+4.84)#42 | 4.1%(+5.05)#2,263 |
| 43. | Chesterfield | 9.2% | 4.4%(+4.84)#43 | 4.1%(+5.05)#2,265 |
| 44. | Oliver Springs | 9.1% | 4.4%(+4.73)#44 | 4.1%(+4.93)#2,335 |
| 45. | Lafayette | 9.1% | 4.4%(+4.71)#45 | 4.1%(+4.92)#2,343 |
| 46. | Tellico Village | 9.0% | 4.4%(+4.64)#46 | 4.1%(+4.84)#2,383 |
| 47. | Luray | 8.4% | 4.4%(+4.04)#47 | 4.1%(+4.25)#2,739 |
| 48. | Cedar Hill | 8.3% | 4.4%(+3.94)#48 | 4.1%(+4.14)#2,812 |
| 49. | Hickman | 8.3% | 4.4%(+3.93)#49 | 4.1%(+4.13)#2,820 |
| 50. | Telford | 8.3% | 4.4%(+3.90)#50 | 4.1%(+4.10)#2,833 |
| 51. | Lenoir City | 8.1% | 4.4%(+3.75)#51 | 4.1%(+3.96)#2,928 |
| 52. | Bradford | 8.1% | 4.4%(+3.74)#52 | 4.1%(+3.95)#2,930 |
| 53. | Ridgetop | 8.1% | 4.4%(+3.73)#53 | 4.1%(+3.94)#2,936 |
| 54. | Mayland | 7.9% | 4.4%(+3.56)#54 | 4.1%(+3.76)#3,057 |
| 55. | Gallatin | 7.9% | 4.4%(+3.51)#55 | 4.1%(+3.72)#3,099 |
| 56. | Kingston | 7.8% | 4.4%(+3.41)#56 | 4.1%(+3.61)#3,172 |
| 57. | Gatlinburg | 7.8% | 4.4%(+3.41)#57 | 4.1%(+3.61)#3,173 |
| 58. | Graysville | 7.7% | 4.4%(+3.30)#58 | 4.1%(+3.50)#3,265 |
| 59. | Henry | 7.5% | 4.4%(+3.16)#59 | 4.1%(+3.36)#3,379 |
| 60. | Crab Orchard | 7.5% | 4.4%(+3.11)#60 | 4.1%(+3.31)#3,440 |
| 61. | Henning | 7.4% | 4.4%(+3.05)#61 | 4.1%(+3.26)#3,484 |
| 62. | Selmer | 7.4% | 4.4%(+3.05)#62 | 4.1%(+3.25)#3,501 |
| 63. | Fairfield Glade | 7.3% | 4.4%(+2.98)#63 | 4.1%(+3.18)#3,557 |
| 64. | Lynnville | 7.3% | 4.4%(+2.98)#64 | 4.1%(+3.18)#3,558 |
| 65. | Flat Top Mountain | 7.3% | 4.4%(+2.94)#65 | 4.1%(+3.15)#3,590 |
| 66. | Beersheba Springs | 7.3% | 4.4%(+2.90)#66 | 4.1%(+3.10)#3,632 |
| 67. | Lewisburg | 7.2% | 4.4%(+2.81)#67 | 4.1%(+3.01)#3,717 |
| 68. | Decatur | 7.1% | 4.4%(+2.78)#68 | 4.1%(+2.98)#3,770 |
| 69. | New Tazewell | 7.1% | 4.4%(+2.75)#69 | 4.1%(+2.95)#3,794 |
| 70. | Pleasant View | 7.0% | 4.4%(+2.69)#70 | 4.1%(+2.89)#3,860 |
| 71. | Puryear | 6.9% | 4.4%(+2.58)#71 | 4.1%(+2.78)#3,960 |
| 72. | Oak Ridge | 6.9% | 4.4%(+2.55)#72 | 4.1%(+2.75)#3,983 |
| 73. | Baileyton | 6.9% | 4.4%(+2.54)#73 | 4.1%(+2.75)#3,992 |
| 74. | Normandy | 6.9% | 4.4%(+2.54)#74 | 4.1%(+2.75)#3,998 |
| 75. | Wartrace | 6.9% | 4.4%(+2.50)#75 | 4.1%(+2.71)#4,044 |
| 76. | Dunlap | 6.7% | 4.4%(+2.36)#76 | 4.1%(+2.57)#4,174 |
| 77. | Morrison | 6.7% | 4.4%(+2.36)#77 | 4.1%(+2.56)#4,178 |
| 78. | Doyle | 6.5% | 4.4%(+2.18)#78 | 4.1%(+2.38)#4,394 |
| 79. | Loudon | 6.5% | 4.4%(+2.13)#79 | 4.1%(+2.33)#4,462 |
| 80. | Williston | 6.4% | 4.4%(+2.08)#80 | 4.1%(+2.29)#4,519 |
| 81. | Trezevant | 6.4% | 4.4%(+2.08)#81 | 4.1%(+2.28)#4,525 |
| 82. | Millersville | 6.4% | 4.4%(+2.08)#82 | 4.1%(+2.28)#4,530 |
| 83. | Soddy Daisy | 6.2% | 4.4%(+1.89)#83 | 4.1%(+2.09)#4,788 |
| 84. | Sweetwater | 6.2% | 4.4%(+1.82)#84 | 4.1%(+2.02)#4,873 |
| 85. | Memphis | 6.2% | 4.4%(+1.81)#85 | 4.1%(+2.01)#4,891 |
| 86. | Beech Bluff | 6.1% | 4.4%(+1.74)#86 | 4.1%(+1.94)#4,991 |
| 87. | White House | 6.1% | 4.4%(+1.71)#87 | 4.1%(+1.92)#5,032 |
| 88. | Smyrna | 6.0% | 4.4%(+1.69)#88 | 4.1%(+1.89)#5,060 |
| 89. | Englewood | 6.0% | 4.4%(+1.64)#89 | 4.1%(+1.84)#5,156 |
| 90. | Cowan | 6.0% | 4.4%(+1.64)#90 | 4.1%(+1.84)#5,163 |
| 91. | Bloomingdale | 5.9% | 4.4%(+1.52)#91 | 4.1%(+1.72)#5,353 |
| 92. | Bon Air | 5.8% | 4.4%(+1.49)#92 | 4.1%(+1.69)#5,401 |
| 93. | Gates | 5.8% | 4.4%(+1.48)#93 | 4.1%(+1.68)#5,414 |
| 94. | Kenton | 5.8% | 4.4%(+1.42)#94 | 4.1%(+1.62)#5,497 |
| 95. | Waverly | 5.7% | 4.4%(+1.38)#95 | 4.1%(+1.59)#5,561 |
| 96. | Linden | 5.7% | 4.4%(+1.38)#96 | 4.1%(+1.58)#5,564 |
| 97. | Celina | 5.7% | 4.4%(+1.30)#97 | 4.1%(+1.51)#5,703 |
| 98. | Adams | 5.6% | 4.4%(+1.28)#98 | 4.1%(+1.48)#5,744 |
| 99. | Carthage | 5.6% | 4.4%(+1.27)#99 | 4.1%(+1.48)#5,750 |
| 100. | New Deal | 5.6% | 4.4%(+1.20)#100 | 4.1%(+1.41)#5,882 |
Common Questions
What are the Top 10 Cities with the Highest Percentage of Population Employed in Administrative & Support Services in Tennessee?
Top 10 Cities with the Highest Percentage of Population Employed in Administrative & Support Services in Tennessee are:
#1
41.6%
#2
27.3%
#3
26.4%
#4
23.4%
#5
22.8%
#6
22.1%
#7
20.0%
#8
19.8%
#9
19.5%
#10
17.7%
What city has the Highest Percentage of Population Employed in Administrative & Support Services in Tennessee?
Pikeville has the Highest Percentage of Population Employed in Administrative & Support Services in Tennessee with 41.6%.
What is the Percentage of Population Employed in Administrative & Support Services in the State of Tennessee?
Percentage of Population Employed in Administrative & Support Services in Tennessee is 4.4%.
What is the Percentage of Population Employed in Administrative & Support Services in the United States?
Percentage of Population Employed in Administrative & Support Services in the United States is 4.1%.