Zip Codes with the Highest Percentage of Population Employed in Administrative & Support Services in Hazleton, PA
RELATED REPORTS & OPTIONS
Administrative & Support Services
Hazleton
Compare Zip Codes
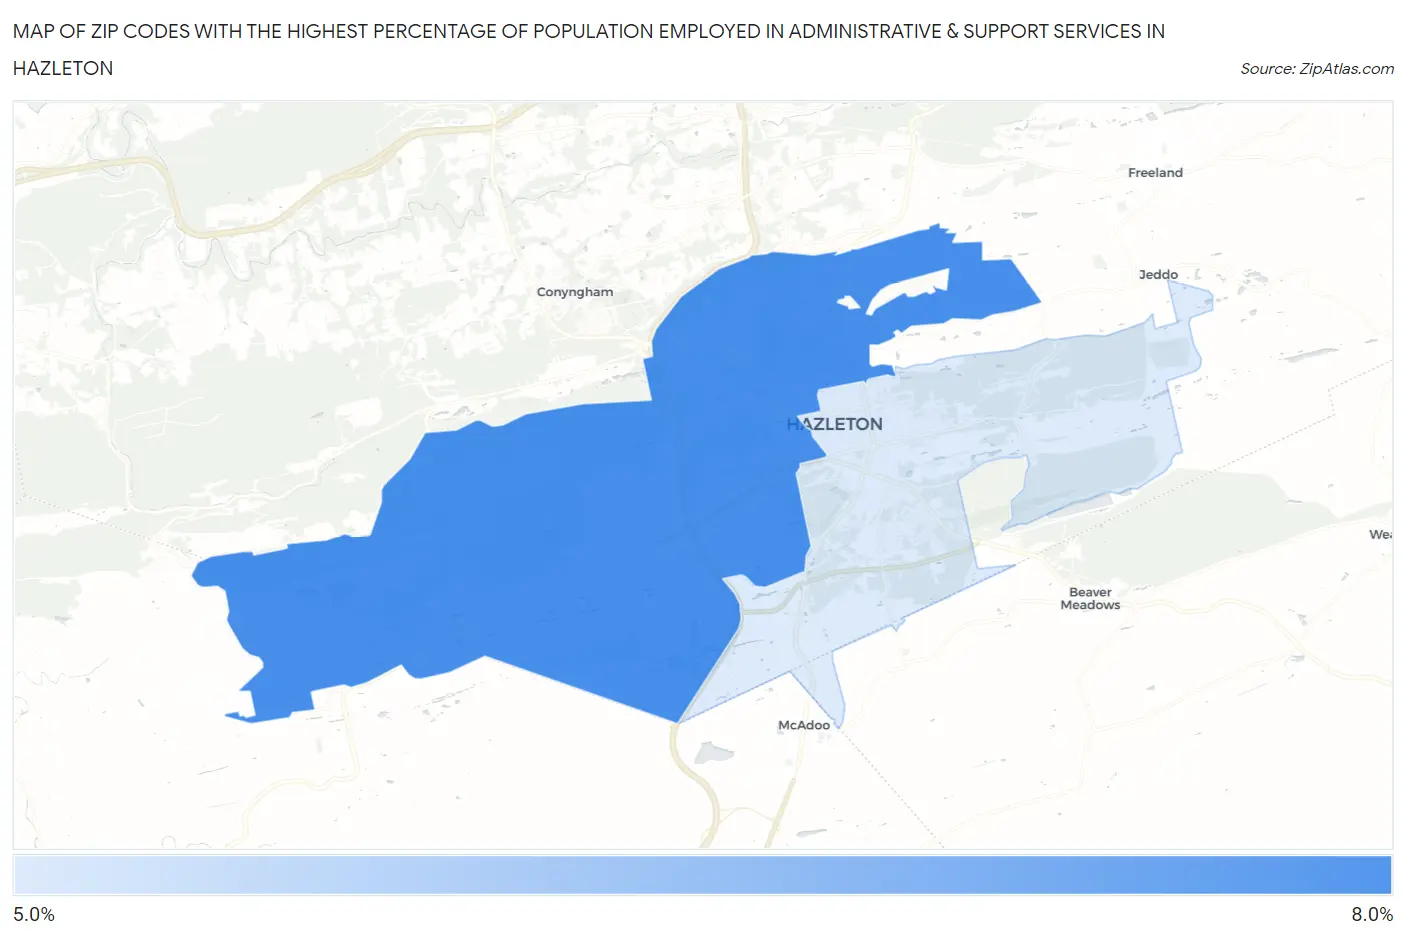
Map of Zip Codes with the Highest Percentage of Population Employed in Administrative & Support Services in Hazleton
5.6%
6.5%
Zip Codes with the Highest Percentage of Population Employed in Administrative & Support Services in Hazleton, PA
| Zip Code | % Employed | vs State | vs National | |
| 1. | 18202 | 6.5% | 3.6%(+2.92)#175 | 4.1%(+2.35)#3,903 |
| 2. | 18201 | 5.6% | 3.6%(+2.00)#258 | 4.1%(+1.44)#5,607 |
1
Common Questions
What are the Top Zip Codes with the Highest Percentage of Population Employed in Administrative & Support Services in Hazleton, PA?
Top Zip Codes with the Highest Percentage of Population Employed in Administrative & Support Services in Hazleton, PA are:
What zip code has the Highest Percentage of Population Employed in Administrative & Support Services in Hazleton, PA?
18202 has the Highest Percentage of Population Employed in Administrative & Support Services in Hazleton, PA with 6.5%.
What is the Percentage of Population Employed in Administrative & Support Services in Hazleton, PA?
Percentage of Population Employed in Administrative & Support Services in Hazleton is 5.7%.
What is the Percentage of Population Employed in Administrative & Support Services in Pennsylvania?
Percentage of Population Employed in Administrative & Support Services in Pennsylvania is 3.6%.
What is the Percentage of Population Employed in Administrative & Support Services in the United States?
Percentage of Population Employed in Administrative & Support Services in the United States is 4.1%.