Cities with the Highest Percentage of Population Employed in Administrative & Support Services in South Dakota
RELATED REPORTS & OPTIONS
Administrative & Support Services
South Dakota
Compare Cities
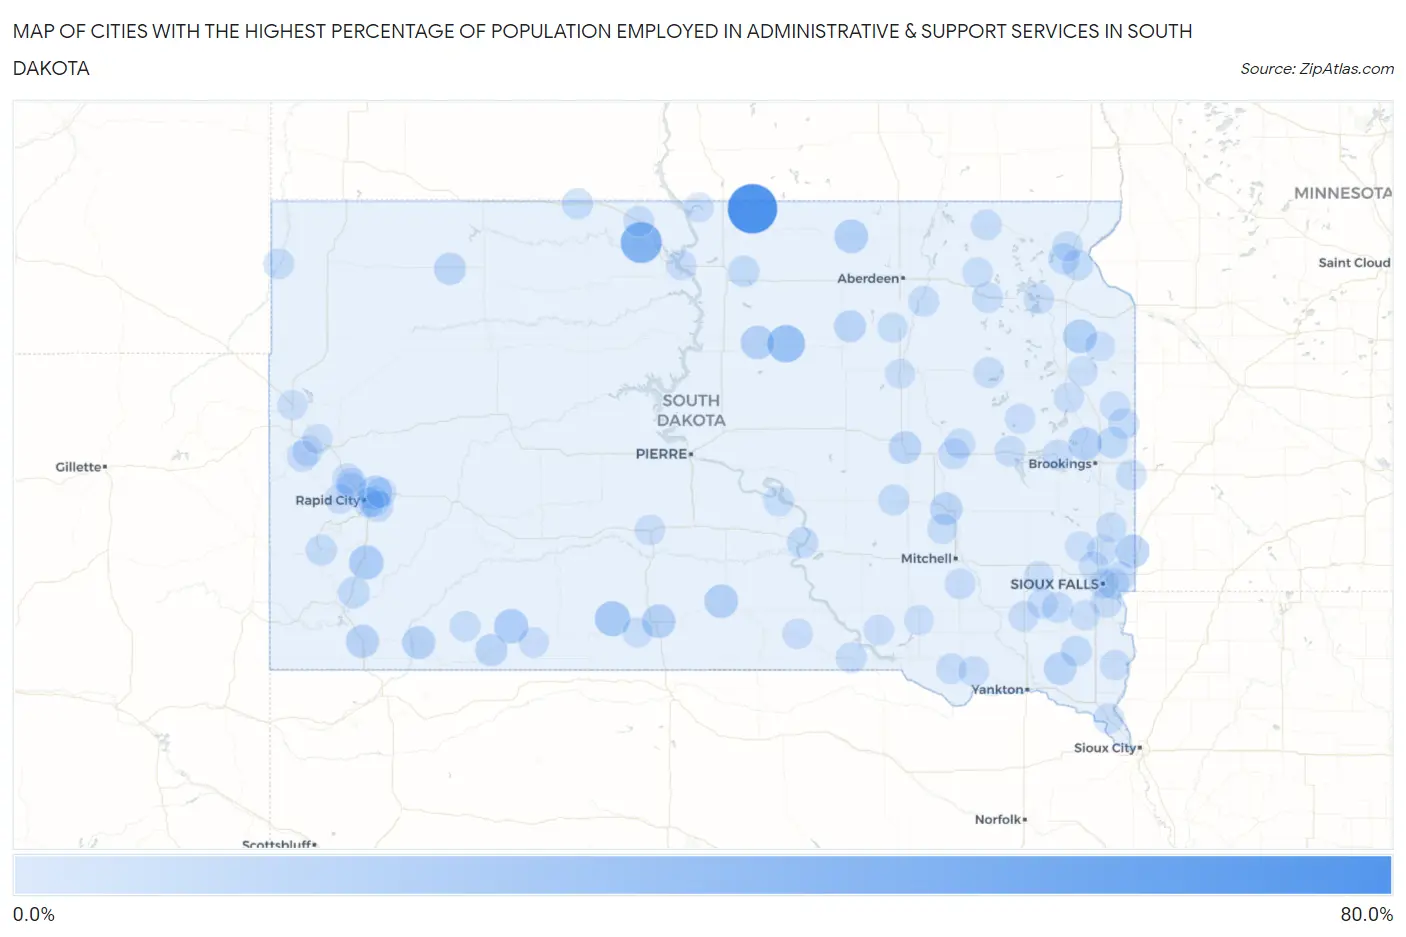
Map of Cities with the Highest Percentage of Population Employed in Administrative & Support Services in South Dakota
0.0%
80.0%
Cities with the Highest Percentage of Population Employed in Administrative & Support Services in South Dakota
| City | % Employed | vs State | vs National | |
| 1. | Artas | 73.3% | 2.6%(+70.7)#1 | 4.1%(+69.2)#23 |
| 2. | Little Eagle | 41.7% | 2.6%(+39.1)#2 | 4.1%(+37.5)#94 |
| 3. | Rowena | 39.3% | 2.6%(+36.7)#3 | 4.1%(+35.1)#110 |
| 4. | Seneca | 28.6% | 2.6%(+26.0)#4 | 4.1%(+24.4)#216 |
| 5. | Parmelee | 20.6% | 2.6%(+18.0)#5 | 4.1%(+16.4)#419 |
| 6. | Fairburn | 17.6% | 2.6%(+15.1)#6 | 4.1%(+13.5)#566 |
| 7. | Allen | 17.1% | 2.6%(+14.5)#7 | 4.1%(+12.9)#600 |
| 8. | Ashland Heights | 15.6% | 2.6%(+13.0)#8 | 4.1%(+11.5)#722 |
| 9. | South Shore | 15.6% | 2.6%(+13.0)#9 | 4.1%(+11.4)#727 |
| 10. | Leola | 15.4% | 2.6%(+12.8)#10 | 4.1%(+11.3)#748 |
| 11. | New Witten | 15.2% | 2.6%(+12.6)#11 | 4.1%(+11.0)#776 |
| 12. | Lebanon | 14.9% | 2.6%(+12.3)#12 | 4.1%(+10.7)#812 |
| 13. | Antelope | 14.3% | 2.6%(+11.7)#13 | 4.1%(+10.1)#895 |
| 14. | Sherman | 14.3% | 2.6%(+11.7)#14 | 4.1%(+10.1)#906 |
| 15. | Bruce | 13.4% | 2.6%(+10.8)#15 | 4.1%(+9.24)#1,048 |
| 16. | Oglala | 12.9% | 2.6%(+10.3)#16 | 4.1%(+8.72)#1,142 |
| 17. | Oelrichs | 12.7% | 2.6%(+10.2)#17 | 4.1%(+8.60)#1,167 |
| 18. | Wakonda | 11.4% | 2.6%(+8.79)#18 | 4.1%(+7.23)#1,447 |
| 19. | Wolsey | 11.2% | 2.6%(+8.58)#19 | 4.1%(+7.02)#1,497 |
| 20. | Forestburg | 11.1% | 2.6%(+8.52)#20 | 4.1%(+6.96)#1,523 |
| 21. | Batesland | 10.0% | 2.6%(+7.41)#21 | 4.1%(+5.85)#1,911 |
| 22. | Bison | 9.4% | 2.6%(+6.82)#22 | 4.1%(+5.27)#2,159 |
| 23. | Cresbard | 9.3% | 2.6%(+6.71)#23 | 4.1%(+5.15)#2,211 |
| 24. | Wonderland Homes | 9.2% | 2.6%(+6.63)#24 | 4.1%(+5.07)#2,254 |
| 25. | Buffalo Gap | 7.8% | 2.6%(+5.25)#25 | 4.1%(+3.69)#3,120 |
| 26. | White | 7.5% | 2.6%(+4.86)#26 | 4.1%(+3.31)#3,443 |
| 27. | Mountain Plains | 7.3% | 2.6%(+4.70)#27 | 4.1%(+3.14)#3,599 |
| 28. | Java | 7.1% | 2.6%(+4.55)#28 | 4.1%(+2.99)#3,757 |
| 29. | Rapid Valley | 6.8% | 2.6%(+4.21)#29 | 4.1%(+2.66)#4,091 |
| 30. | Oacoma | 6.8% | 2.6%(+4.17)#30 | 4.1%(+2.61)#4,135 |
| 31. | Mcintosh | 6.5% | 2.6%(+3.93)#31 | 4.1%(+2.37)#4,421 |
| 32. | Agency Village | 6.5% | 2.6%(+3.91)#32 | 4.1%(+2.35)#4,438 |
| 33. | Centerville | 6.5% | 2.6%(+3.88)#33 | 4.1%(+2.33)#4,468 |
| 34. | Green Valley | 6.5% | 2.6%(+3.86)#34 | 4.1%(+2.30)#4,497 |
| 35. | Pine Lakes Addition | 6.3% | 2.6%(+3.73)#35 | 4.1%(+2.17)#4,671 |
| 36. | Wessington Springs | 6.1% | 2.6%(+3.50)#36 | 4.1%(+1.94)#4,993 |
| 37. | Peever | 6.0% | 2.6%(+3.41)#37 | 4.1%(+1.85)#5,149 |
| 38. | Parker | 6.0% | 2.6%(+3.39)#38 | 4.1%(+1.83)#5,174 |
| 39. | Custer | 5.8% | 2.6%(+3.26)#39 | 4.1%(+1.70)#5,384 |
| 40. | Arlington | 5.6% | 2.6%(+3.04)#40 | 4.1%(+1.48)#5,730 |
| 41. | Bonesteel | 5.6% | 2.6%(+3.03)#41 | 4.1%(+1.47)#5,767 |
| 42. | Cavour | 5.6% | 2.6%(+2.96)#42 | 4.1%(+1.41)#5,884 |
| 43. | Astoria | 5.6% | 2.6%(+2.96)#43 | 4.1%(+1.41)#5,886 |
| 44. | Porcupine | 5.4% | 2.6%(+2.81)#44 | 4.1%(+1.26)#6,171 |
| 45. | Stratford | 5.4% | 2.6%(+2.81)#45 | 4.1%(+1.26)#6,186 |
| 46. | Lead | 5.4% | 2.6%(+2.81)#46 | 4.1%(+1.25)#6,190 |
| 47. | Britton | 5.4% | 2.6%(+2.79)#47 | 4.1%(+1.23)#6,221 |
| 48. | Mclaughlin | 5.3% | 2.6%(+2.69)#48 | 4.1%(+1.13)#6,426 |
| 49. | Bristol | 5.2% | 2.6%(+2.59)#49 | 4.1%(+1.04)#6,644 |
| 50. | Piedmont | 5.0% | 2.6%(+2.42)#50 | 4.1%(+0.859)#7,033 |
| 51. | Camp Crook | 5.0% | 2.6%(+2.41)#51 | 4.1%(+0.850)#7,067 |
| 52. | Clark | 4.9% | 2.6%(+2.31)#52 | 4.1%(+0.750)#7,280 |
| 53. | Harrisburg | 4.9% | 2.6%(+2.29)#53 | 4.1%(+0.731)#7,331 |
| 54. | Ethan | 4.9% | 2.6%(+2.29)#54 | 4.1%(+0.728)#7,345 |
| 55. | Elkton | 4.9% | 2.6%(+2.28)#55 | 4.1%(+0.722)#7,360 |
| 56. | Kenel | 4.8% | 2.6%(+2.25)#56 | 4.1%(+0.689)#7,423 |
| 57. | Avon | 4.8% | 2.6%(+2.17)#57 | 4.1%(+0.612)#7,611 |
| 58. | De Smet | 4.7% | 2.6%(+2.09)#58 | 4.1%(+0.529)#7,828 |
| 59. | Letcher | 4.7% | 2.6%(+2.06)#59 | 4.1%(+0.501)#7,915 |
| 60. | Blackhawk | 4.6% | 2.6%(+1.98)#60 | 4.1%(+0.424)#8,103 |
| 61. | Rapid City | 4.6% | 2.6%(+1.97)#61 | 4.1%(+0.418)#8,117 |
| 62. | Baltic | 4.4% | 2.6%(+1.81)#62 | 4.1%(+0.249)#8,591 |
| 63. | Tyndall | 4.4% | 2.6%(+1.78)#63 | 4.1%(+0.218)#8,691 |
| 64. | Elk Point | 4.3% | 2.6%(+1.72)#64 | 4.1%(+0.161)#8,880 |
| 65. | Geddes | 4.2% | 2.6%(+1.63)#65 | 4.1%(+0.076)#9,152 |
| 66. | Waubay | 4.2% | 2.6%(+1.60)#66 | 4.1%(+0.046)#9,237 |
| 67. | Pierpont | 4.2% | 2.6%(+1.57)#67 | 4.1%(+0.017)#9,342 |
| 68. | Martin | 4.2% | 2.6%(+1.56)#68 | 4.1%(+0.007)#9,362 |
| 69. | Freeman | 4.1% | 2.6%(+1.55)#69 | 4.1%(-0.008)#9,405 |
| 70. | Murdo | 4.1% | 2.6%(+1.51)#70 | 4.1%(-0.049)#9,514 |
| 71. | Gregory | 4.0% | 2.6%(+1.44)#71 | 4.1%(-0.122)#9,752 |
| 72. | Box Elder | 4.0% | 2.6%(+1.42)#72 | 4.1%(-0.134)#9,798 |
| 73. | Yale | 4.0% | 2.6%(+1.41)#73 | 4.1%(-0.150)#9,860 |
| 74. | Alcester | 3.9% | 2.6%(+1.35)#74 | 4.1%(-0.202)#10,033 |
| 75. | Marion | 3.9% | 2.6%(+1.29)#75 | 4.1%(-0.271)#10,244 |
| 76. | Castlewood | 3.8% | 2.6%(+1.24)#76 | 4.1%(-0.314)#10,395 |
| 77. | Deadwood | 3.8% | 2.6%(+1.22)#77 | 4.1%(-0.335)#10,463 |
| 78. | Northville | 3.8% | 2.6%(+1.20)#78 | 4.1%(-0.352)#10,524 |
| 79. | Mobridge | 3.8% | 2.6%(+1.18)#79 | 4.1%(-0.379)#10,624 |
| 80. | Johnson Siding | 3.7% | 2.6%(+1.16)#80 | 4.1%(-0.400)#10,697 |
| 81. | Lower Brule | 3.7% | 2.6%(+1.07)#81 | 4.1%(-0.491)#11,018 |
| 82. | Brandon | 3.7% | 2.6%(+1.06)#82 | 4.1%(-0.492)#11,029 |
| 83. | Rosebud | 3.6% | 2.6%(+1.06)#83 | 4.1%(-0.500)#11,053 |
| 84. | Trent | 3.6% | 2.6%(+1.02)#84 | 4.1%(-0.535)#11,189 |
| 85. | Bryant | 3.5% | 2.6%(+0.896)#85 | 4.1%(-0.661)#11,643 |
| 86. | Sisseton | 3.5% | 2.6%(+0.876)#86 | 4.1%(-0.682)#11,732 |
| 87. | Summerset | 3.3% | 2.6%(+0.745)#87 | 4.1%(-0.812)#12,213 |
| 88. | Brandt | 3.3% | 2.6%(+0.741)#88 | 4.1%(-0.816)#12,244 |
| 89. | Lennox | 3.3% | 2.6%(+0.712)#89 | 4.1%(-0.845)#12,346 |
| 90. | Sioux Falls | 3.3% | 2.6%(+0.665)#90 | 4.1%(-0.892)#12,510 |
| 91. | Kranzburg | 3.2% | 2.6%(+0.633)#91 | 4.1%(-0.924)#12,624 |
| 92. | Whitewood | 3.0% | 2.6%(+0.455)#92 | 4.1%(-1.10)#13,240 |
| 93. | Redfield | 3.0% | 2.6%(+0.432)#93 | 4.1%(-1.13)#13,347 |
| 94. | Armour | 3.0% | 2.6%(+0.407)#94 | 4.1%(-1.15)#13,449 |
| 95. | Colton | 3.0% | 2.6%(+0.363)#95 | 4.1%(-1.19)#13,622 |
| 96. | Canistota | 2.9% | 2.6%(+0.273)#96 | 4.1%(-1.28)#13,961 |
| 97. | Strandburg | 2.9% | 2.6%(+0.264)#97 | 4.1%(-1.29)#14,009 |
| 98. | Crooks | 2.8% | 2.6%(+0.237)#98 | 4.1%(-1.32)#14,104 |
| 99. | Pollock | 2.8% | 2.6%(+0.224)#99 | 4.1%(-1.33)#14,160 |
| 100. | Belle Fourche | 2.8% | 2.6%(+0.223)#100 | 4.1%(-1.33)#14,166 |
Common Questions
What are the Top 10 Cities with the Highest Percentage of Population Employed in Administrative & Support Services in South Dakota?
Top 10 Cities with the Highest Percentage of Population Employed in Administrative & Support Services in South Dakota are:
#1
73.3%
#2
41.7%
#3
28.6%
#4
20.6%
#5
17.6%
#6
17.1%
#7
15.6%
#8
15.6%
#9
15.4%
#10
15.2%
What city has the Highest Percentage of Population Employed in Administrative & Support Services in South Dakota?
Artas has the Highest Percentage of Population Employed in Administrative & Support Services in South Dakota with 73.3%.
What is the Percentage of Population Employed in Administrative & Support Services in the State of South Dakota?
Percentage of Population Employed in Administrative & Support Services in South Dakota is 2.6%.
What is the Percentage of Population Employed in Administrative & Support Services in the United States?
Percentage of Population Employed in Administrative & Support Services in the United States is 4.1%.