Cities with the Highest Percentage of Population Employed in Administrative & Support Services in Nevada
RELATED REPORTS & OPTIONS
Administrative & Support Services
Nevada
Compare Cities
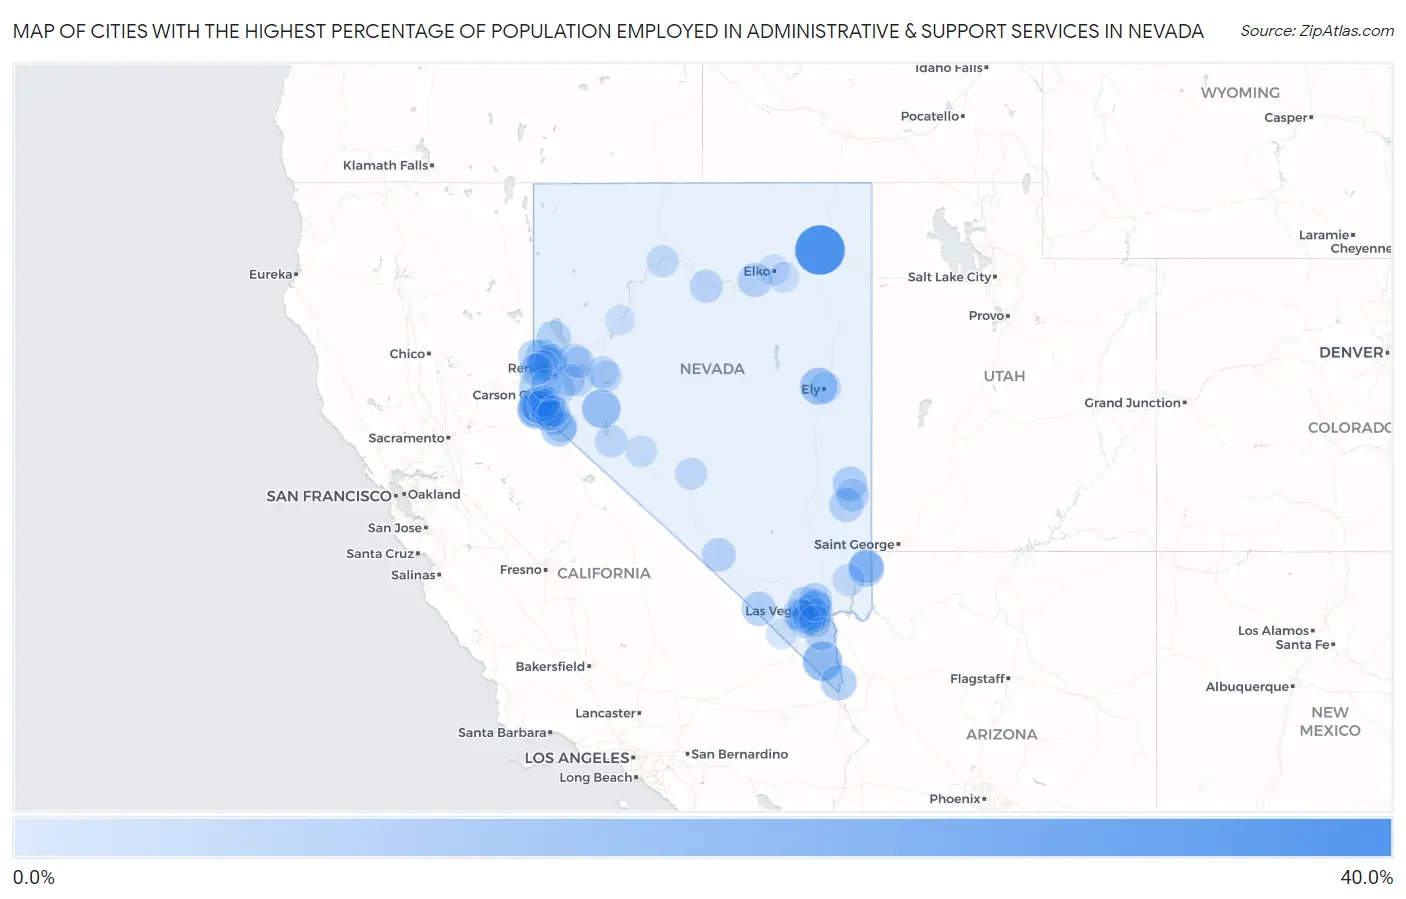
Map of Cities with the Highest Percentage of Population Employed in Administrative & Support Services in Nevada
0.0%
40.0%
Cities with the Highest Percentage of Population Employed in Administrative & Support Services in Nevada
| City | % Employed | vs State | vs National | |
| 1. | Wells | 32.6% | 5.5%(+27.1)#1 | 4.1%(+28.5)#149 |
| 2. | Searchlight | 14.9% | 5.5%(+9.41)#2 | 4.1%(+10.8)#804 |
| 3. | Schurz | 13.6% | 5.5%(+8.12)#3 | 4.1%(+9.49)#1,003 |
| 4. | Round Hill Village | 12.9% | 5.5%(+7.43)#4 | 4.1%(+8.80)#1,127 |
| 5. | Stateline | 12.6% | 5.5%(+7.10)#5 | 4.1%(+8.47)#1,190 |
| 6. | Ruth | 11.7% | 5.5%(+6.15)#6 | 4.1%(+7.52)#1,386 |
| 7. | Skyland | 10.1% | 5.5%(+4.57)#7 | 4.1%(+5.93)#1,865 |
| 8. | Bunkerville | 9.5% | 5.5%(+3.95)#8 | 4.1%(+5.32)#2,138 |
| 9. | Laughlin | 8.7% | 5.5%(+3.22)#9 | 4.1%(+4.59)#2,530 |
| 10. | Topaz Lake | 8.6% | 5.5%(+3.06)#10 | 4.1%(+4.42)#2,635 |
| 11. | Carter Springs | 8.3% | 5.5%(+2.78)#11 | 4.1%(+4.15)#2,811 |
| 12. | Incline Village | 7.8% | 5.5%(+2.29)#12 | 4.1%(+3.66)#3,140 |
| 13. | Winchester | 7.7% | 5.5%(+2.16)#13 | 4.1%(+3.52)#3,250 |
| 14. | Sunrise Manor | 7.7% | 5.5%(+2.13)#14 | 4.1%(+3.50)#3,268 |
| 15. | Sun Valley | 7.5% | 5.5%(+2.03)#15 | 4.1%(+3.39)#3,346 |
| 16. | Pioche | 7.4% | 5.5%(+1.86)#16 | 4.1%(+3.22)#3,523 |
| 17. | Pahrump | 6.9% | 5.5%(+1.42)#17 | 4.1%(+2.79)#3,956 |
| 18. | Paradise | 6.8% | 5.5%(+1.28)#18 | 4.1%(+2.64)#4,101 |
| 19. | Las Vegas | 6.8% | 5.5%(+1.24)#19 | 4.1%(+2.61)#4,144 |
| 20. | Sutcliffe | 6.7% | 5.5%(+1.15)#20 | 4.1%(+2.52)#4,227 |
| 21. | Caliente | 6.6% | 5.5%(+1.13)#21 | 4.1%(+2.50)#4,261 |
| 22. | Lemmon Valley | 6.6% | 5.5%(+1.12)#22 | 4.1%(+2.49)#4,272 |
| 23. | Mesquite | 6.6% | 5.5%(+1.10)#23 | 4.1%(+2.46)#4,301 |
| 24. | Carlin | 6.6% | 5.5%(+1.07)#24 | 4.1%(+2.43)#4,345 |
| 25. | North Las Vegas | 6.4% | 5.5%(+0.906)#25 | 4.1%(+2.27)#4,542 |
| 26. | Gardnerville | 6.1% | 5.5%(+0.616)#26 | 4.1%(+1.98)#4,932 |
| 27. | Beatty | 6.1% | 5.5%(+0.591)#27 | 4.1%(+1.96)#4,968 |
| 28. | Cold Springs | 5.9% | 5.5%(+0.413)#28 | 4.1%(+1.78)#5,265 |
| 29. | Kingsbury | 5.9% | 5.5%(+0.360)#29 | 4.1%(+1.73)#5,349 |
| 30. | Whitney | 5.5% | 5.5%(+0.010)#30 | 4.1%(+1.38)#5,948 |
| 31. | Carson | 5.5% | 5.5%(-0.051)#31 | 4.1%(+1.31)#6,068 |
| 32. | Spring Valley | 5.2% | 5.5%(-0.271)#32 | 4.1%(+1.09)#6,526 |
| 33. | Boulder City | 5.1% | 5.5%(-0.378)#33 | 4.1%(+0.988)#6,740 |
| 34. | Wadsworth | 5.0% | 5.5%(-0.471)#34 | 4.1%(+0.895)#6,945 |
| 35. | Panaca | 5.0% | 5.5%(-0.560)#35 | 4.1%(+0.806)#7,151 |
| 36. | Sparks | 4.9% | 5.5%(-0.607)#36 | 4.1%(+0.760)#7,260 |
| 37. | Battle Mountain | 4.7% | 5.5%(-0.803)#37 | 4.1%(+0.563)#7,750 |
| 38. | Johnson Lane | 4.6% | 5.5%(-0.873)#38 | 4.1%(+0.493)#7,934 |
| 39. | Silver Springs | 4.6% | 5.5%(-0.939)#39 | 4.1%(+0.427)#8,093 |
| 40. | Enterprise | 4.5% | 5.5%(-0.988)#40 | 4.1%(+0.378)#8,230 |
| 41. | Zephyr Cove | 4.5% | 5.5%(-1.04)#41 | 4.1%(+0.322)#8,384 |
| 42. | Spanish Springs | 4.4% | 5.5%(-1.12)#42 | 4.1%(+0.250)#8,589 |
| 43. | Summerlin South | 4.4% | 5.5%(-1.14)#43 | 4.1%(+0.223)#8,670 |
| 44. | Henderson | 4.4% | 5.5%(-1.17)#44 | 4.1%(+0.200)#8,732 |
| 45. | Nellis Afb | 4.2% | 5.5%(-1.34)#45 | 4.1%(+0.023)#9,307 |
| 46. | Reno | 4.1% | 5.5%(-1.37)#46 | 4.1%(-0.002)#9,387 |
| 47. | Dayton | 4.1% | 5.5%(-1.42)#47 | 4.1%(-0.053)#9,529 |
| 48. | Verdi | 4.1% | 5.5%(-1.46)#48 | 4.1%(-0.091)#9,645 |
| 49. | Minden | 3.8% | 5.5%(-1.67)#49 | 4.1%(-0.306)#10,369 |
| 50. | Hawthorne | 3.8% | 5.5%(-1.76)#50 | 4.1%(-0.390)#10,660 |
| 51. | Topaz Ranch Estates | 3.7% | 5.5%(-1.83)#51 | 4.1%(-0.463)#10,920 |
| 52. | Fallon | 3.6% | 5.5%(-1.88)#52 | 4.1%(-0.515)#11,114 |
| 53. | Stagecoach | 3.6% | 5.5%(-1.90)#53 | 4.1%(-0.535)#11,182 |
| 54. | Gardnerville Ranchos | 3.6% | 5.5%(-1.92)#54 | 4.1%(-0.551)#11,249 |
| 55. | Indian Hills | 3.5% | 5.5%(-2.02)#55 | 4.1%(-0.656)#11,618 |
| 56. | Genoa | 3.5% | 5.5%(-2.04)#56 | 4.1%(-0.670)#11,676 |
| 57. | Moapa Valley | 3.3% | 5.5%(-2.18)#57 | 4.1%(-0.814)#12,218 |
| 58. | Fernley | 3.3% | 5.5%(-2.19)#58 | 4.1%(-0.826)#12,286 |
| 59. | Winnemucca | 3.3% | 5.5%(-2.21)#59 | 4.1%(-0.840)#12,333 |
| 60. | Tonopah | 3.2% | 5.5%(-2.27)#60 | 4.1%(-0.907)#12,555 |
| 61. | Mogul | 2.9% | 5.5%(-2.62)#61 | 4.1%(-1.26)#13,843 |
| 62. | Mina | 2.9% | 5.5%(-2.66)#62 | 4.1%(-1.29)#14,001 |
| 63. | Ely | 2.9% | 5.5%(-2.67)#63 | 4.1%(-1.30)#14,030 |
| 64. | Fallon Station | 2.6% | 5.5%(-2.91)#64 | 4.1%(-1.54)#14,994 |
| 65. | Washoe Valley | 2.4% | 5.5%(-3.10)#65 | 4.1%(-1.74)#15,761 |
| 66. | Fish Springs | 2.4% | 5.5%(-3.16)#66 | 4.1%(-1.79)#15,962 |
| 67. | Elko | 2.0% | 5.5%(-3.54)#67 | 4.1%(-2.17)#17,409 |
| 68. | Ruhenstroth | 1.5% | 5.5%(-3.97)#68 | 4.1%(-2.60)#18,974 |
| 69. | Spring Creek | 1.5% | 5.5%(-4.06)#69 | 4.1%(-2.69)#19,294 |
| 70. | Sandy Valley | 0.96% | 5.5%(-4.56)#70 | 4.1%(-3.19)#20,864 |
| 71. | Lovelock | 0.68% | 5.5%(-4.83)#71 | 4.1%(-3.46)#21,647 |
1
2Common Questions
What are the Top 10 Cities with the Highest Percentage of Population Employed in Administrative & Support Services in Nevada?
Top 10 Cities with the Highest Percentage of Population Employed in Administrative & Support Services in Nevada are:
#1
32.6%
#2
14.9%
#3
13.6%
#4
12.9%
#5
12.6%
#6
11.7%
#7
10.1%
#8
9.5%
#9
8.7%
#10
8.6%
What city has the Highest Percentage of Population Employed in Administrative & Support Services in Nevada?
Wells has the Highest Percentage of Population Employed in Administrative & Support Services in Nevada with 32.6%.
What is the Percentage of Population Employed in Administrative & Support Services in the State of Nevada?
Percentage of Population Employed in Administrative & Support Services in Nevada is 5.5%.
What is the Percentage of Population Employed in Administrative & Support Services in the United States?
Percentage of Population Employed in Administrative & Support Services in the United States is 4.1%.