Skyline View, PA Map & Demographics
Skyline View Map
Skyline View Overview
$52,605
PER CAPITA INCOME
$138,655
AVG FAMILY INCOME
$114,167
AVG HOUSEHOLD INCOME
58.7%
WAGE / INCOME GAP [ % ]
41.3¢/ $1
WAGE / INCOME GAP [ $ ]
0.33
INEQUALITY / GINI INDEX
4,848
TOTAL POPULATION
2,300
MALE POPULATION
2,548
FEMALE POPULATION
90.27
MALES / 100 FEMALES
110.78
FEMALES / 100 MALES
54.8
MEDIAN AGE
2.5
AVG FAMILY SIZE
2.3
AVG HOUSEHOLD SIZE
2,497
LABOR FORCE [ PEOPLE ]
62.7%
PERCENT IN LABOR FORCE
0.8%
UNEMPLOYMENT RATE
Income in Skyline View
Income Overview in Skyline View
Per Capita Income in Skyline View is $52,605, while median incomes of families and households are $138,655 and $114,167 respectively.
| Characteristic | Number | Measure |
| Per Capita Income | 4,848 | $52,605 |
| Median Family Income | 1,615 | $138,655 |
| Mean Family Income | 1,615 | $133,192 |
| Median Household Income | 2,074 | $114,167 |
| Mean Household Income | 2,074 | $121,730 |
| Income Deficit | 1,615 | $0 |
| Wage / Income Gap (%) | 4,848 | 58.69% |
| Wage / Income Gap ($) | 4,848 | 41.31¢ per $1 |
| Gini / Inequality Index | 4,848 | 0.33 |
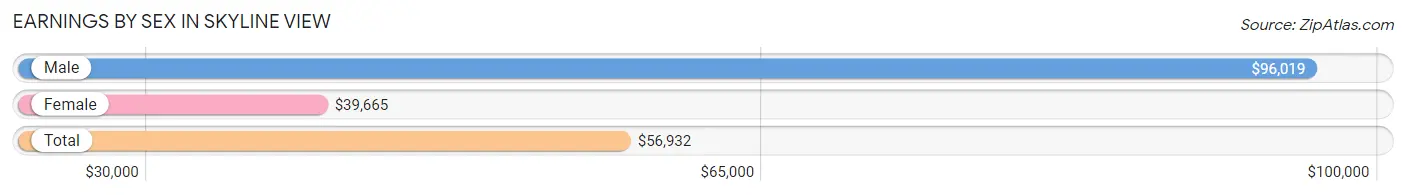
Earnings by Sex in Skyline View
Average Earnings in Skyline View are $56,932, $96,019 for men and $39,665 for women, a difference of 58.7%.
| Sex | Number | Average Earnings |
| Male | 1,286 (50.5%) | $96,019 |
| Female | 1,260 (49.5%) | $39,665 |
| Total | 2,546 (100.0%) | $56,932 |
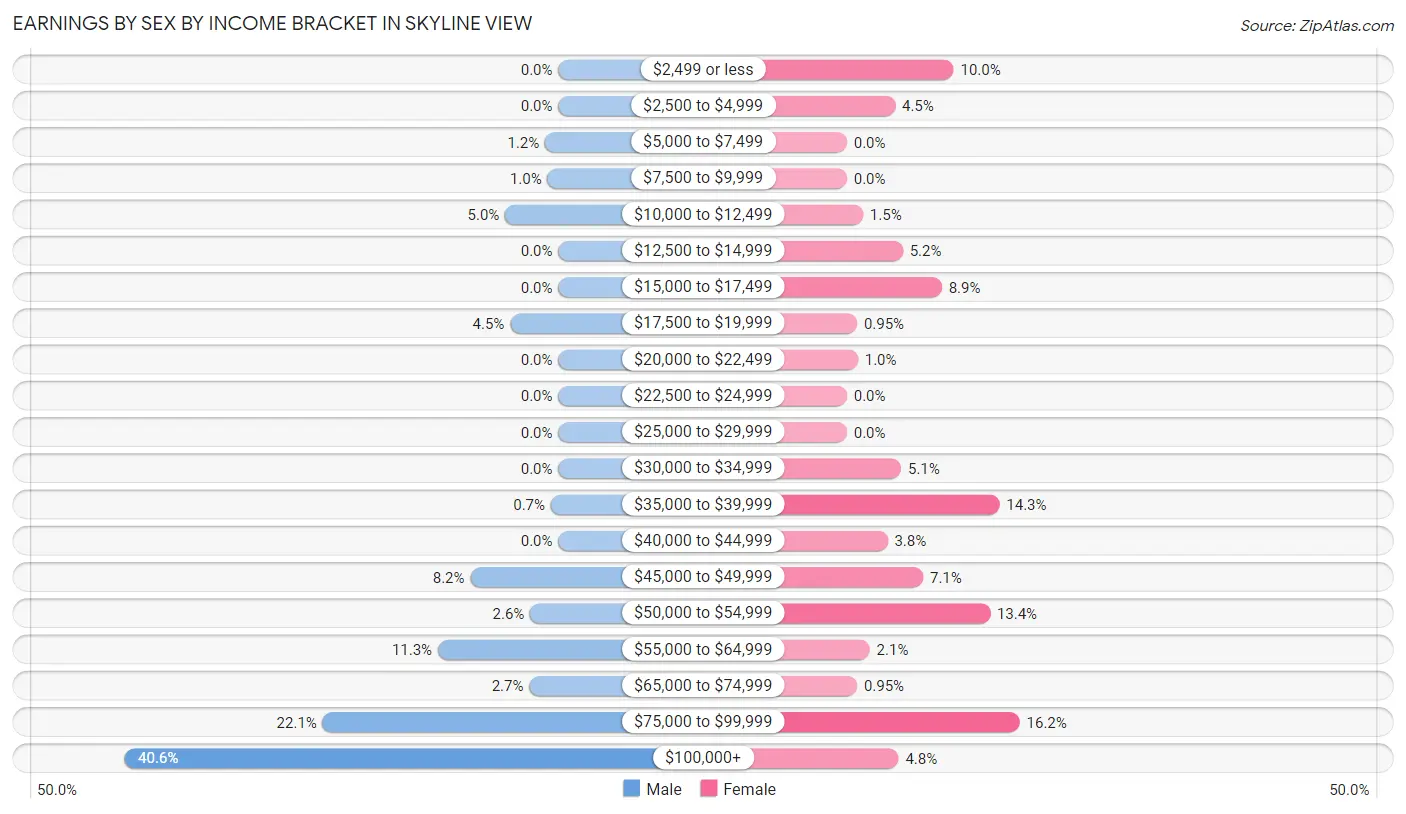
Earnings by Sex by Income Bracket in Skyline View
The most common earnings brackets in Skyline View are $100,000+ for men (522 | 40.6%) and $75,000 to $99,999 for women (204 | 16.2%).
| Income | Male | Female |
| $2,499 or less | 0 (0.0%) | 126 (10.0%) |
| $2,500 to $4,999 | 0 (0.0%) | 57 (4.5%) |
| $5,000 to $7,499 | 16 (1.2%) | 0 (0.0%) |
| $7,500 to $9,999 | 13 (1.0%) | 0 (0.0%) |
| $10,000 to $12,499 | 64 (5.0%) | 19 (1.5%) |
| $12,500 to $14,999 | 0 (0.0%) | 66 (5.2%) |
| $15,000 to $17,499 | 0 (0.0%) | 112 (8.9%) |
| $17,500 to $19,999 | 58 (4.5%) | 12 (0.9%) |
| $20,000 to $22,499 | 0 (0.0%) | 13 (1.0%) |
| $22,500 to $24,999 | 0 (0.0%) | 0 (0.0%) |
| $25,000 to $29,999 | 0 (0.0%) | 0 (0.0%) |
| $30,000 to $34,999 | 0 (0.0%) | 64 (5.1%) |
| $35,000 to $39,999 | 9 (0.7%) | 180 (14.3%) |
| $40,000 to $44,999 | 0 (0.0%) | 48 (3.8%) |
| $45,000 to $49,999 | 106 (8.2%) | 90 (7.1%) |
| $50,000 to $54,999 | 34 (2.6%) | 169 (13.4%) |
| $55,000 to $64,999 | 145 (11.3%) | 27 (2.1%) |
| $65,000 to $74,999 | 35 (2.7%) | 12 (0.9%) |
| $75,000 to $99,999 | 284 (22.1%) | 204 (16.2%) |
| $100,000+ | 522 (40.6%) | 61 (4.8%) |
| Total | 1,286 (100.0%) | 1,260 (100.0%) |
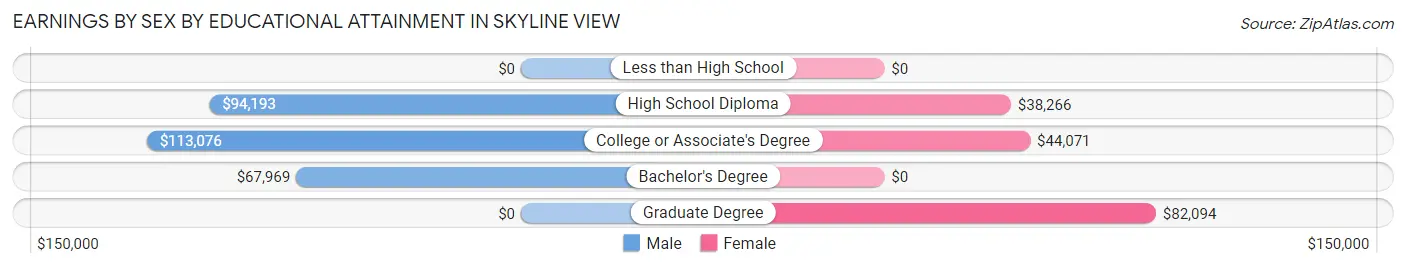
Earnings by Sex by Educational Attainment in Skyline View
Average earnings in Skyline View are $96,019 for men and $39,745 for women, a difference of 58.6%. Men with an educational attainment of college or associate's degree enjoy the highest average annual earnings of $113,076, while those with bachelor's degree education earn the least with $67,969. Women with an educational attainment of graduate degree earn the most with the average annual earnings of $82,094, while those with high school diploma education have the smallest earnings of $38,266.
| Educational Attainment | Male Income | Female Income |
| Less than High School | - | - |
| High School Diploma | $94,193 | $38,266 |
| College or Associate's Degree | $113,076 | $44,071 |
| Bachelor's Degree | $67,969 | $0 |
| Graduate Degree | - | - |
| Total | $96,019 | $39,745 |
Family Income in Skyline View
Family Income Brackets in Skyline View
According to the Skyline View family income data, there are 447 families falling into the $150,000 to $199,999 income range, which is the most common income bracket and makes up 27.7% of all families.
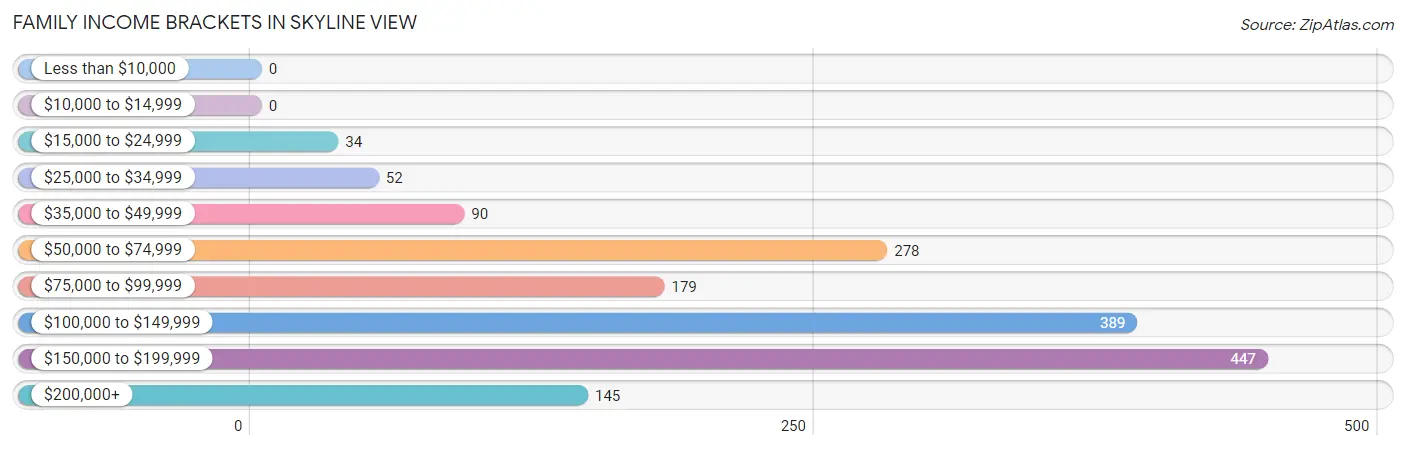
| Income Bracket | # Families | % Families |
| Less than $10,000 | 0 | 0.0% |
| $10,000 to $14,999 | 0 | 0.0% |
| $15,000 to $24,999 | 34 | 2.1% |
| $25,000 to $34,999 | 52 | 3.2% |
| $35,000 to $49,999 | 90 | 5.6% |
| $50,000 to $74,999 | 278 | 17.2% |
| $75,000 to $99,999 | 179 | 11.1% |
| $100,000 to $149,999 | 389 | 24.1% |
| $150,000 to $199,999 | 447 | 27.7% |
| $200,000+ | 145 | 9.0% |
Family Income by Famaliy Size in Skyline View
2-person families (1,101 | 68.2%) account for the highest median family income in Skyline View with $137,964 per family, while 2-person families (1,101 | 68.2%) have the highest median income of $68,982 per family member.
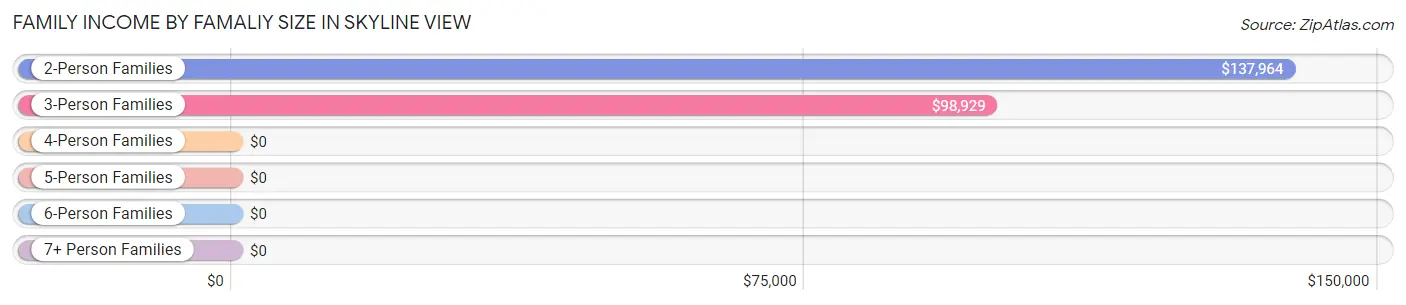
| Income Bracket | # Families | Median Income |
| 2-Person Families | 1,101 (68.2%) | $137,964 |
| 3-Person Families | 244 (15.1%) | $98,929 |
| 4-Person Families | 183 (11.3%) | $0 |
| 5-Person Families | 87 (5.4%) | $0 |
| 6-Person Families | 0 (0.0%) | $0 |
| 7+ Person Families | 0 (0.0%) | $0 |
| Total | 1,615 (100.0%) | $138,655 |
Family Income by Number of Earners in Skyline View
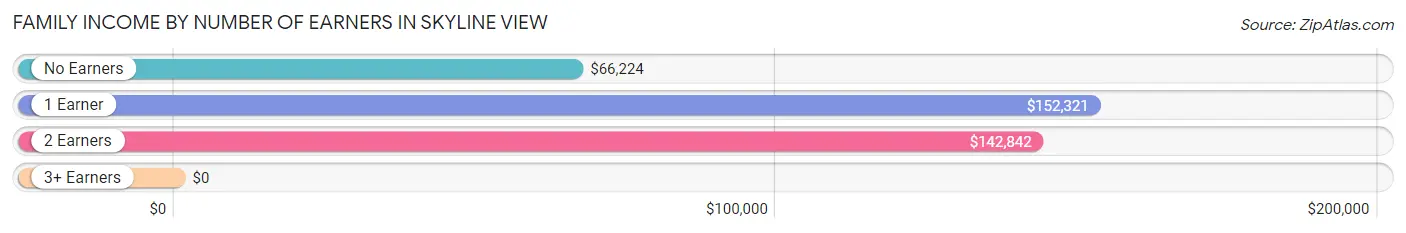
| Number of Earners | # Families | Median Income |
| No Earners | 351 (21.7%) | $66,224 |
| 1 Earner | 392 (24.3%) | $152,321 |
| 2 Earners | 800 (49.5%) | $142,842 |
| 3+ Earners | 72 (4.5%) | $0 |
| Total | 1,615 (100.0%) | $138,655 |
Household Income in Skyline View
Household Income Brackets in Skyline View
With 502 households falling in the category, the $100,000 to $149,999 income range is the most frequent in Skyline View, accounting for 24.2% of all households.
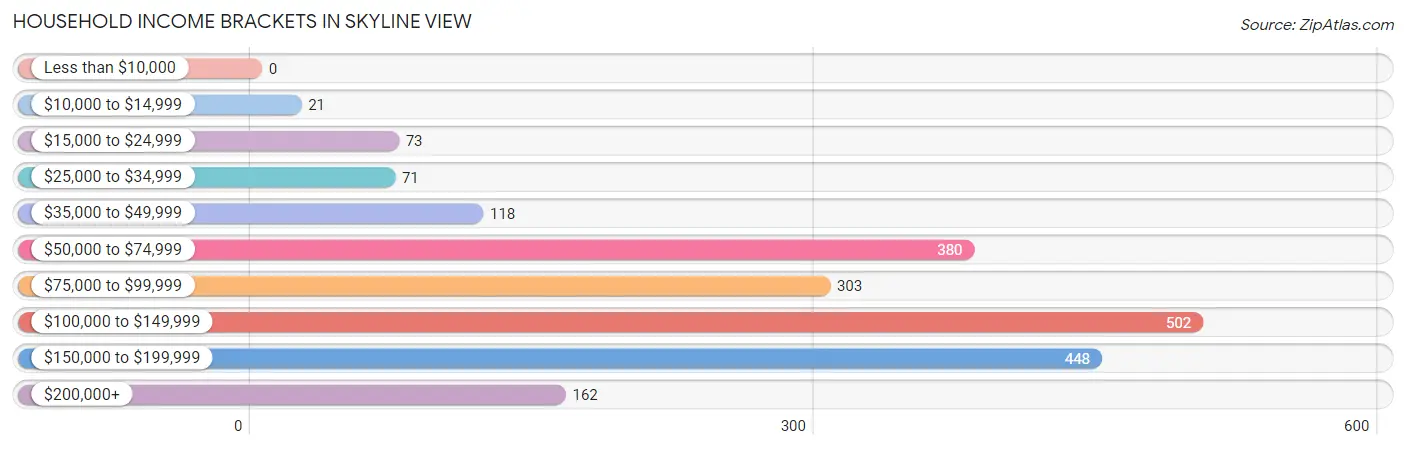
| Income Bracket | # Households | % Households |
| Less than $10,000 | 0 | 0.0% |
| $10,000 to $14,999 | 21 | 1.0% |
| $15,000 to $24,999 | 73 | 3.5% |
| $25,000 to $34,999 | 71 | 3.4% |
| $35,000 to $49,999 | 118 | 5.7% |
| $50,000 to $74,999 | 380 | 18.3% |
| $75,000 to $99,999 | 303 | 14.6% |
| $100,000 to $149,999 | 502 | 24.2% |
| $150,000 to $199,999 | 448 | 21.6% |
| $200,000+ | 162 | 7.8% |
Household Income by Householder Age in Skyline View
The median household income in Skyline View is $114,167, with the highest median household income of $145,539 found in the 25 to 44 years age bracket for the primary householder. A total of 472 households (22.8%) fall into this category.
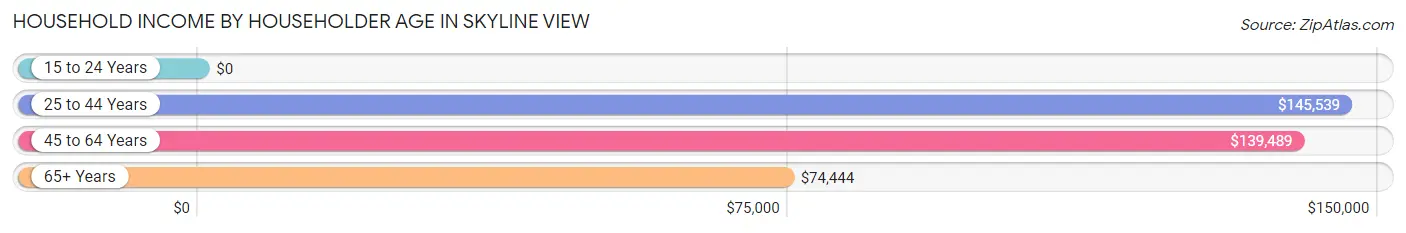
| Income Bracket | # Households | Median Income |
| 15 to 24 Years | 0 (0.0%) | $0 |
| 25 to 44 Years | 472 (22.8%) | $145,539 |
| 45 to 64 Years | 562 (27.1%) | $139,489 |
| 65+ Years | 1,040 (50.1%) | $74,444 |
| Total | 2,074 (100.0%) | $114,167 |
Poverty in Skyline View
Income Below Poverty by Sex and Age in Skyline View
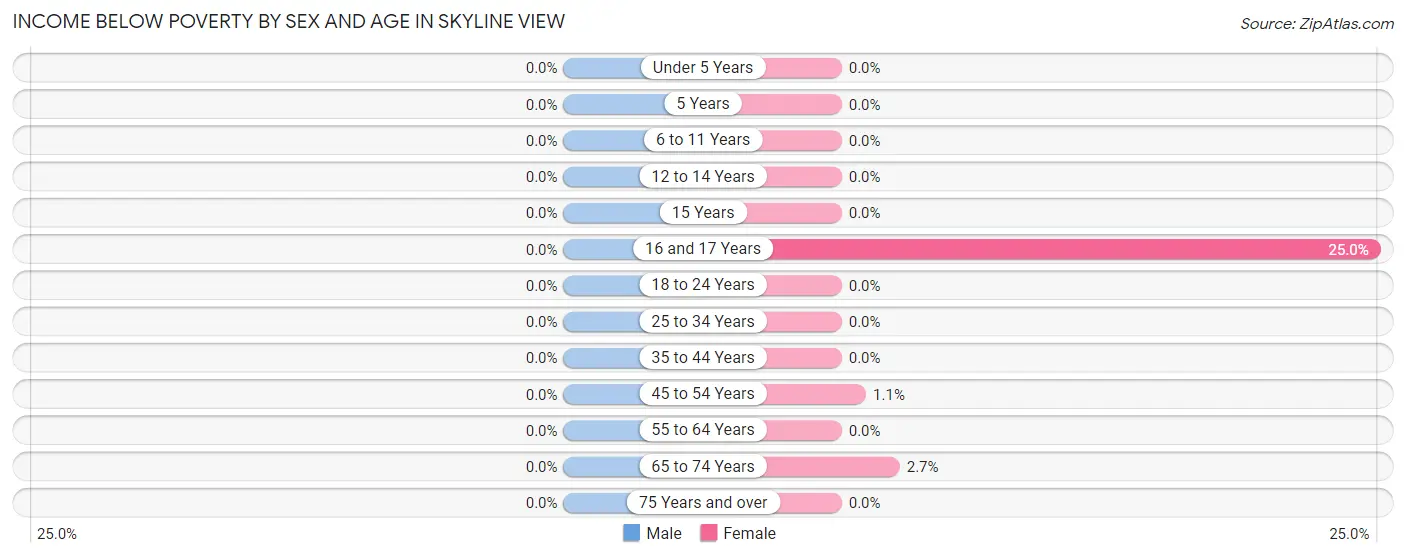
| Age Bracket | Male | Female |
| Under 5 Years | 0 (0.0%) | 0 (0.0%) |
| 5 Years | 0 (0.0%) | 0 (0.0%) |
| 6 to 11 Years | 0 (0.0%) | 0 (0.0%) |
| 12 to 14 Years | 0 (0.0%) | 0 (0.0%) |
| 15 Years | 0 (0.0%) | 0 (0.0%) |
| 16 and 17 Years | 0 (0.0%) | 3 (25.0%) |
| 18 to 24 Years | 0 (0.0%) | 0 (0.0%) |
| 25 to 34 Years | 0 (0.0%) | 0 (0.0%) |
| 35 to 44 Years | 0 (0.0%) | 0 (0.0%) |
| 45 to 54 Years | 0 (0.0%) | 3 (1.1%) |
| 55 to 64 Years | 0 (0.0%) | 0 (0.0%) |
| 65 to 74 Years | 0 (0.0%) | 21 (2.7%) |
| 75 Years and over | 0 (0.0%) | 0 (0.0%) |
| Total | 0 (0.0%) | 27 (1.1%) |
Income Above Poverty by Sex and Age in Skyline View
According to the poverty statistics in Skyline View, males aged under 5 years and females aged under 5 years are the age groups that are most secure financially, with 100.0% of males and 100.0% of females in these age groups living above the poverty line.
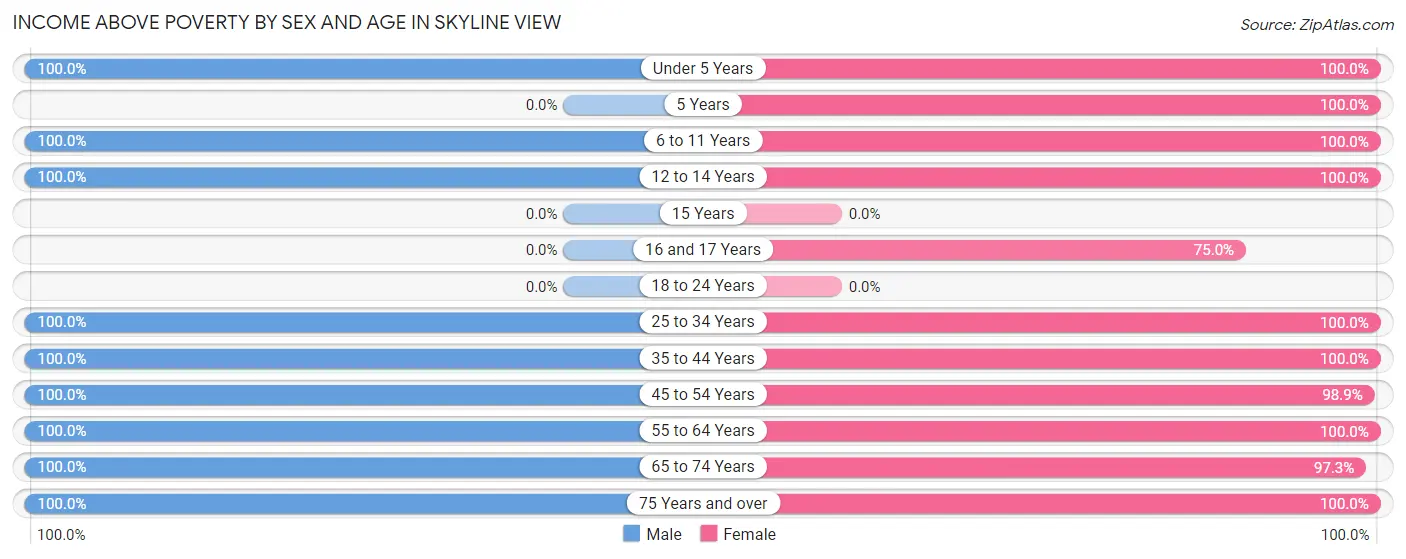
| Age Bracket | Male | Female |
| Under 5 Years | 169 (100.0%) | 45 (100.0%) |
| 5 Years | 0 (0.0%) | 8 (100.0%) |
| 6 to 11 Years | 204 (100.0%) | 179 (100.0%) |
| 12 to 14 Years | 62 (100.0%) | 52 (100.0%) |
| 15 Years | 0 (0.0%) | 0 (0.0%) |
| 16 and 17 Years | 0 (0.0%) | 9 (75.0%) |
| 18 to 24 Years | 0 (0.0%) | 0 (0.0%) |
| 25 to 34 Years | 268 (100.0%) | 316 (100.0%) |
| 35 to 44 Years | 195 (100.0%) | 277 (100.0%) |
| 45 to 54 Years | 262 (100.0%) | 262 (98.9%) |
| 55 to 64 Years | 315 (100.0%) | 343 (100.0%) |
| 65 to 74 Years | 642 (100.0%) | 759 (97.3%) |
| 75 Years and over | 183 (100.0%) | 125 (100.0%) |
| Total | 2,300 (100.0%) | 2,375 (98.9%) |
Income Below Poverty Among Married-Couple Families in Skyline View
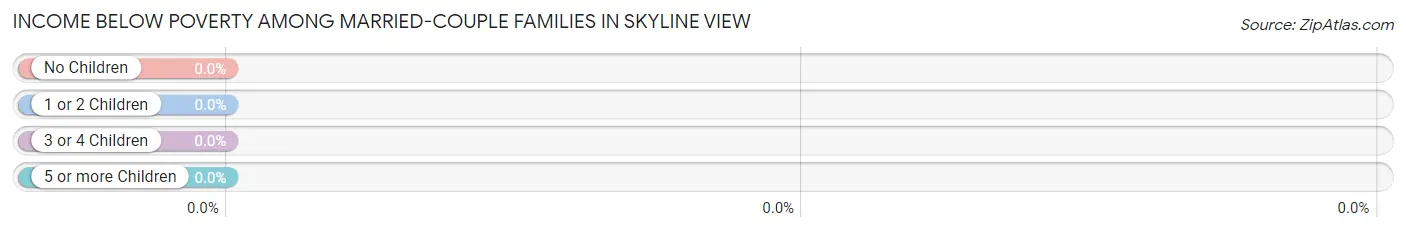
| Children | Above Poverty | Below Poverty |
| No Children | 1,144 (100.0%) | 0 (0.0%) |
| 1 or 2 Children | 399 (100.0%) | 0 (0.0%) |
| 3 or 4 Children | 39 (100.0%) | 0 (0.0%) |
| 5 or more Children | 0 (0.0%) | 0 (0.0%) |
| Total | 1,582 (100.0%) | 0 (0.0%) |
Income Below Poverty Among Single-Parent Households in Skyline View
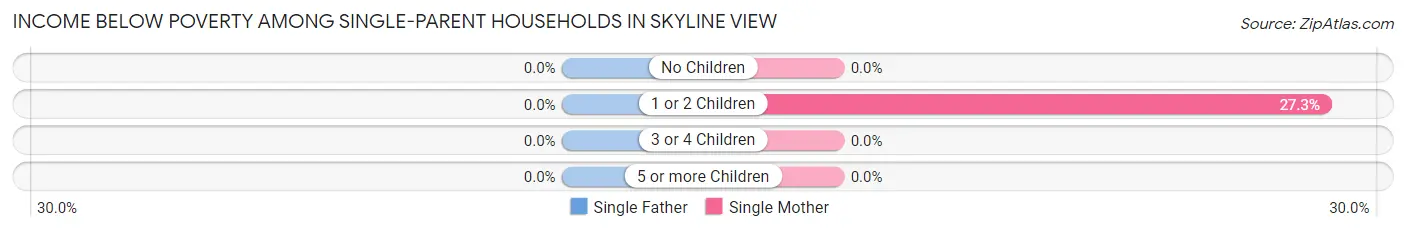
| Children | Single Father | Single Mother |
| No Children | 0 (0.0%) | 0 (0.0%) |
| 1 or 2 Children | 0 (0.0%) | 3 (27.3%) |
| 3 or 4 Children | 0 (0.0%) | 0 (0.0%) |
| 5 or more Children | 0 (0.0%) | 0 (0.0%) |
| Total | 0 (0.0%) | 3 (14.3%) |
Income Below Poverty Among Married-Couple vs Single-Parent Households in Skyline View
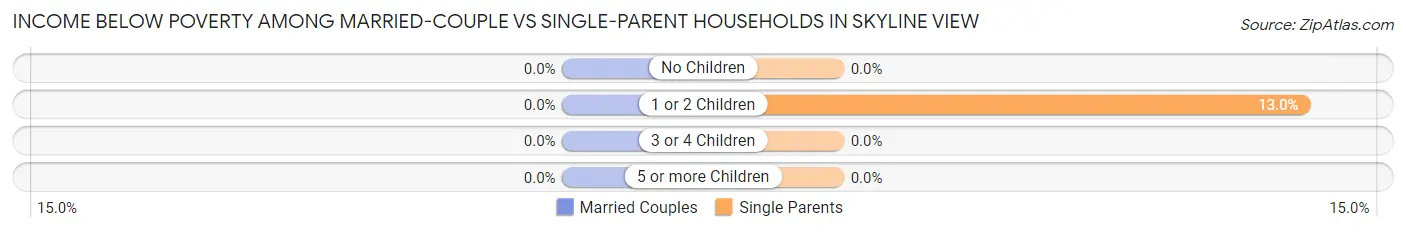
| Children | Married-Couple Families | Single-Parent Households |
| No Children | 0 (0.0%) | 0 (0.0%) |
| 1 or 2 Children | 0 (0.0%) | 3 (13.0%) |
| 3 or 4 Children | 0 (0.0%) | 0 (0.0%) |
| 5 or more Children | 0 (0.0%) | 0 (0.0%) |
| Total | 0 (0.0%) | 3 (9.1%) |
Race in Skyline View
The most populous races in Skyline View are White / Caucasian (4,334 | 89.4%), Black / African American (259 | 5.3%), and Hawaiian / Pacific (146 | 3.0%).
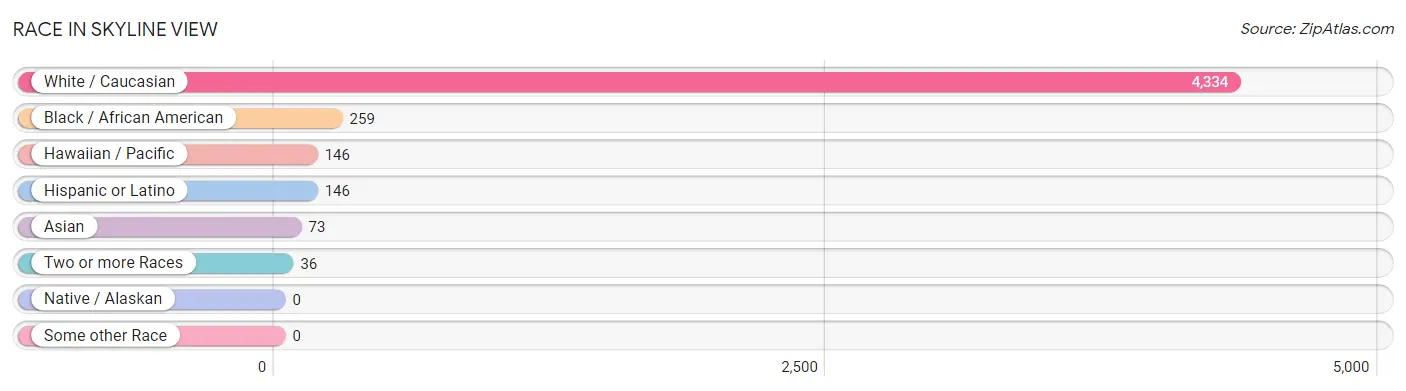
| Race | # Population | % Population |
| Asian | 73 | 1.5% |
| Black / African American | 259 | 5.3% |
| Hawaiian / Pacific | 146 | 3.0% |
| Hispanic or Latino | 146 | 3.0% |
| Native / Alaskan | 0 | 0.0% |
| White / Caucasian | 4,334 | 89.4% |
| Two or more Races | 36 | 0.7% |
| Some other Race | 0 | 0.0% |
| Total | 4,848 | 100.0% |
Ancestry in Skyline View
The most populous ancestries reported in Skyline View are German (1,943 | 40.1%), Irish (732 | 15.1%), Italian (603 | 12.4%), English (486 | 10.0%), and Dutch (281 | 5.8%), together accounting for 83.4% of all Skyline View residents.
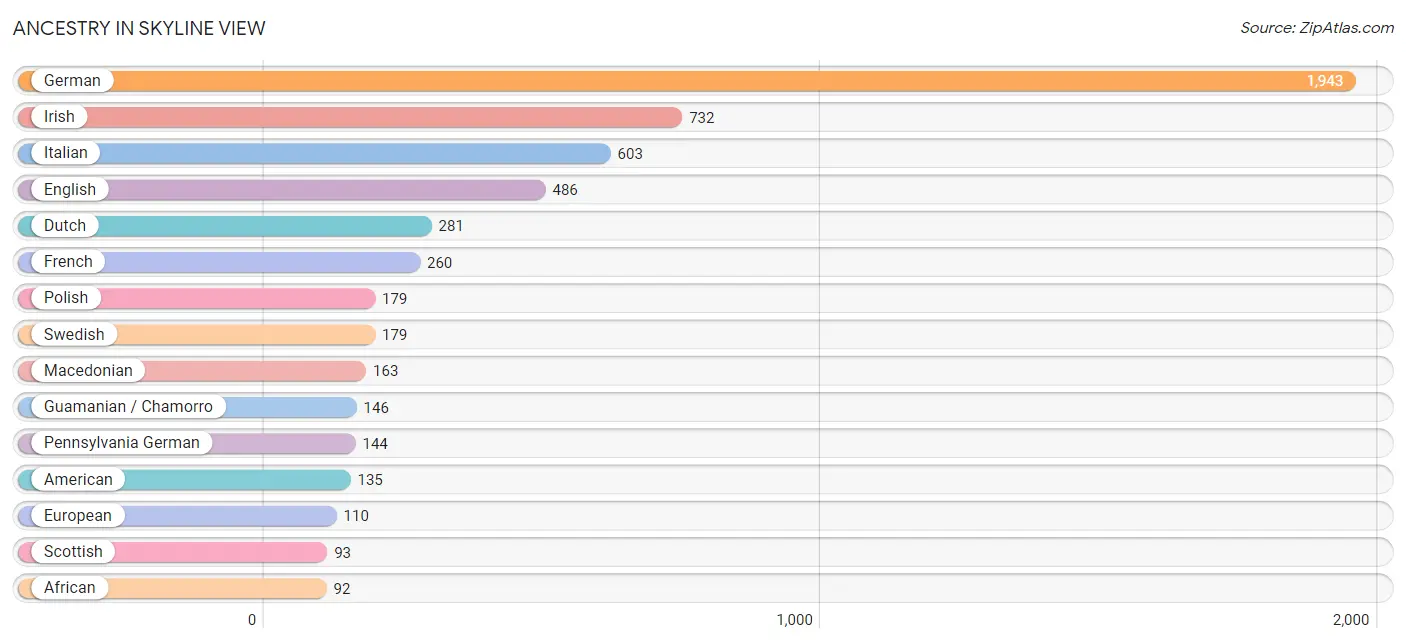
| Ancestry | # Population | % Population |
| African | 92 | 1.9% |
| American | 135 | 2.8% |
| Austrian | 19 | 0.4% |
| Brazilian | 32 | 0.7% |
| British | 40 | 0.8% |
| Dutch | 281 | 5.8% |
| English | 486 | 10.0% |
| European | 110 | 2.3% |
| French | 260 | 5.4% |
| German | 1,943 | 40.1% |
| Guamanian / Chamorro | 146 | 3.0% |
| Irish | 732 | 15.1% |
| Italian | 603 | 12.4% |
| Japanese | 35 | 0.7% |
| Korean | 10 | 0.2% |
| Macedonian | 163 | 3.4% |
| Pennsylvania German | 144 | 3.0% |
| Polish | 179 | 3.7% |
| Romanian | 48 | 1.0% |
| Russian | 49 | 1.0% |
| Scotch-Irish | 27 | 0.6% |
| Scottish | 93 | 1.9% |
| Subsaharan African | 92 | 1.9% |
| Swedish | 179 | 3.7% |
| Swiss | 18 | 0.4% |
| Thai | 64 | 1.3% |
| Welsh | 16 | 0.3% | View All 27 Rows |
Immigrants in Skyline View
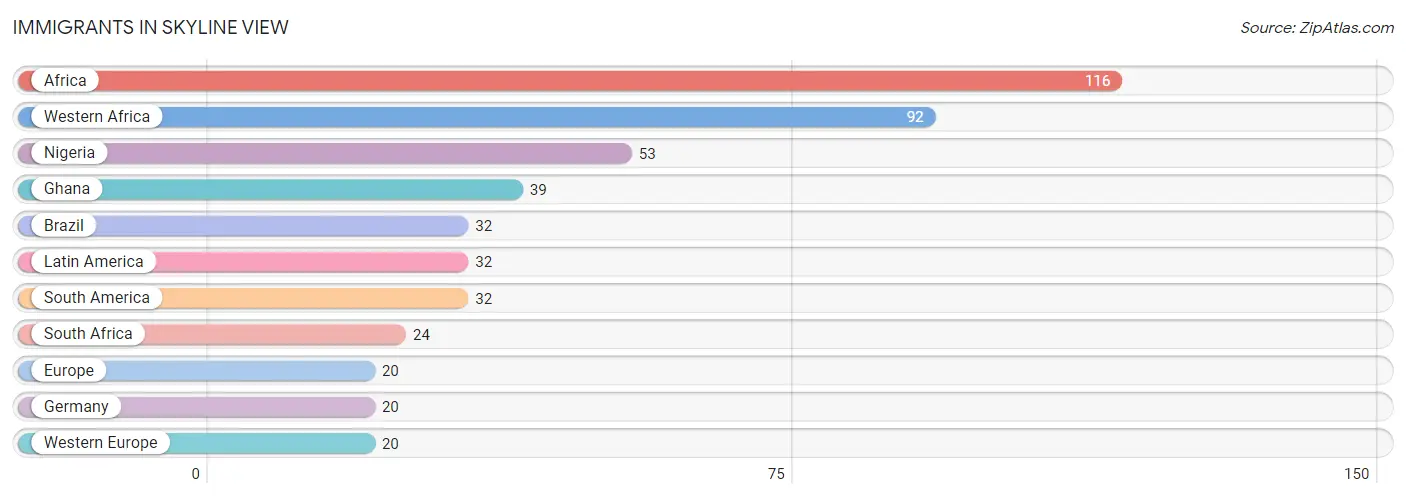
The most numerous immigrant groups reported in Skyline View came from Africa (116 | 2.4%), Western Africa (92 | 1.9%), Nigeria (53 | 1.1%), Ghana (39 | 0.8%), and Brazil (32 | 0.7%), together accounting for 6.8% of all Skyline View residents.
| Immigration Origin | # Population | % Population |
| Africa | 116 | 2.4% |
| Brazil | 32 | 0.7% |
| Europe | 20 | 0.4% |
| Germany | 20 | 0.4% |
| Ghana | 39 | 0.8% |
| Latin America | 32 | 0.7% |
| Nigeria | 53 | 1.1% |
| South Africa | 24 | 0.5% |
| South America | 32 | 0.7% |
| Western Africa | 92 | 1.9% |
| Western Europe | 20 | 0.4% | View All 11 Rows |
Sex and Age in Skyline View
Sex and Age in Skyline View
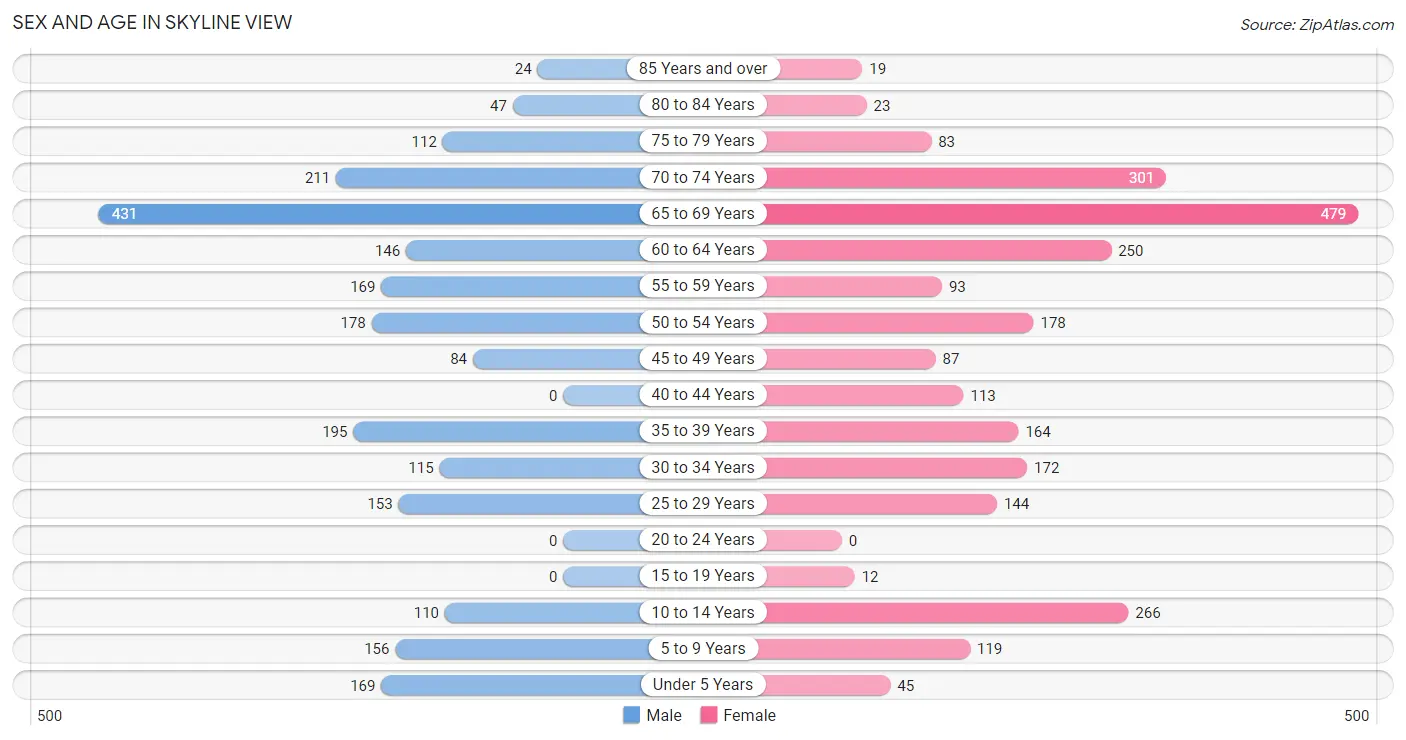
The most populous age groups in Skyline View are 65 to 69 Years (431 | 18.7%) for men and 65 to 69 Years (479 | 18.8%) for women.
| Age Bracket | Male | Female |
| Under 5 Years | 169 (7.3%) | 45 (1.8%) |
| 5 to 9 Years | 156 (6.8%) | 119 (4.7%) |
| 10 to 14 Years | 110 (4.8%) | 266 (10.4%) |
| 15 to 19 Years | 0 (0.0%) | 12 (0.5%) |
| 20 to 24 Years | 0 (0.0%) | 0 (0.0%) |
| 25 to 29 Years | 153 (6.7%) | 144 (5.7%) |
| 30 to 34 Years | 115 (5.0%) | 172 (6.8%) |
| 35 to 39 Years | 195 (8.5%) | 164 (6.4%) |
| 40 to 44 Years | 0 (0.0%) | 113 (4.4%) |
| 45 to 49 Years | 84 (3.6%) | 87 (3.4%) |
| 50 to 54 Years | 178 (7.7%) | 178 (7.0%) |
| 55 to 59 Years | 169 (7.3%) | 93 (3.6%) |
| 60 to 64 Years | 146 (6.4%) | 250 (9.8%) |
| 65 to 69 Years | 431 (18.7%) | 479 (18.8%) |
| 70 to 74 Years | 211 (9.2%) | 301 (11.8%) |
| 75 to 79 Years | 112 (4.9%) | 83 (3.3%) |
| 80 to 84 Years | 47 (2.0%) | 23 (0.9%) |
| 85 Years and over | 24 (1.0%) | 19 (0.7%) |
| Total | 2,300 (100.0%) | 2,548 (100.0%) |
Families and Households in Skyline View
Median Family Size in Skyline View
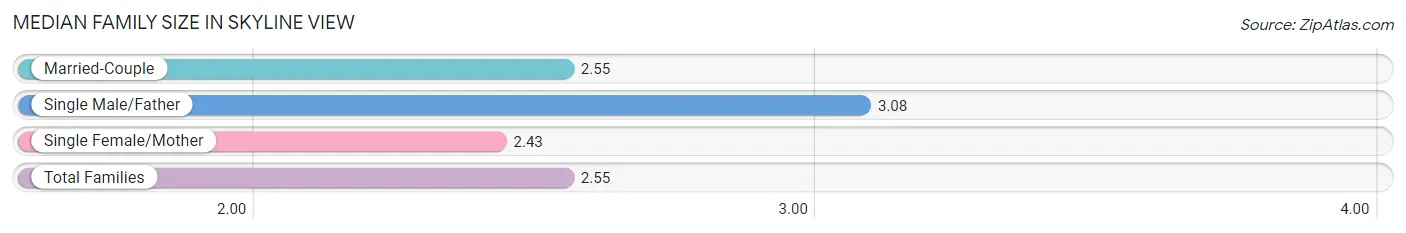
The median family size in Skyline View is 2.55 persons per family, with single male/father families (12 | 0.7%) accounting for the largest median family size of 3.08 persons per family. On the other hand, single female/mother families (21 | 1.3%) represent the smallest median family size with 2.43 persons per family.
| Family Type | # Families | Family Size |
| Married-Couple | 1,582 (98.0%) | 2.55 |
| Single Male/Father | 12 (0.7%) | 3.08 |
| Single Female/Mother | 21 (1.3%) | 2.43 |
| Total Families | 1,615 (100.0%) | 2.55 |
Median Household Size in Skyline View
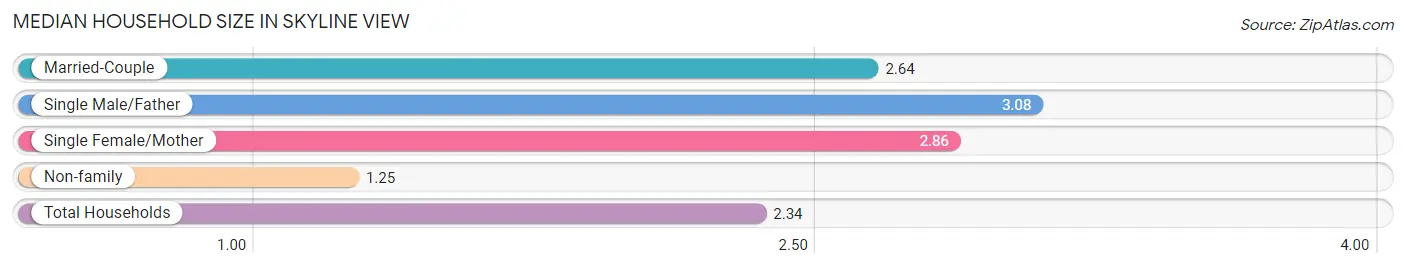
The median household size in Skyline View is 2.34 persons per household, with single male/father households (12 | 0.6%) accounting for the largest median household size of 3.08 persons per household. non-family households (459 | 22.1%) represent the smallest median household size with 1.25 persons per household.
| Household Type | # Households | Household Size |
| Married-Couple | 1,582 (76.3%) | 2.64 |
| Single Male/Father | 12 (0.6%) | 3.08 |
| Single Female/Mother | 21 (1.0%) | 2.86 |
| Non-family | 459 (22.1%) | 1.25 |
| Total Households | 2,074 (100.0%) | 2.34 |
Household Size by Marriage Status in Skyline View
Out of a total of 2,074 households in Skyline View, 1,615 (77.9%) are family households, while 459 (22.1%) are nonfamily households. The most numerous type of family households are 2-person households, comprising 996, and the most common type of nonfamily households are 1-person households, comprising 305.
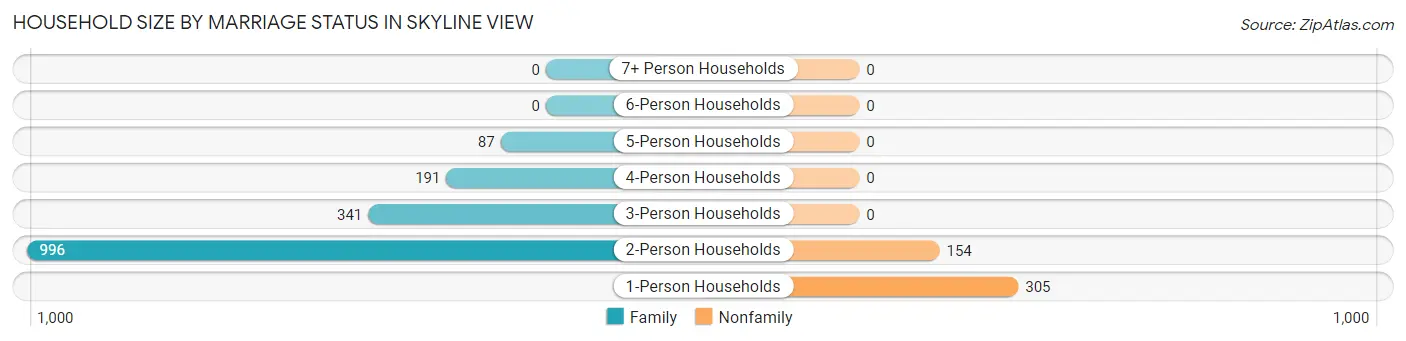
| Household Size | Family Households | Nonfamily Households |
| 1-Person Households | - | 305 (14.7%) |
| 2-Person Households | 996 (48.0%) | 154 (7.4%) |
| 3-Person Households | 341 (16.4%) | 0 (0.0%) |
| 4-Person Households | 191 (9.2%) | 0 (0.0%) |
| 5-Person Households | 87 (4.2%) | 0 (0.0%) |
| 6-Person Households | 0 (0.0%) | 0 (0.0%) |
| 7+ Person Households | 0 (0.0%) | 0 (0.0%) |
| Total | 1,615 (77.9%) | 459 (22.1%) |
Female Fertility in Skyline View
Fertility by Age in Skyline View
Average fertility rate in Skyline View is 66.0 births per 1,000 women. Women in the age bracket of 20 to 34 years have the highest fertility rate with 146.0 births per 1,000 women. Women in the age bracket of 20 to 34 years acount for 100.0% of all women with births.
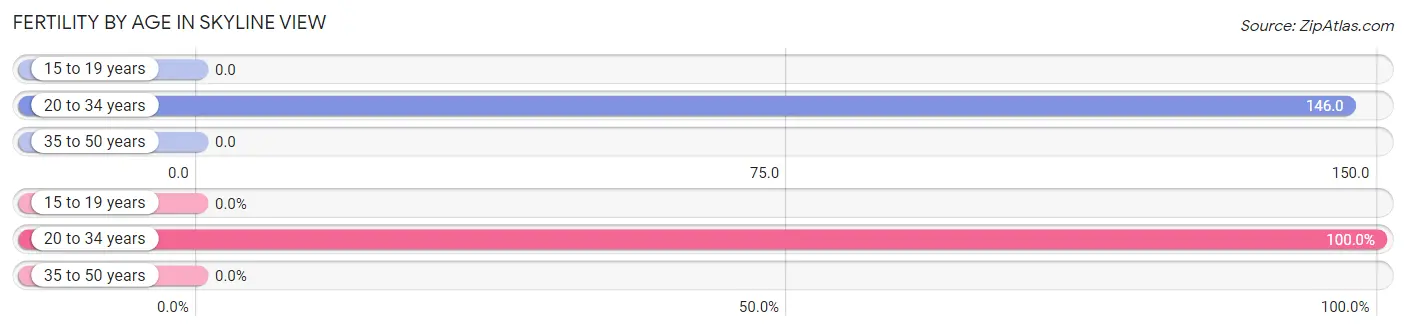
| Age Bracket | Women with Births | Births / 1,000 Women |
| 15 to 19 years | 0 (0.0%) | 0.0 |
| 20 to 34 years | 46 (100.0%) | 146.0 |
| 35 to 50 years | 0 (0.0%) | 0.0 |
| Total | 46 (100.0%) | 66.0 |
Fertility by Age by Marriage Status in Skyline View
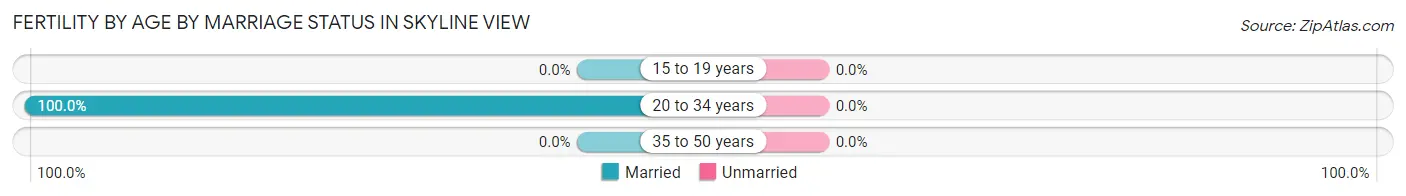
| Age Bracket | Married | Unmarried |
| 15 to 19 years | 0 (0.0%) | 0 (0.0%) |
| 20 to 34 years | 46 (100.0%) | 0 (0.0%) |
| 35 to 50 years | 0 (0.0%) | 0 (0.0%) |
| Total | 46 (100.0%) | 0 (0.0%) |
Fertility by Education in Skyline View
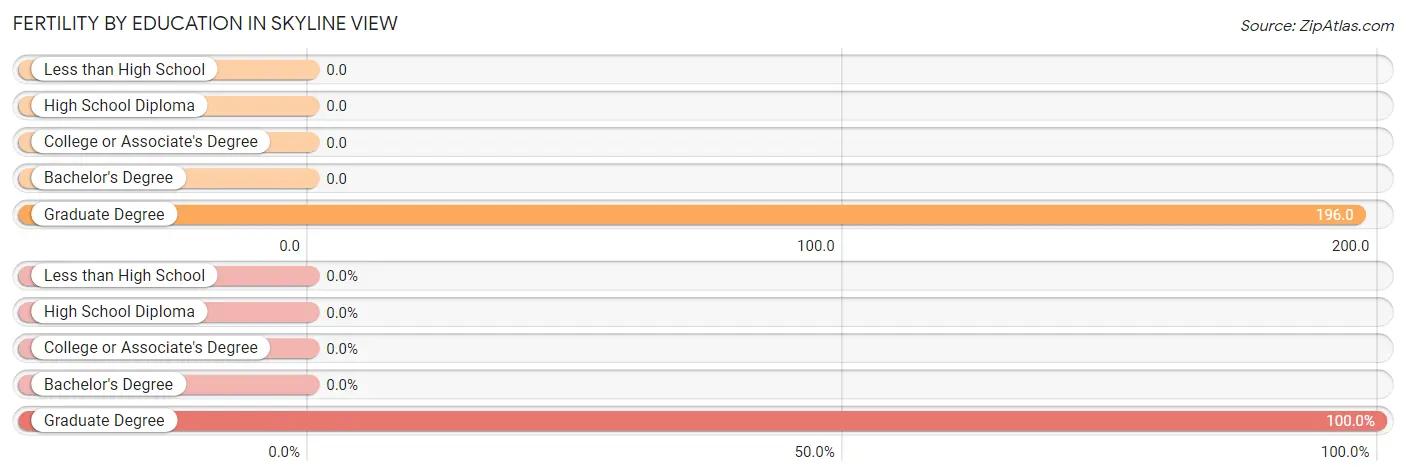
| Educational Attainment | Women with Births | Births / 1,000 Women |
| Less than High School | 0 (0.0%) | 0.0 |
| High School Diploma | 0 (0.0%) | 0.0 |
| College or Associate's Degree | 0 (0.0%) | 0.0 |
| Bachelor's Degree | 0 (0.0%) | 0.0 |
| Graduate Degree | 46 (100.0%) | 196.0 |
| Total | 46 (100.0%) | 66.0 |
Fertility by Education by Marriage Status in Skyline View
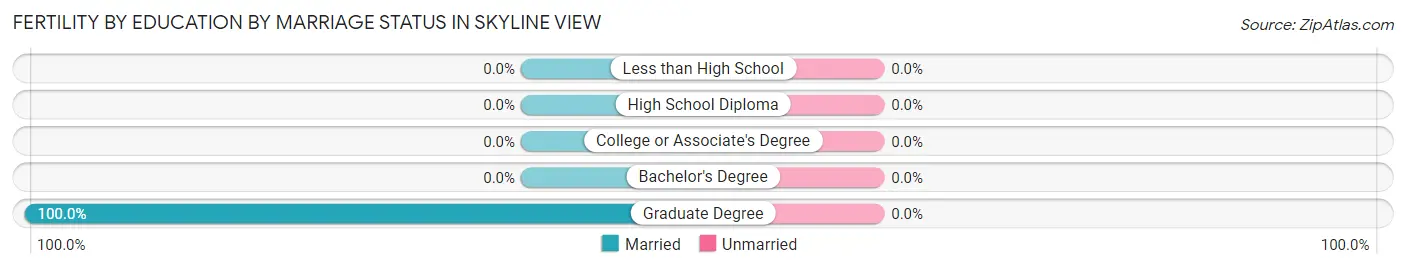
| Educational Attainment | Married | Unmarried |
| Less than High School | 0 (0.0%) | 0 (0.0%) |
| High School Diploma | 0 (0.0%) | 0 (0.0%) |
| College or Associate's Degree | 0 (0.0%) | 0 (0.0%) |
| Bachelor's Degree | 0 (0.0%) | 0 (0.0%) |
| Graduate Degree | 46 (100.0%) | 0 (0.0%) |
| Total | 46 (100.0%) | 0 (0.0%) |
Employment Characteristics in Skyline View
Employment by Class of Employer in Skyline View
Among the 2,400 employed individuals in Skyline View, private company employees (1,570 | 65.4%), not-for-profit organizations (276 | 11.5%), and state government employees (172 | 7.2%) make up the most common classes of employment.
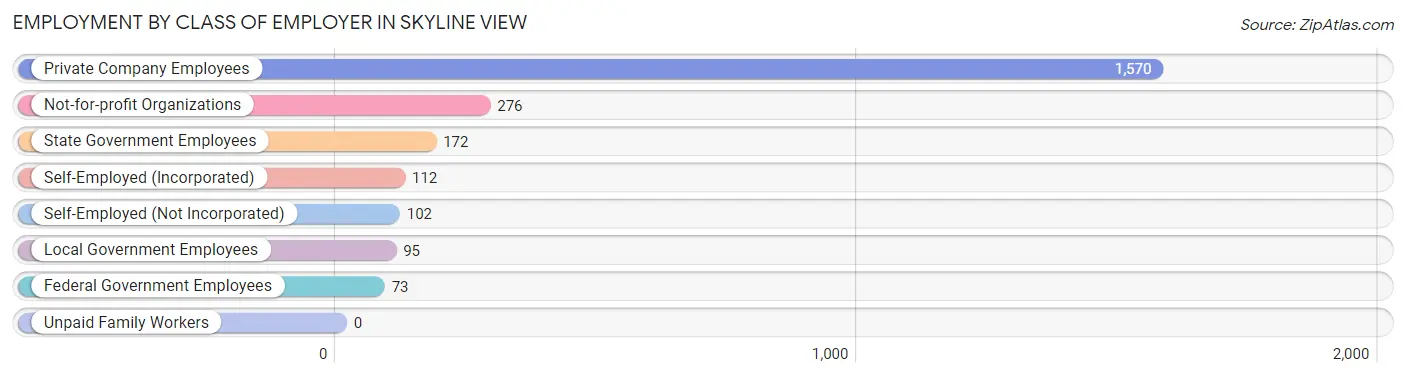
| Employer Class | # Employees | % Employees |
| Private Company Employees | 1,570 | 65.4% |
| Self-Employed (Incorporated) | 112 | 4.7% |
| Self-Employed (Not Incorporated) | 102 | 4.3% |
| Not-for-profit Organizations | 276 | 11.5% |
| Local Government Employees | 95 | 4.0% |
| State Government Employees | 172 | 7.2% |
| Federal Government Employees | 73 | 3.0% |
| Unpaid Family Workers | 0 | 0.0% |
| Total | 2,400 | 100.0% |
Employment Status by Age in Skyline View
According to the labor force statistics for Skyline View, out of the total population over 16 years of age (3,983), 62.7% or 2,497 individuals are in the labor force, with 0.8% or 20 of them unemployed. The age group with the highest labor force participation rate is 25 to 29 years, with 100.0% or 297 individuals in the labor force. Within the labor force, the 60 to 64 years age range has the highest percentage of unemployed individuals, with 8.5% or 21 of them being unemployed.
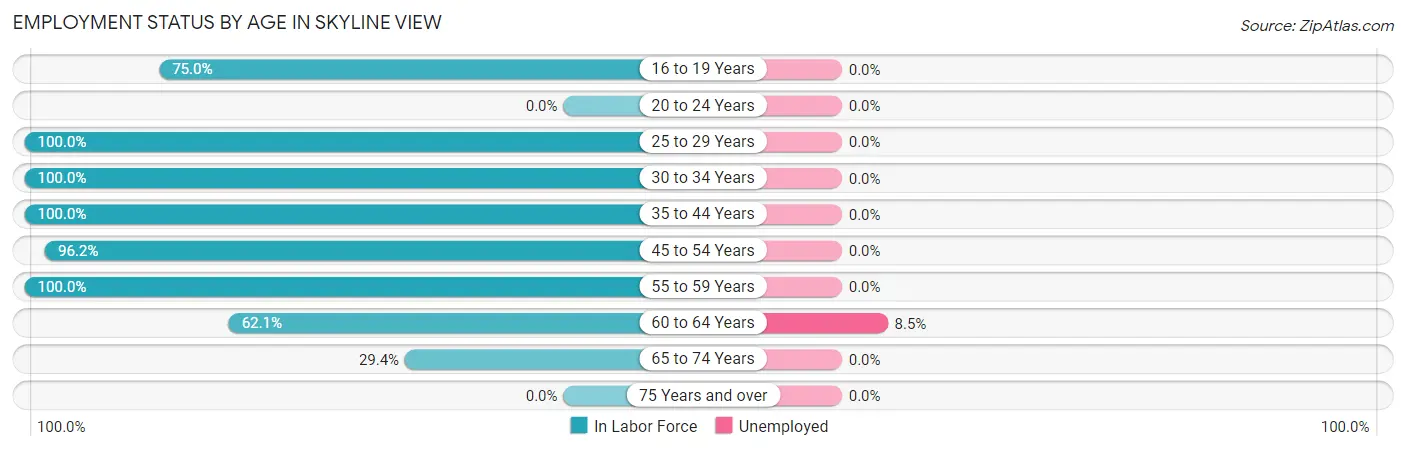
| Age Bracket | In Labor Force | Unemployed |
| 16 to 19 Years | 9 (75.0%) | 0 (0.0%) |
| 20 to 24 Years | 0 (0.0%) | 0 (0.0%) |
| 25 to 29 Years | 297 (100.0%) | 0 (0.0%) |
| 30 to 34 Years | 287 (100.0%) | 0 (0.0%) |
| 35 to 44 Years | 472 (100.0%) | 0 (0.0%) |
| 45 to 54 Years | 507 (96.2%) | 0 (0.0%) |
| 55 to 59 Years | 262 (100.0%) | 0 (0.0%) |
| 60 to 64 Years | 246 (62.1%) | 21 (8.5%) |
| 65 to 74 Years | 418 (29.4%) | 0 (0.0%) |
| 75 Years and over | 0 (0.0%) | 0 (0.0%) |
| Total | 2,497 (62.7%) | 20 (0.8%) |
Employment Status by Educational Attainment in Skyline View
According to labor force statistics for Skyline View, 92.4% of individuals (2,071) out of the total population between 25 and 64 years of age (2,241) are in the labor force, with 1.0% or 21 of them being unemployed. The group with the highest labor force participation rate are those with the educational attainment of bachelor's degree or higher, with 96.5% or 909 individuals in the labor force. Within the labor force, individuals with college / associate degree education have the highest percentage of unemployment, with 3.9% or 21 of them being unemployed.
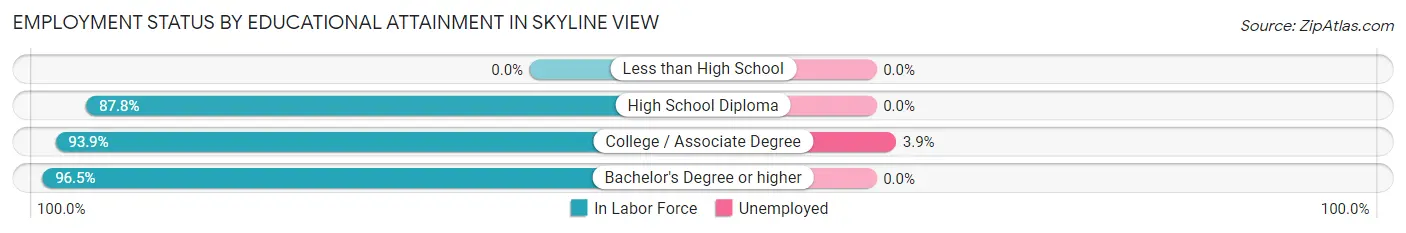
| Educational Attainment | In Labor Force | Unemployed |
| Less than High School | 0 (0.0%) | 0 (0.0%) |
| High School Diploma | 627 (87.8%) | 0 (0.0%) |
| College / Associate Degree | 535 (93.9%) | 22 (3.9%) |
| Bachelor's Degree or higher | 909 (96.5%) | 0 (0.0%) |
| Total | 2,071 (92.4%) | 22 (1.0%) |
Employment Occupations by Sex in Skyline View
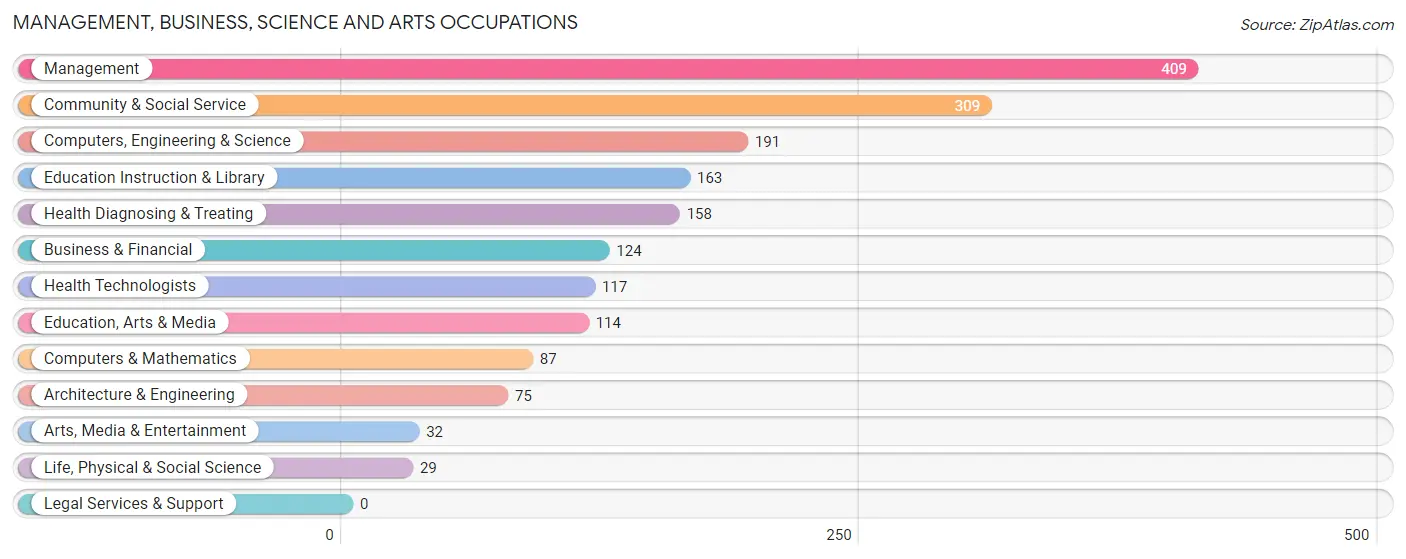
Management, Business, Science and Arts Occupations
The most common Management, Business, Science and Arts occupations in Skyline View are Management (409 | 16.7%), Community & Social Service (309 | 12.6%), Computers, Engineering & Science (191 | 7.8%), Education Instruction & Library (163 | 6.6%), and Health Diagnosing & Treating (158 | 6.4%).
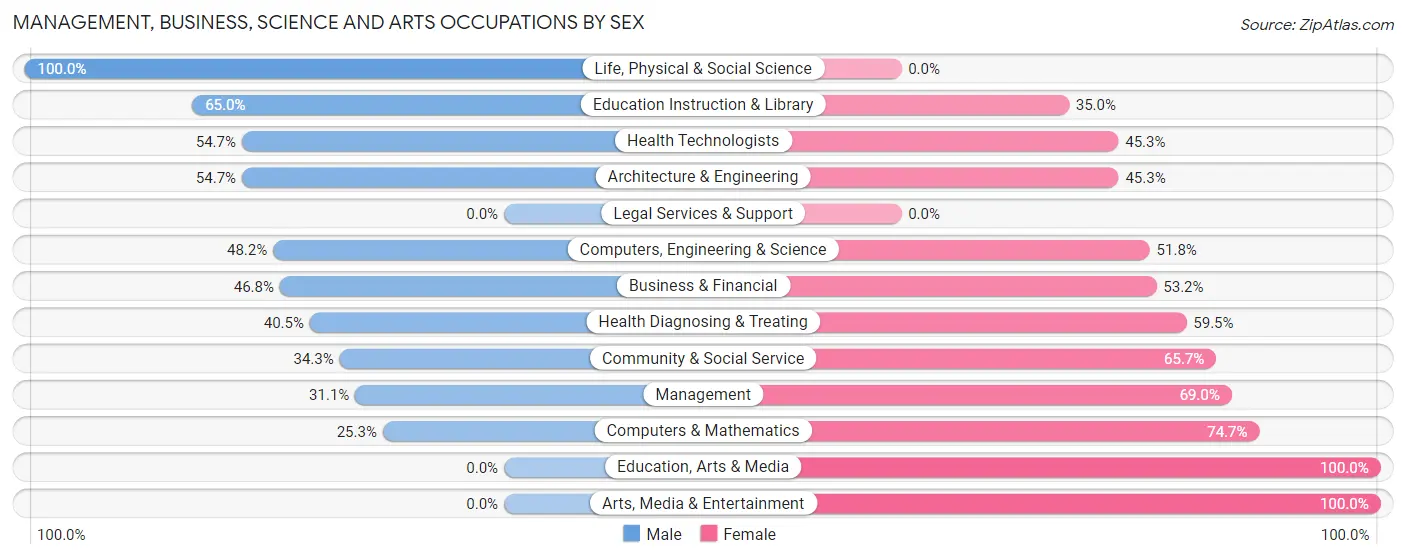
Management, Business, Science and Arts Occupations by Sex
Within the Management, Business, Science and Arts occupations in Skyline View, the most male-oriented occupations are Life, Physical & Social Science (100.0%), Education Instruction & Library (65.0%), and Health Technologists (54.7%), while the most female-oriented occupations are Education, Arts & Media (100.0%), Arts, Media & Entertainment (100.0%), and Computers & Mathematics (74.7%).
| Occupation | Male | Female |
| Management | 127 (31.0%) | 282 (69.0%) |
| Business & Financial | 58 (46.8%) | 66 (53.2%) |
| Computers, Engineering & Science | 92 (48.2%) | 99 (51.8%) |
| Computers & Mathematics | 22 (25.3%) | 65 (74.7%) |
| Architecture & Engineering | 41 (54.7%) | 34 (45.3%) |
| Life, Physical & Social Science | 29 (100.0%) | 0 (0.0%) |
| Community & Social Service | 106 (34.3%) | 203 (65.7%) |
| Education, Arts & Media | 0 (0.0%) | 114 (100.0%) |
| Legal Services & Support | 0 (0.0%) | 0 (0.0%) |
| Education Instruction & Library | 106 (65.0%) | 57 (35.0%) |
| Arts, Media & Entertainment | 0 (0.0%) | 32 (100.0%) |
| Health Diagnosing & Treating | 64 (40.5%) | 94 (59.5%) |
| Health Technologists | 64 (54.7%) | 53 (45.3%) |
| Total (Category) | 447 (37.5%) | 744 (62.5%) |
| Total (Overall) | 1,241 (50.6%) | 1,212 (49.4%) |
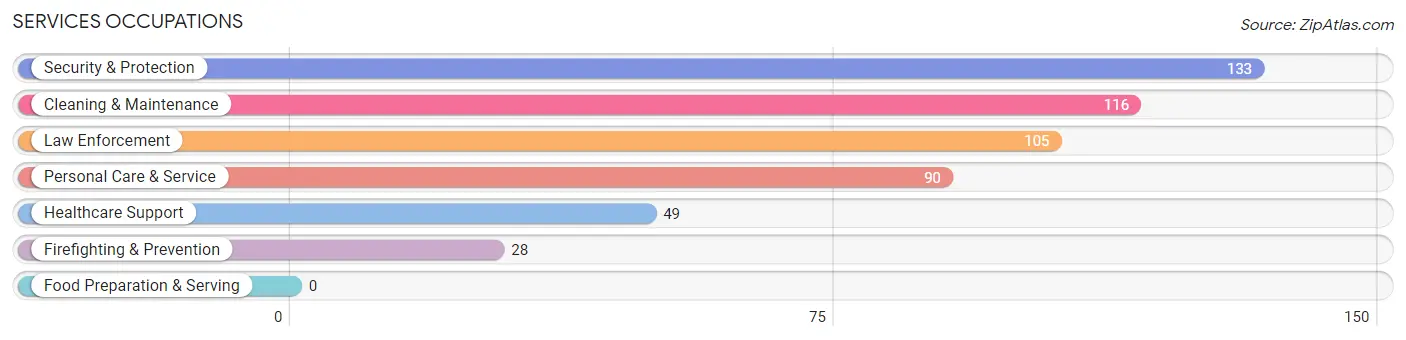
Services Occupations
The most common Services occupations in Skyline View are Security & Protection (133 | 5.4%), Cleaning & Maintenance (116 | 4.7%), Law Enforcement (105 | 4.3%), Personal Care & Service (90 | 3.7%), and Healthcare Support (49 | 2.0%).
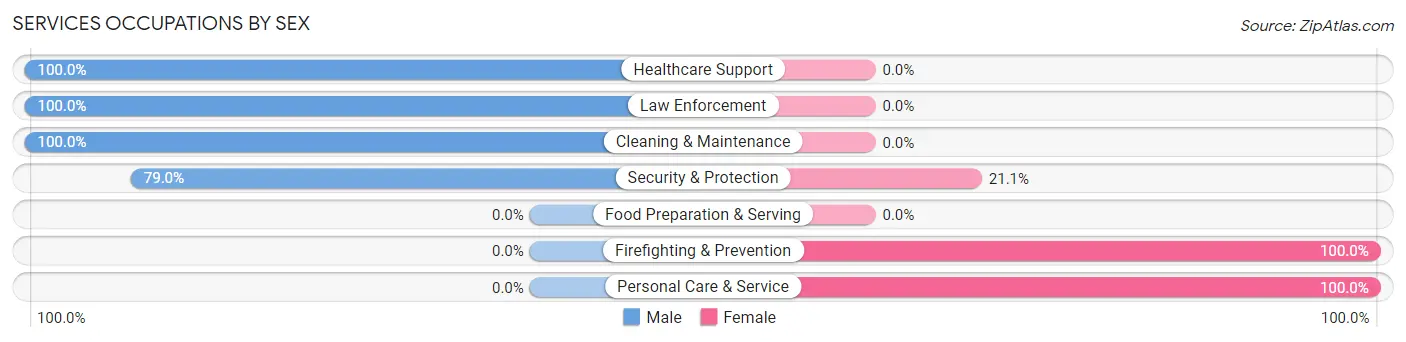
Services Occupations by Sex
Within the Services occupations in Skyline View, the most male-oriented occupations are Healthcare Support (100.0%), Law Enforcement (100.0%), and Cleaning & Maintenance (100.0%), while the most female-oriented occupations are Firefighting & Prevention (100.0%), Personal Care & Service (100.0%), and Security & Protection (21.0%).
| Occupation | Male | Female |
| Healthcare Support | 49 (100.0%) | 0 (0.0%) |
| Security & Protection | 105 (78.9%) | 28 (21.0%) |
| Firefighting & Prevention | 0 (0.0%) | 28 (100.0%) |
| Law Enforcement | 105 (100.0%) | 0 (0.0%) |
| Food Preparation & Serving | 0 (0.0%) | 0 (0.0%) |
| Cleaning & Maintenance | 116 (100.0%) | 0 (0.0%) |
| Personal Care & Service | 0 (0.0%) | 90 (100.0%) |
| Total (Category) | 270 (69.6%) | 118 (30.4%) |
| Total (Overall) | 1,241 (50.6%) | 1,212 (49.4%) |
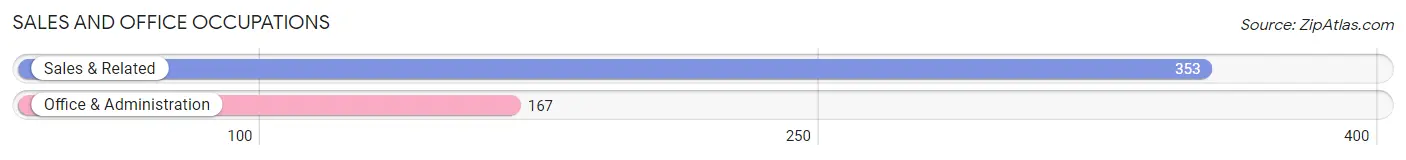
Sales and Office Occupations
The most common Sales and Office occupations in Skyline View are Sales & Related (353 | 14.4%), and Office & Administration (167 | 6.8%).
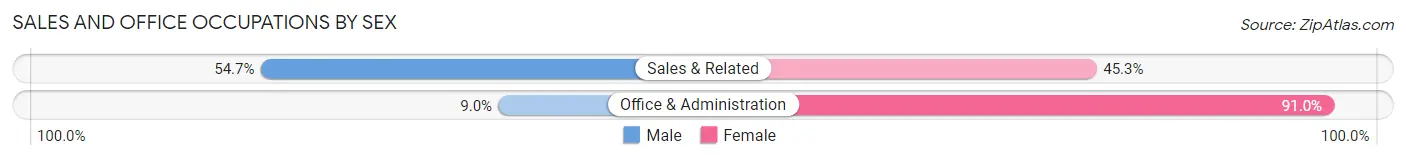
Sales and Office Occupations by Sex
| Occupation | Male | Female |
| Sales & Related | 193 (54.7%) | 160 (45.3%) |
| Office & Administration | 15 (9.0%) | 152 (91.0%) |
| Total (Category) | 208 (40.0%) | 312 (60.0%) |
| Total (Overall) | 1,241 (50.6%) | 1,212 (49.4%) |
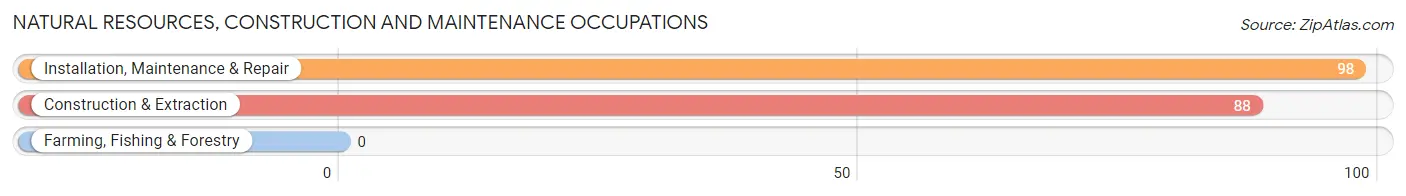
Natural Resources, Construction and Maintenance Occupations
The most common Natural Resources, Construction and Maintenance occupations in Skyline View are Installation, Maintenance & Repair (98 | 4.0%), and Construction & Extraction (88 | 3.6%).
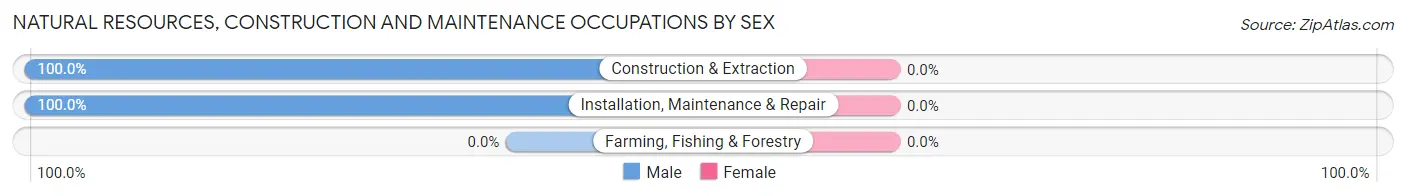
Natural Resources, Construction and Maintenance Occupations by Sex
| Occupation | Male | Female |
| Farming, Fishing & Forestry | 0 (0.0%) | 0 (0.0%) |
| Construction & Extraction | 88 (100.0%) | 0 (0.0%) |
| Installation, Maintenance & Repair | 98 (100.0%) | 0 (0.0%) |
| Total (Category) | 186 (100.0%) | 0 (0.0%) |
| Total (Overall) | 1,241 (50.6%) | 1,212 (49.4%) |
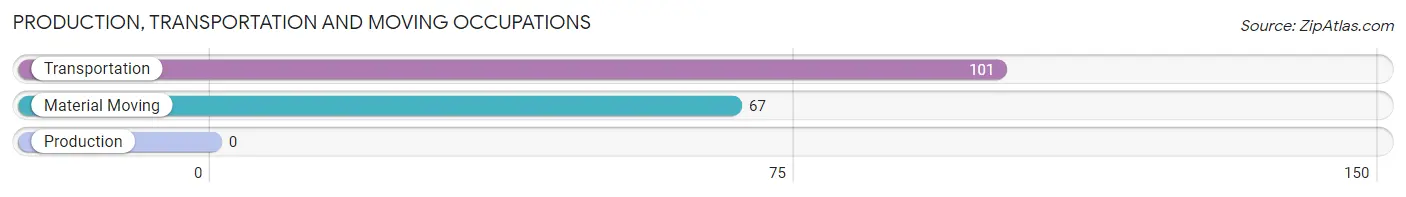
Production, Transportation and Moving Occupations
The most common Production, Transportation and Moving occupations in Skyline View are Transportation (101 | 4.1%), and Material Moving (67 | 2.7%).
Production, Transportation and Moving Occupations by Sex
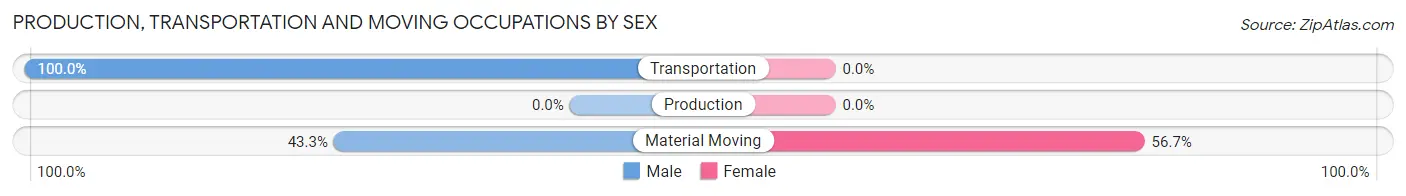
| Occupation | Male | Female |
| Production | 0 (0.0%) | 0 (0.0%) |
| Transportation | 101 (100.0%) | 0 (0.0%) |
| Material Moving | 29 (43.3%) | 38 (56.7%) |
| Total (Category) | 130 (77.4%) | 38 (22.6%) |
| Total (Overall) | 1,241 (50.6%) | 1,212 (49.4%) |
Employment Industries by Sex in Skyline View
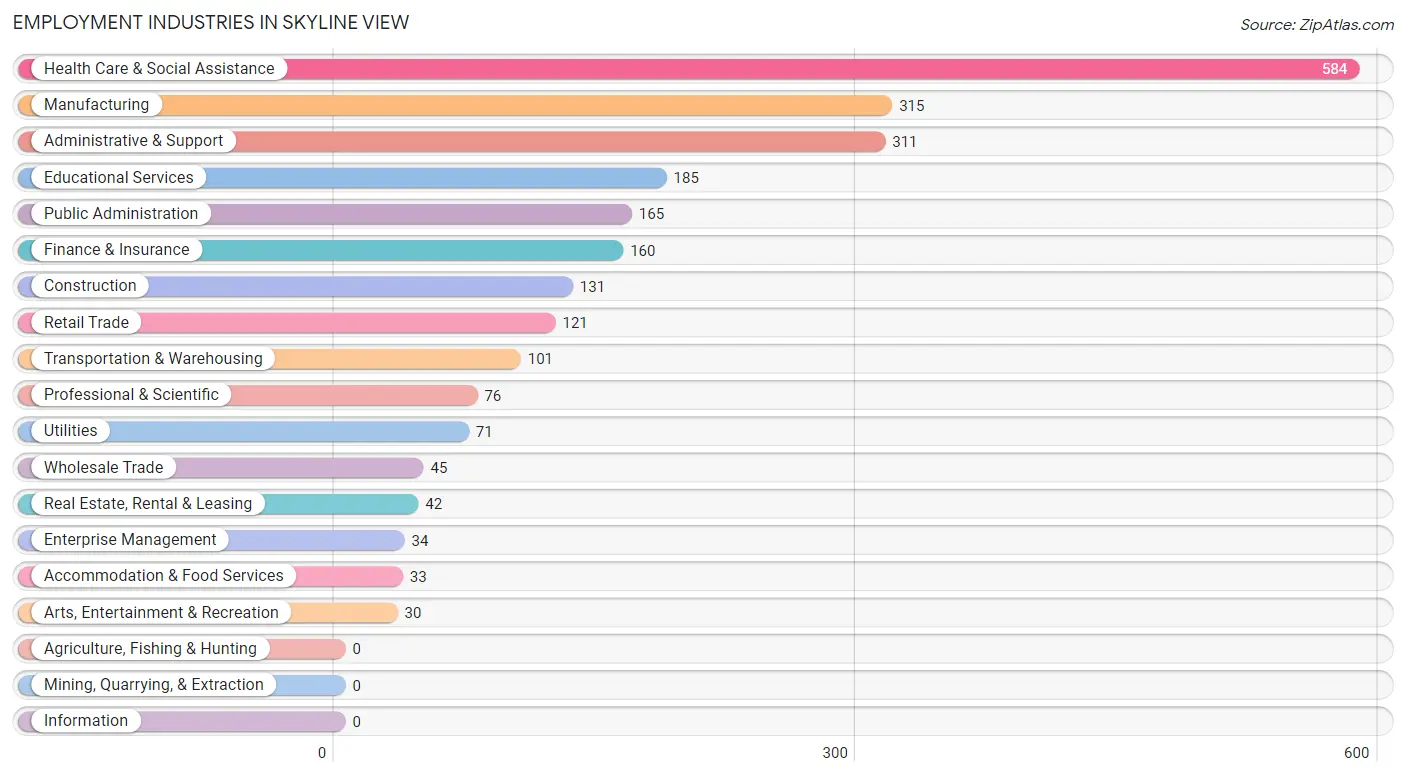
Employment Industries in Skyline View
The major employment industries in Skyline View include Health Care & Social Assistance (584 | 23.8%), Manufacturing (315 | 12.8%), Administrative & Support (311 | 12.7%), Educational Services (185 | 7.5%), and Public Administration (165 | 6.7%).
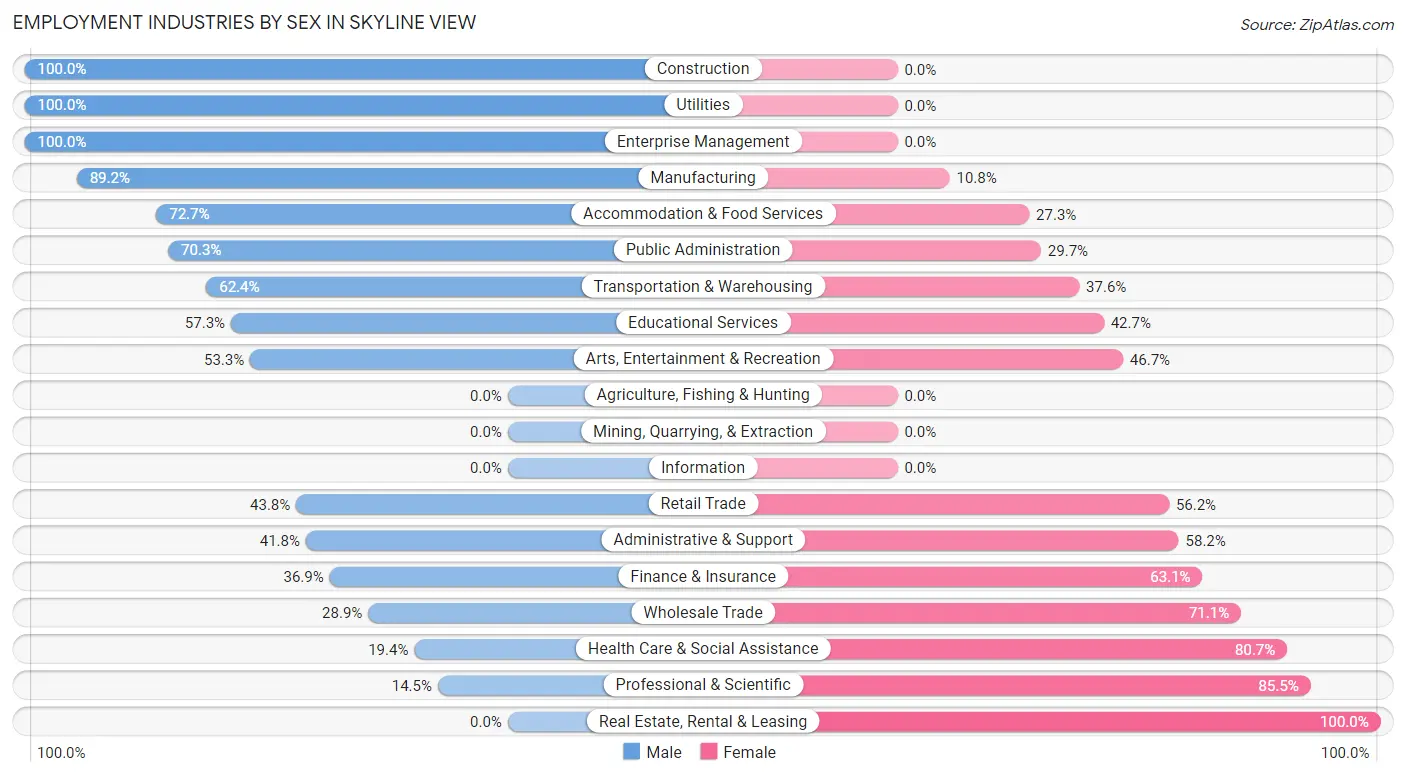
Employment Industries by Sex in Skyline View
The Skyline View industries that see more men than women are Construction (100.0%), Utilities (100.0%), and Enterprise Management (100.0%), whereas the industries that tend to have a higher number of women are Real Estate, Rental & Leasing (100.0%), Professional & Scientific (85.5%), and Health Care & Social Assistance (80.6%).
| Industry | Male | Female |
| Agriculture, Fishing & Hunting | 0 (0.0%) | 0 (0.0%) |
| Mining, Quarrying, & Extraction | 0 (0.0%) | 0 (0.0%) |
| Construction | 131 (100.0%) | 0 (0.0%) |
| Manufacturing | 281 (89.2%) | 34 (10.8%) |
| Wholesale Trade | 13 (28.9%) | 32 (71.1%) |
| Retail Trade | 53 (43.8%) | 68 (56.2%) |
| Transportation & Warehousing | 63 (62.4%) | 38 (37.6%) |
| Utilities | 71 (100.0%) | 0 (0.0%) |
| Information | 0 (0.0%) | 0 (0.0%) |
| Finance & Insurance | 59 (36.9%) | 101 (63.1%) |
| Real Estate, Rental & Leasing | 0 (0.0%) | 42 (100.0%) |
| Professional & Scientific | 11 (14.5%) | 65 (85.5%) |
| Enterprise Management | 34 (100.0%) | 0 (0.0%) |
| Administrative & Support | 130 (41.8%) | 181 (58.2%) |
| Educational Services | 106 (57.3%) | 79 (42.7%) |
| Health Care & Social Assistance | 113 (19.4%) | 471 (80.6%) |
| Arts, Entertainment & Recreation | 16 (53.3%) | 14 (46.7%) |
| Accommodation & Food Services | 24 (72.7%) | 9 (27.3%) |
| Public Administration | 116 (70.3%) | 49 (29.7%) |
| Total | 1,241 (50.6%) | 1,212 (49.4%) |
Education in Skyline View
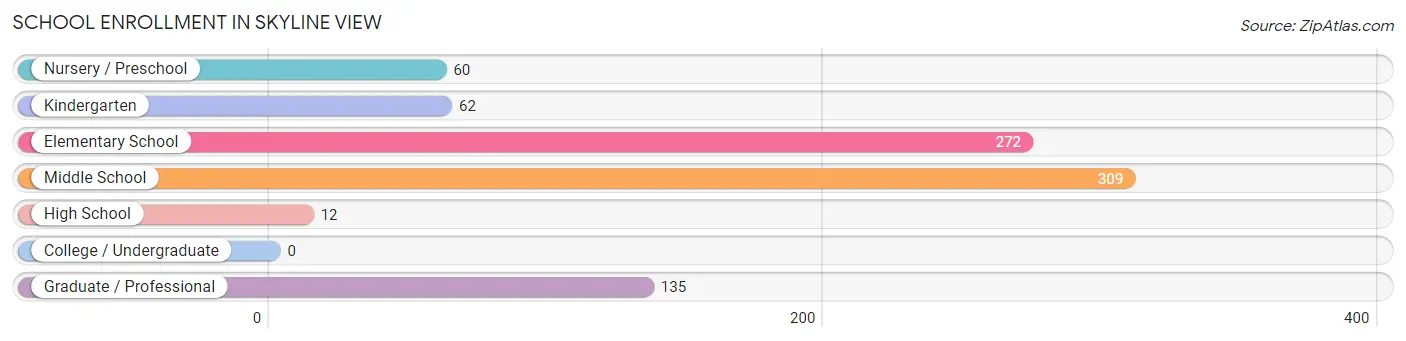
School Enrollment in Skyline View
The most common levels of schooling among the 850 students in Skyline View are middle school (309 | 36.3%), elementary school (272 | 32.0%), and graduate / professional (135 | 15.9%).
| School Level | # Students | % Students |
| Nursery / Preschool | 60 | 7.1% |
| Kindergarten | 62 | 7.3% |
| Elementary School | 272 | 32.0% |
| Middle School | 309 | 36.3% |
| High School | 12 | 1.4% |
| College / Undergraduate | 0 | 0.0% |
| Graduate / Professional | 135 | 15.9% |
| Total | 850 | 100.0% |
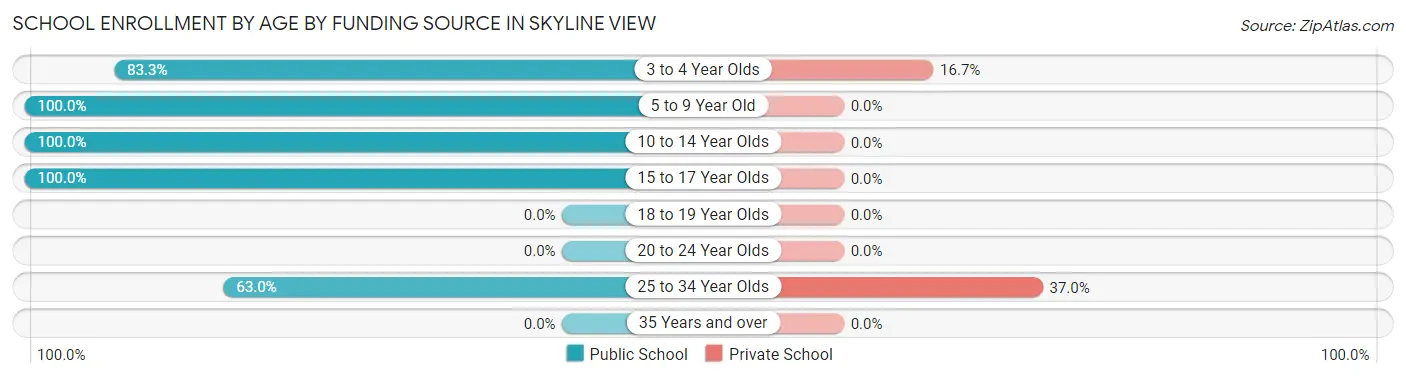
School Enrollment by Age by Funding Source in Skyline View
Out of a total of 850 students who are enrolled in schools in Skyline View, 60 (7.1%) attend a private institution, while the remaining 790 (92.9%) are enrolled in public schools. The age group of 25 to 34 year olds has the highest likelihood of being enrolled in private schools, with 50 (37.0% in the age bracket) enrolled. Conversely, the age group of 5 to 9 year old has the lowest likelihood of being enrolled in a private school, with 267 (100.0% in the age bracket) attending a public institution.
| Age Bracket | Public School | Private School |
| 3 to 4 Year Olds | 50 (83.3%) | 10 (16.7%) |
| 5 to 9 Year Old | 267 (100.0%) | 0 (0.0%) |
| 10 to 14 Year Olds | 376 (100.0%) | 0 (0.0%) |
| 15 to 17 Year Olds | 12 (100.0%) | 0 (0.0%) |
| 18 to 19 Year Olds | 0 (0.0%) | 0 (0.0%) |
| 20 to 24 Year Olds | 0 (0.0%) | 0 (0.0%) |
| 25 to 34 Year Olds | 85 (63.0%) | 50 (37.0%) |
| 35 Years and over | 0 (0.0%) | 0 (0.0%) |
| Total | 790 (92.9%) | 60 (7.1%) |
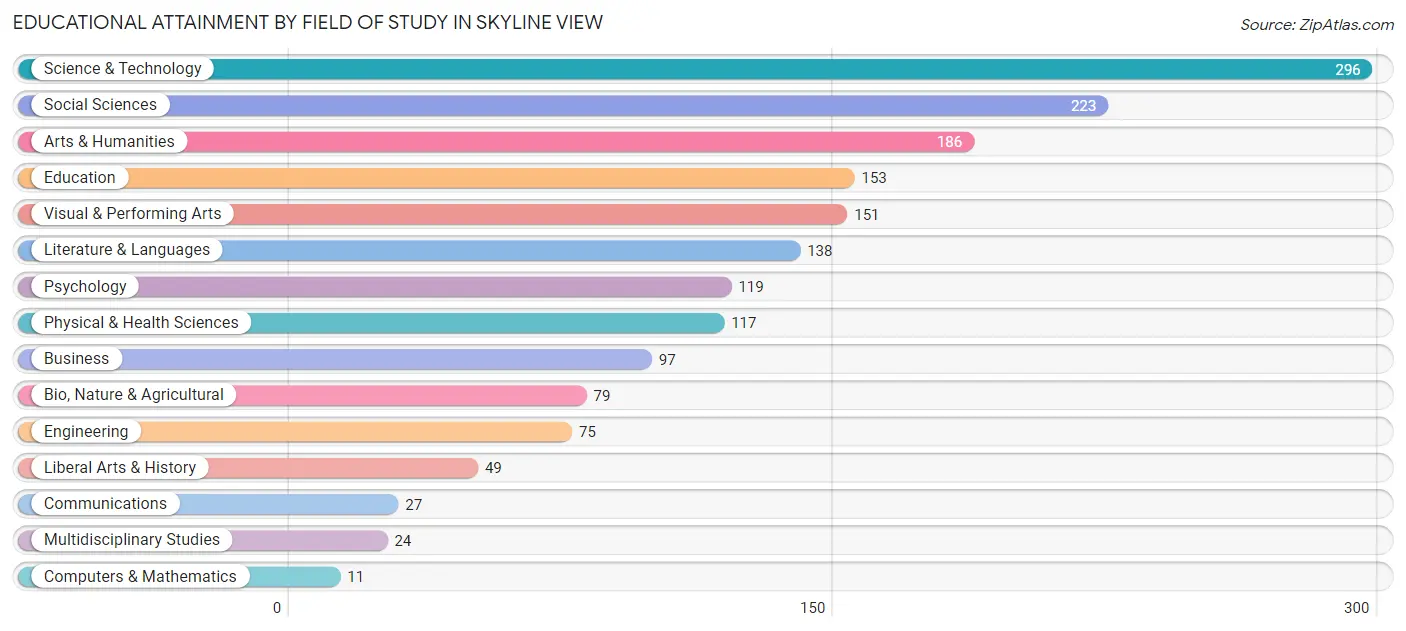
Educational Attainment by Field of Study in Skyline View
Science & technology (296 | 17.0%), social sciences (223 | 12.8%), arts & humanities (186 | 10.7%), education (153 | 8.8%), and visual & performing arts (151 | 8.6%) are the most common fields of study among 1,745 individuals in Skyline View who have obtained a bachelor's degree or higher.
| Field of Study | # Graduates | % Graduates |
| Computers & Mathematics | 11 | 0.6% |
| Bio, Nature & Agricultural | 79 | 4.5% |
| Physical & Health Sciences | 117 | 6.7% |
| Psychology | 119 | 6.8% |
| Social Sciences | 223 | 12.8% |
| Engineering | 75 | 4.3% |
| Multidisciplinary Studies | 24 | 1.4% |
| Science & Technology | 296 | 17.0% |
| Business | 97 | 5.6% |
| Education | 153 | 8.8% |
| Literature & Languages | 138 | 7.9% |
| Liberal Arts & History | 49 | 2.8% |
| Visual & Performing Arts | 151 | 8.6% |
| Communications | 27 | 1.5% |
| Arts & Humanities | 186 | 10.7% |
| Total | 1,745 | 100.0% |
Transportation & Commute in Skyline View
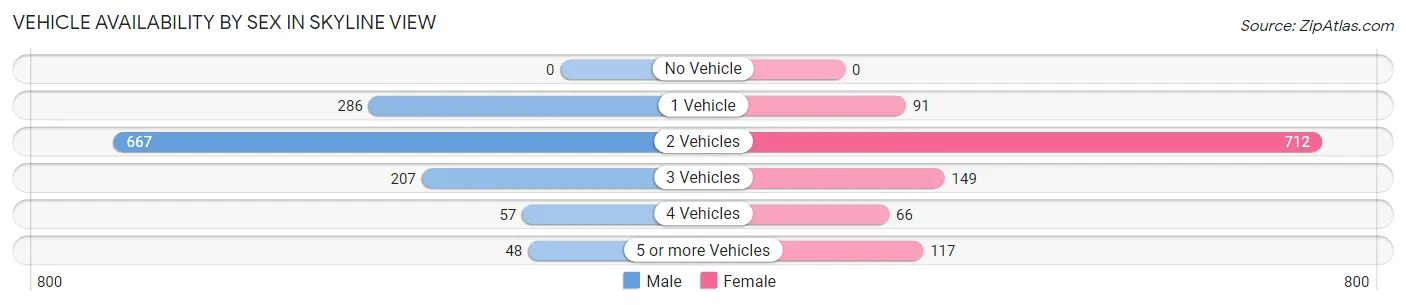
Vehicle Availability by Sex in Skyline View
The most prevalent vehicle ownership categories in Skyline View are males with 2 vehicles (667, accounting for 52.7%) and females with 2 vehicles (712, making up 58.8%).
| Vehicles Available | Male | Female |
| No Vehicle | 0 (0.0%) | 0 (0.0%) |
| 1 Vehicle | 286 (22.6%) | 91 (8.0%) |
| 2 Vehicles | 667 (52.7%) | 712 (62.7%) |
| 3 Vehicles | 207 (16.4%) | 149 (13.1%) |
| 4 Vehicles | 57 (4.5%) | 66 (5.8%) |
| 5 or more Vehicles | 48 (3.8%) | 117 (10.3%) |
| Total | 1,265 (100.0%) | 1,135 (100.0%) |
Commute Time in Skyline View
The most frequently occuring commute durations in Skyline View are 20 to 24 minutes (569 commuters, 26.1%), 5 to 9 minutes (455 commuters, 20.9%), and 25 to 29 minutes (387 commuters, 17.8%).
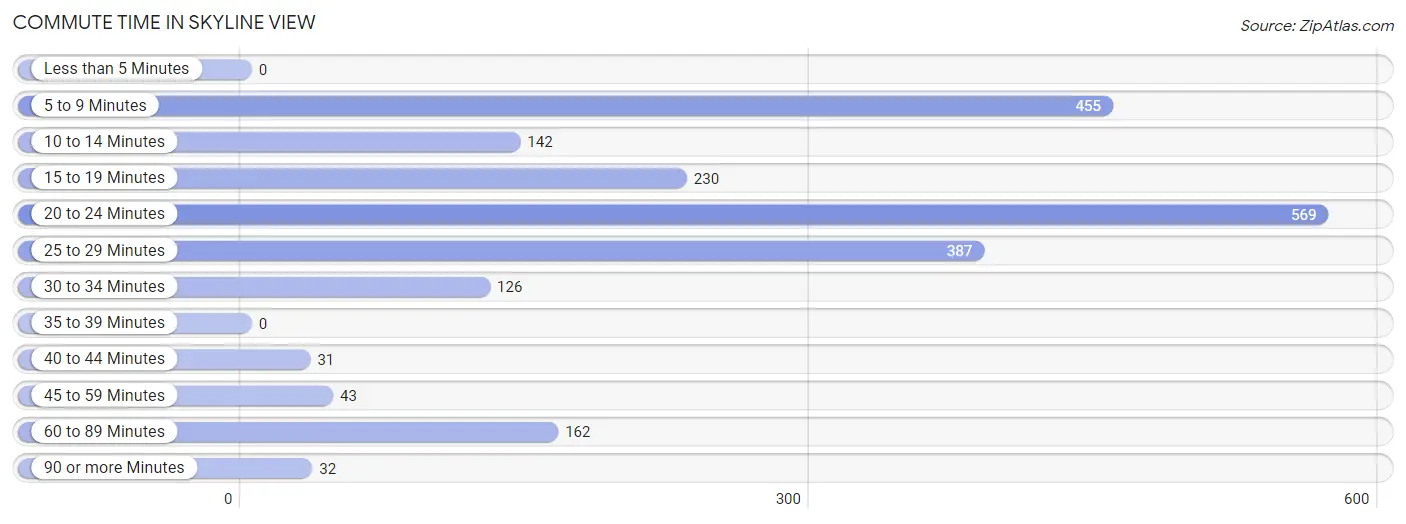
| Commute Time | # Commuters | % Commuters |
| Less than 5 Minutes | 0 | 0.0% |
| 5 to 9 Minutes | 455 | 20.9% |
| 10 to 14 Minutes | 142 | 6.5% |
| 15 to 19 Minutes | 230 | 10.6% |
| 20 to 24 Minutes | 569 | 26.1% |
| 25 to 29 Minutes | 387 | 17.8% |
| 30 to 34 Minutes | 126 | 5.8% |
| 35 to 39 Minutes | 0 | 0.0% |
| 40 to 44 Minutes | 31 | 1.4% |
| 45 to 59 Minutes | 43 | 2.0% |
| 60 to 89 Minutes | 162 | 7.4% |
| 90 or more Minutes | 32 | 1.5% |
Commute Time by Sex in Skyline View
The most common commute times in Skyline View are 5 to 9 minutes (412 commuters, 35.3%) for males and 20 to 24 minutes (322 commuters, 31.9%) for females.
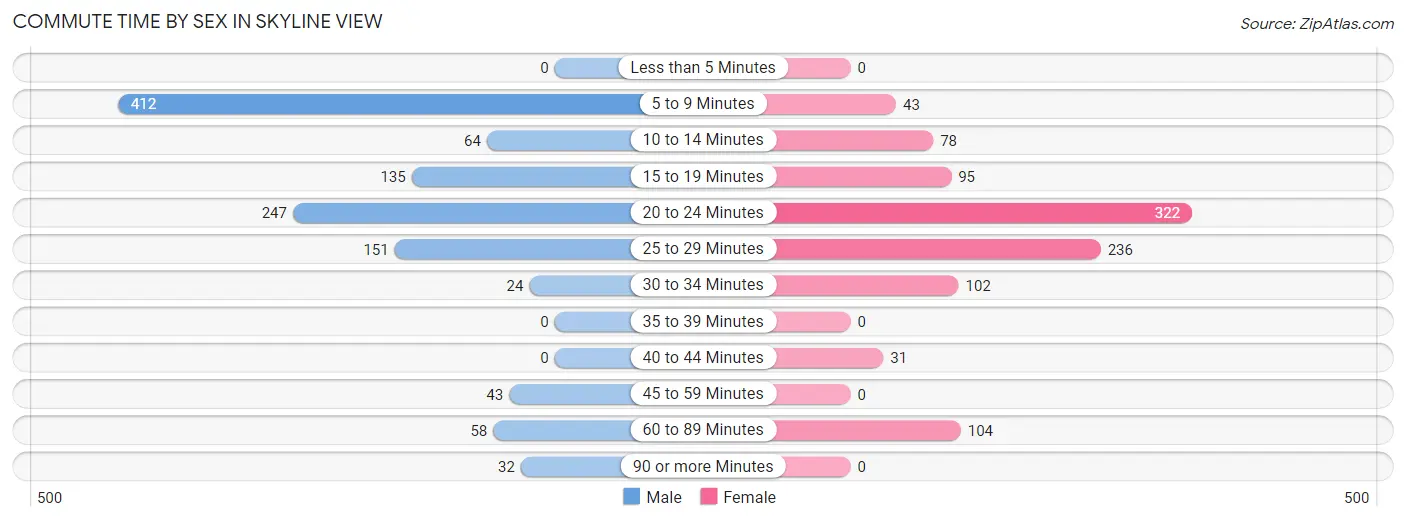
| Commute Time | Male | Female |
| Less than 5 Minutes | 0 (0.0%) | 0 (0.0%) |
| 5 to 9 Minutes | 412 (35.3%) | 43 (4.3%) |
| 10 to 14 Minutes | 64 (5.5%) | 78 (7.7%) |
| 15 to 19 Minutes | 135 (11.6%) | 95 (9.4%) |
| 20 to 24 Minutes | 247 (21.2%) | 322 (31.9%) |
| 25 to 29 Minutes | 151 (13.0%) | 236 (23.3%) |
| 30 to 34 Minutes | 24 (2.1%) | 102 (10.1%) |
| 35 to 39 Minutes | 0 (0.0%) | 0 (0.0%) |
| 40 to 44 Minutes | 0 (0.0%) | 31 (3.1%) |
| 45 to 59 Minutes | 43 (3.7%) | 0 (0.0%) |
| 60 to 89 Minutes | 58 (5.0%) | 104 (10.3%) |
| 90 or more Minutes | 32 (2.7%) | 0 (0.0%) |
Time of Departure to Work by Sex in Skyline View
The most frequent times of departure to work in Skyline View are 7:30 AM to 7:59 AM (218, 18.7%) for males and 7:00 AM to 7:29 AM (224, 22.2%) for females.
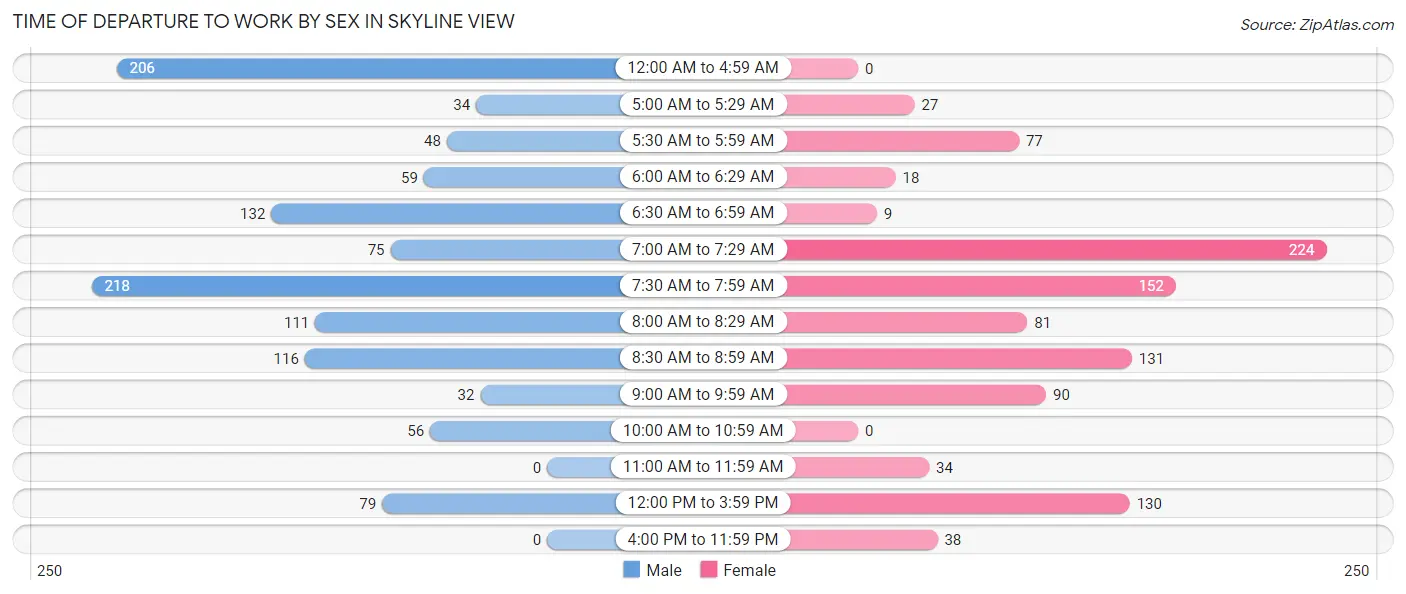
| Time of Departure | Male | Female |
| 12:00 AM to 4:59 AM | 206 (17.7%) | 0 (0.0%) |
| 5:00 AM to 5:29 AM | 34 (2.9%) | 27 (2.7%) |
| 5:30 AM to 5:59 AM | 48 (4.1%) | 77 (7.6%) |
| 6:00 AM to 6:29 AM | 59 (5.1%) | 18 (1.8%) |
| 6:30 AM to 6:59 AM | 132 (11.3%) | 9 (0.9%) |
| 7:00 AM to 7:29 AM | 75 (6.4%) | 224 (22.2%) |
| 7:30 AM to 7:59 AM | 218 (18.7%) | 152 (15.0%) |
| 8:00 AM to 8:29 AM | 111 (9.5%) | 81 (8.0%) |
| 8:30 AM to 8:59 AM | 116 (10.0%) | 131 (13.0%) |
| 9:00 AM to 9:59 AM | 32 (2.7%) | 90 (8.9%) |
| 10:00 AM to 10:59 AM | 56 (4.8%) | 0 (0.0%) |
| 11:00 AM to 11:59 AM | 0 (0.0%) | 34 (3.4%) |
| 12:00 PM to 3:59 PM | 79 (6.8%) | 130 (12.9%) |
| 4:00 PM to 11:59 PM | 0 (0.0%) | 38 (3.8%) |
| Total | 1,166 (100.0%) | 1,011 (100.0%) |
Housing Occupancy in Skyline View
Occupancy by Ownership in Skyline View
Of the total 2,074 dwellings in Skyline View, owner-occupied units account for 2,031 (97.9%), while renter-occupied units make up 43 (2.1%).
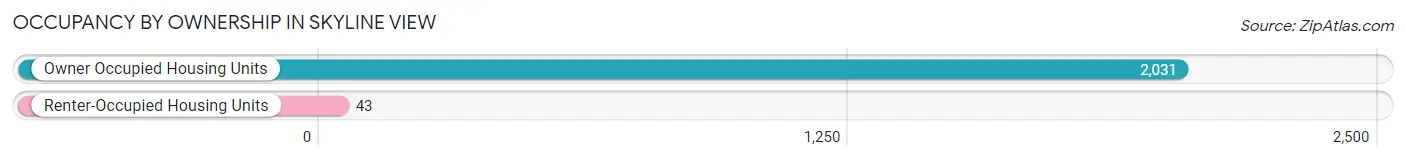
| Occupancy | # Housing Units | % Housing Units |
| Owner Occupied Housing Units | 2,031 | 97.9% |
| Renter-Occupied Housing Units | 43 | 2.1% |
| Total Occupied Housing Units | 2,074 | 100.0% |
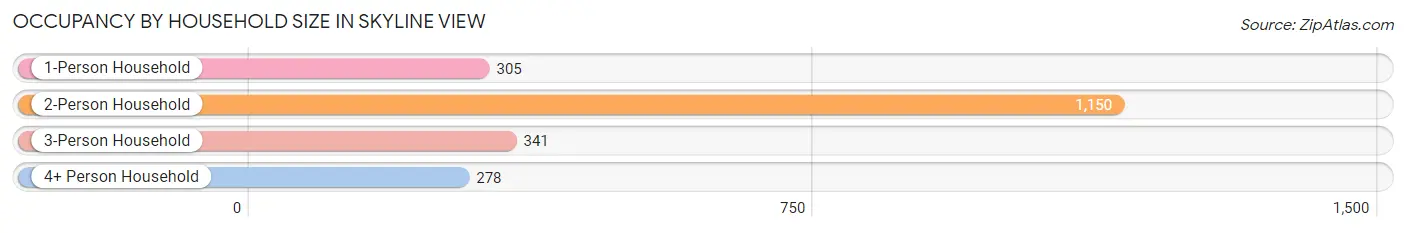
Occupancy by Household Size in Skyline View
| Household Size | # Housing Units | % Housing Units |
| 1-Person Household | 305 | 14.7% |
| 2-Person Household | 1,150 | 55.4% |
| 3-Person Household | 341 | 16.4% |
| 4+ Person Household | 278 | 13.4% |
| Total Housing Units | 2,074 | 100.0% |
Occupancy by Ownership by Household Size in Skyline View
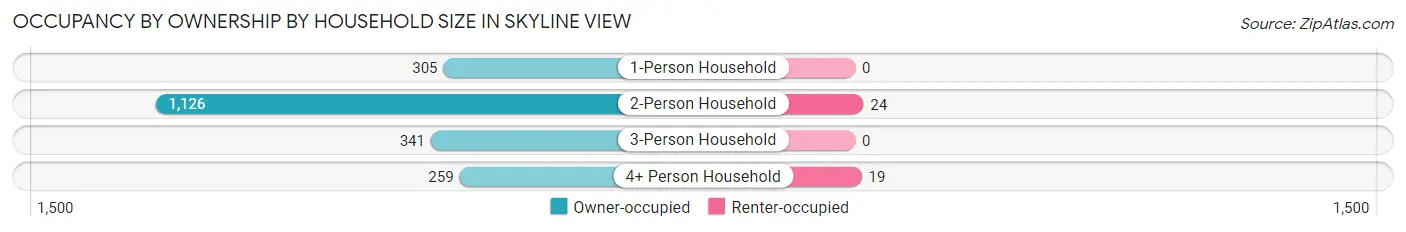
| Household Size | Owner-occupied | Renter-occupied |
| 1-Person Household | 305 (100.0%) | 0 (0.0%) |
| 2-Person Household | 1,126 (97.9%) | 24 (2.1%) |
| 3-Person Household | 341 (100.0%) | 0 (0.0%) |
| 4+ Person Household | 259 (93.2%) | 19 (6.8%) |
| Total Housing Units | 2,031 (97.9%) | 43 (2.1%) |
Occupancy by Educational Attainment in Skyline View
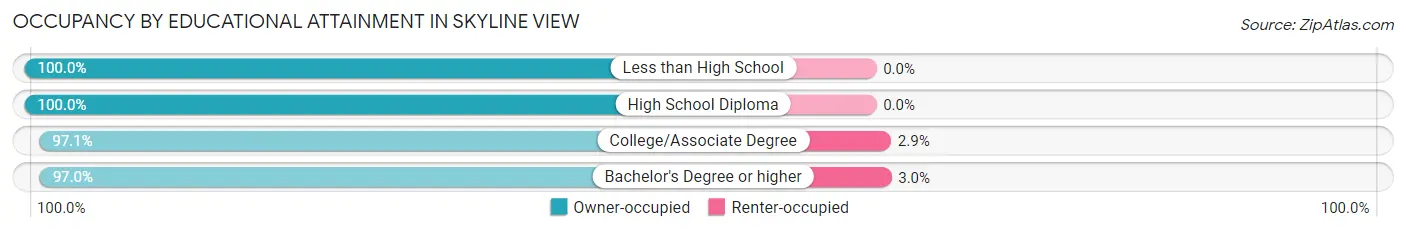
| Household Size | Owner-occupied | Renter-occupied |
| Less than High School | 37 (100.0%) | 0 (0.0%) |
| High School Diploma | 587 (100.0%) | 0 (0.0%) |
| College/Associate Degree | 632 (97.1%) | 19 (2.9%) |
| Bachelor's Degree or higher | 775 (97.0%) | 24 (3.0%) |
Occupancy by Age of Householder in Skyline View
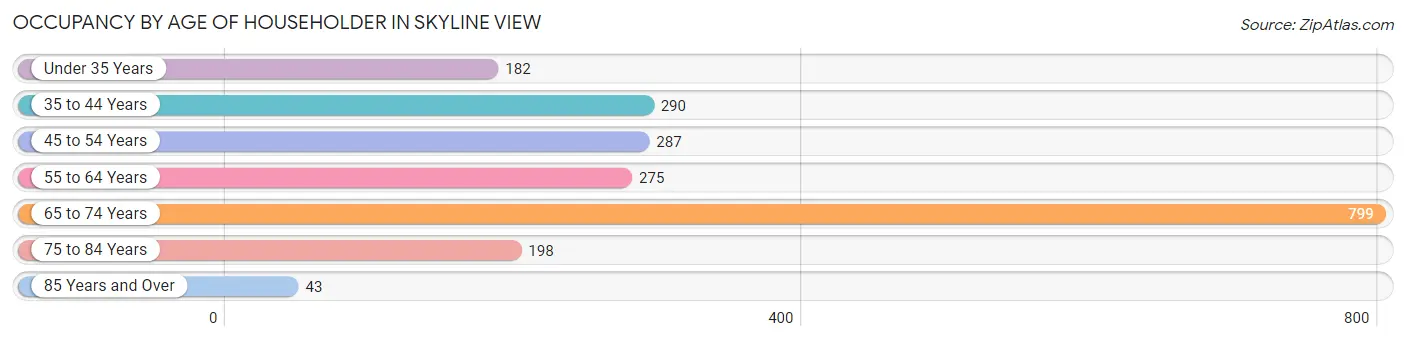
| Age Bracket | # Households | % Households |
| Under 35 Years | 182 | 8.8% |
| 35 to 44 Years | 290 | 14.0% |
| 45 to 54 Years | 287 | 13.8% |
| 55 to 64 Years | 275 | 13.3% |
| 65 to 74 Years | 799 | 38.5% |
| 75 to 84 Years | 198 | 9.6% |
| 85 Years and Over | 43 | 2.1% |
| Total | 2,074 | 100.0% |
Housing Finances in Skyline View
Median Income by Occupancy in Skyline View
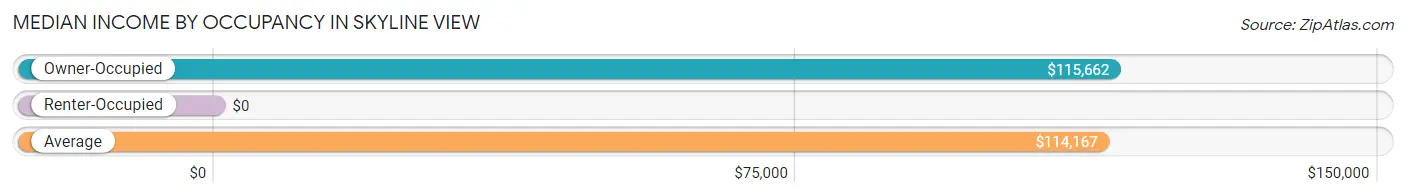
| Occupancy Type | # Households | Median Income |
| Owner-Occupied | 2,031 (97.9%) | $115,662 |
| Renter-Occupied | 43 (2.1%) | $0 |
| Average | 2,074 (100.0%) | $114,167 |
Occupancy by Householder Income Bracket in Skyline View
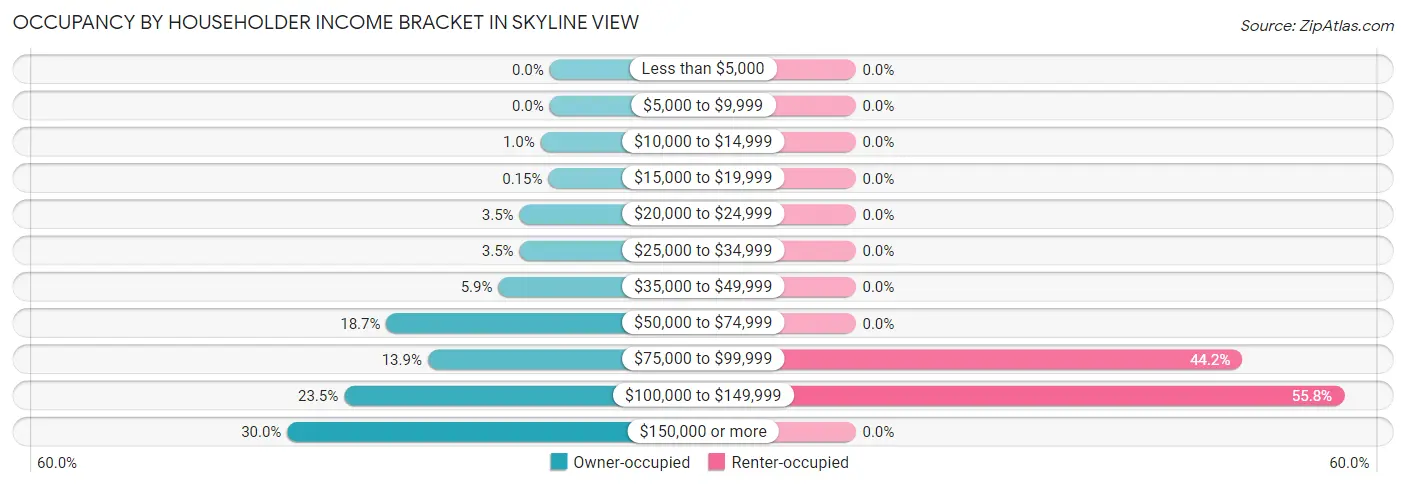
| Income Bracket | Owner-occupied | Renter-occupied |
| Less than $5,000 | 0 (0.0%) | 0 (0.0%) |
| $5,000 to $9,999 | 0 (0.0%) | 0 (0.0%) |
| $10,000 to $14,999 | 21 (1.0%) | 0 (0.0%) |
| $15,000 to $19,999 | 3 (0.2%) | 0 (0.0%) |
| $20,000 to $24,999 | 70 (3.5%) | 0 (0.0%) |
| $25,000 to $34,999 | 70 (3.5%) | 0 (0.0%) |
| $35,000 to $49,999 | 119 (5.9%) | 0 (0.0%) |
| $50,000 to $74,999 | 379 (18.7%) | 0 (0.0%) |
| $75,000 to $99,999 | 283 (13.9%) | 19 (44.2%) |
| $100,000 to $149,999 | 477 (23.5%) | 24 (55.8%) |
| $150,000 or more | 609 (30.0%) | 0 (0.0%) |
| Total | 2,031 (100.0%) | 43 (100.0%) |
Monthly Housing Cost Tiers in Skyline View
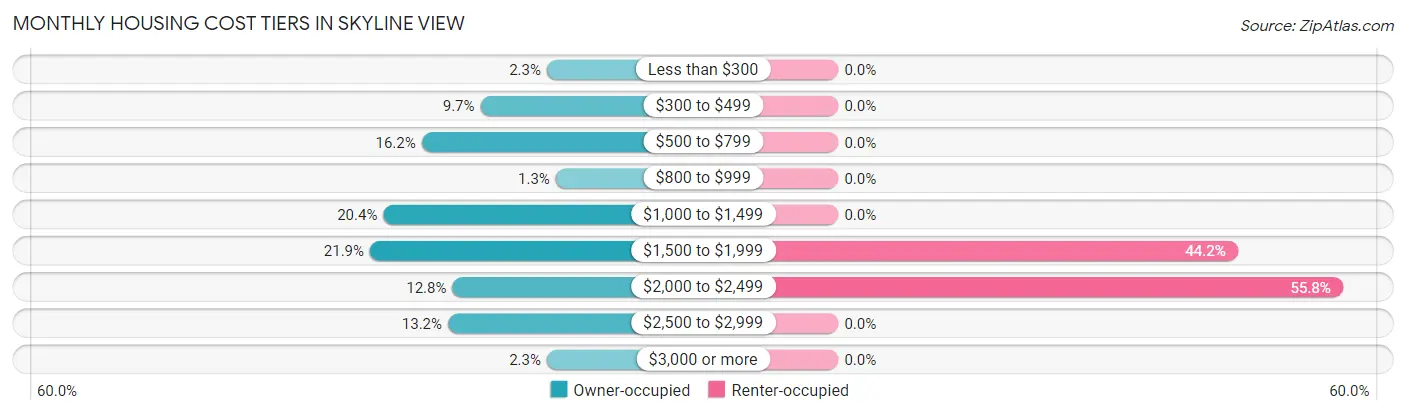
| Monthly Cost | Owner-occupied | Renter-occupied |
| Less than $300 | 47 (2.3%) | 0 (0.0%) |
| $300 to $499 | 196 (9.7%) | 0 (0.0%) |
| $500 to $799 | 328 (16.2%) | 0 (0.0%) |
| $800 to $999 | 27 (1.3%) | 0 (0.0%) |
| $1,000 to $1,499 | 414 (20.4%) | 0 (0.0%) |
| $1,500 to $1,999 | 444 (21.9%) | 19 (44.2%) |
| $2,000 to $2,499 | 259 (12.8%) | 24 (55.8%) |
| $2,500 to $2,999 | 269 (13.2%) | 0 (0.0%) |
| $3,000 or more | 47 (2.3%) | 0 (0.0%) |
| Total | 2,031 (100.0%) | 43 (100.0%) |
Physical Housing Characteristics in Skyline View
Housing Structures in Skyline View
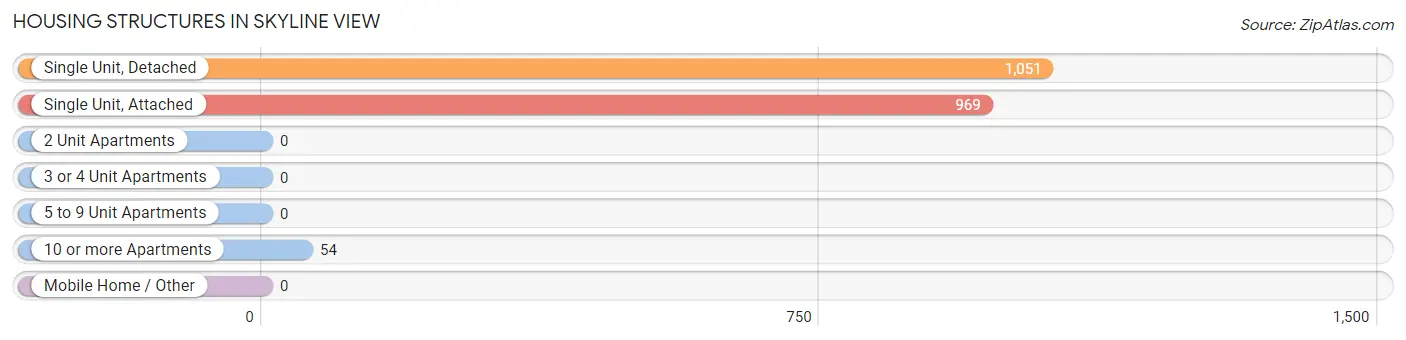
| Structure Type | # Housing Units | % Housing Units |
| Single Unit, Detached | 1,051 | 50.7% |
| Single Unit, Attached | 969 | 46.7% |
| 2 Unit Apartments | 0 | 0.0% |
| 3 or 4 Unit Apartments | 0 | 0.0% |
| 5 to 9 Unit Apartments | 0 | 0.0% |
| 10 or more Apartments | 54 | 2.6% |
| Mobile Home / Other | 0 | 0.0% |
| Total | 2,074 | 100.0% |
Housing Structures by Occupancy in Skyline View
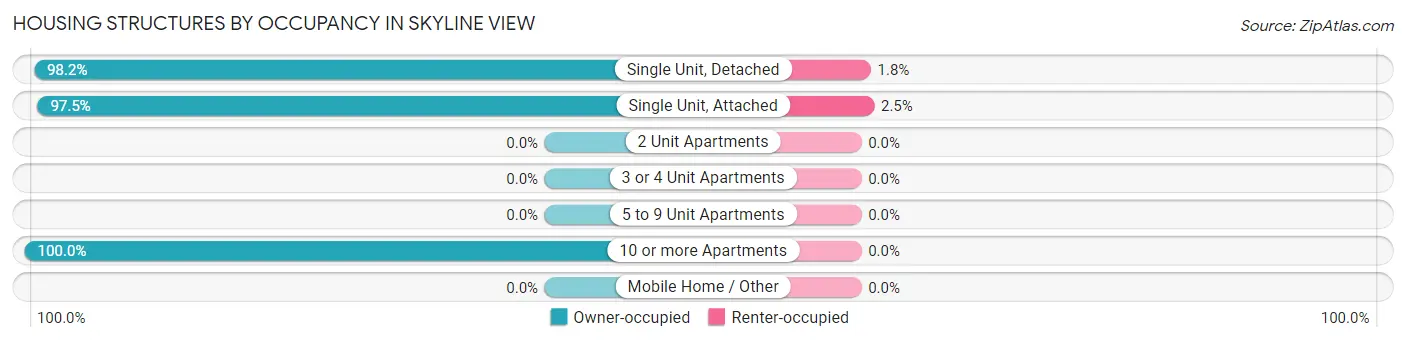
| Structure Type | Owner-occupied | Renter-occupied |
| Single Unit, Detached | 1,032 (98.2%) | 19 (1.8%) |
| Single Unit, Attached | 945 (97.5%) | 24 (2.5%) |
| 2 Unit Apartments | 0 (0.0%) | 0 (0.0%) |
| 3 or 4 Unit Apartments | 0 (0.0%) | 0 (0.0%) |
| 5 to 9 Unit Apartments | 0 (0.0%) | 0 (0.0%) |
| 10 or more Apartments | 54 (100.0%) | 0 (0.0%) |
| Mobile Home / Other | 0 (0.0%) | 0 (0.0%) |
| Total | 2,031 (97.9%) | 43 (2.1%) |
Housing Structures by Number of Rooms in Skyline View
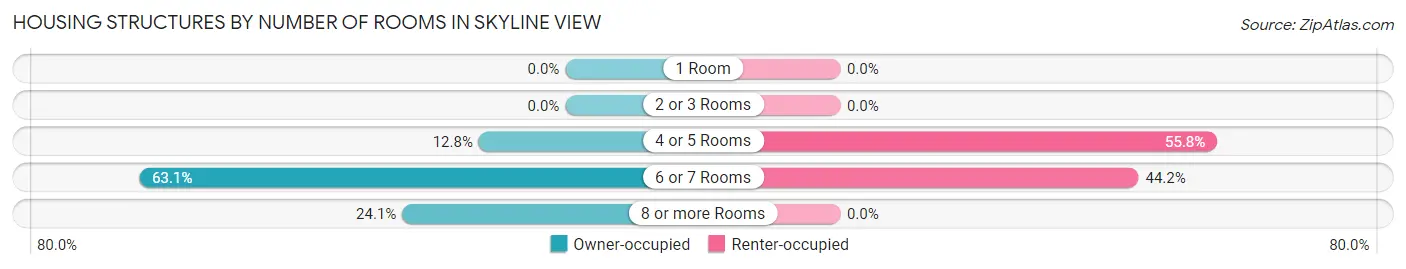
| Number of Rooms | Owner-occupied | Renter-occupied |
| 1 Room | 0 (0.0%) | 0 (0.0%) |
| 2 or 3 Rooms | 0 (0.0%) | 0 (0.0%) |
| 4 or 5 Rooms | 260 (12.8%) | 24 (55.8%) |
| 6 or 7 Rooms | 1,281 (63.1%) | 19 (44.2%) |
| 8 or more Rooms | 490 (24.1%) | 0 (0.0%) |
| Total | 2,031 (100.0%) | 43 (100.0%) |
Housing Structure by Heating Type in Skyline View
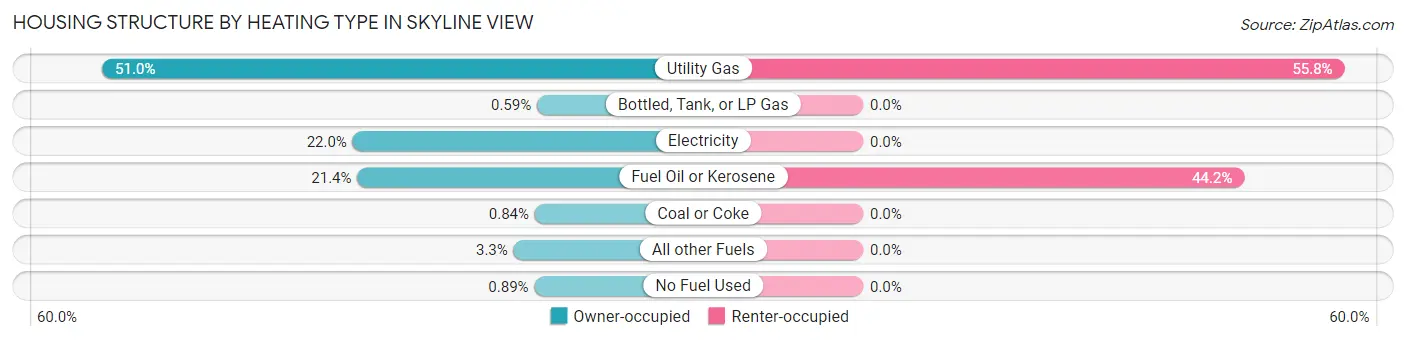
| Heating Type | Owner-occupied | Renter-occupied |
| Utility Gas | 1,036 (51.0%) | 24 (55.8%) |
| Bottled, Tank, or LP Gas | 12 (0.6%) | 0 (0.0%) |
| Electricity | 446 (22.0%) | 0 (0.0%) |
| Fuel Oil or Kerosene | 435 (21.4%) | 19 (44.2%) |
| Coal or Coke | 17 (0.8%) | 0 (0.0%) |
| All other Fuels | 67 (3.3%) | 0 (0.0%) |
| No Fuel Used | 18 (0.9%) | 0 (0.0%) |
| Total | 2,031 (100.0%) | 43 (100.0%) |
Household Vehicle Usage in Skyline View
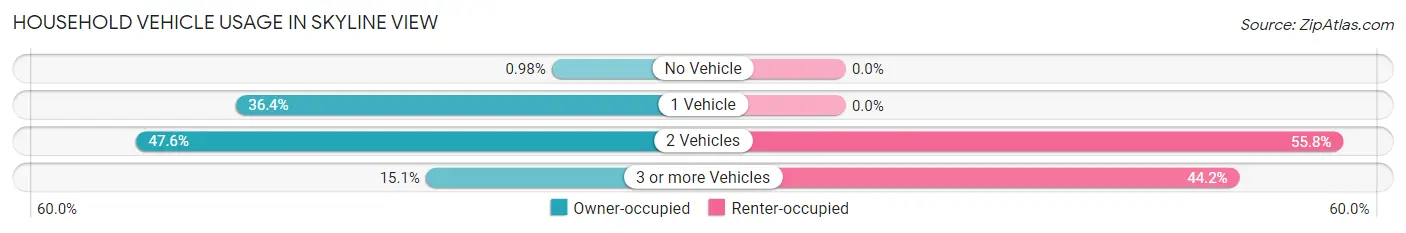
| Vehicles per Household | Owner-occupied | Renter-occupied |
| No Vehicle | 20 (1.0%) | 0 (0.0%) |
| 1 Vehicle | 739 (36.4%) | 0 (0.0%) |
| 2 Vehicles | 966 (47.6%) | 24 (55.8%) |
| 3 or more Vehicles | 306 (15.1%) | 19 (44.2%) |
| Total | 2,031 (100.0%) | 43 (100.0%) |
Real Estate & Mortgages in Skyline View
Real Estate and Mortgage Overview in Skyline View
| Characteristic | Without Mortgage | With Mortgage |
| Housing Units | 568 | 1,463 |
| Median Property Value | $224,300 | $249,000 |
| Median Household Income | $82,745 | $517 |
| Monthly Housing Costs | $614 | $47 |
| Real Estate Taxes | $3,116 | $40 |
Property Value by Mortgage Status in Skyline View
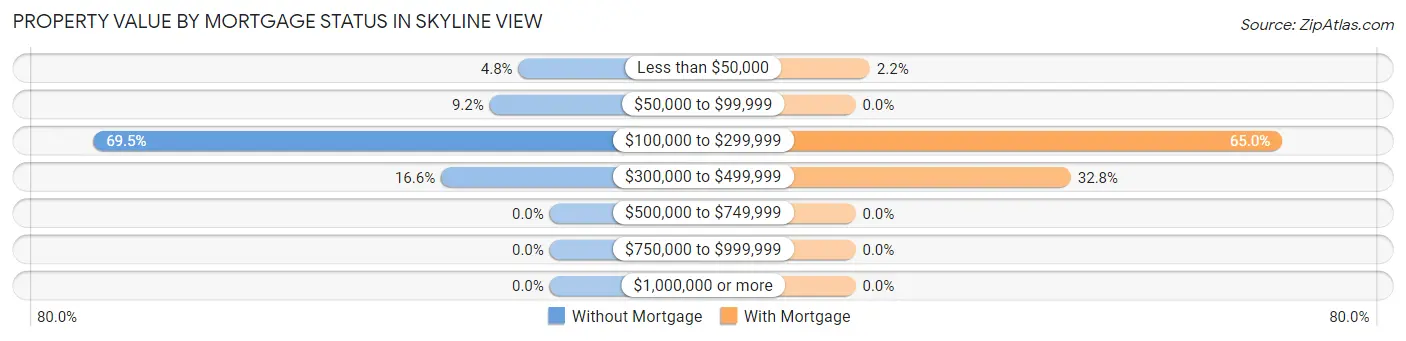
| Property Value | Without Mortgage | With Mortgage |
| Less than $50,000 | 27 (4.8%) | 32 (2.2%) |
| $50,000 to $99,999 | 52 (9.1%) | 0 (0.0%) |
| $100,000 to $299,999 | 395 (69.5%) | 951 (65.0%) |
| $300,000 to $499,999 | 94 (16.6%) | 480 (32.8%) |
| $500,000 to $749,999 | 0 (0.0%) | 0 (0.0%) |
| $750,000 to $999,999 | 0 (0.0%) | 0 (0.0%) |
| $1,000,000 or more | 0 (0.0%) | 0 (0.0%) |
| Total | 568 (100.0%) | 1,463 (100.0%) |
Household Income by Mortgage Status in Skyline View
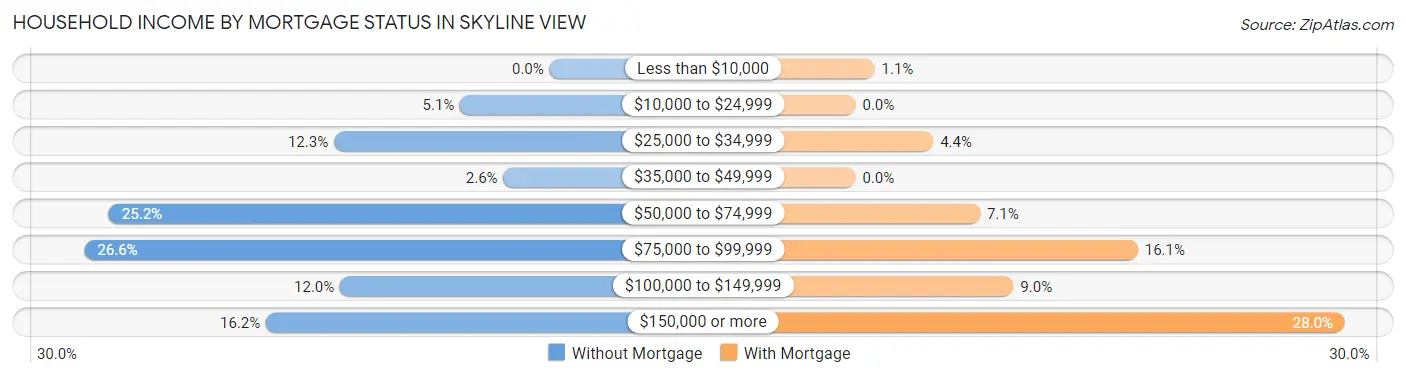
| Household Income | Without Mortgage | With Mortgage |
| Less than $10,000 | 0 (0.0%) | 16 (1.1%) |
| $10,000 to $24,999 | 29 (5.1%) | 0 (0.0%) |
| $25,000 to $34,999 | 70 (12.3%) | 65 (4.4%) |
| $35,000 to $49,999 | 15 (2.6%) | 0 (0.0%) |
| $50,000 to $74,999 | 143 (25.2%) | 104 (7.1%) |
| $75,000 to $99,999 | 151 (26.6%) | 236 (16.1%) |
| $100,000 to $149,999 | 68 (12.0%) | 132 (9.0%) |
| $150,000 or more | 92 (16.2%) | 409 (28.0%) |
| Total | 568 (100.0%) | 1,463 (100.0%) |
Property Value to Household Income Ratio in Skyline View
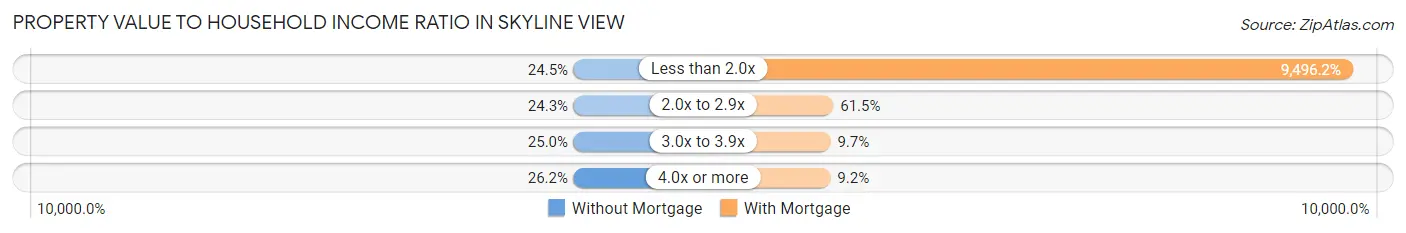
| Value-to-Income Ratio | Without Mortgage | With Mortgage |
| Less than 2.0x | 139 (24.5%) | 138,930 (9,496.2%) |
| 2.0x to 2.9x | 138 (24.3%) | 899 (61.5%) |
| 3.0x to 3.9x | 142 (25.0%) | 142 (9.7%) |
| 4.0x or more | 149 (26.2%) | 134 (9.2%) |
| Total | 568 (100.0%) | 1,463 (100.0%) |
Real Estate Taxes by Mortgage Status in Skyline View
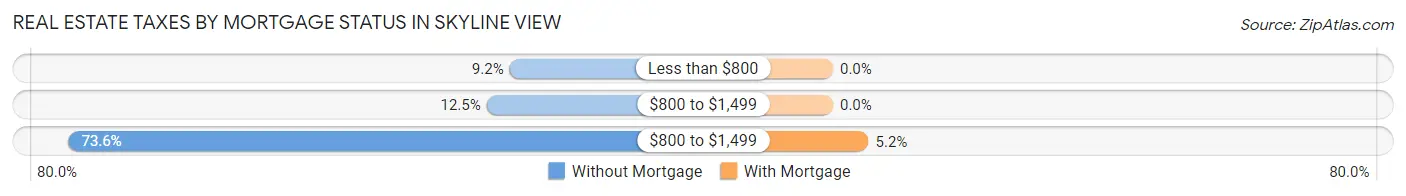
| Property Taxes | Without Mortgage | With Mortgage |
| Less than $800 | 52 (9.1%) | 0 (0.0%) |
| $800 to $1,499 | 71 (12.5%) | 0 (0.0%) |
| $800 to $1,499 | 418 (73.6%) | 76 (5.2%) |
| Total | 568 (100.0%) | 1,463 (100.0%) |
Health & Disability in Skyline View
Health Insurance Coverage by Age in Skyline View
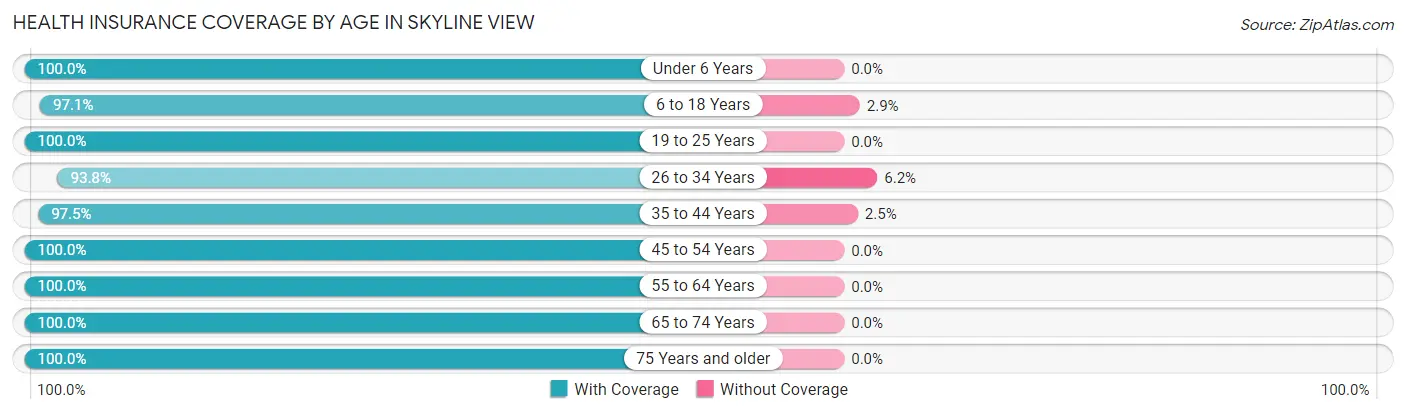
| Age Bracket | With Coverage | Without Coverage |
| Under 6 Years | 222 (100.0%) | 0 (0.0%) |
| 6 to 18 Years | 636 (97.1%) | 19 (2.9%) |
| 19 to 25 Years | 24 (100.0%) | 0 (0.0%) |
| 26 to 34 Years | 503 (93.8%) | 33 (6.2%) |
| 35 to 44 Years | 460 (97.5%) | 12 (2.5%) |
| 45 to 54 Years | 527 (100.0%) | 0 (0.0%) |
| 55 to 64 Years | 658 (100.0%) | 0 (0.0%) |
| 65 to 74 Years | 1,422 (100.0%) | 0 (0.0%) |
| 75 Years and older | 308 (100.0%) | 0 (0.0%) |
| Total | 4,760 (98.7%) | 64 (1.3%) |
Health Insurance Coverage by Citizenship Status in Skyline View
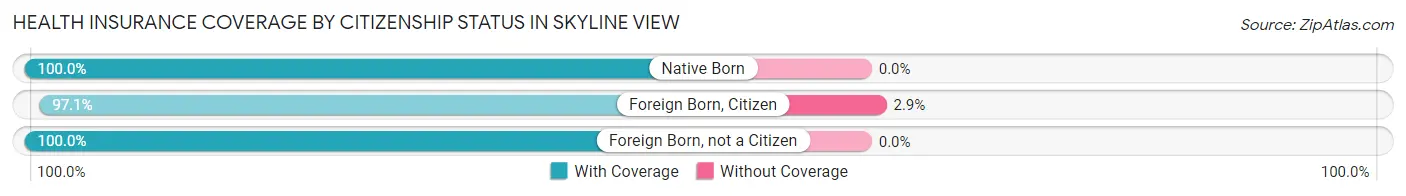
| Citizenship Status | With Coverage | Without Coverage |
| Native Born | 222 (100.0%) | 0 (0.0%) |
| Foreign Born, Citizen | 636 (97.1%) | 19 (2.9%) |
| Foreign Born, not a Citizen | 24 (100.0%) | 0 (0.0%) |
Health Insurance Coverage by Household Income in Skyline View
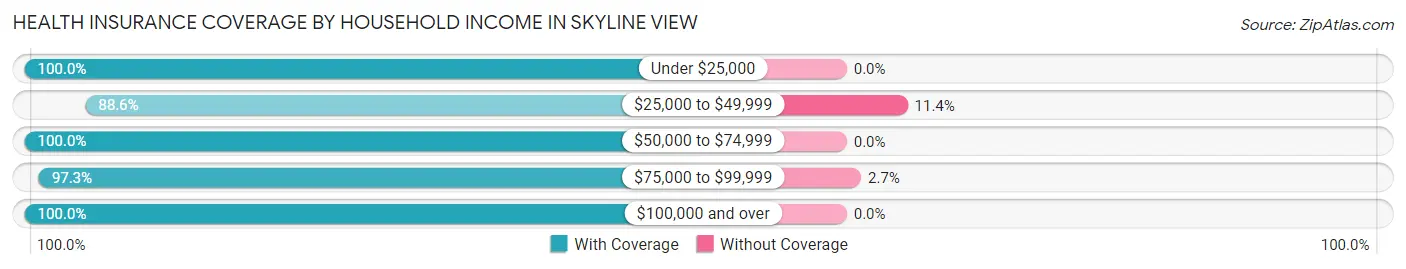
| Household Income | With Coverage | Without Coverage |
| Under $25,000 | 123 (100.0%) | 0 (0.0%) |
| $25,000 to $49,999 | 350 (88.6%) | 45 (11.4%) |
| $50,000 to $74,999 | 745 (100.0%) | 0 (0.0%) |
| $75,000 to $99,999 | 690 (97.3%) | 19 (2.7%) |
| $100,000 and over | 2,852 (100.0%) | 0 (0.0%) |
Public vs Private Health Insurance Coverage by Age in Skyline View
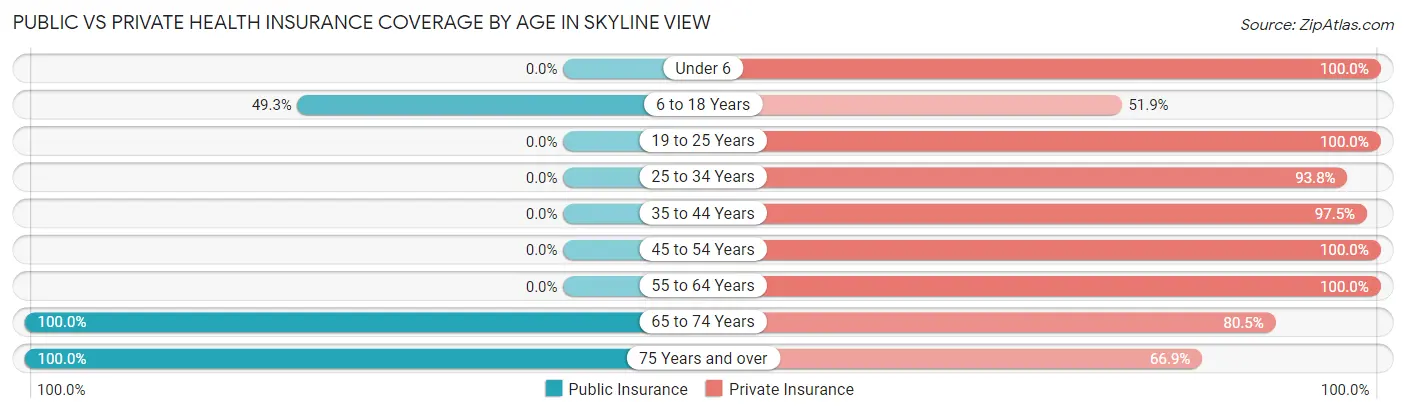
| Age Bracket | Public Insurance | Private Insurance |
| Under 6 | 0 (0.0%) | 222 (100.0%) |
| 6 to 18 Years | 323 (49.3%) | 340 (51.9%) |
| 19 to 25 Years | 0 (0.0%) | 24 (100.0%) |
| 25 to 34 Years | 0 (0.0%) | 503 (93.8%) |
| 35 to 44 Years | 0 (0.0%) | 460 (97.5%) |
| 45 to 54 Years | 0 (0.0%) | 527 (100.0%) |
| 55 to 64 Years | 0 (0.0%) | 658 (100.0%) |
| 65 to 74 Years | 1,422 (100.0%) | 1,145 (80.5%) |
| 75 Years and over | 308 (100.0%) | 206 (66.9%) |
| Total | 2,053 (42.6%) | 4,085 (84.7%) |
Disability Status by Sex by Age in Skyline View
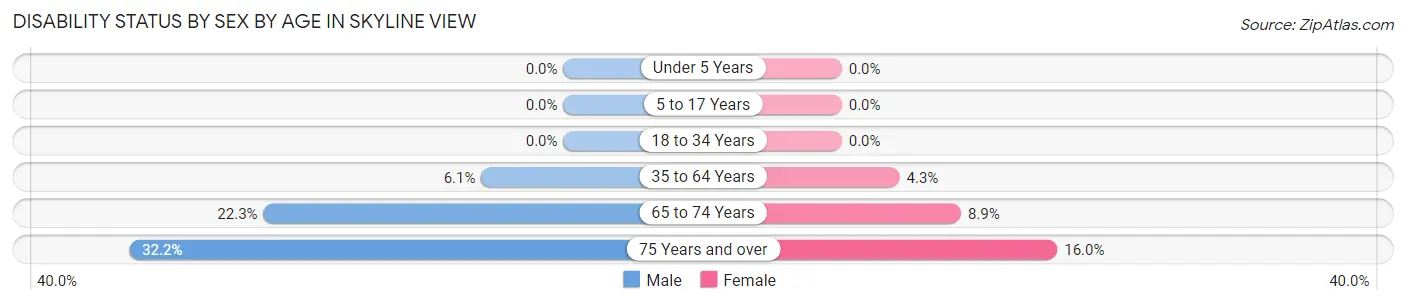
| Age Bracket | Male | Female |
| Under 5 Years | 0 (0.0%) | 0 (0.0%) |
| 5 to 17 Years | 0 (0.0%) | 0 (0.0%) |
| 18 to 34 Years | 0 (0.0%) | 0 (0.0%) |
| 35 to 64 Years | 47 (6.1%) | 38 (4.3%) |
| 65 to 74 Years | 143 (22.3%) | 69 (8.8%) |
| 75 Years and over | 59 (32.2%) | 20 (16.0%) |
Disability Class by Sex by Age in Skyline View
Disability Class: Hearing Difficulty
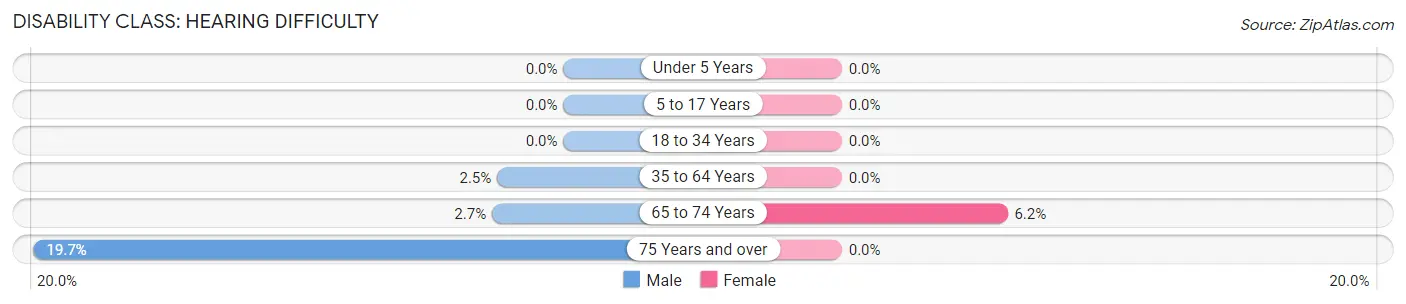
| Age Bracket | Male | Female |
| Under 5 Years | 0 (0.0%) | 0 (0.0%) |
| 5 to 17 Years | 0 (0.0%) | 0 (0.0%) |
| 18 to 34 Years | 0 (0.0%) | 0 (0.0%) |
| 35 to 64 Years | 19 (2.5%) | 0 (0.0%) |
| 65 to 74 Years | 17 (2.6%) | 48 (6.1%) |
| 75 Years and over | 36 (19.7%) | 0 (0.0%) |
Disability Class: Vision Difficulty
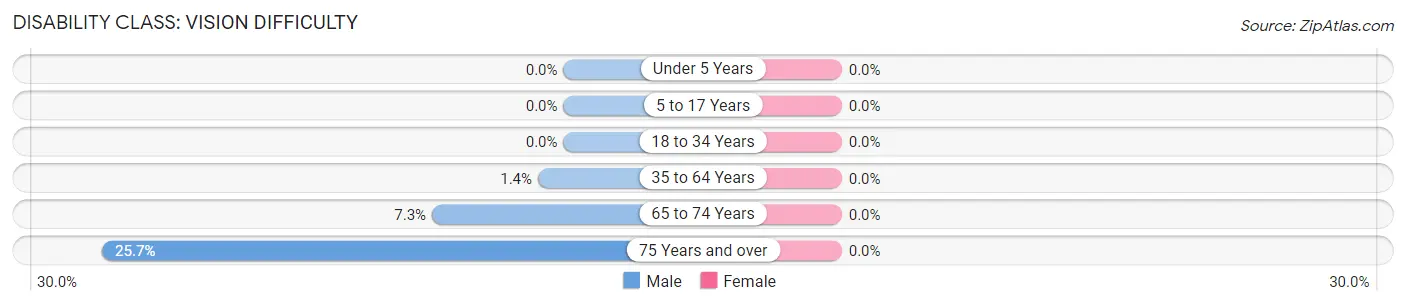
| Age Bracket | Male | Female |
| Under 5 Years | 0 (0.0%) | 0 (0.0%) |
| 5 to 17 Years | 0 (0.0%) | 0 (0.0%) |
| 18 to 34 Years | 0 (0.0%) | 0 (0.0%) |
| 35 to 64 Years | 11 (1.4%) | 0 (0.0%) |
| 65 to 74 Years | 47 (7.3%) | 0 (0.0%) |
| 75 Years and over | 47 (25.7%) | 0 (0.0%) |
Disability Class: Cognitive Difficulty
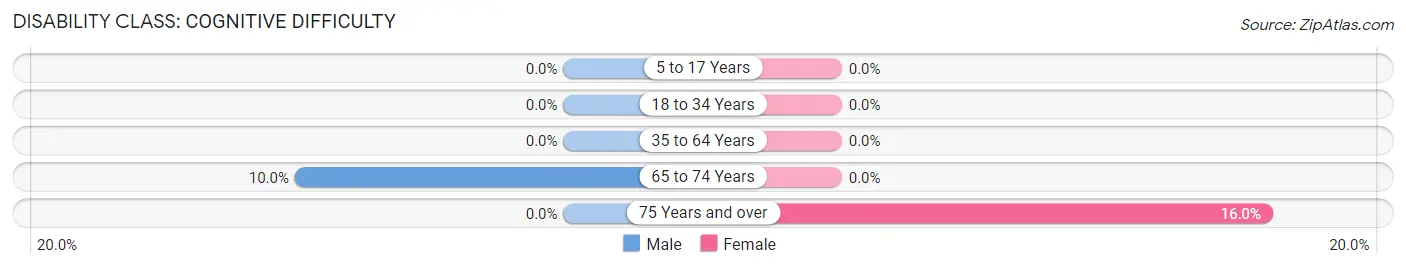
| Age Bracket | Male | Female |
| 5 to 17 Years | 0 (0.0%) | 0 (0.0%) |
| 18 to 34 Years | 0 (0.0%) | 0 (0.0%) |
| 35 to 64 Years | 0 (0.0%) | 0 (0.0%) |
| 65 to 74 Years | 64 (10.0%) | 0 (0.0%) |
| 75 Years and over | 0 (0.0%) | 20 (16.0%) |
Disability Class: Ambulatory Difficulty
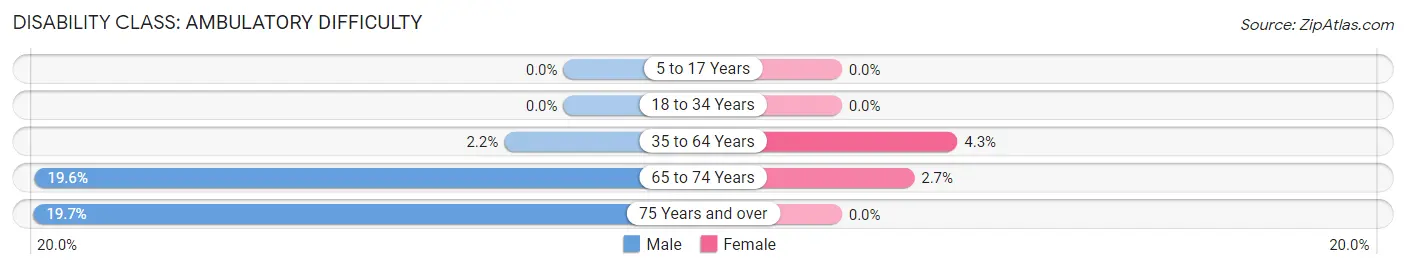
| Age Bracket | Male | Female |
| 5 to 17 Years | 0 (0.0%) | 0 (0.0%) |
| 18 to 34 Years | 0 (0.0%) | 0 (0.0%) |
| 35 to 64 Years | 17 (2.2%) | 38 (4.3%) |
| 65 to 74 Years | 126 (19.6%) | 21 (2.7%) |
| 75 Years and over | 36 (19.7%) | 0 (0.0%) |
Disability Class: Self-Care Difficulty
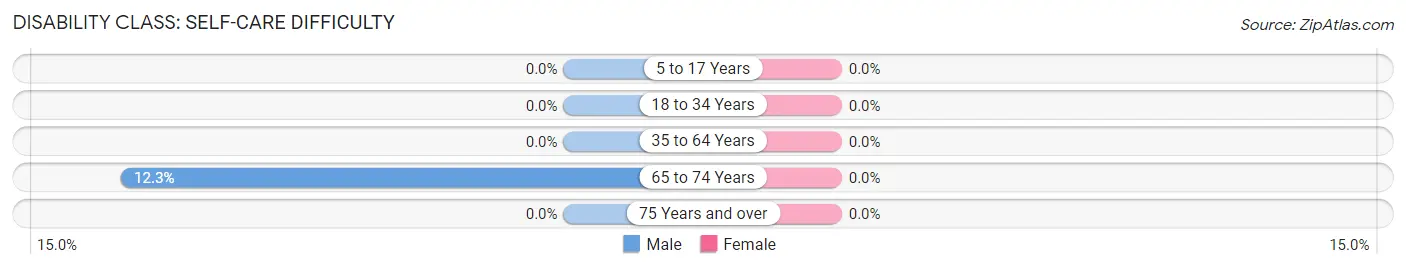
| Age Bracket | Male | Female |
| 5 to 17 Years | 0 (0.0%) | 0 (0.0%) |
| 18 to 34 Years | 0 (0.0%) | 0 (0.0%) |
| 35 to 64 Years | 0 (0.0%) | 0 (0.0%) |
| 65 to 74 Years | 79 (12.3%) | 0 (0.0%) |
| 75 Years and over | 0 (0.0%) | 0 (0.0%) |
Technology Access in Skyline View
Computing Device Access in Skyline View
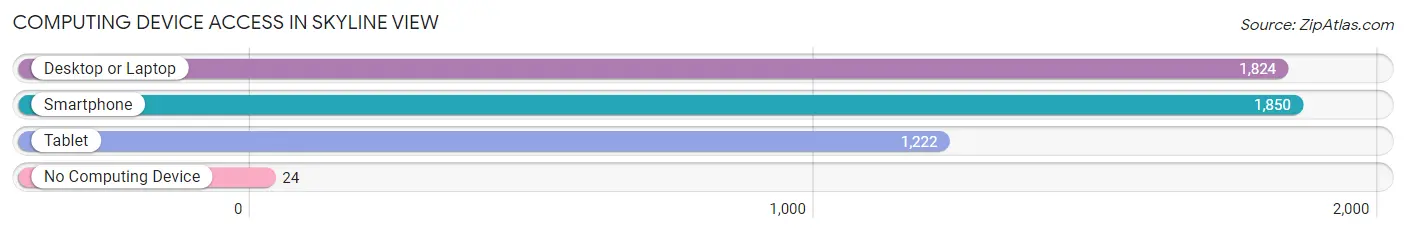
| Device Type | # Households | % Households |
| Desktop or Laptop | 1,824 | 87.9% |
| Smartphone | 1,850 | 89.2% |
| Tablet | 1,222 | 58.9% |
| No Computing Device | 24 | 1.2% |
| Total | 2,074 | 100.0% |
Internet Access in Skyline View
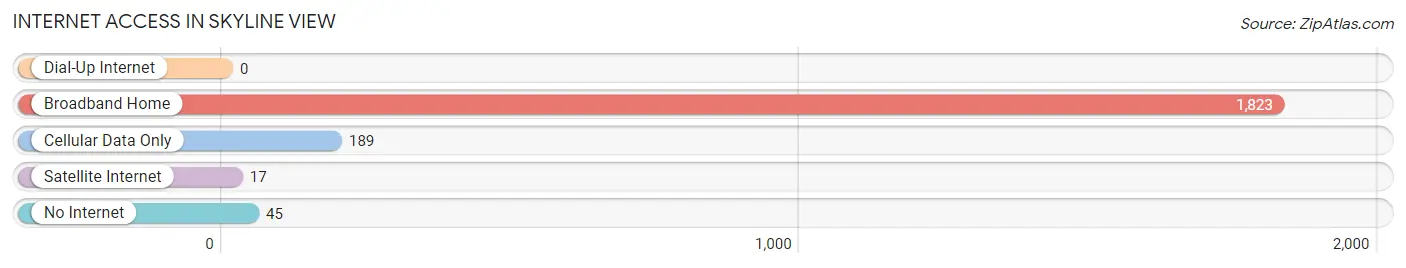
| Internet Type | # Households | % Households |
| Dial-Up Internet | 0 | 0.0% |
| Broadband Home | 1,823 | 87.9% |
| Cellular Data Only | 189 | 9.1% |
| Satellite Internet | 17 | 0.8% |
| No Internet | 45 | 2.2% |
| Total | 2,074 | 100.0% |
Skyline View Summary
Skyline View, Pennsylvania is a small borough located in the southwestern corner of the state. It is situated in the Allegheny Mountains, and is bordered by the towns of Westmoreland, Fayette, and Somerset counties. The borough has a population of approximately 1,500 people, and is part of the Greater Pittsburgh Metropolitan Area.
History
Skyline View was founded in 1820 by a group of settlers from the nearby town of Westmoreland. The settlers were looking for a place to settle that was close to the Allegheny Mountains, and the area around Skyline View provided them with the perfect opportunity. The settlers named the town after the view of the Allegheny Mountains that could be seen from the area.
The town quickly grew in size and importance, and by the mid-1800s it had become a major hub for the coal and timber industries. The town was also home to a number of small businesses, including a sawmill, a gristmill, and a tannery.
In the late 1800s, the town began to experience a decline in its economic fortunes. The coal and timber industries began to decline, and the town’s population began to dwindle. By the early 1900s, the town had become a small, quiet community.
Geography
Skyline View is located in the southwestern corner of Pennsylvania, in the Allegheny Mountains. The town is situated at an elevation of 1,500 feet, and is surrounded by rolling hills and forests. The town is located near the Youghiogheny River, and is approximately 30 miles from Pittsburgh.
The town is located in a temperate climate, with mild winters and warm summers. The average annual temperature is around 50 degrees Fahrenheit, and the average annual precipitation is around 40 inches.
Economy
Skyline View’s economy is largely based on tourism and small businesses. The town is home to a number of small businesses, including restaurants, shops, and bed and breakfasts. The town also has a number of outdoor recreation opportunities, including hiking, fishing, and camping.
The town is also home to a number of small manufacturing businesses, including a furniture factory and a metal fabrication plant. The town is also home to a number of small farms, which produce a variety of fruits and vegetables.
Demographics
As of the 2010 census, Skyline View had a population of 1,500 people. The town is predominantly white, with a small African American population. The median household income is around $40,000, and the median home value is around $150,000.
Skyline View is a small, quiet community with a rich history and a strong sense of community. The town is home to a number of small businesses, and offers a variety of outdoor recreation opportunities. The town is also home to a number of small farms, which produce a variety of fruits and vegetables. Skyline View is a great place to live, work, and play.
Common Questions
What is Per Capita Income in Skyline View?
Per Capita income in Skyline View is $52,605.
What is the Median Family Income in Skyline View?
Median Family Income in Skyline View is $138,655.
What is the Median Household income in Skyline View?
Median Household Income in Skyline View is $114,167.
What is Income or Wage Gap in Skyline View?
Income or Wage Gap in Skyline View is 58.7%.
Women in Skyline View earn 41.3 cents for every dollar earned by a man.
What is Inequality or Gini Index in Skyline View?
Inequality or Gini Index in Skyline View is 0.33.
What is the Total Population of Skyline View?
Total Population of Skyline View is 4,848.
What is the Total Male Population of Skyline View?
Total Male Population of Skyline View is 2,300.
What is the Total Female Population of Skyline View?
Total Female Population of Skyline View is 2,548.
What is the Ratio of Males per 100 Females in Skyline View?
There are 90.27 Males per 100 Females in Skyline View.
What is the Ratio of Females per 100 Males in Skyline View?
There are 110.78 Females per 100 Males in Skyline View.
What is the Median Population Age in Skyline View?
Median Population Age in Skyline View is 54.8 Years.
What is the Average Family Size in Skyline View
Average Family Size in Skyline View is 2.5 People.
What is the Average Household Size in Skyline View
Average Household Size in Skyline View is 2.3 People.
How Large is the Labor Force in Skyline View?
There are 2,497 People in the Labor Forcein in Skyline View.
What is the Percentage of People in the Labor Force in Skyline View?
62.7% of People are in the Labor Force in Skyline View.
What is the Unemployment Rate in Skyline View?
Unemployment Rate in Skyline View is 0.8%.