Abbottstown borough, PA Map & Demographics
Abbottstown borough Overview
$29,785
PER CAPITA INCOME
$85,438
AVG FAMILY INCOME
$70,469
AVG HOUSEHOLD INCOME
30.4%
WAGE / INCOME GAP [ % ]
69.6¢/ $1
WAGE / INCOME GAP [ $ ]
0.36
INEQUALITY / GINI INDEX
850
TOTAL POPULATION
445
MALE POPULATION
405
FEMALE POPULATION
109.88
MALES / 100 FEMALES
91.01
FEMALES / 100 MALES
36.7
MEDIAN AGE
3.4
AVG FAMILY SIZE
2.8
AVG HOUSEHOLD SIZE
467
LABOR FORCE [ PEOPLE ]
74.0%
PERCENT IN LABOR FORCE
3.6%
UNEMPLOYMENT RATE
Income in Abbottstown borough
Income Overview in Abbottstown borough
Per Capita Income in Abbottstown borough is $29,785, while median incomes of families and households are $85,438 and $70,469 respectively.
| Characteristic | Number | Measure |
| Per Capita Income | 850 | $29,785 |
| Median Family Income | 209 | $85,438 |
| Mean Family Income | 209 | $91,989 |
| Median Household Income | 304 | $70,469 |
| Mean Household Income | 304 | $82,012 |
| Income Deficit | 209 | $0 |
| Wage / Income Gap (%) | 850 | 30.36% |
| Wage / Income Gap ($) | 850 | 69.64¢ per $1 |
| Gini / Inequality Index | 850 | 0.36 |
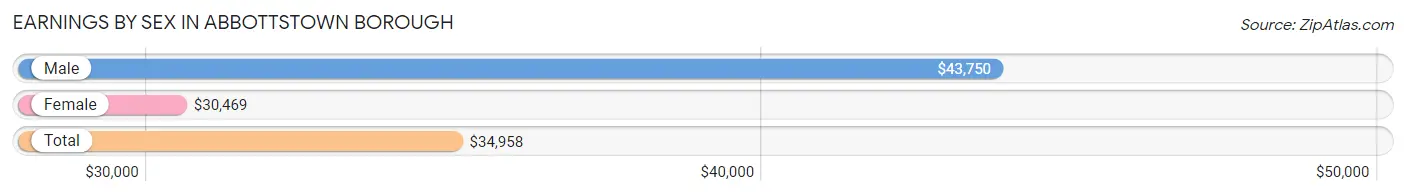
Earnings by Sex in Abbottstown borough
Average Earnings in Abbottstown borough are $34,958, $43,750 for men and $30,469 for women, a difference of 30.4%.
| Sex | Number | Average Earnings |
| Male | 278 (57.3%) | $43,750 |
| Female | 207 (42.7%) | $30,469 |
| Total | 485 (100.0%) | $34,958 |
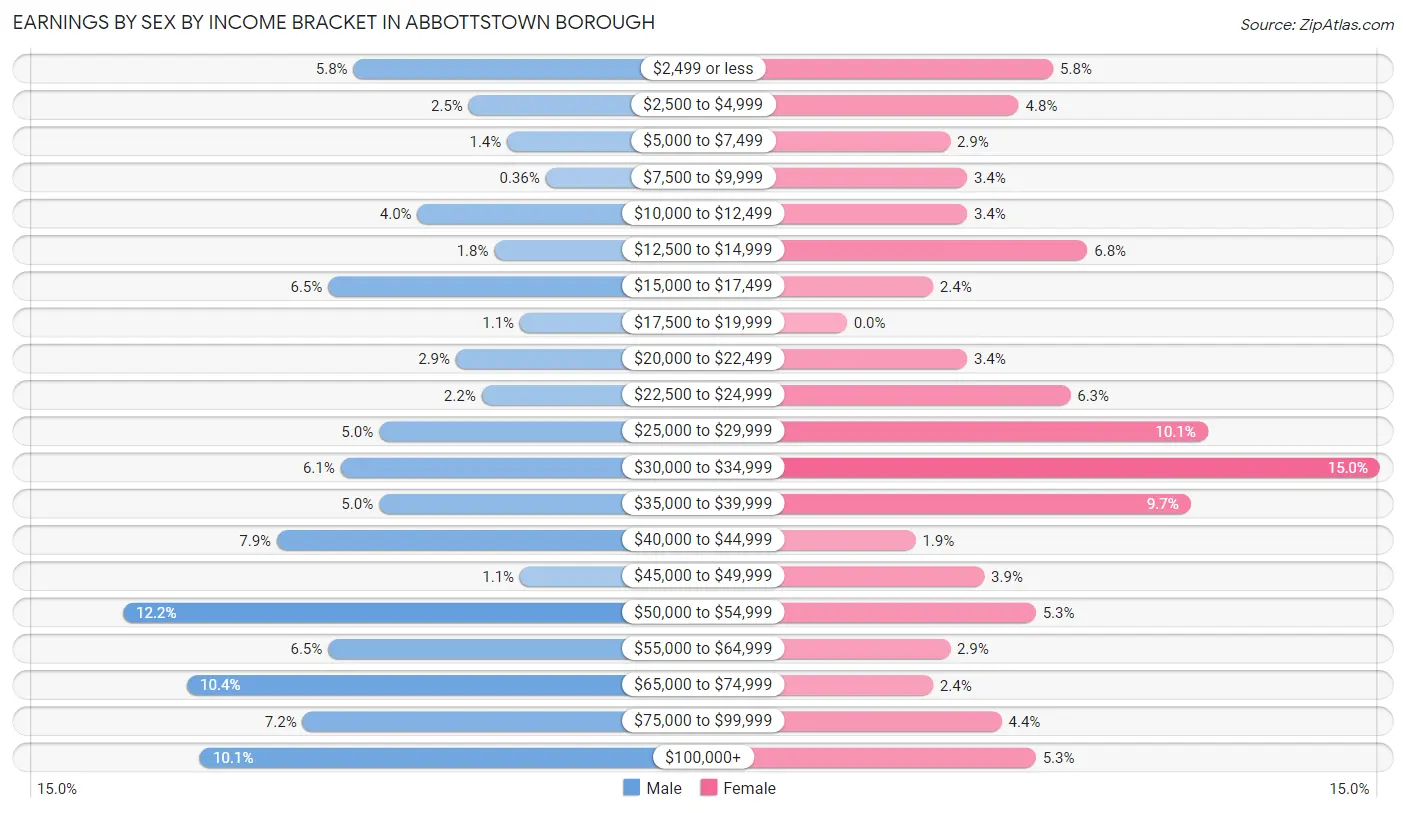
Earnings by Sex by Income Bracket in Abbottstown borough
The most common earnings brackets in Abbottstown borough are $50,000 to $54,999 for men (34 | 12.2%) and $30,000 to $34,999 for women (31 | 15.0%).
| Income | Male | Female |
| $2,499 or less | 16 (5.8%) | 12 (5.8%) |
| $2,500 to $4,999 | 7 (2.5%) | 10 (4.8%) |
| $5,000 to $7,499 | 4 (1.4%) | 6 (2.9%) |
| $7,500 to $9,999 | 1 (0.4%) | 7 (3.4%) |
| $10,000 to $12,499 | 11 (4.0%) | 7 (3.4%) |
| $12,500 to $14,999 | 5 (1.8%) | 14 (6.8%) |
| $15,000 to $17,499 | 18 (6.5%) | 5 (2.4%) |
| $17,500 to $19,999 | 3 (1.1%) | 0 (0.0%) |
| $20,000 to $22,499 | 8 (2.9%) | 7 (3.4%) |
| $22,500 to $24,999 | 6 (2.2%) | 13 (6.3%) |
| $25,000 to $29,999 | 14 (5.0%) | 21 (10.1%) |
| $30,000 to $34,999 | 17 (6.1%) | 31 (15.0%) |
| $35,000 to $39,999 | 14 (5.0%) | 20 (9.7%) |
| $40,000 to $44,999 | 22 (7.9%) | 4 (1.9%) |
| $45,000 to $49,999 | 3 (1.1%) | 8 (3.9%) |
| $50,000 to $54,999 | 34 (12.2%) | 11 (5.3%) |
| $55,000 to $64,999 | 18 (6.5%) | 6 (2.9%) |
| $65,000 to $74,999 | 29 (10.4%) | 5 (2.4%) |
| $75,000 to $99,999 | 20 (7.2%) | 9 (4.3%) |
| $100,000+ | 28 (10.1%) | 11 (5.3%) |
| Total | 278 (100.0%) | 207 (100.0%) |
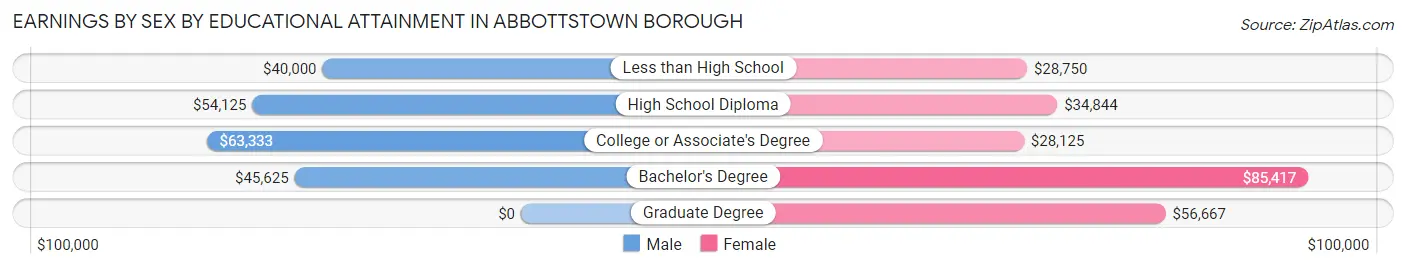
Earnings by Sex by Educational Attainment in Abbottstown borough
Average earnings in Abbottstown borough are $53,875 for men and $32,826 for women, a difference of 39.1%. Men with an educational attainment of college or associate's degree enjoy the highest average annual earnings of $63,333, while those with less than high school education earn the least with $40,000. Women with an educational attainment of bachelor's degree earn the most with the average annual earnings of $85,417, while those with college or associate's degree education have the smallest earnings of $28,125.
| Educational Attainment | Male Income | Female Income |
| Less than High School | $40,000 | $28,750 |
| High School Diploma | $54,125 | $34,844 |
| College or Associate's Degree | $63,333 | $28,125 |
| Bachelor's Degree | $45,625 | $85,417 |
| Graduate Degree | - | - |
| Total | $53,875 | $32,826 |
Family Income in Abbottstown borough
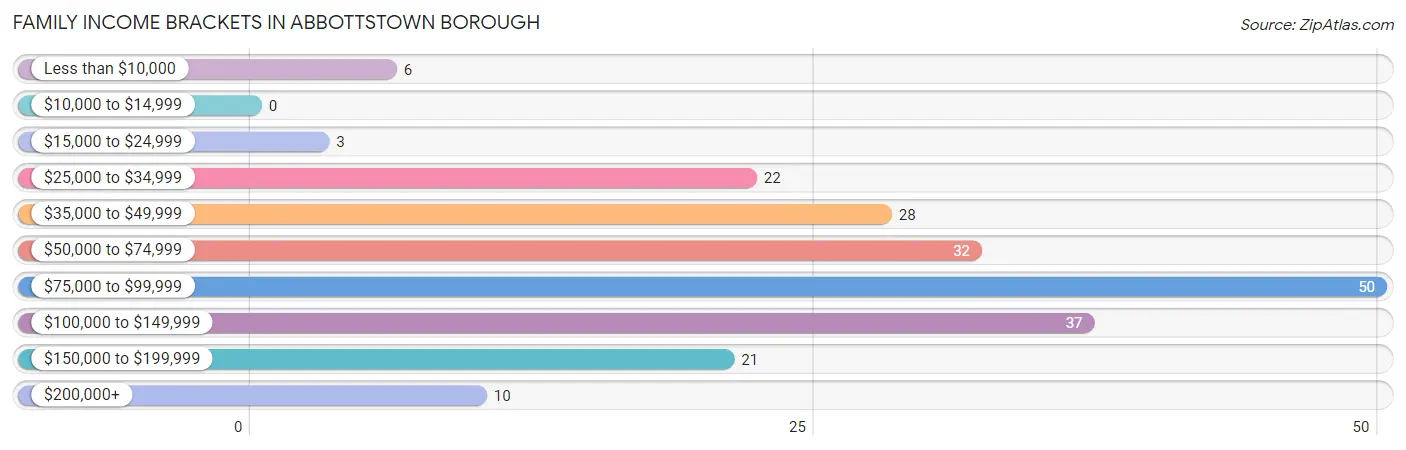
Family Income Brackets in Abbottstown borough
According to the Abbottstown borough family income data, there are 50 families falling into the $75,000 to $99,999 income range, which is the most common income bracket and makes up 23.9% of all families.
| Income Bracket | # Families | % Families |
| Less than $10,000 | 6 | 2.9% |
| $10,000 to $14,999 | 0 | 0.0% |
| $15,000 to $24,999 | 3 | 1.4% |
| $25,000 to $34,999 | 22 | 10.5% |
| $35,000 to $49,999 | 28 | 13.4% |
| $50,000 to $74,999 | 32 | 15.3% |
| $75,000 to $99,999 | 50 | 23.9% |
| $100,000 to $149,999 | 37 | 17.7% |
| $150,000 to $199,999 | 21 | 10.0% |
| $200,000+ | 10 | 4.8% |
Family Income by Famaliy Size in Abbottstown borough
5-person families (16 | 7.7%) account for the highest median family income in Abbottstown borough with $133,333 per family, while 3-person families (56 | 26.8%) have the highest median income of $36,667 per family member.
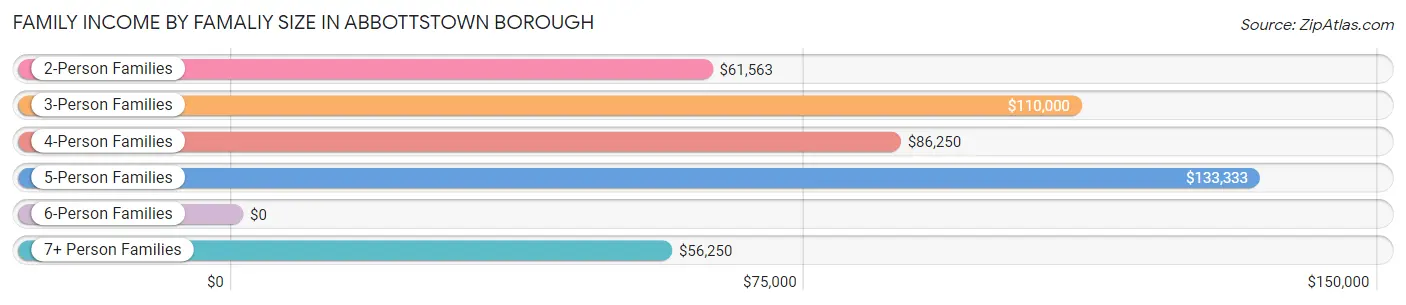
| Income Bracket | # Families | Median Income |
| 2-Person Families | 95 (45.5%) | $61,563 |
| 3-Person Families | 56 (26.8%) | $110,000 |
| 4-Person Families | 31 (14.8%) | $86,250 |
| 5-Person Families | 16 (7.7%) | $133,333 |
| 6-Person Families | 3 (1.4%) | $0 |
| 7+ Person Families | 8 (3.8%) | $56,250 |
| Total | 209 (100.0%) | $85,438 |
Family Income by Number of Earners in Abbottstown borough
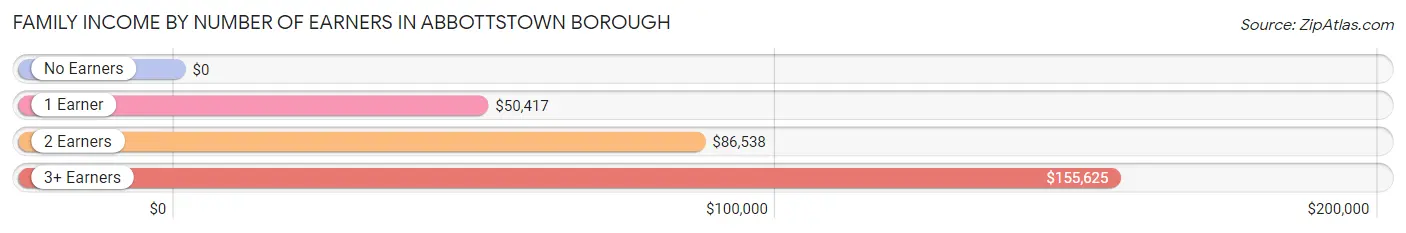
| Number of Earners | # Families | Median Income |
| No Earners | 9 (4.3%) | $0 |
| 1 Earner | 71 (34.0%) | $50,417 |
| 2 Earners | 98 (46.9%) | $86,538 |
| 3+ Earners | 31 (14.8%) | $155,625 |
| Total | 209 (100.0%) | $85,438 |
Household Income in Abbottstown borough
Household Income Brackets in Abbottstown borough
With 68 households falling in the category, the $50,000 to $74,999 income range is the most frequent in Abbottstown borough, accounting for 22.4% of all households. In contrast, only 2 households (0.7%) fall into the $10,000 to $14,999 income bracket, making it the least populous group.
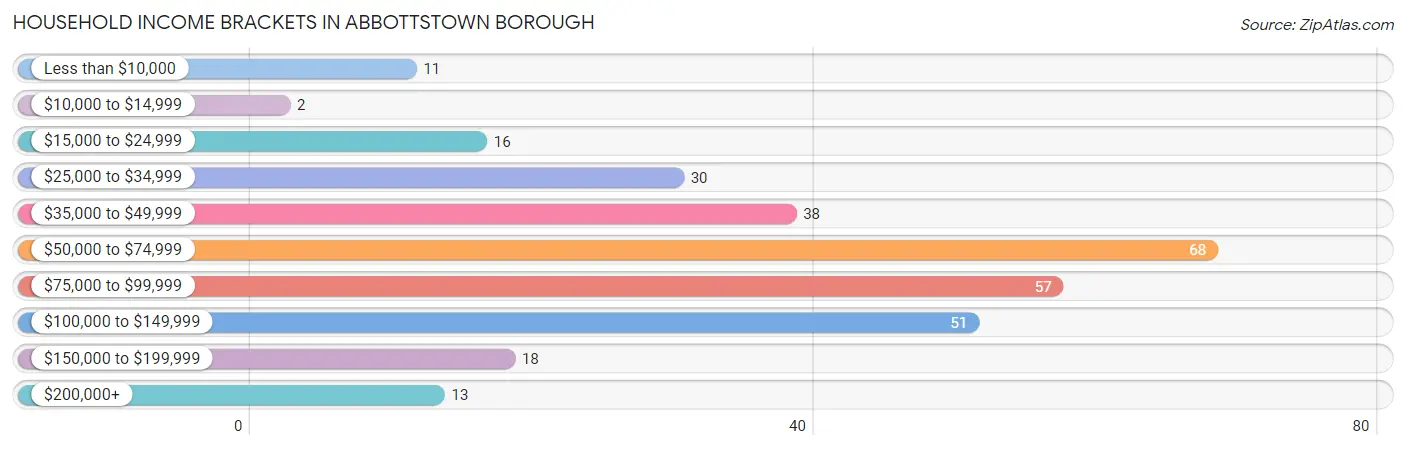
| Income Bracket | # Households | % Households |
| Less than $10,000 | 11 | 3.6% |
| $10,000 to $14,999 | 2 | 0.7% |
| $15,000 to $24,999 | 16 | 5.3% |
| $25,000 to $34,999 | 30 | 9.9% |
| $35,000 to $49,999 | 38 | 12.5% |
| $50,000 to $74,999 | 68 | 22.4% |
| $75,000 to $99,999 | 57 | 18.8% |
| $100,000 to $149,999 | 51 | 16.8% |
| $150,000 to $199,999 | 18 | 5.9% |
| $200,000+ | 13 | 4.3% |
Household Income by Householder Age in Abbottstown borough
The median household income in Abbottstown borough is $70,469, with the highest median household income of $85,556 found in the 25 to 44 years age bracket for the primary householder. A total of 108 households (35.5%) fall into this category. Meanwhile, the 15 to 24 years age bracket for the primary householder has the lowest median household income of $0, with 10 households (3.3%) in this group.
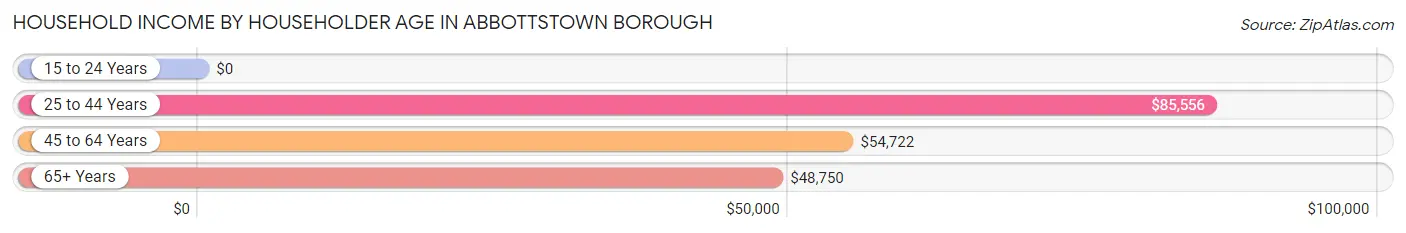
| Income Bracket | # Households | Median Income |
| 15 to 24 Years | 10 (3.3%) | $0 |
| 25 to 44 Years | 108 (35.5%) | $85,556 |
| 45 to 64 Years | 138 (45.4%) | $54,722 |
| 65+ Years | 48 (15.8%) | $48,750 |
| Total | 304 (100.0%) | $70,469 |
Poverty in Abbottstown borough
Income Below Poverty by Sex and Age in Abbottstown borough
With 5.0% poverty level for males and 4.7% for females among the residents of Abbottstown borough, 25 to 34 year old males and 55 to 64 year old females are the most vulnerable to poverty, with 9 males (14.7%) and 12 females (18.5%) in their respective age groups living below the poverty level.
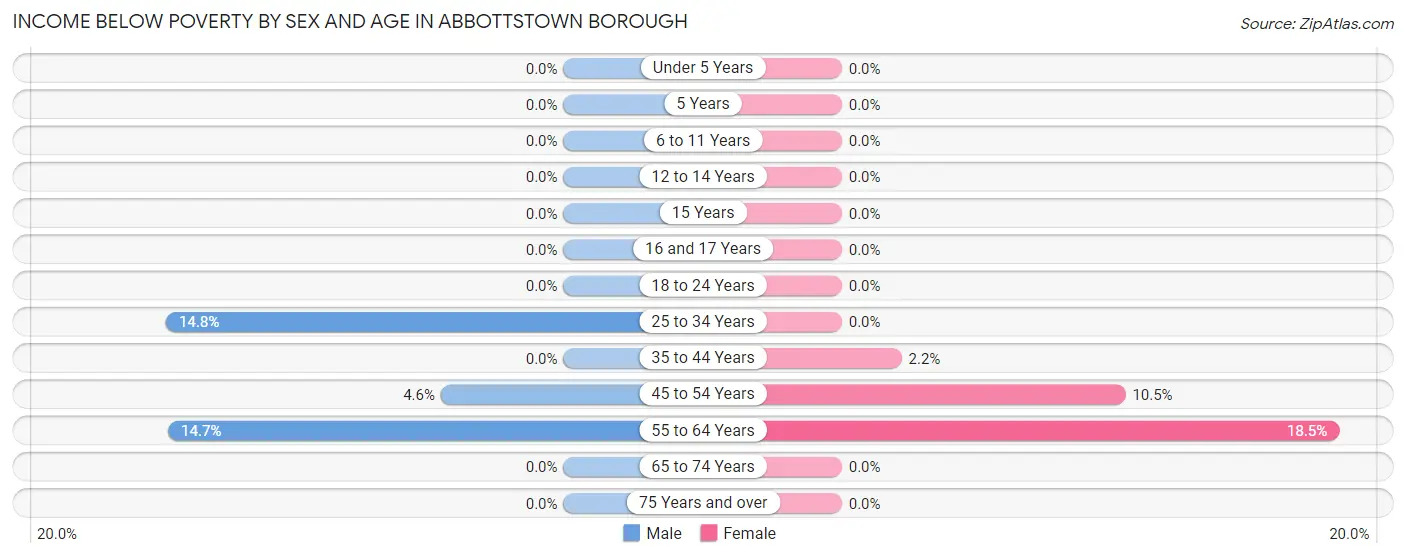
| Age Bracket | Male | Female |
| Under 5 Years | 0 (0.0%) | 0 (0.0%) |
| 5 Years | 0 (0.0%) | 0 (0.0%) |
| 6 to 11 Years | 0 (0.0%) | 0 (0.0%) |
| 12 to 14 Years | 0 (0.0%) | 0 (0.0%) |
| 15 Years | 0 (0.0%) | 0 (0.0%) |
| 16 and 17 Years | 0 (0.0%) | 0 (0.0%) |
| 18 to 24 Years | 0 (0.0%) | 0 (0.0%) |
| 25 to 34 Years | 9 (14.7%) | 0 (0.0%) |
| 35 to 44 Years | 0 (0.0%) | 1 (2.2%) |
| 45 to 54 Years | 2 (4.5%) | 6 (10.5%) |
| 55 to 64 Years | 11 (14.7%) | 12 (18.5%) |
| 65 to 74 Years | 0 (0.0%) | 0 (0.0%) |
| 75 Years and over | 0 (0.0%) | 0 (0.0%) |
| Total | 22 (5.0%) | 19 (4.7%) |
Income Above Poverty by Sex and Age in Abbottstown borough
According to the poverty statistics in Abbottstown borough, males aged under 5 years and females aged under 5 years are the age groups that are most secure financially, with 100.0% of males and 100.0% of females in these age groups living above the poverty line.
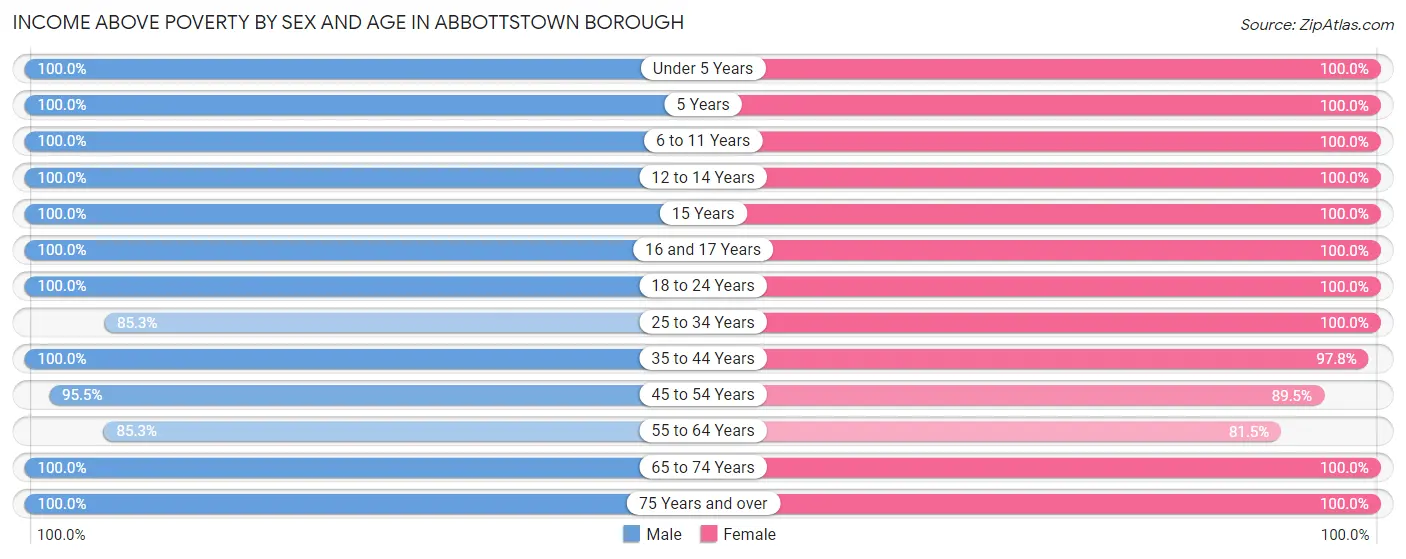
| Age Bracket | Male | Female |
| Under 5 Years | 17 (100.0%) | 46 (100.0%) |
| 5 Years | 7 (100.0%) | 6 (100.0%) |
| 6 to 11 Years | 44 (100.0%) | 36 (100.0%) |
| 12 to 14 Years | 14 (100.0%) | 32 (100.0%) |
| 15 Years | 9 (100.0%) | 2 (100.0%) |
| 16 and 17 Years | 18 (100.0%) | 6 (100.0%) |
| 18 to 24 Years | 53 (100.0%) | 23 (100.0%) |
| 25 to 34 Years | 52 (85.3%) | 40 (100.0%) |
| 35 to 44 Years | 58 (100.0%) | 44 (97.8%) |
| 45 to 54 Years | 42 (95.5%) | 51 (89.5%) |
| 55 to 64 Years | 64 (85.3%) | 53 (81.5%) |
| 65 to 74 Years | 28 (100.0%) | 27 (100.0%) |
| 75 Years and over | 14 (100.0%) | 17 (100.0%) |
| Total | 420 (95.0%) | 383 (95.3%) |
Income Below Poverty Among Married-Couple Families in Abbottstown borough
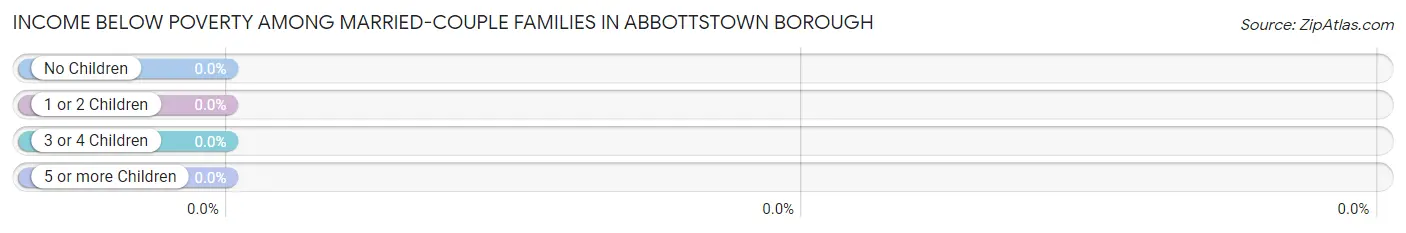
| Children | Above Poverty | Below Poverty |
| No Children | 81 (100.0%) | 0 (0.0%) |
| 1 or 2 Children | 48 (100.0%) | 0 (0.0%) |
| 3 or 4 Children | 15 (100.0%) | 0 (0.0%) |
| 5 or more Children | 4 (100.0%) | 0 (0.0%) |
| Total | 148 (100.0%) | 0 (0.0%) |
Income Below Poverty Among Single-Parent Households in Abbottstown borough
According to the poverty data in Abbottstown borough, 13.6% or 3 single-father households and 15.4% or 6 single-mother households are living below the poverty line. Among single-father households, those with no children have the highest poverty rate, with 3 households (25.0%) experiencing poverty. Likewise, among single-mother households, those with no children have the highest poverty rate, with 6 households (21.4%) falling below the poverty line.
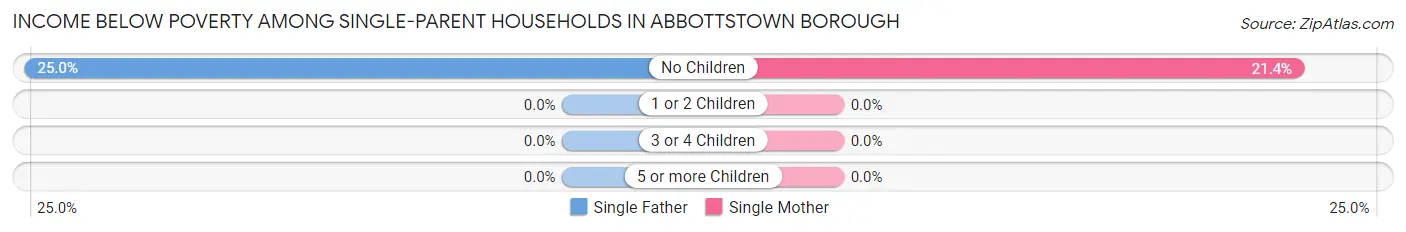
| Children | Single Father | Single Mother |
| No Children | 3 (25.0%) | 6 (21.4%) |
| 1 or 2 Children | 0 (0.0%) | 0 (0.0%) |
| 3 or 4 Children | 0 (0.0%) | 0 (0.0%) |
| 5 or more Children | 0 (0.0%) | 0 (0.0%) |
| Total | 3 (13.6%) | 6 (15.4%) |
Income Below Poverty Among Married-Couple vs Single-Parent Households in Abbottstown borough
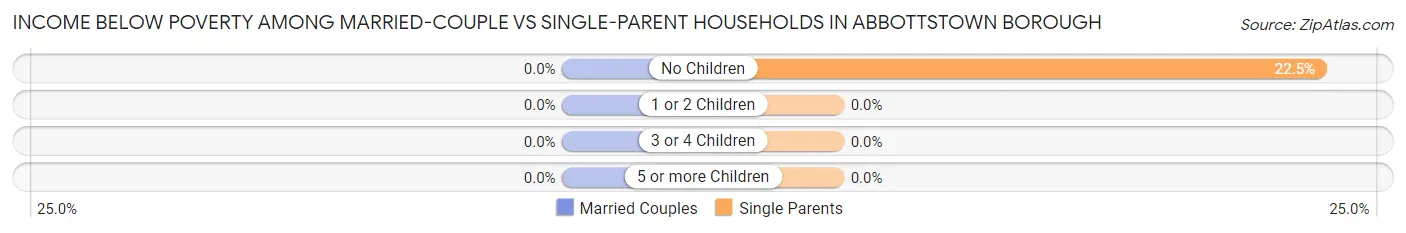
| Children | Married-Couple Families | Single-Parent Households |
| No Children | 0 (0.0%) | 9 (22.5%) |
| 1 or 2 Children | 0 (0.0%) | 0 (0.0%) |
| 3 or 4 Children | 0 (0.0%) | 0 (0.0%) |
| 5 or more Children | 0 (0.0%) | 0 (0.0%) |
| Total | 0 (0.0%) | 9 (14.7%) |
Race in Abbottstown borough
The most populous races in Abbottstown borough are White / Caucasian (824 | 96.9%), Hispanic or Latino (38 | 4.5%), and Two or more Races (18 | 2.1%).
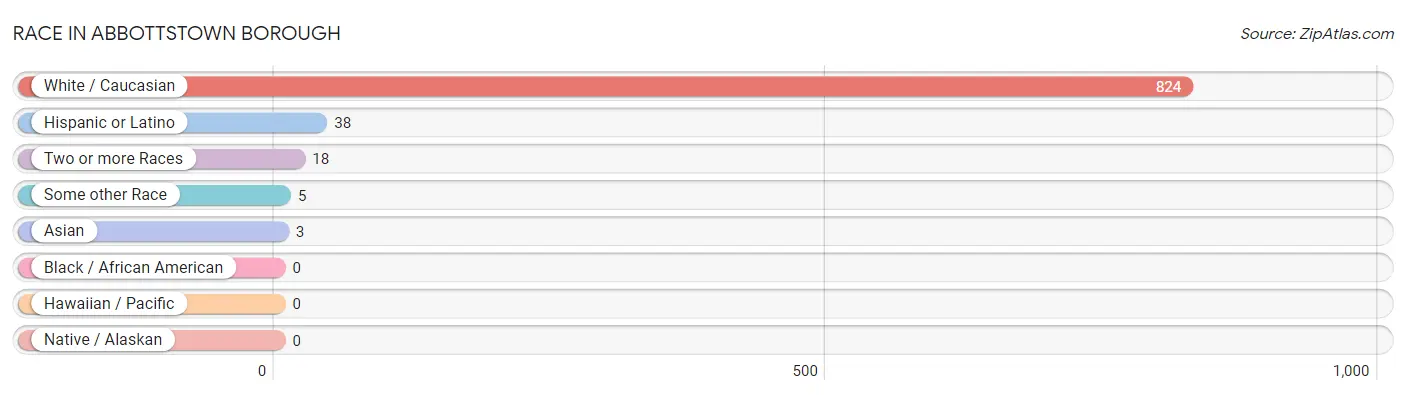
| Race | # Population | % Population |
| Asian | 3 | 0.4% |
| Black / African American | 0 | 0.0% |
| Hawaiian / Pacific | 0 | 0.0% |
| Hispanic or Latino | 38 | 4.5% |
| Native / Alaskan | 0 | 0.0% |
| White / Caucasian | 824 | 96.9% |
| Two or more Races | 18 | 2.1% |
| Some other Race | 5 | 0.6% |
| Total | 850 | 100.0% |
Ancestry in Abbottstown borough
The most populous ancestries reported in Abbottstown borough are German (414 | 48.7%), Irish (86 | 10.1%), American (64 | 7.5%), English (62 | 7.3%), and French (42 | 4.9%), together accounting for 78.6% of all Abbottstown borough residents.
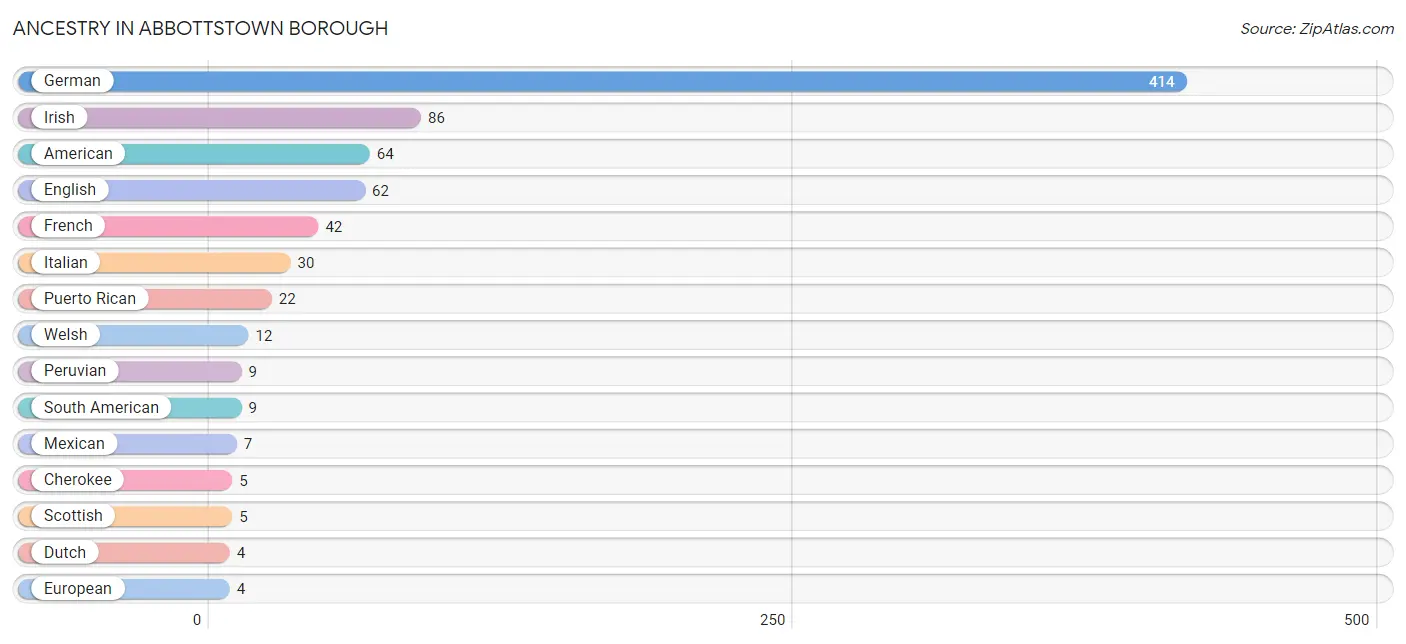
| Ancestry | # Population | % Population |
| American | 64 | 7.5% |
| Blackfeet | 1 | 0.1% |
| Cherokee | 5 | 0.6% |
| Dutch | 4 | 0.5% |
| English | 62 | 7.3% |
| European | 4 | 0.5% |
| French | 42 | 4.9% |
| French Canadian | 4 | 0.5% |
| German | 414 | 48.7% |
| Irish | 86 | 10.1% |
| Italian | 30 | 3.5% |
| Korean | 3 | 0.4% |
| Mexican | 7 | 0.8% |
| Pennsylvania German | 1 | 0.1% |
| Peruvian | 9 | 1.1% |
| Puerto Rican | 22 | 2.6% |
| Scotch-Irish | 4 | 0.5% |
| Scottish | 5 | 0.6% |
| South American | 9 | 1.1% |
| Swedish | 2 | 0.2% |
| Ute | 2 | 0.2% |
| Welsh | 12 | 1.4% |
| West Indian | 2 | 0.2% | View All 23 Rows |
Immigrants in Abbottstown borough
The most numerous immigrant groups reported in Abbottstown borough came from Latin America (15 | 1.8%), Peru (11 | 1.3%), South America (11 | 1.3%), Central America (4 | 0.5%), and Mexico (4 | 0.5%), together accounting for 5.3% of all Abbottstown borough residents.
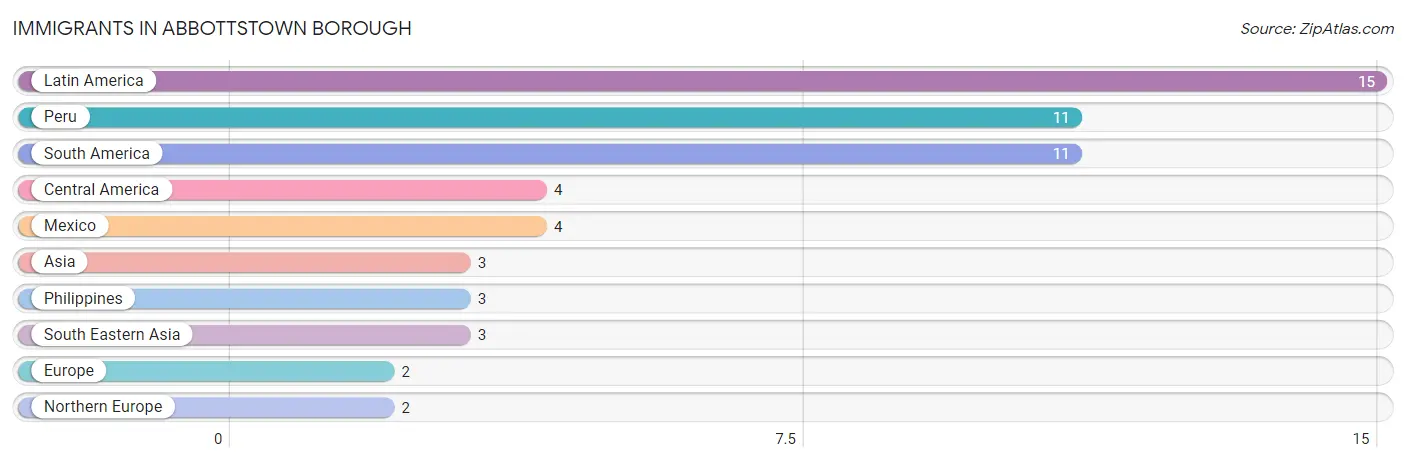
| Immigration Origin | # Population | % Population |
| Asia | 3 | 0.4% |
| Central America | 4 | 0.5% |
| Europe | 2 | 0.2% |
| Latin America | 15 | 1.8% |
| Mexico | 4 | 0.5% |
| Northern Europe | 2 | 0.2% |
| Peru | 11 | 1.3% |
| Philippines | 3 | 0.4% |
| South America | 11 | 1.3% |
| South Eastern Asia | 3 | 0.4% | View All 10 Rows |
Sex and Age in Abbottstown borough
Sex and Age in Abbottstown borough
The most populous age groups in Abbottstown borough are 60 to 64 Years (48 | 10.8%) for men and 60 to 64 Years (48 | 11.8%) for women.
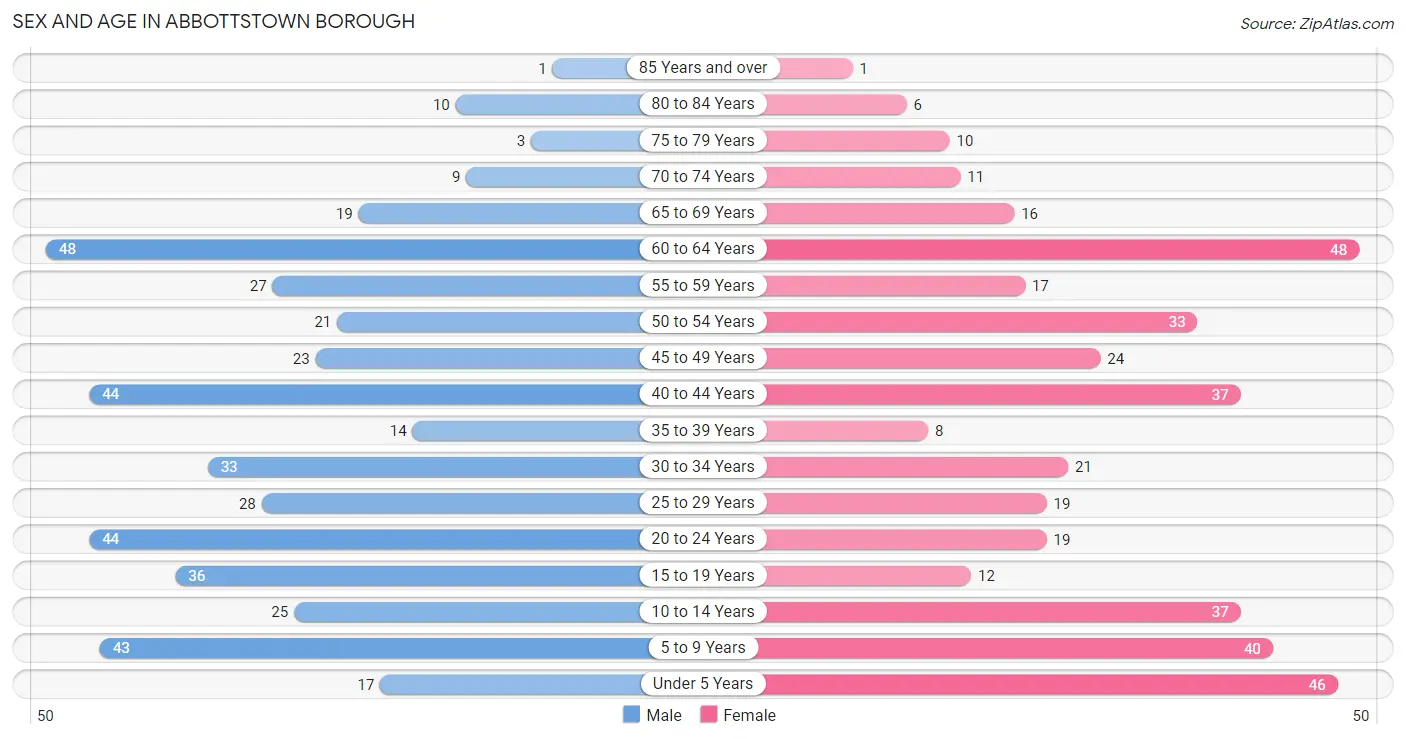
| Age Bracket | Male | Female |
| Under 5 Years | 17 (3.8%) | 46 (11.4%) |
| 5 to 9 Years | 43 (9.7%) | 40 (9.9%) |
| 10 to 14 Years | 25 (5.6%) | 37 (9.1%) |
| 15 to 19 Years | 36 (8.1%) | 12 (3.0%) |
| 20 to 24 Years | 44 (9.9%) | 19 (4.7%) |
| 25 to 29 Years | 28 (6.3%) | 19 (4.7%) |
| 30 to 34 Years | 33 (7.4%) | 21 (5.2%) |
| 35 to 39 Years | 14 (3.2%) | 8 (2.0%) |
| 40 to 44 Years | 44 (9.9%) | 37 (9.1%) |
| 45 to 49 Years | 23 (5.2%) | 24 (5.9%) |
| 50 to 54 Years | 21 (4.7%) | 33 (8.2%) |
| 55 to 59 Years | 27 (6.1%) | 17 (4.2%) |
| 60 to 64 Years | 48 (10.8%) | 48 (11.8%) |
| 65 to 69 Years | 19 (4.3%) | 16 (4.0%) |
| 70 to 74 Years | 9 (2.0%) | 11 (2.7%) |
| 75 to 79 Years | 3 (0.7%) | 10 (2.5%) |
| 80 to 84 Years | 10 (2.2%) | 6 (1.5%) |
| 85 Years and over | 1 (0.2%) | 1 (0.3%) |
| Total | 445 (100.0%) | 405 (100.0%) |
Families and Households in Abbottstown borough
Median Family Size in Abbottstown borough
The median family size in Abbottstown borough is 3.35 persons per family, with single female/mother families (39 | 18.7%) accounting for the largest median family size of 3.49 persons per family. On the other hand, single male/father families (22 | 10.5%) represent the smallest median family size with 3.05 persons per family.
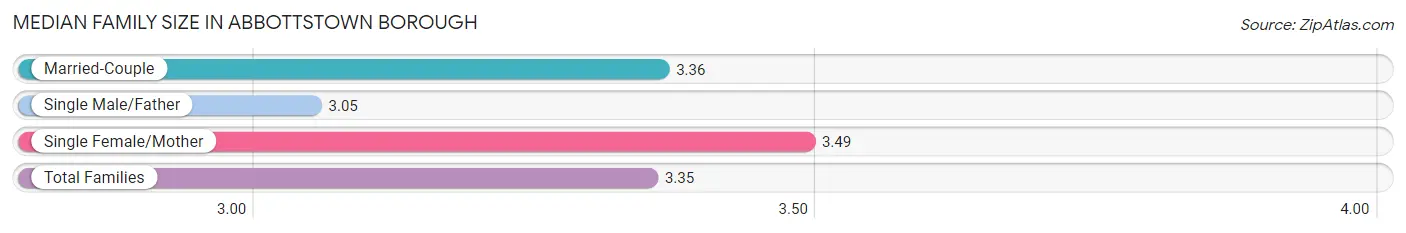
| Family Type | # Families | Family Size |
| Married-Couple | 148 (70.8%) | 3.36 |
| Single Male/Father | 22 (10.5%) | 3.05 |
| Single Female/Mother | 39 (18.7%) | 3.49 |
| Total Families | 209 (100.0%) | 3.35 |
Median Household Size in Abbottstown borough
The median household size in Abbottstown borough is 2.79 persons per household, with single female/mother households (39 | 12.8%) accounting for the largest median household size of 3.92 persons per household. non-family households (95 | 31.2%) represent the smallest median household size with 1.36 persons per household.
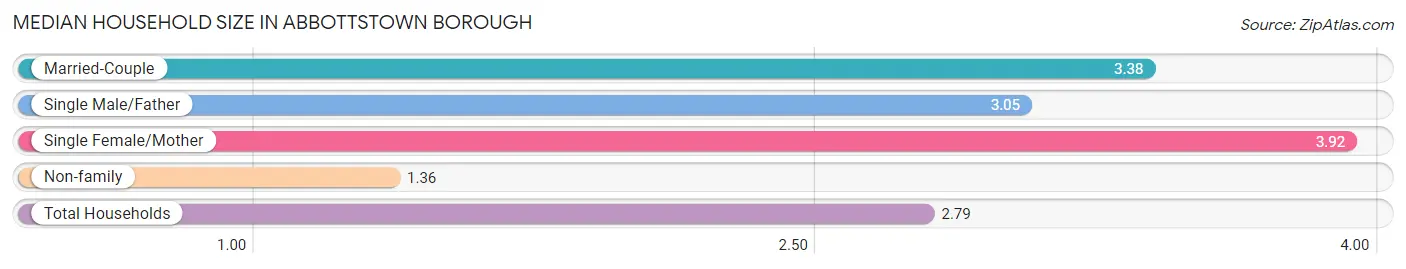
| Household Type | # Households | Household Size |
| Married-Couple | 148 (48.7%) | 3.38 |
| Single Male/Father | 22 (7.2%) | 3.05 |
| Single Female/Mother | 39 (12.8%) | 3.92 |
| Non-family | 95 (31.2%) | 1.36 |
| Total Households | 304 (100.0%) | 2.79 |
Household Size by Marriage Status in Abbottstown borough
Out of a total of 304 households in Abbottstown borough, 209 (68.8%) are family households, while 95 (31.2%) are nonfamily households. The most numerous type of family households are 2-person households, comprising 92, and the most common type of nonfamily households are 1-person households, comprising 70.
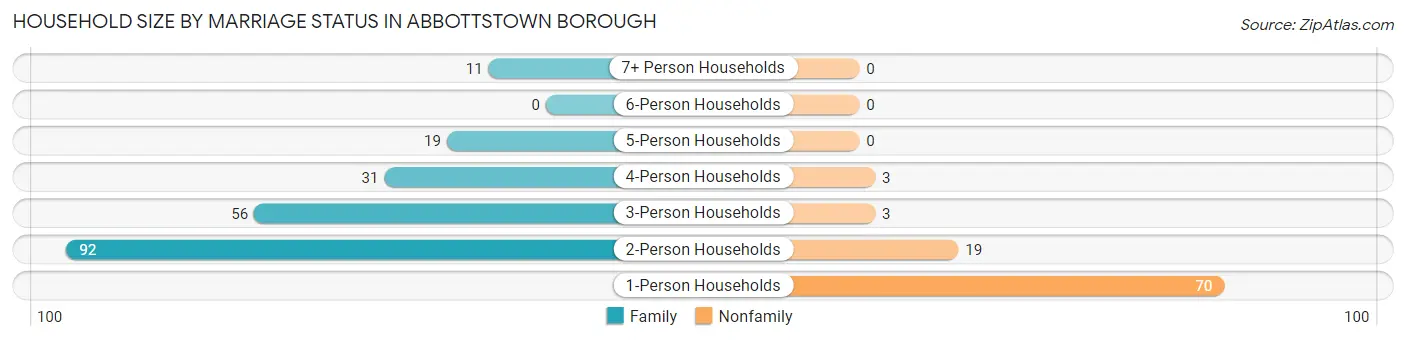
| Household Size | Family Households | Nonfamily Households |
| 1-Person Households | - | 70 (23.0%) |
| 2-Person Households | 92 (30.3%) | 19 (6.2%) |
| 3-Person Households | 56 (18.4%) | 3 (1.0%) |
| 4-Person Households | 31 (10.2%) | 3 (1.0%) |
| 5-Person Households | 19 (6.2%) | 0 (0.0%) |
| 6-Person Households | 0 (0.0%) | 0 (0.0%) |
| 7+ Person Households | 11 (3.6%) | 0 (0.0%) |
| Total | 209 (68.8%) | 95 (31.2%) |
Female Fertility in Abbottstown borough
Fertility by Age in Abbottstown borough
Average fertility rate in Abbottstown borough is 107.0 births per 1,000 women. Women in the age bracket of 20 to 34 years have the highest fertility rate with 220.0 births per 1,000 women. Women in the age bracket of 20 to 34 years acount for 86.7% of all women with births.
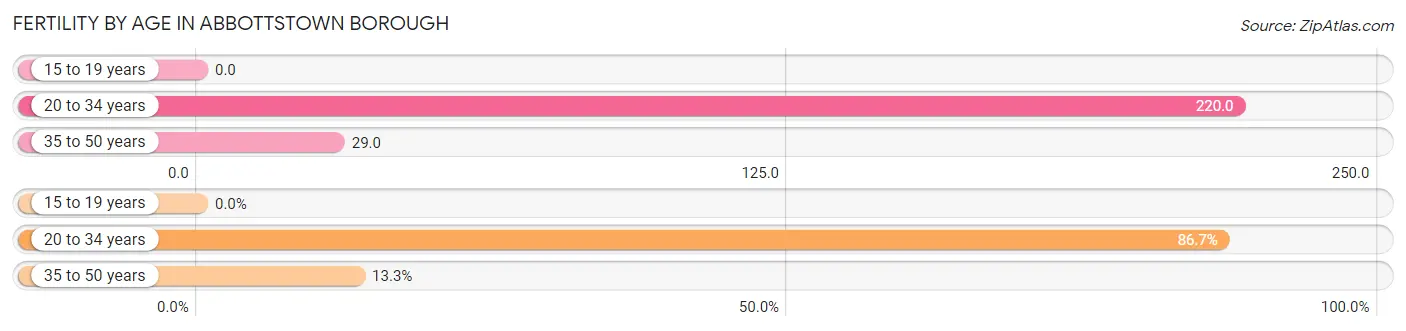
| Age Bracket | Women with Births | Births / 1,000 Women |
| 15 to 19 years | 0 (0.0%) | 0.0 |
| 20 to 34 years | 13 (86.7%) | 220.0 |
| 35 to 50 years | 2 (13.3%) | 29.0 |
| Total | 15 (100.0%) | 107.0 |
Fertility by Age by Marriage Status in Abbottstown borough
66.7% of women with births (15) in Abbottstown borough are married. The highest percentage of unmarried women with births falls into 35 to 50 years age bracket with 100.0% of them unmarried at the time of birth, while the lowest percentage of unmarried women with births belong to 20 to 34 years age bracket with 23.1% of them unmarried.
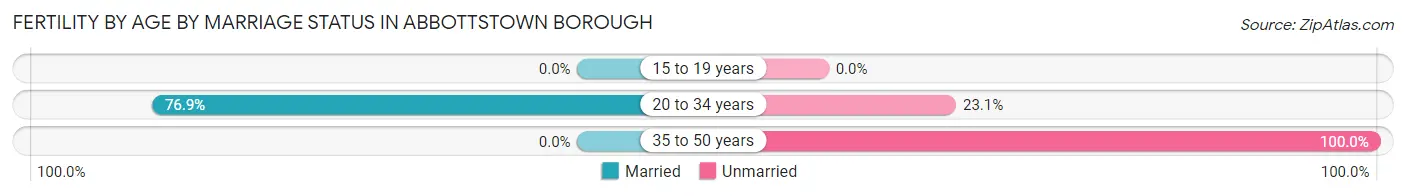
| Age Bracket | Married | Unmarried |
| 15 to 19 years | 0 (0.0%) | 0 (0.0%) |
| 20 to 34 years | 10 (76.9%) | 3 (23.1%) |
| 35 to 50 years | 0 (0.0%) | 2 (100.0%) |
| Total | 10 (66.7%) | 5 (33.3%) |
Fertility by Education in Abbottstown borough
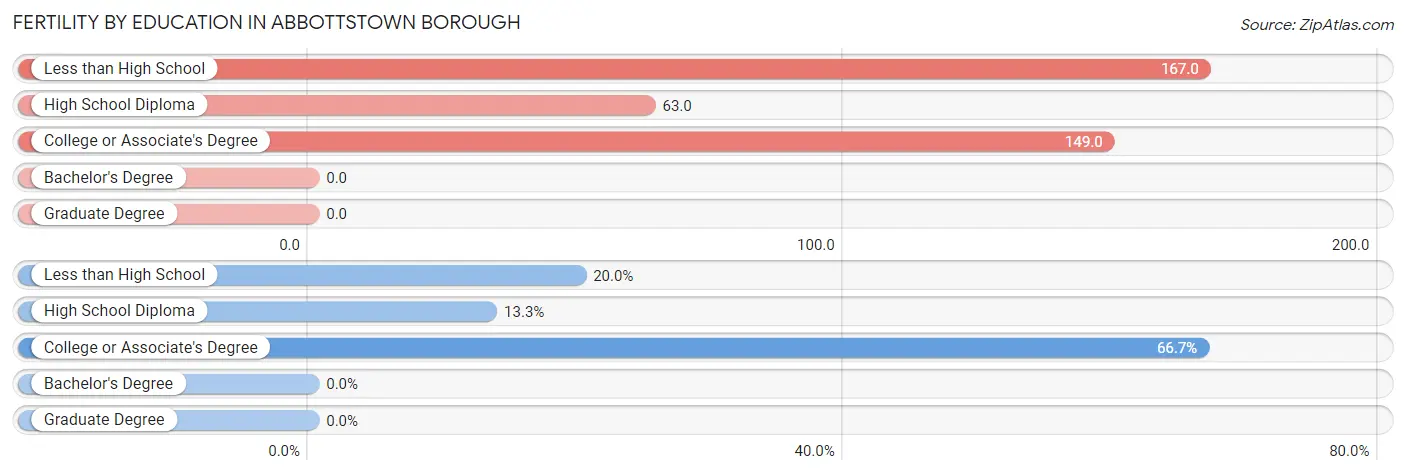
| Educational Attainment | Women with Births | Births / 1,000 Women |
| Less than High School | 3 (20.0%) | 167.0 |
| High School Diploma | 2 (13.3%) | 63.0 |
| College or Associate's Degree | 10 (66.7%) | 149.0 |
| Bachelor's Degree | 0 (0.0%) | 0.0 |
| Graduate Degree | 0 (0.0%) | 0.0 |
| Total | 15 (100.0%) | 107.0 |
Fertility by Education by Marriage Status in Abbottstown borough
33.3% of women with births in Abbottstown borough are unmarried. Women with the educational attainment of college or associate's degree are most likely to be married with 100.0% of them married at childbirth, while women with the educational attainment of less than high school are least likely to be married with 100.0% of them unmarried at childbirth.
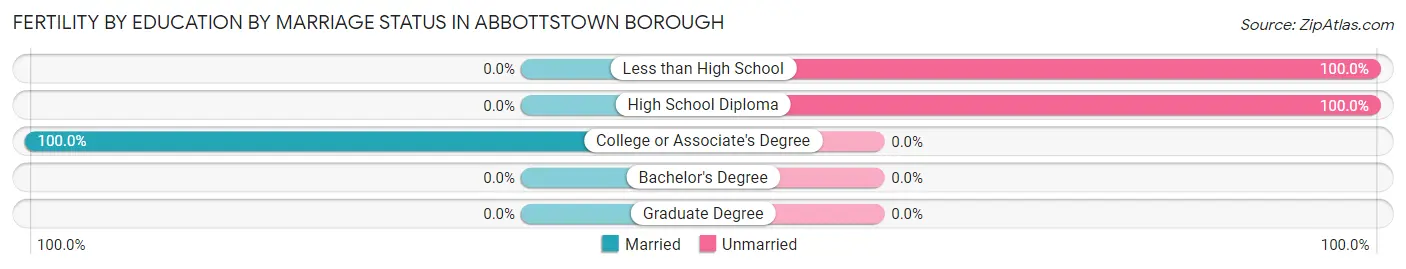
| Educational Attainment | Married | Unmarried |
| Less than High School | 0 (0.0%) | 3 (100.0%) |
| High School Diploma | 0 (0.0%) | 2 (100.0%) |
| College or Associate's Degree | 10 (100.0%) | 0 (0.0%) |
| Bachelor's Degree | 0 (0.0%) | 0 (0.0%) |
| Graduate Degree | 0 (0.0%) | 0 (0.0%) |
| Total | 10 (66.7%) | 5 (33.3%) |
Employment Characteristics in Abbottstown borough
Employment by Class of Employer in Abbottstown borough
Among the 431 employed individuals in Abbottstown borough, private company employees (330 | 76.6%), not-for-profit organizations (36 | 8.4%), and self-employed (not incorporated) (26 | 6.0%) make up the most common classes of employment.
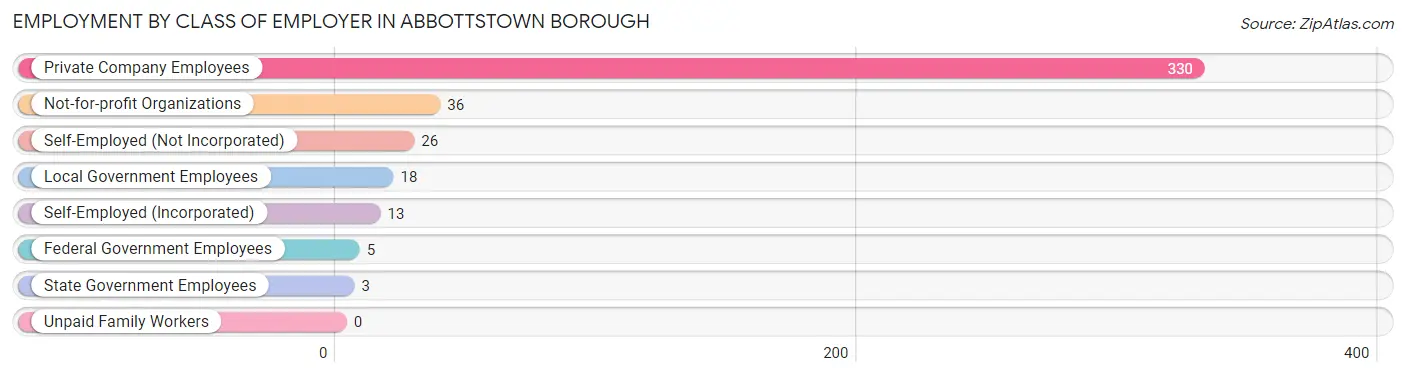
| Employer Class | # Employees | % Employees |
| Private Company Employees | 330 | 76.6% |
| Self-Employed (Incorporated) | 13 | 3.0% |
| Self-Employed (Not Incorporated) | 26 | 6.0% |
| Not-for-profit Organizations | 36 | 8.4% |
| Local Government Employees | 18 | 4.2% |
| State Government Employees | 3 | 0.7% |
| Federal Government Employees | 5 | 1.2% |
| Unpaid Family Workers | 0 | 0.0% |
| Total | 431 | 100.0% |
Employment Status by Age in Abbottstown borough
According to the labor force statistics for Abbottstown borough, out of the total population over 16 years of age (631), 74.0% or 467 individuals are in the labor force, with 3.6% or 17 of them unemployed. The age group with the highest labor force participation rate is 25 to 29 years, with 97.9% or 46 individuals in the labor force. Within the labor force, the 65 to 74 years age range has the highest percentage of unemployed individuals, with 12.0% or 3 of them being unemployed.
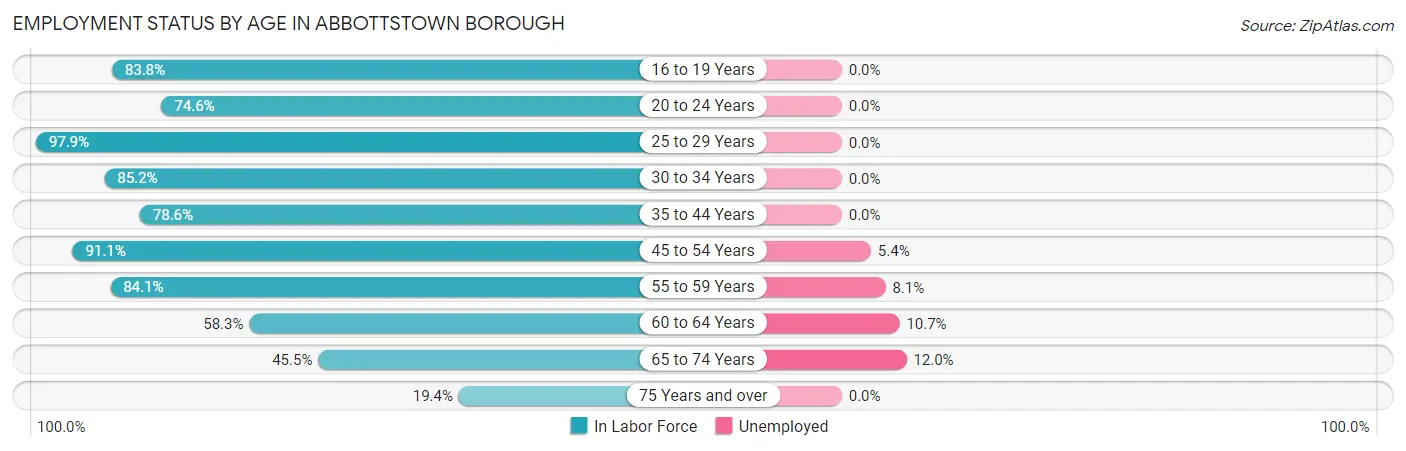
| Age Bracket | In Labor Force | Unemployed |
| 16 to 19 Years | 31 (83.8%) | 0 (0.0%) |
| 20 to 24 Years | 47 (74.6%) | 0 (0.0%) |
| 25 to 29 Years | 46 (97.9%) | 0 (0.0%) |
| 30 to 34 Years | 46 (85.2%) | 0 (0.0%) |
| 35 to 44 Years | 81 (78.6%) | 0 (0.0%) |
| 45 to 54 Years | 92 (91.1%) | 5 (5.4%) |
| 55 to 59 Years | 37 (84.1%) | 3 (8.1%) |
| 60 to 64 Years | 56 (58.3%) | 6 (10.7%) |
| 65 to 74 Years | 25 (45.5%) | 3 (12.0%) |
| 75 Years and over | 6 (19.4%) | 0 (0.0%) |
| Total | 467 (74.0%) | 17 (3.6%) |
Employment Status by Educational Attainment in Abbottstown borough
According to labor force statistics for Abbottstown borough, 80.4% of individuals (358) out of the total population between 25 and 64 years of age (445) are in the labor force, with 3.9% or 14 of them being unemployed. The group with the highest labor force participation rate are those with the educational attainment of college / associate degree, with 81.0% or 119 individuals in the labor force. Within the labor force, individuals with less than high school education have the highest percentage of unemployment, with 13.5% or 5 of them being unemployed.
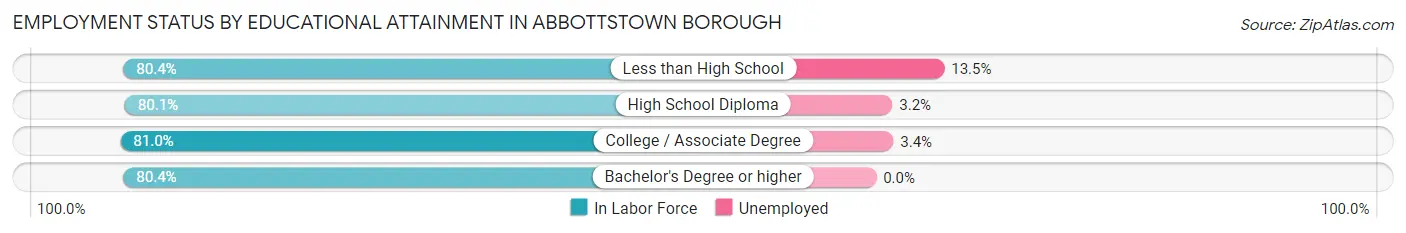
| Educational Attainment | In Labor Force | Unemployed |
| Less than High School | 37 (80.4%) | 6 (13.5%) |
| High School Diploma | 157 (80.1%) | 6 (3.2%) |
| College / Associate Degree | 119 (81.0%) | 5 (3.4%) |
| Bachelor's Degree or higher | 45 (80.4%) | 0 (0.0%) |
| Total | 358 (80.4%) | 17 (3.9%) |
Employment Occupations by Sex in Abbottstown borough
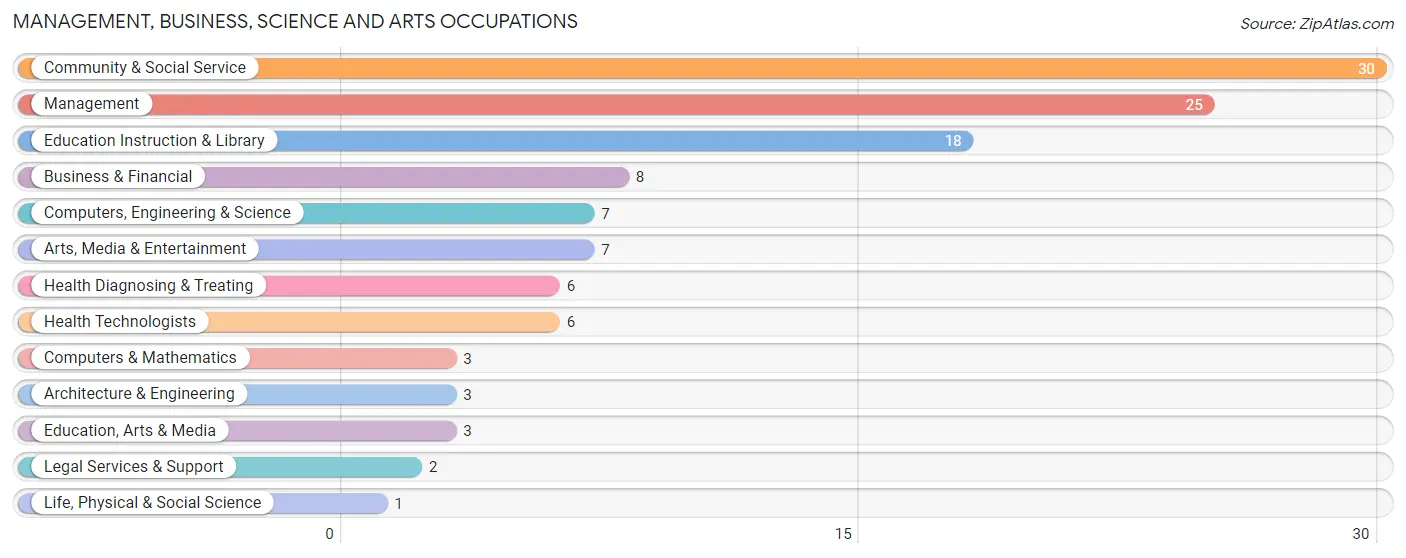
Management, Business, Science and Arts Occupations
The most common Management, Business, Science and Arts occupations in Abbottstown borough are Community & Social Service (30 | 6.7%), Management (25 | 5.6%), Education Instruction & Library (18 | 4.0%), Business & Financial (8 | 1.8%), and Computers, Engineering & Science (7 | 1.6%).
Management, Business, Science and Arts Occupations by Sex
Within the Management, Business, Science and Arts occupations in Abbottstown borough, the most male-oriented occupations are Education, Arts & Media (100.0%), Legal Services & Support (100.0%), and Management (92.0%), while the most female-oriented occupations are Computers & Mathematics (100.0%), Life, Physical & Social Science (100.0%), and Business & Financial (87.5%).
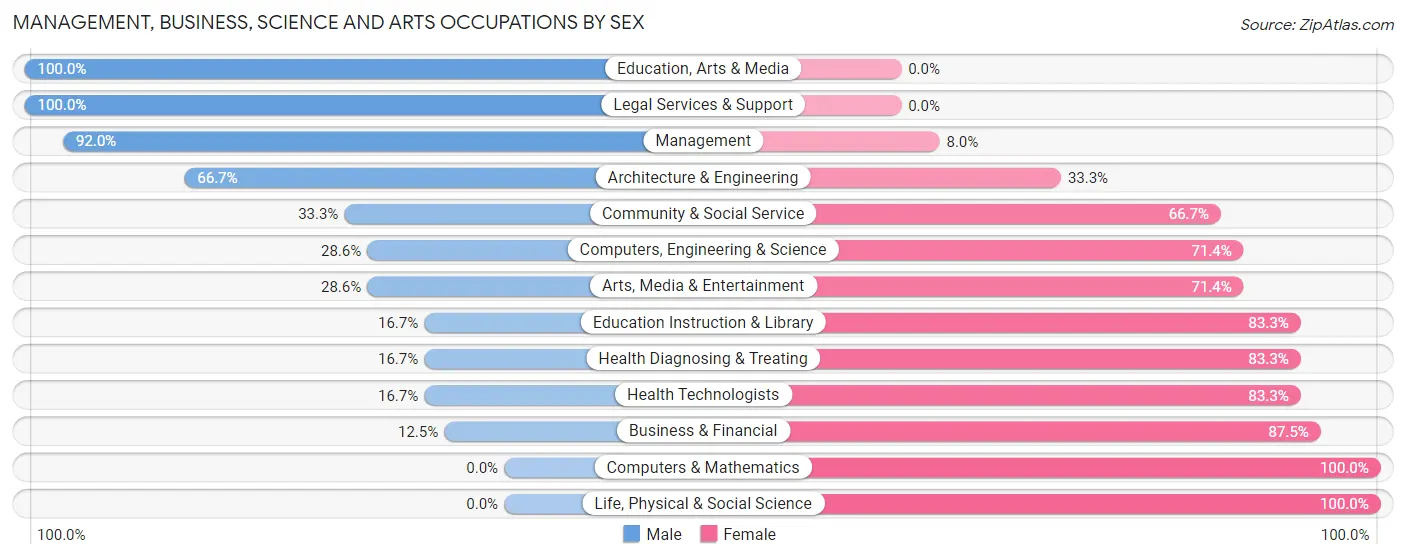
| Occupation | Male | Female |
| Management | 23 (92.0%) | 2 (8.0%) |
| Business & Financial | 1 (12.5%) | 7 (87.5%) |
| Computers, Engineering & Science | 2 (28.6%) | 5 (71.4%) |
| Computers & Mathematics | 0 (0.0%) | 3 (100.0%) |
| Architecture & Engineering | 2 (66.7%) | 1 (33.3%) |
| Life, Physical & Social Science | 0 (0.0%) | 1 (100.0%) |
| Community & Social Service | 10 (33.3%) | 20 (66.7%) |
| Education, Arts & Media | 3 (100.0%) | 0 (0.0%) |
| Legal Services & Support | 2 (100.0%) | 0 (0.0%) |
| Education Instruction & Library | 3 (16.7%) | 15 (83.3%) |
| Arts, Media & Entertainment | 2 (28.6%) | 5 (71.4%) |
| Health Diagnosing & Treating | 1 (16.7%) | 5 (83.3%) |
| Health Technologists | 1 (16.7%) | 5 (83.3%) |
| Total (Category) | 37 (48.7%) | 39 (51.3%) |
| Total (Overall) | 252 (56.0%) | 198 (44.0%) |
Services Occupations
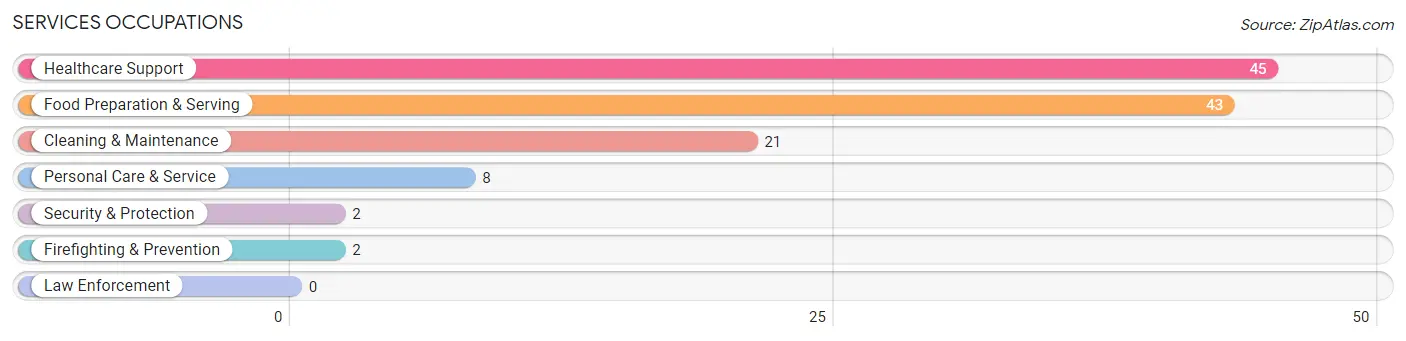
The most common Services occupations in Abbottstown borough are Healthcare Support (45 | 10.0%), Food Preparation & Serving (43 | 9.6%), Cleaning & Maintenance (21 | 4.7%), Personal Care & Service (8 | 1.8%), and Security & Protection (2 | 0.4%).
Services Occupations by Sex
Within the Services occupations in Abbottstown borough, the most male-oriented occupations are Cleaning & Maintenance (90.5%), Food Preparation & Serving (72.1%), and Personal Care & Service (37.5%), while the most female-oriented occupations are Healthcare Support (100.0%), Security & Protection (100.0%), and Firefighting & Prevention (100.0%).
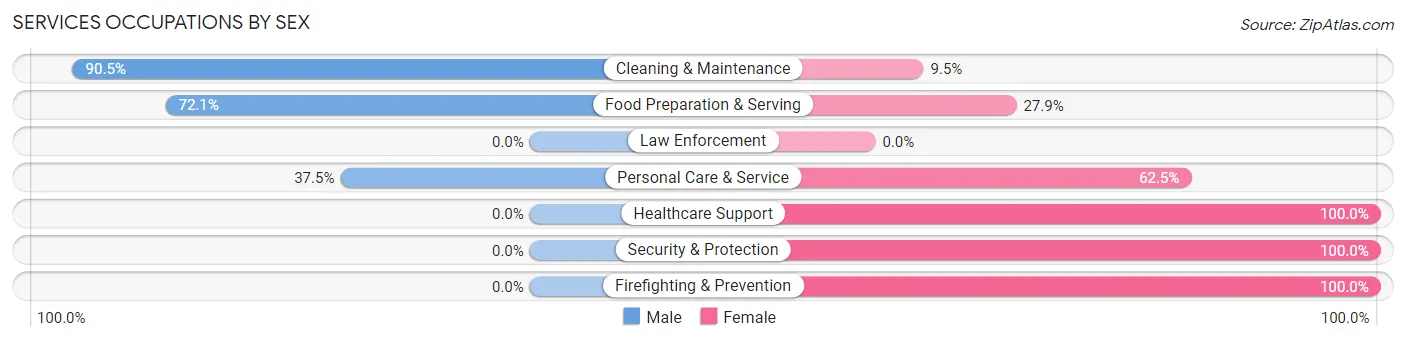
| Occupation | Male | Female |
| Healthcare Support | 0 (0.0%) | 45 (100.0%) |
| Security & Protection | 0 (0.0%) | 2 (100.0%) |
| Firefighting & Prevention | 0 (0.0%) | 2 (100.0%) |
| Law Enforcement | 0 (0.0%) | 0 (0.0%) |
| Food Preparation & Serving | 31 (72.1%) | 12 (27.9%) |
| Cleaning & Maintenance | 19 (90.5%) | 2 (9.5%) |
| Personal Care & Service | 3 (37.5%) | 5 (62.5%) |
| Total (Category) | 53 (44.5%) | 66 (55.5%) |
| Total (Overall) | 252 (56.0%) | 198 (44.0%) |
Sales and Office Occupations
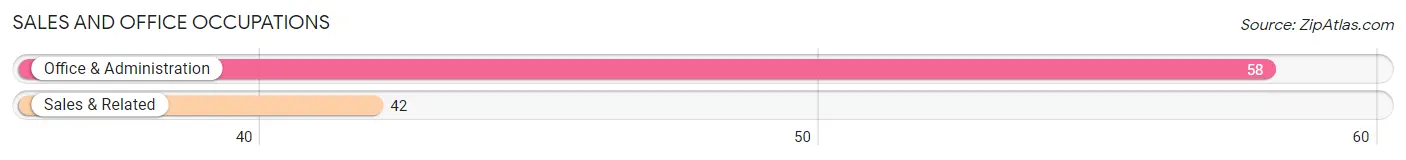
The most common Sales and Office occupations in Abbottstown borough are Office & Administration (58 | 12.9%), and Sales & Related (42 | 9.3%).
Sales and Office Occupations by Sex
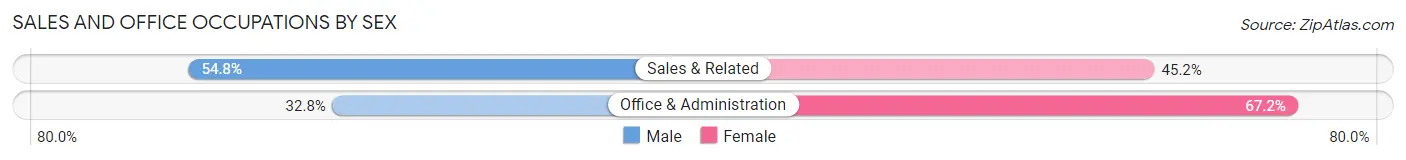
| Occupation | Male | Female |
| Sales & Related | 23 (54.8%) | 19 (45.2%) |
| Office & Administration | 19 (32.8%) | 39 (67.2%) |
| Total (Category) | 42 (42.0%) | 58 (58.0%) |
| Total (Overall) | 252 (56.0%) | 198 (44.0%) |
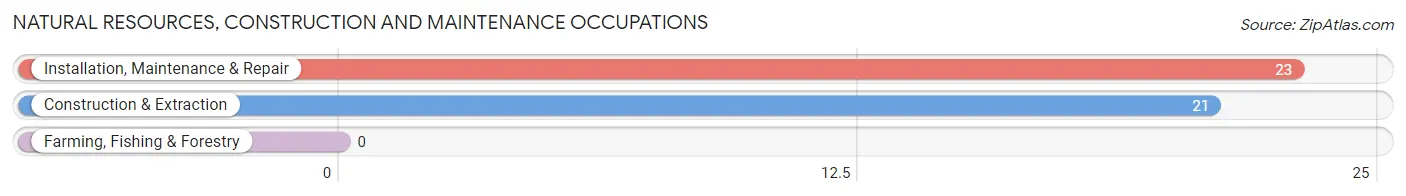
Natural Resources, Construction and Maintenance Occupations
The most common Natural Resources, Construction and Maintenance occupations in Abbottstown borough are Installation, Maintenance & Repair (23 | 5.1%), and Construction & Extraction (21 | 4.7%).
Natural Resources, Construction and Maintenance Occupations by Sex
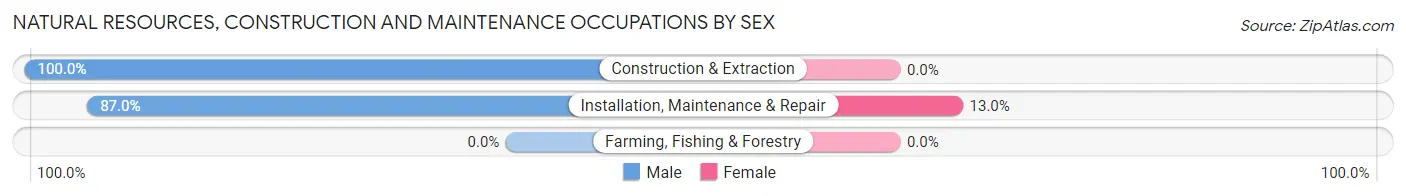
| Occupation | Male | Female |
| Farming, Fishing & Forestry | 0 (0.0%) | 0 (0.0%) |
| Construction & Extraction | 21 (100.0%) | 0 (0.0%) |
| Installation, Maintenance & Repair | 20 (87.0%) | 3 (13.0%) |
| Total (Category) | 41 (93.2%) | 3 (6.8%) |
| Total (Overall) | 252 (56.0%) | 198 (44.0%) |
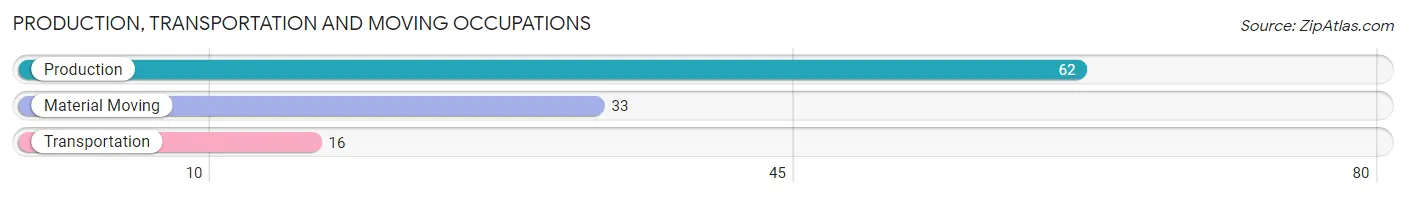
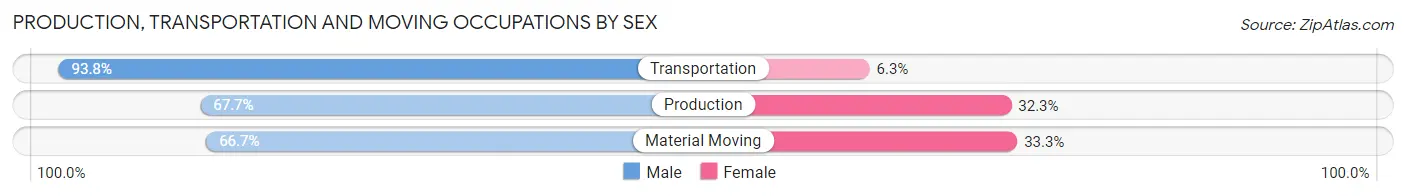
Production, Transportation and Moving Occupations
The most common Production, Transportation and Moving occupations in Abbottstown borough are Production (62 | 13.8%), Material Moving (33 | 7.3%), and Transportation (16 | 3.6%).
Production, Transportation and Moving Occupations by Sex
| Occupation | Male | Female |
| Production | 42 (67.7%) | 20 (32.3%) |
| Transportation | 15 (93.8%) | 1 (6.2%) |
| Material Moving | 22 (66.7%) | 11 (33.3%) |
| Total (Category) | 79 (71.2%) | 32 (28.8%) |
| Total (Overall) | 252 (56.0%) | 198 (44.0%) |
Employment Industries by Sex in Abbottstown borough
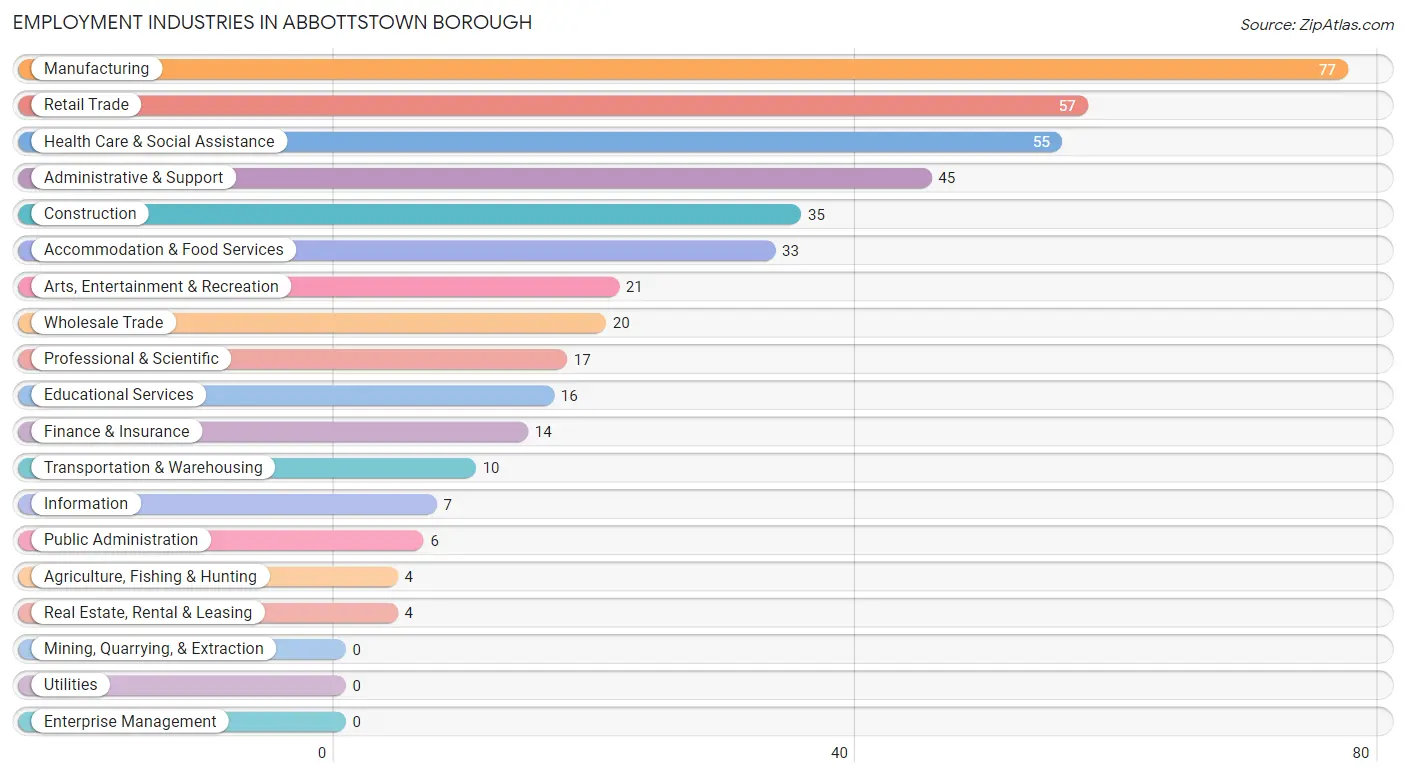
Employment Industries in Abbottstown borough
The major employment industries in Abbottstown borough include Manufacturing (77 | 17.1%), Retail Trade (57 | 12.7%), Health Care & Social Assistance (55 | 12.2%), Administrative & Support (45 | 10.0%), and Construction (35 | 7.8%).
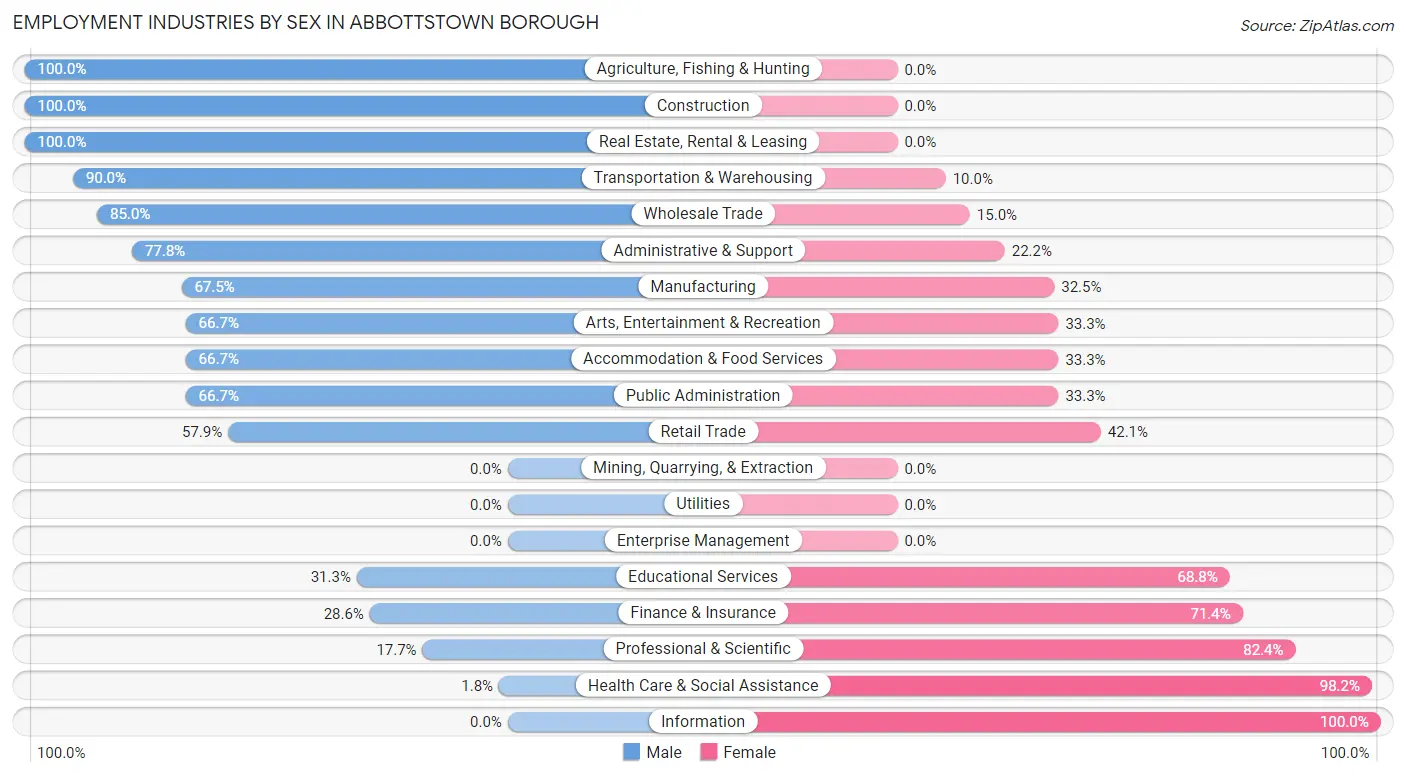
Employment Industries by Sex in Abbottstown borough
The Abbottstown borough industries that see more men than women are Agriculture, Fishing & Hunting (100.0%), Construction (100.0%), and Real Estate, Rental & Leasing (100.0%), whereas the industries that tend to have a higher number of women are Information (100.0%), Health Care & Social Assistance (98.2%), and Professional & Scientific (82.4%).
| Industry | Male | Female |
| Agriculture, Fishing & Hunting | 4 (100.0%) | 0 (0.0%) |
| Mining, Quarrying, & Extraction | 0 (0.0%) | 0 (0.0%) |
| Construction | 35 (100.0%) | 0 (0.0%) |
| Manufacturing | 52 (67.5%) | 25 (32.5%) |
| Wholesale Trade | 17 (85.0%) | 3 (15.0%) |
| Retail Trade | 33 (57.9%) | 24 (42.1%) |
| Transportation & Warehousing | 9 (90.0%) | 1 (10.0%) |
| Utilities | 0 (0.0%) | 0 (0.0%) |
| Information | 0 (0.0%) | 7 (100.0%) |
| Finance & Insurance | 4 (28.6%) | 10 (71.4%) |
| Real Estate, Rental & Leasing | 4 (100.0%) | 0 (0.0%) |
| Professional & Scientific | 3 (17.6%) | 14 (82.4%) |
| Enterprise Management | 0 (0.0%) | 0 (0.0%) |
| Administrative & Support | 35 (77.8%) | 10 (22.2%) |
| Educational Services | 5 (31.2%) | 11 (68.8%) |
| Health Care & Social Assistance | 1 (1.8%) | 54 (98.2%) |
| Arts, Entertainment & Recreation | 14 (66.7%) | 7 (33.3%) |
| Accommodation & Food Services | 22 (66.7%) | 11 (33.3%) |
| Public Administration | 4 (66.7%) | 2 (33.3%) |
| Total | 252 (56.0%) | 198 (44.0%) |
Education in Abbottstown borough
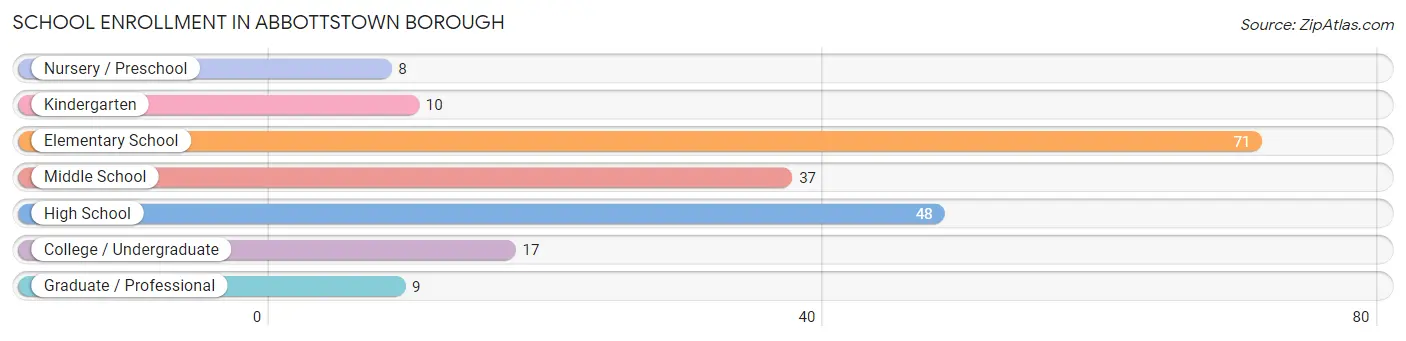
School Enrollment in Abbottstown borough
The most common levels of schooling among the 200 students in Abbottstown borough are elementary school (71 | 35.5%), high school (48 | 24.0%), and middle school (37 | 18.5%).
| School Level | # Students | % Students |
| Nursery / Preschool | 8 | 4.0% |
| Kindergarten | 10 | 5.0% |
| Elementary School | 71 | 35.5% |
| Middle School | 37 | 18.5% |
| High School | 48 | 24.0% |
| College / Undergraduate | 17 | 8.5% |
| Graduate / Professional | 9 | 4.5% |
| Total | 200 | 100.0% |
School Enrollment by Age by Funding Source in Abbottstown borough
Out of a total of 200 students who are enrolled in schools in Abbottstown borough, 39 (19.5%) attend a private institution, while the remaining 161 (80.5%) are enrolled in public schools. The age group of 3 to 4 year olds has the highest likelihood of being enrolled in private schools, with 5 (100.0% in the age bracket) enrolled. Conversely, the age group of 15 to 17 year olds has the lowest likelihood of being enrolled in a private school, with 30 (93.8% in the age bracket) attending a public institution.
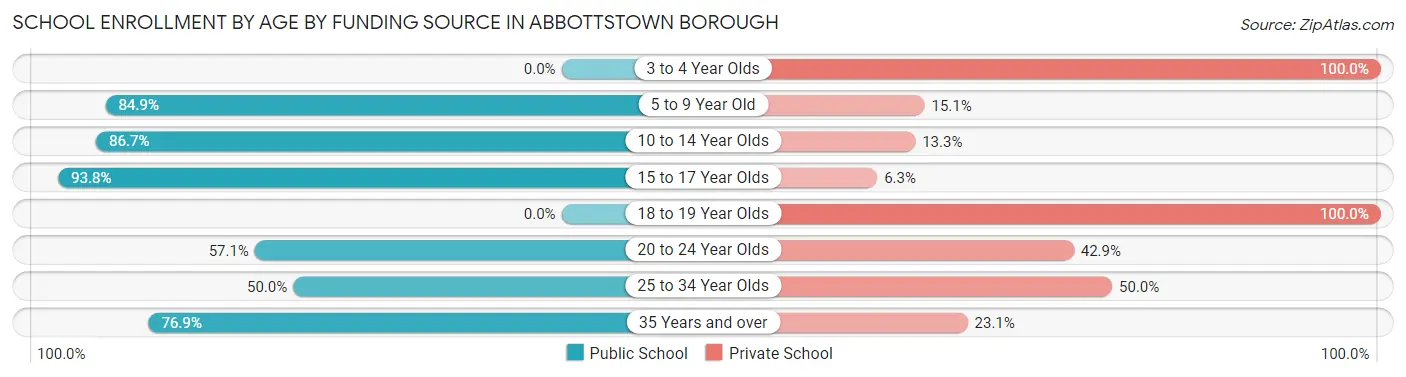
| Age Bracket | Public School | Private School |
| 3 to 4 Year Olds | 0 (0.0%) | 5 (100.0%) |
| 5 to 9 Year Old | 62 (84.9%) | 11 (15.1%) |
| 10 to 14 Year Olds | 52 (86.7%) | 8 (13.3%) |
| 15 to 17 Year Olds | 30 (93.8%) | 2 (6.2%) |
| 18 to 19 Year Olds | 0 (0.0%) | 4 (100.0%) |
| 20 to 24 Year Olds | 4 (57.1%) | 3 (42.9%) |
| 25 to 34 Year Olds | 3 (50.0%) | 3 (50.0%) |
| 35 Years and over | 10 (76.9%) | 3 (23.1%) |
| Total | 161 (80.5%) | 39 (19.5%) |
Educational Attainment by Field of Study in Abbottstown borough
Liberal arts & history (21 | 27.6%), education (17 | 22.4%), science & technology (11 | 14.5%), business (7 | 9.2%), and social sciences (6 | 7.9%) are the most common fields of study among 76 individuals in Abbottstown borough who have obtained a bachelor's degree or higher.
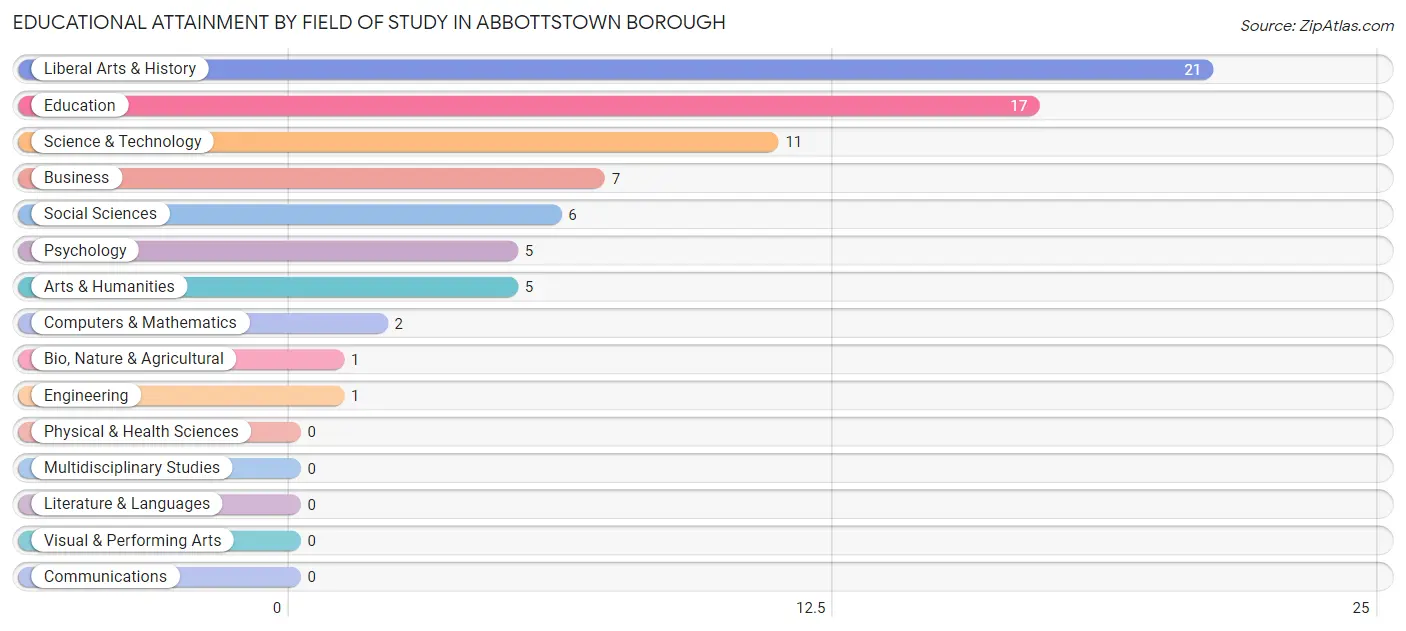
| Field of Study | # Graduates | % Graduates |
| Computers & Mathematics | 2 | 2.6% |
| Bio, Nature & Agricultural | 1 | 1.3% |
| Physical & Health Sciences | 0 | 0.0% |
| Psychology | 5 | 6.6% |
| Social Sciences | 6 | 7.9% |
| Engineering | 1 | 1.3% |
| Multidisciplinary Studies | 0 | 0.0% |
| Science & Technology | 11 | 14.5% |
| Business | 7 | 9.2% |
| Education | 17 | 22.4% |
| Literature & Languages | 0 | 0.0% |
| Liberal Arts & History | 21 | 27.6% |
| Visual & Performing Arts | 0 | 0.0% |
| Communications | 0 | 0.0% |
| Arts & Humanities | 5 | 6.6% |
| Total | 76 | 100.0% |
Transportation & Commute in Abbottstown borough
Vehicle Availability by Sex in Abbottstown borough
The most prevalent vehicle ownership categories in Abbottstown borough are males with 2 vehicles (122, accounting for 49.0%) and females with 2 vehicles (104, making up 67.0%).
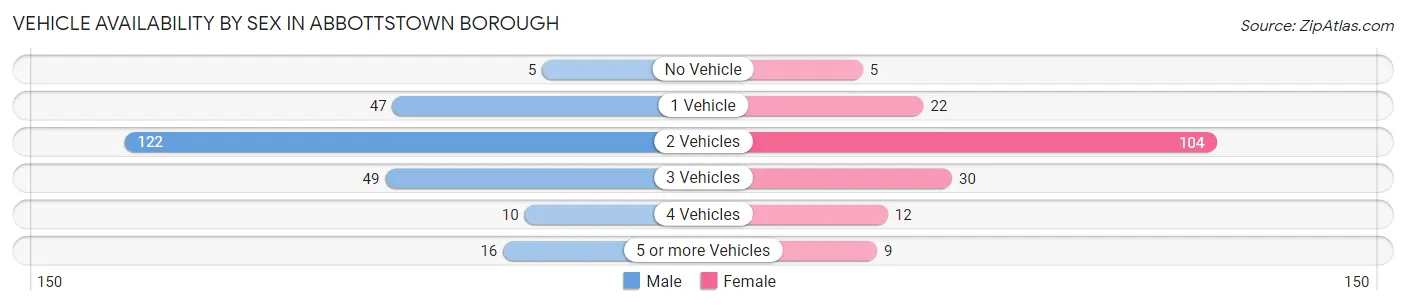
| Vehicles Available | Male | Female |
| No Vehicle | 5 (2.0%) | 5 (2.8%) |
| 1 Vehicle | 47 (18.9%) | 22 (12.1%) |
| 2 Vehicles | 122 (49.0%) | 104 (57.1%) |
| 3 Vehicles | 49 (19.7%) | 30 (16.5%) |
| 4 Vehicles | 10 (4.0%) | 12 (6.6%) |
| 5 or more Vehicles | 16 (6.4%) | 9 (5.0%) |
| Total | 249 (100.0%) | 182 (100.0%) |
Commute Time in Abbottstown borough
The most frequently occuring commute durations in Abbottstown borough are 10 to 14 minutes (88 commuters, 21.3%), 15 to 19 minutes (73 commuters, 17.7%), and less than 5 minutes (43 commuters, 10.4%).
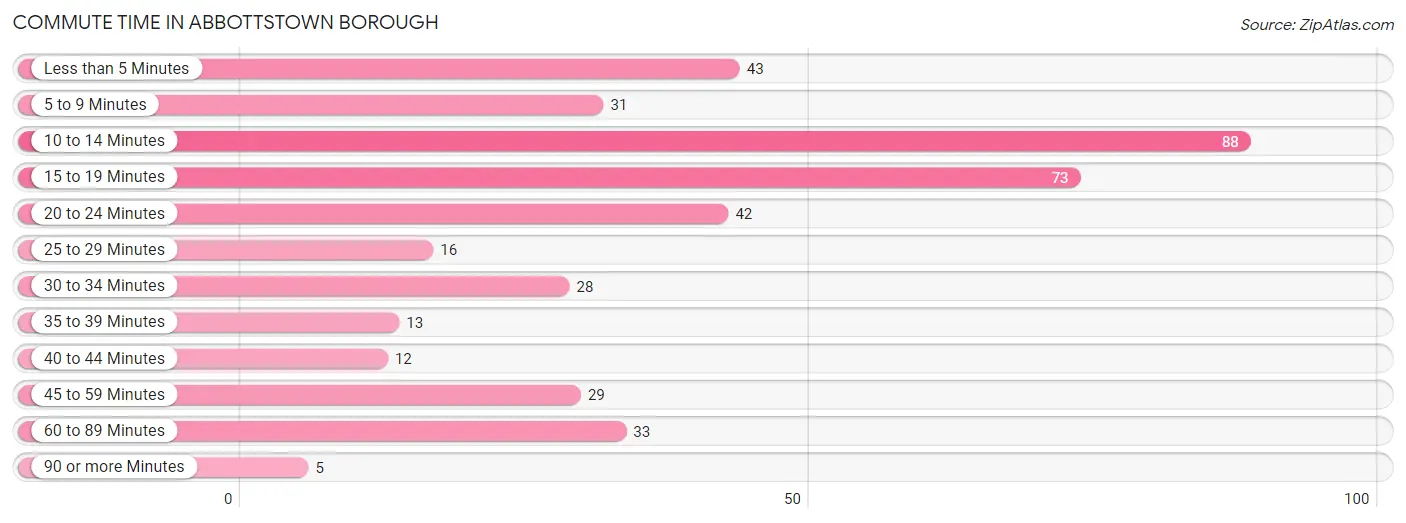
| Commute Time | # Commuters | % Commuters |
| Less than 5 Minutes | 43 | 10.4% |
| 5 to 9 Minutes | 31 | 7.5% |
| 10 to 14 Minutes | 88 | 21.3% |
| 15 to 19 Minutes | 73 | 17.7% |
| 20 to 24 Minutes | 42 | 10.2% |
| 25 to 29 Minutes | 16 | 3.9% |
| 30 to 34 Minutes | 28 | 6.8% |
| 35 to 39 Minutes | 13 | 3.2% |
| 40 to 44 Minutes | 12 | 2.9% |
| 45 to 59 Minutes | 29 | 7.0% |
| 60 to 89 Minutes | 33 | 8.0% |
| 90 or more Minutes | 5 | 1.2% |
Commute Time by Sex in Abbottstown borough
The most common commute times in Abbottstown borough are 15 to 19 minutes (45 commuters, 18.7%) for males and 10 to 14 minutes (47 commuters, 27.3%) for females.
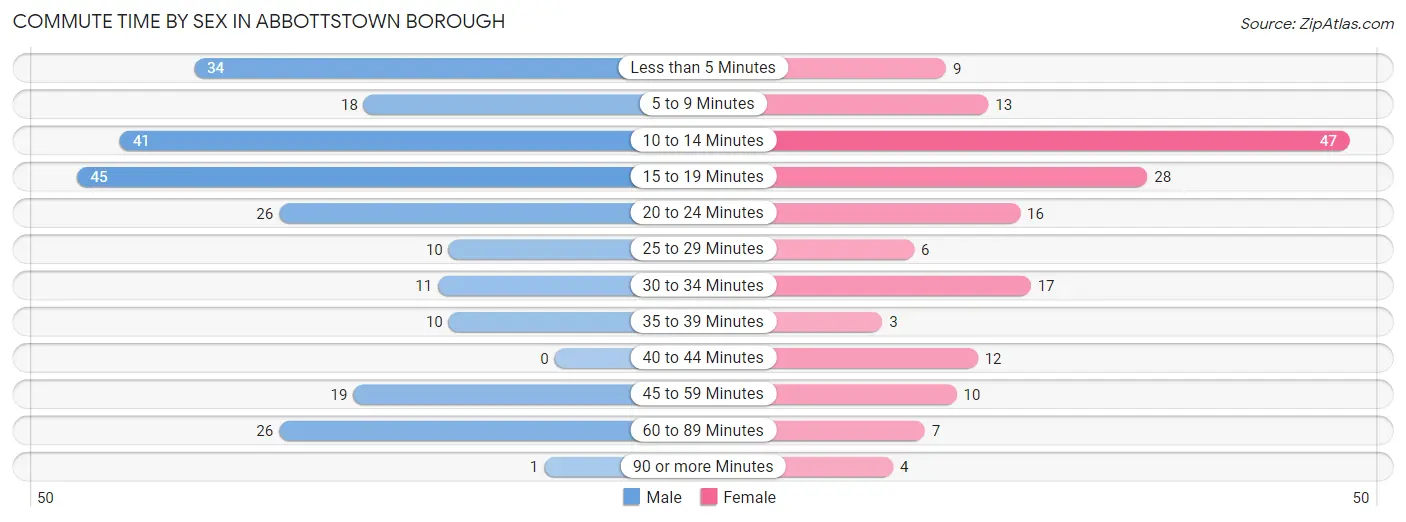
| Commute Time | Male | Female |
| Less than 5 Minutes | 34 (14.1%) | 9 (5.2%) |
| 5 to 9 Minutes | 18 (7.5%) | 13 (7.6%) |
| 10 to 14 Minutes | 41 (17.0%) | 47 (27.3%) |
| 15 to 19 Minutes | 45 (18.7%) | 28 (16.3%) |
| 20 to 24 Minutes | 26 (10.8%) | 16 (9.3%) |
| 25 to 29 Minutes | 10 (4.2%) | 6 (3.5%) |
| 30 to 34 Minutes | 11 (4.6%) | 17 (9.9%) |
| 35 to 39 Minutes | 10 (4.2%) | 3 (1.7%) |
| 40 to 44 Minutes | 0 (0.0%) | 12 (7.0%) |
| 45 to 59 Minutes | 19 (7.9%) | 10 (5.8%) |
| 60 to 89 Minutes | 26 (10.8%) | 7 (4.1%) |
| 90 or more Minutes | 1 (0.4%) | 4 (2.3%) |
Time of Departure to Work by Sex in Abbottstown borough
The most frequent times of departure to work in Abbottstown borough are 12:00 AM to 4:59 AM (40, 16.6%) for males and 5:30 AM to 5:59 AM (31, 18.0%) for females.
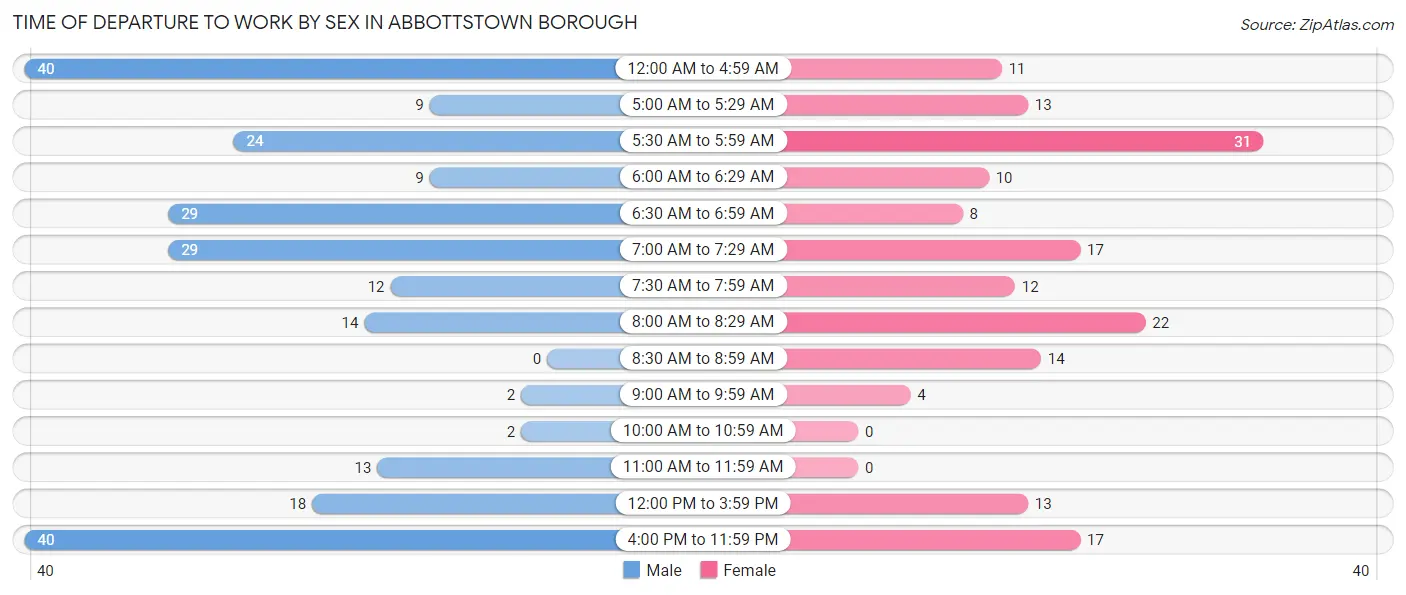
| Time of Departure | Male | Female |
| 12:00 AM to 4:59 AM | 40 (16.6%) | 11 (6.4%) |
| 5:00 AM to 5:29 AM | 9 (3.7%) | 13 (7.6%) |
| 5:30 AM to 5:59 AM | 24 (10.0%) | 31 (18.0%) |
| 6:00 AM to 6:29 AM | 9 (3.7%) | 10 (5.8%) |
| 6:30 AM to 6:59 AM | 29 (12.0%) | 8 (4.6%) |
| 7:00 AM to 7:29 AM | 29 (12.0%) | 17 (9.9%) |
| 7:30 AM to 7:59 AM | 12 (5.0%) | 12 (7.0%) |
| 8:00 AM to 8:29 AM | 14 (5.8%) | 22 (12.8%) |
| 8:30 AM to 8:59 AM | 0 (0.0%) | 14 (8.1%) |
| 9:00 AM to 9:59 AM | 2 (0.8%) | 4 (2.3%) |
| 10:00 AM to 10:59 AM | 2 (0.8%) | 0 (0.0%) |
| 11:00 AM to 11:59 AM | 13 (5.4%) | 0 (0.0%) |
| 12:00 PM to 3:59 PM | 18 (7.5%) | 13 (7.6%) |
| 4:00 PM to 11:59 PM | 40 (16.6%) | 17 (9.9%) |
| Total | 241 (100.0%) | 172 (100.0%) |
Housing Occupancy in Abbottstown borough
Occupancy by Ownership in Abbottstown borough
Of the total 304 dwellings in Abbottstown borough, owner-occupied units account for 211 (69.4%), while renter-occupied units make up 93 (30.6%).
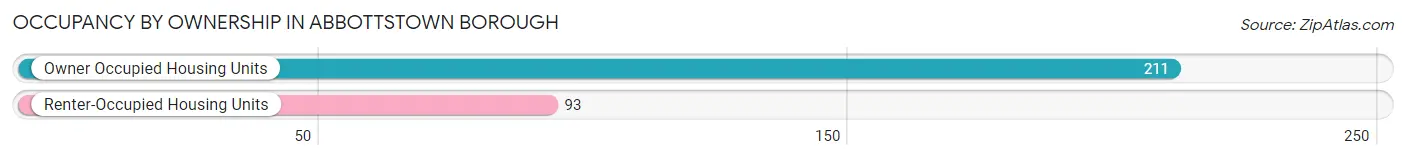
| Occupancy | # Housing Units | % Housing Units |
| Owner Occupied Housing Units | 211 | 69.4% |
| Renter-Occupied Housing Units | 93 | 30.6% |
| Total Occupied Housing Units | 304 | 100.0% |
Occupancy by Household Size in Abbottstown borough
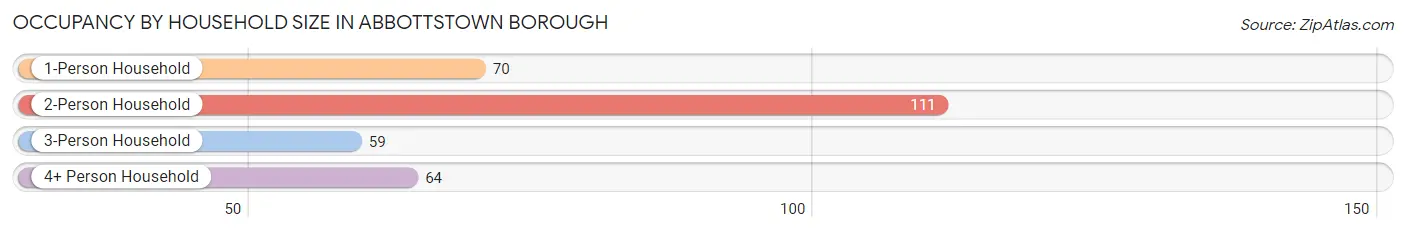
| Household Size | # Housing Units | % Housing Units |
| 1-Person Household | 70 | 23.0% |
| 2-Person Household | 111 | 36.5% |
| 3-Person Household | 59 | 19.4% |
| 4+ Person Household | 64 | 21.0% |
| Total Housing Units | 304 | 100.0% |
Occupancy by Ownership by Household Size in Abbottstown borough
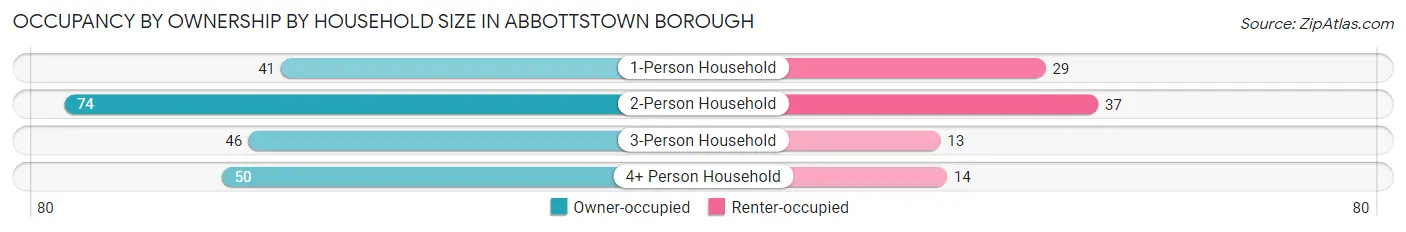
| Household Size | Owner-occupied | Renter-occupied |
| 1-Person Household | 41 (58.6%) | 29 (41.4%) |
| 2-Person Household | 74 (66.7%) | 37 (33.3%) |
| 3-Person Household | 46 (78.0%) | 13 (22.0%) |
| 4+ Person Household | 50 (78.1%) | 14 (21.9%) |
| Total Housing Units | 211 (69.4%) | 93 (30.6%) |
Occupancy by Educational Attainment in Abbottstown borough
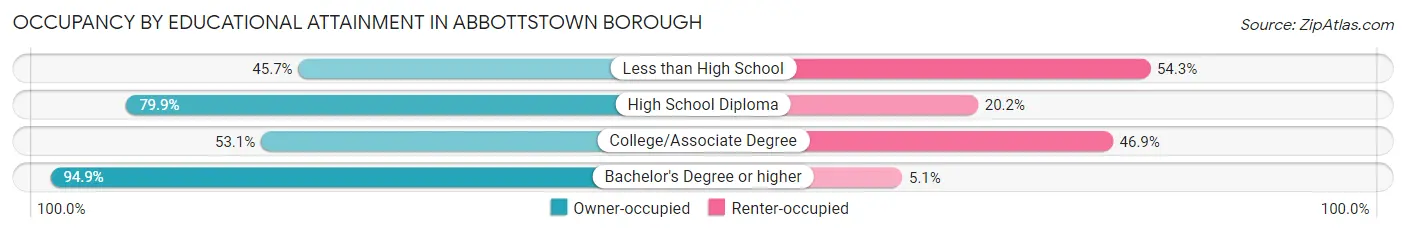
| Household Size | Owner-occupied | Renter-occupied |
| Less than High School | 16 (45.7%) | 19 (54.3%) |
| High School Diploma | 107 (79.8%) | 27 (20.2%) |
| College/Associate Degree | 51 (53.1%) | 45 (46.9%) |
| Bachelor's Degree or higher | 37 (94.9%) | 2 (5.1%) |
Occupancy by Age of Householder in Abbottstown borough
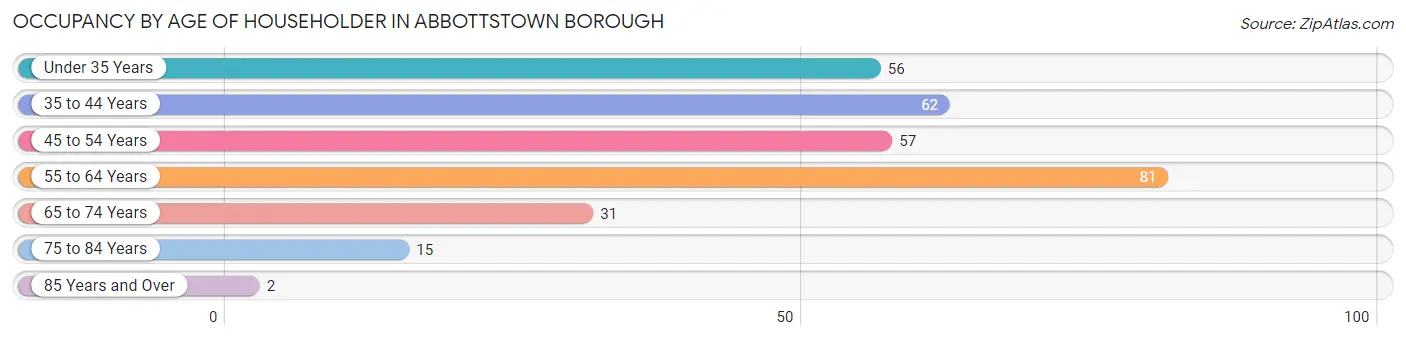
| Age Bracket | # Households | % Households |
| Under 35 Years | 56 | 18.4% |
| 35 to 44 Years | 62 | 20.4% |
| 45 to 54 Years | 57 | 18.8% |
| 55 to 64 Years | 81 | 26.6% |
| 65 to 74 Years | 31 | 10.2% |
| 75 to 84 Years | 15 | 4.9% |
| 85 Years and Over | 2 | 0.7% |
| Total | 304 | 100.0% |
Housing Finances in Abbottstown borough
Median Income by Occupancy in Abbottstown borough
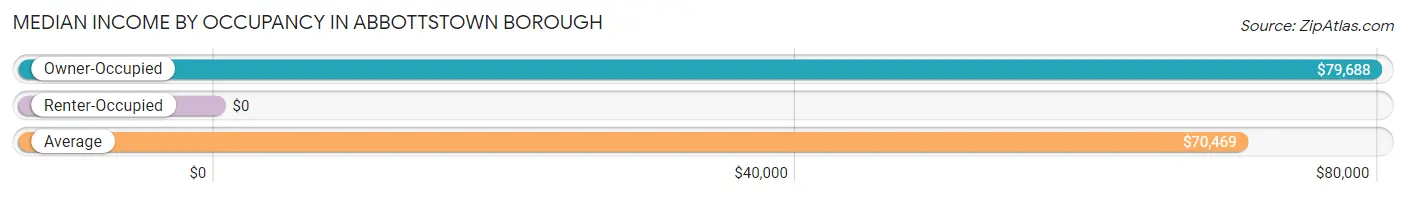
| Occupancy Type | # Households | Median Income |
| Owner-Occupied | 211 (69.4%) | $79,688 |
| Renter-Occupied | 93 (30.6%) | $0 |
| Average | 304 (100.0%) | $70,469 |
Occupancy by Householder Income Bracket in Abbottstown borough
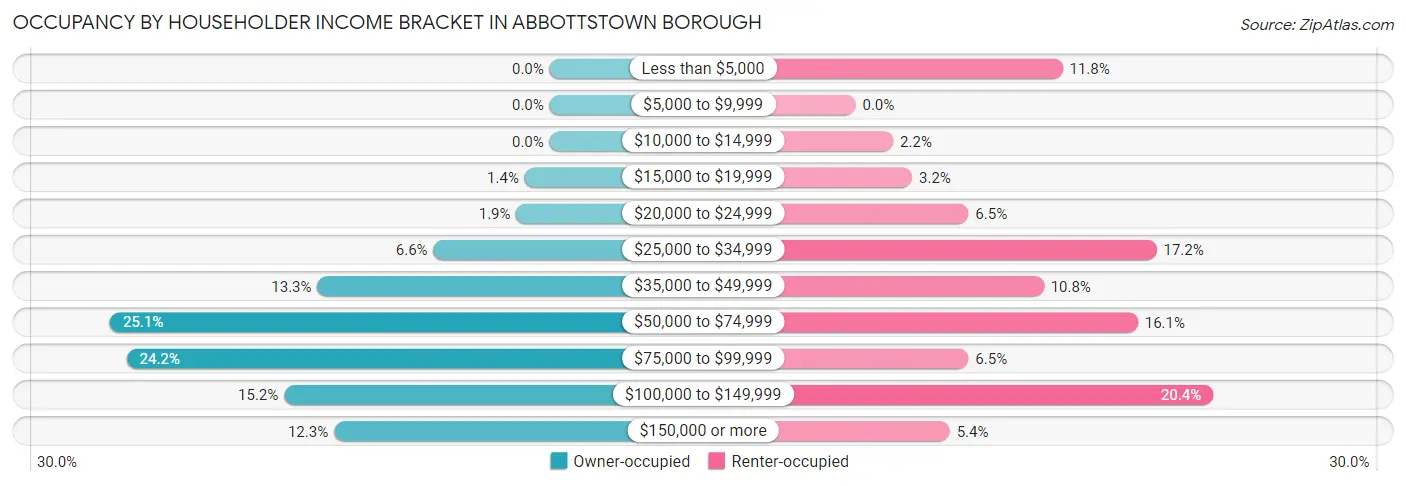
| Income Bracket | Owner-occupied | Renter-occupied |
| Less than $5,000 | 0 (0.0%) | 11 (11.8%) |
| $5,000 to $9,999 | 0 (0.0%) | 0 (0.0%) |
| $10,000 to $14,999 | 0 (0.0%) | 2 (2.1%) |
| $15,000 to $19,999 | 3 (1.4%) | 3 (3.2%) |
| $20,000 to $24,999 | 4 (1.9%) | 6 (6.5%) |
| $25,000 to $34,999 | 14 (6.6%) | 16 (17.2%) |
| $35,000 to $49,999 | 28 (13.3%) | 10 (10.7%) |
| $50,000 to $74,999 | 53 (25.1%) | 15 (16.1%) |
| $75,000 to $99,999 | 51 (24.2%) | 6 (6.5%) |
| $100,000 to $149,999 | 32 (15.2%) | 19 (20.4%) |
| $150,000 or more | 26 (12.3%) | 5 (5.4%) |
| Total | 211 (100.0%) | 93 (100.0%) |
Monthly Housing Cost Tiers in Abbottstown borough
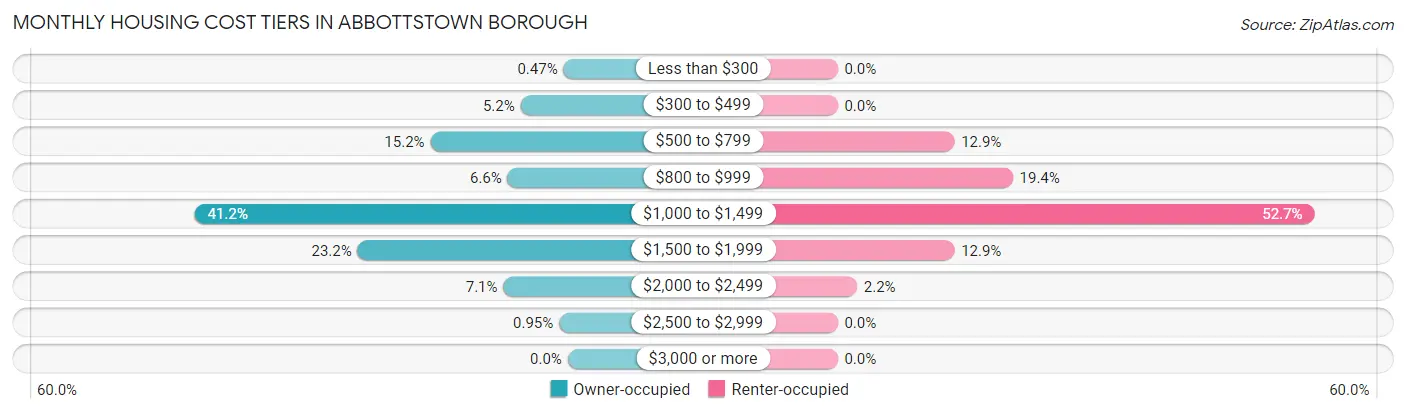
| Monthly Cost | Owner-occupied | Renter-occupied |
| Less than $300 | 1 (0.5%) | 0 (0.0%) |
| $300 to $499 | 11 (5.2%) | 0 (0.0%) |
| $500 to $799 | 32 (15.2%) | 12 (12.9%) |
| $800 to $999 | 14 (6.6%) | 18 (19.4%) |
| $1,000 to $1,499 | 87 (41.2%) | 49 (52.7%) |
| $1,500 to $1,999 | 49 (23.2%) | 12 (12.9%) |
| $2,000 to $2,499 | 15 (7.1%) | 2 (2.1%) |
| $2,500 to $2,999 | 2 (0.9%) | 0 (0.0%) |
| $3,000 or more | 0 (0.0%) | 0 (0.0%) |
| Total | 211 (100.0%) | 93 (100.0%) |
Physical Housing Characteristics in Abbottstown borough
Housing Structures in Abbottstown borough
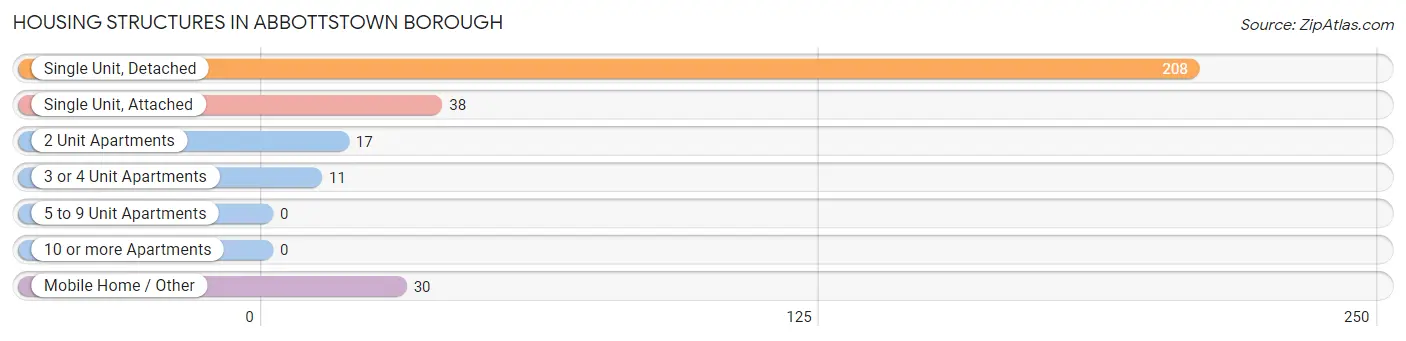
| Structure Type | # Housing Units | % Housing Units |
| Single Unit, Detached | 208 | 68.4% |
| Single Unit, Attached | 38 | 12.5% |
| 2 Unit Apartments | 17 | 5.6% |
| 3 or 4 Unit Apartments | 11 | 3.6% |
| 5 to 9 Unit Apartments | 0 | 0.0% |
| 10 or more Apartments | 0 | 0.0% |
| Mobile Home / Other | 30 | 9.9% |
| Total | 304 | 100.0% |
Housing Structures by Occupancy in Abbottstown borough
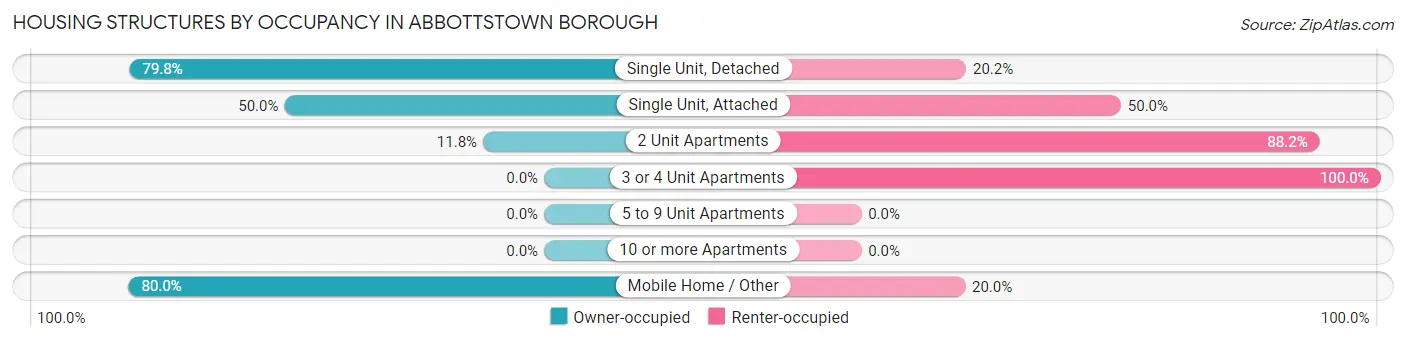
| Structure Type | Owner-occupied | Renter-occupied |
| Single Unit, Detached | 166 (79.8%) | 42 (20.2%) |
| Single Unit, Attached | 19 (50.0%) | 19 (50.0%) |
| 2 Unit Apartments | 2 (11.8%) | 15 (88.2%) |
| 3 or 4 Unit Apartments | 0 (0.0%) | 11 (100.0%) |
| 5 to 9 Unit Apartments | 0 (0.0%) | 0 (0.0%) |
| 10 or more Apartments | 0 (0.0%) | 0 (0.0%) |
| Mobile Home / Other | 24 (80.0%) | 6 (20.0%) |
| Total | 211 (69.4%) | 93 (30.6%) |
Housing Structures by Number of Rooms in Abbottstown borough
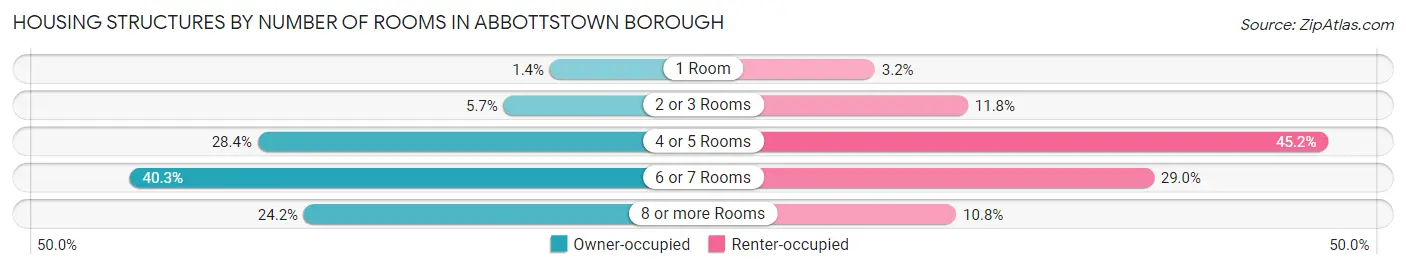
| Number of Rooms | Owner-occupied | Renter-occupied |
| 1 Room | 3 (1.4%) | 3 (3.2%) |
| 2 or 3 Rooms | 12 (5.7%) | 11 (11.8%) |
| 4 or 5 Rooms | 60 (28.4%) | 42 (45.2%) |
| 6 or 7 Rooms | 85 (40.3%) | 27 (29.0%) |
| 8 or more Rooms | 51 (24.2%) | 10 (10.7%) |
| Total | 211 (100.0%) | 93 (100.0%) |
Housing Structure by Heating Type in Abbottstown borough
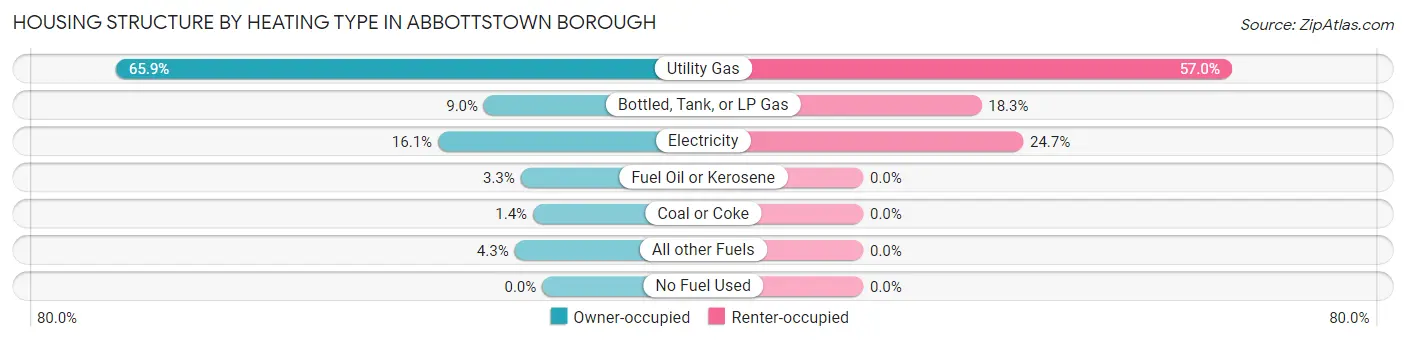
| Heating Type | Owner-occupied | Renter-occupied |
| Utility Gas | 139 (65.9%) | 53 (57.0%) |
| Bottled, Tank, or LP Gas | 19 (9.0%) | 17 (18.3%) |
| Electricity | 34 (16.1%) | 23 (24.7%) |
| Fuel Oil or Kerosene | 7 (3.3%) | 0 (0.0%) |
| Coal or Coke | 3 (1.4%) | 0 (0.0%) |
| All other Fuels | 9 (4.3%) | 0 (0.0%) |
| No Fuel Used | 0 (0.0%) | 0 (0.0%) |
| Total | 211 (100.0%) | 93 (100.0%) |
Household Vehicle Usage in Abbottstown borough
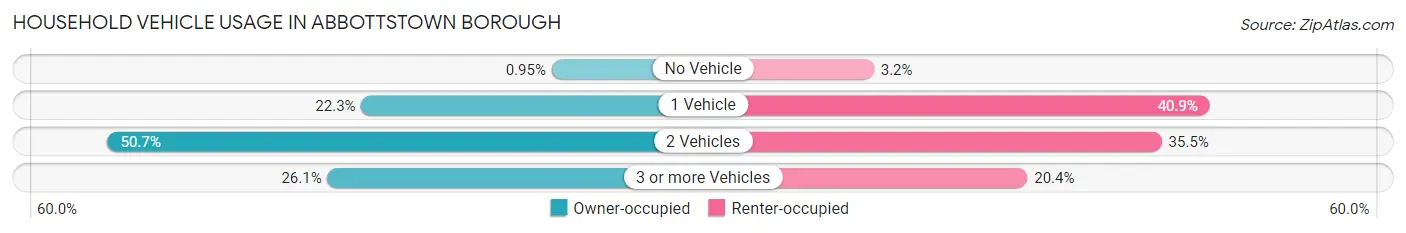
| Vehicles per Household | Owner-occupied | Renter-occupied |
| No Vehicle | 2 (0.9%) | 3 (3.2%) |
| 1 Vehicle | 47 (22.3%) | 38 (40.9%) |
| 2 Vehicles | 107 (50.7%) | 33 (35.5%) |
| 3 or more Vehicles | 55 (26.1%) | 19 (20.4%) |
| Total | 211 (100.0%) | 93 (100.0%) |
Real Estate & Mortgages in Abbottstown borough
Real Estate and Mortgage Overview in Abbottstown borough
| Characteristic | Without Mortgage | With Mortgage |
| Housing Units | 54 | 157 |
| Median Property Value | $150,000 | $178,800 |
| Median Household Income | $63,333 | $26 |
| Monthly Housing Costs | $658 | $0 |
| Real Estate Taxes | $2,267 | $0 |
Property Value by Mortgage Status in Abbottstown borough
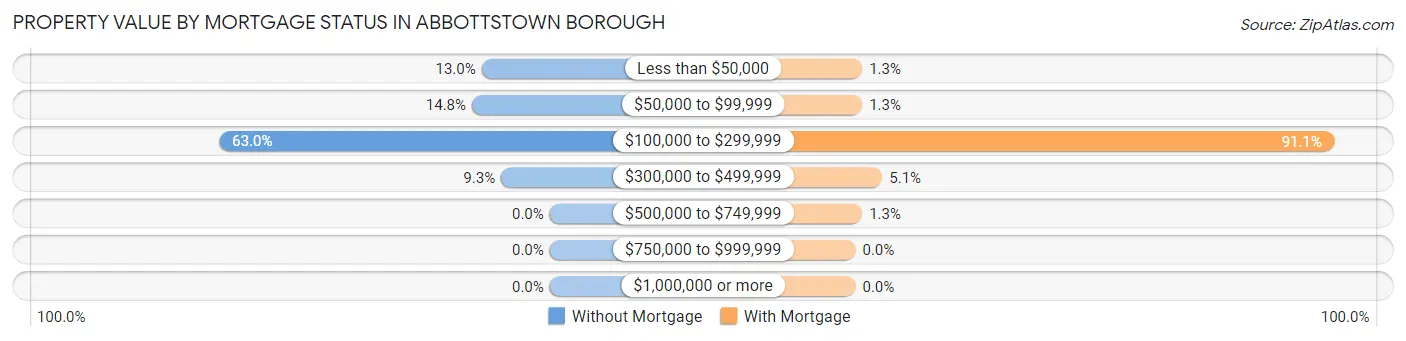
| Property Value | Without Mortgage | With Mortgage |
| Less than $50,000 | 7 (13.0%) | 2 (1.3%) |
| $50,000 to $99,999 | 8 (14.8%) | 2 (1.3%) |
| $100,000 to $299,999 | 34 (63.0%) | 143 (91.1%) |
| $300,000 to $499,999 | 5 (9.3%) | 8 (5.1%) |
| $500,000 to $749,999 | 0 (0.0%) | 2 (1.3%) |
| $750,000 to $999,999 | 0 (0.0%) | 0 (0.0%) |
| $1,000,000 or more | 0 (0.0%) | 0 (0.0%) |
| Total | 54 (100.0%) | 157 (100.0%) |
Household Income by Mortgage Status in Abbottstown borough
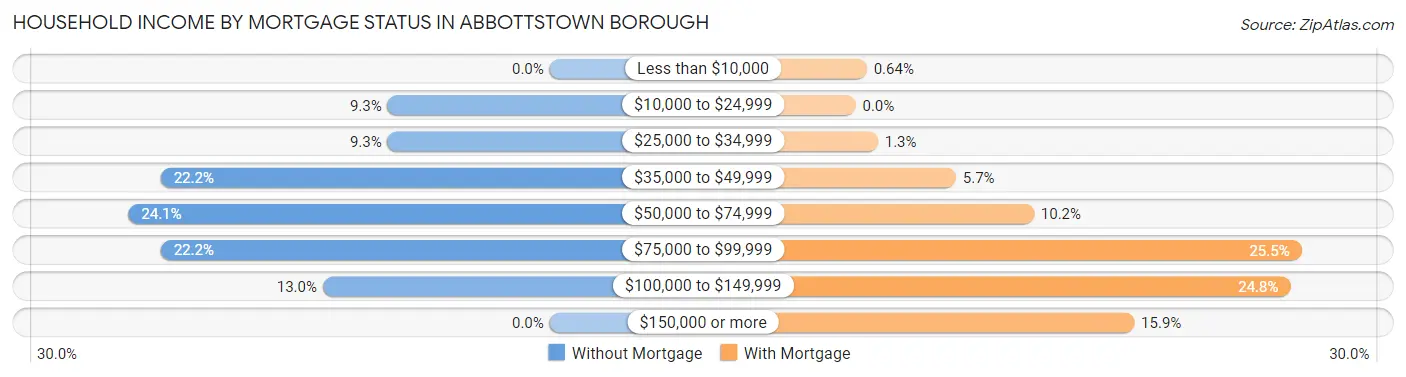
| Household Income | Without Mortgage | With Mortgage |
| Less than $10,000 | 0 (0.0%) | 1 (0.6%) |
| $10,000 to $24,999 | 5 (9.3%) | 0 (0.0%) |
| $25,000 to $34,999 | 5 (9.3%) | 2 (1.3%) |
| $35,000 to $49,999 | 12 (22.2%) | 9 (5.7%) |
| $50,000 to $74,999 | 13 (24.1%) | 16 (10.2%) |
| $75,000 to $99,999 | 12 (22.2%) | 40 (25.5%) |
| $100,000 to $149,999 | 7 (13.0%) | 39 (24.8%) |
| $150,000 or more | 0 (0.0%) | 25 (15.9%) |
| Total | 54 (100.0%) | 157 (100.0%) |
Property Value to Household Income Ratio in Abbottstown borough
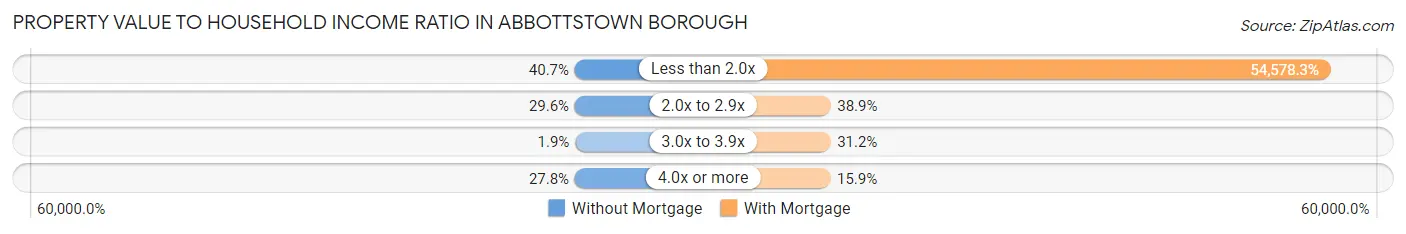
| Value-to-Income Ratio | Without Mortgage | With Mortgage |
| Less than 2.0x | 22 (40.7%) | 85,688 (54,578.3%) |
| 2.0x to 2.9x | 16 (29.6%) | 61 (38.9%) |
| 3.0x to 3.9x | 1 (1.8%) | 49 (31.2%) |
| 4.0x or more | 15 (27.8%) | 25 (15.9%) |
| Total | 54 (100.0%) | 157 (100.0%) |
Real Estate Taxes by Mortgage Status in Abbottstown borough
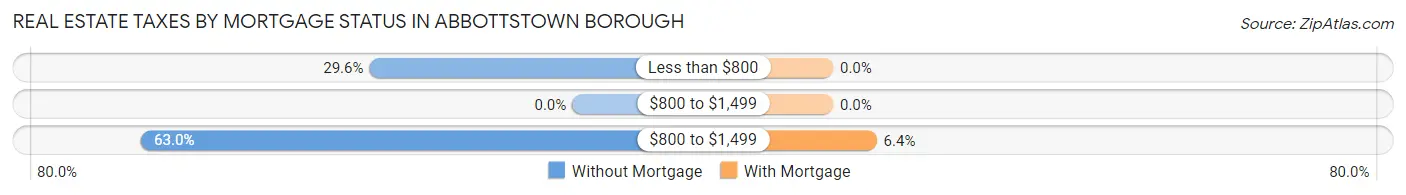
| Property Taxes | Without Mortgage | With Mortgage |
| Less than $800 | 16 (29.6%) | 0 (0.0%) |
| $800 to $1,499 | 0 (0.0%) | 0 (0.0%) |
| $800 to $1,499 | 34 (63.0%) | 10 (6.4%) |
| Total | 54 (100.0%) | 157 (100.0%) |
Health & Disability in Abbottstown borough
Health Insurance Coverage by Age in Abbottstown borough
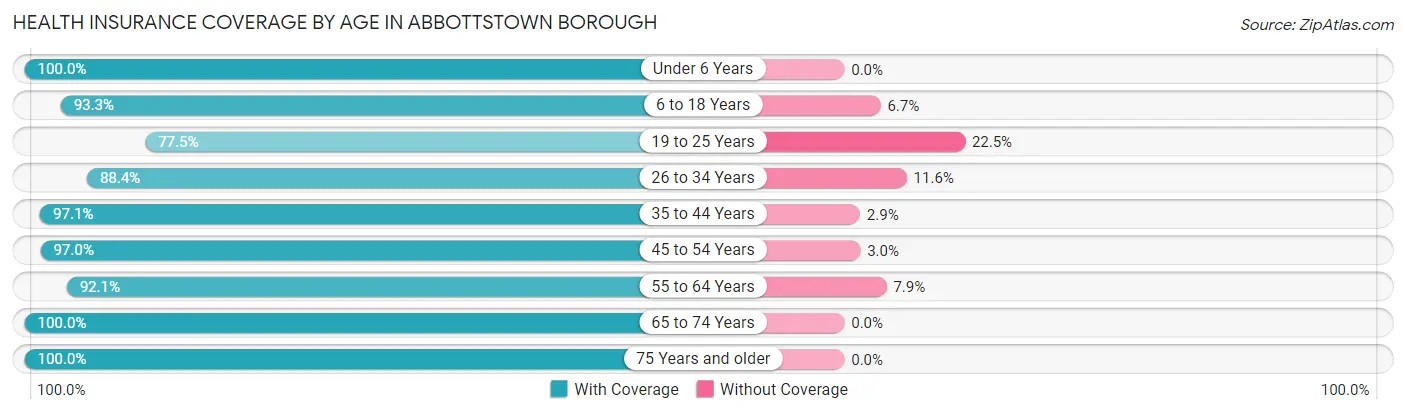
| Age Bracket | With Coverage | Without Coverage |
| Under 6 Years | 76 (100.0%) | 0 (0.0%) |
| 6 to 18 Years | 166 (93.3%) | 12 (6.7%) |
| 19 to 25 Years | 62 (77.5%) | 18 (22.5%) |
| 26 to 34 Years | 76 (88.4%) | 10 (11.6%) |
| 35 to 44 Years | 100 (97.1%) | 3 (2.9%) |
| 45 to 54 Years | 98 (97.0%) | 3 (3.0%) |
| 55 to 64 Years | 129 (92.1%) | 11 (7.9%) |
| 65 to 74 Years | 55 (100.0%) | 0 (0.0%) |
| 75 Years and older | 31 (100.0%) | 0 (0.0%) |
| Total | 793 (93.3%) | 57 (6.7%) |
Health Insurance Coverage by Citizenship Status in Abbottstown borough
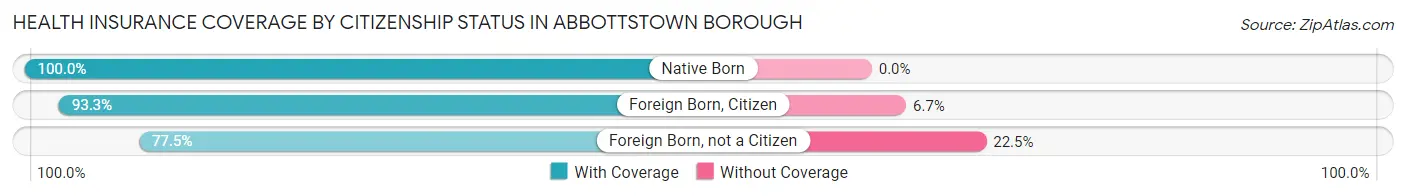
| Citizenship Status | With Coverage | Without Coverage |
| Native Born | 76 (100.0%) | 0 (0.0%) |
| Foreign Born, Citizen | 166 (93.3%) | 12 (6.7%) |
| Foreign Born, not a Citizen | 62 (77.5%) | 18 (22.5%) |
Health Insurance Coverage by Household Income in Abbottstown borough
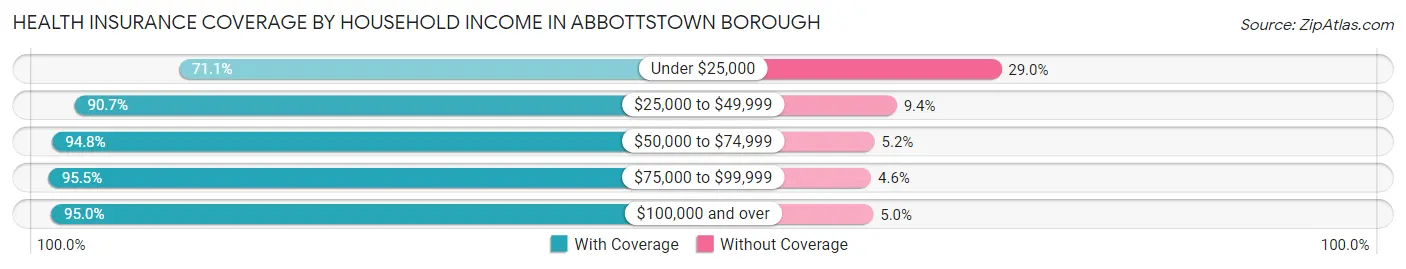
| Household Income | With Coverage | Without Coverage |
| Under $25,000 | 27 (71.1%) | 11 (28.9%) |
| $25,000 to $49,999 | 126 (90.6%) | 13 (9.3%) |
| $50,000 to $74,999 | 182 (94.8%) | 10 (5.2%) |
| $75,000 to $99,999 | 189 (95.5%) | 9 (4.5%) |
| $100,000 and over | 268 (95.0%) | 14 (5.0%) |
Public vs Private Health Insurance Coverage by Age in Abbottstown borough
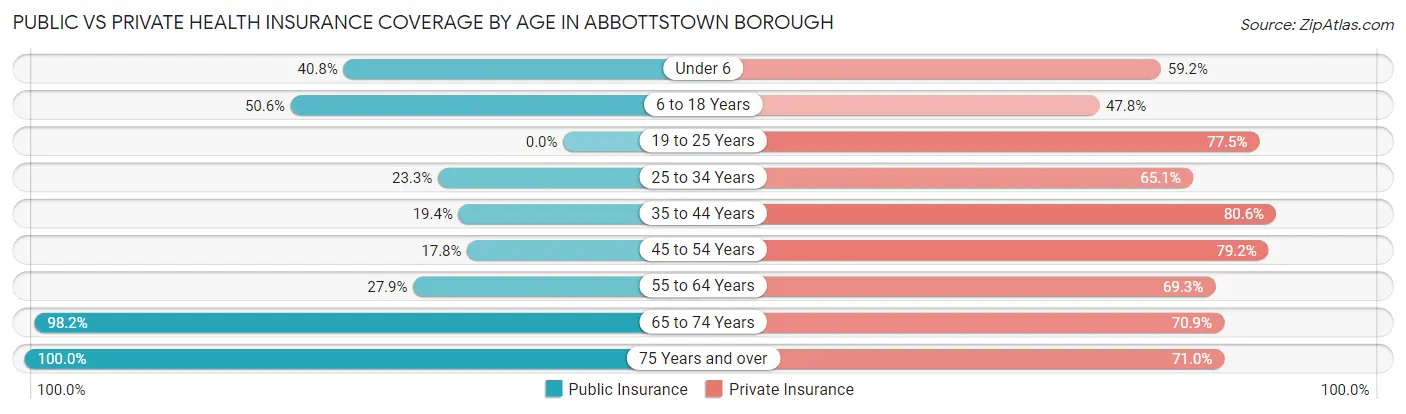
| Age Bracket | Public Insurance | Private Insurance |
| Under 6 | 31 (40.8%) | 45 (59.2%) |
| 6 to 18 Years | 90 (50.6%) | 85 (47.7%) |
| 19 to 25 Years | 0 (0.0%) | 62 (77.5%) |
| 25 to 34 Years | 20 (23.3%) | 56 (65.1%) |
| 35 to 44 Years | 20 (19.4%) | 83 (80.6%) |
| 45 to 54 Years | 18 (17.8%) | 80 (79.2%) |
| 55 to 64 Years | 39 (27.9%) | 97 (69.3%) |
| 65 to 74 Years | 54 (98.2%) | 39 (70.9%) |
| 75 Years and over | 31 (100.0%) | 22 (71.0%) |
| Total | 303 (35.6%) | 569 (66.9%) |
Disability Status by Sex by Age in Abbottstown borough
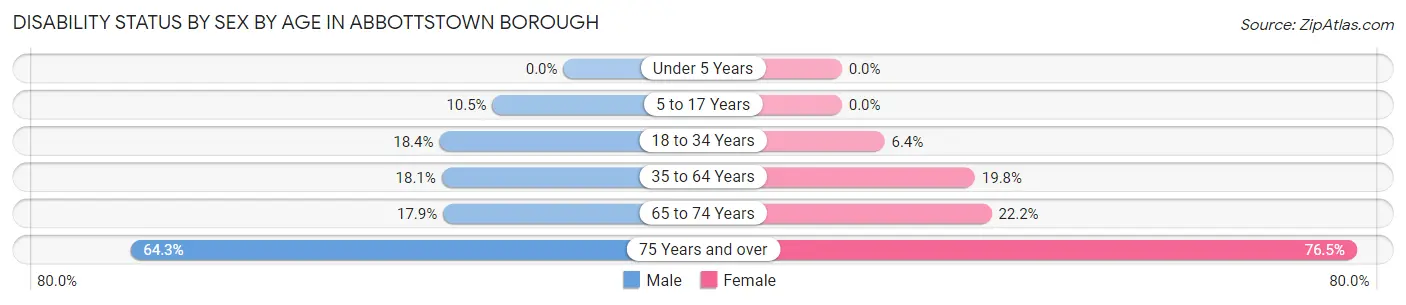
| Age Bracket | Male | Female |
| Under 5 Years | 0 (0.0%) | 0 (0.0%) |
| 5 to 17 Years | 10 (10.5%) | 0 (0.0%) |
| 18 to 34 Years | 21 (18.4%) | 4 (6.4%) |
| 35 to 64 Years | 32 (18.1%) | 33 (19.8%) |
| 65 to 74 Years | 5 (17.9%) | 6 (22.2%) |
| 75 Years and over | 9 (64.3%) | 13 (76.5%) |
Disability Class by Sex by Age in Abbottstown borough
Disability Class: Hearing Difficulty
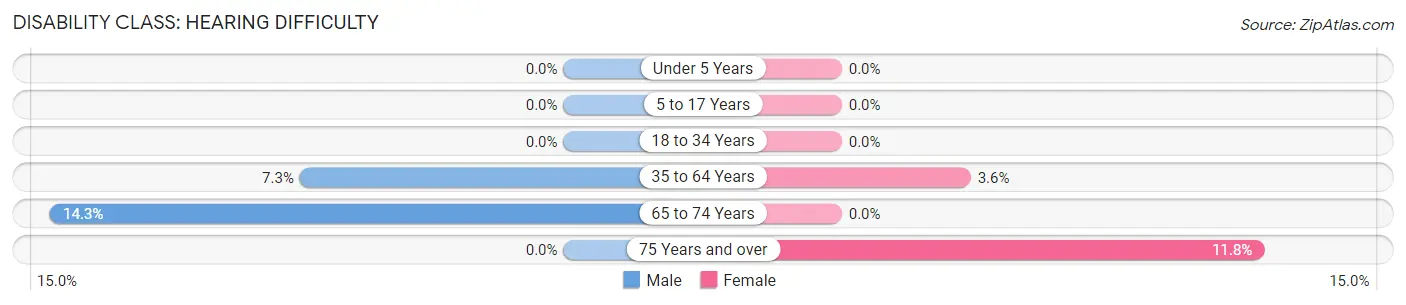
| Age Bracket | Male | Female |
| Under 5 Years | 0 (0.0%) | 0 (0.0%) |
| 5 to 17 Years | 0 (0.0%) | 0 (0.0%) |
| 18 to 34 Years | 0 (0.0%) | 0 (0.0%) |
| 35 to 64 Years | 13 (7.3%) | 6 (3.6%) |
| 65 to 74 Years | 4 (14.3%) | 0 (0.0%) |
| 75 Years and over | 0 (0.0%) | 2 (11.8%) |
Disability Class: Vision Difficulty
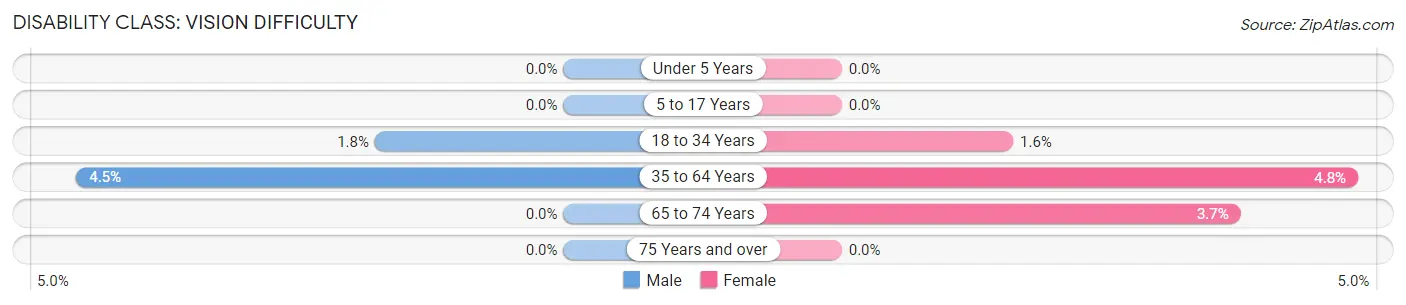
| Age Bracket | Male | Female |
| Under 5 Years | 0 (0.0%) | 0 (0.0%) |
| 5 to 17 Years | 0 (0.0%) | 0 (0.0%) |
| 18 to 34 Years | 2 (1.8%) | 1 (1.6%) |
| 35 to 64 Years | 8 (4.5%) | 8 (4.8%) |
| 65 to 74 Years | 0 (0.0%) | 1 (3.7%) |
| 75 Years and over | 0 (0.0%) | 0 (0.0%) |
Disability Class: Cognitive Difficulty
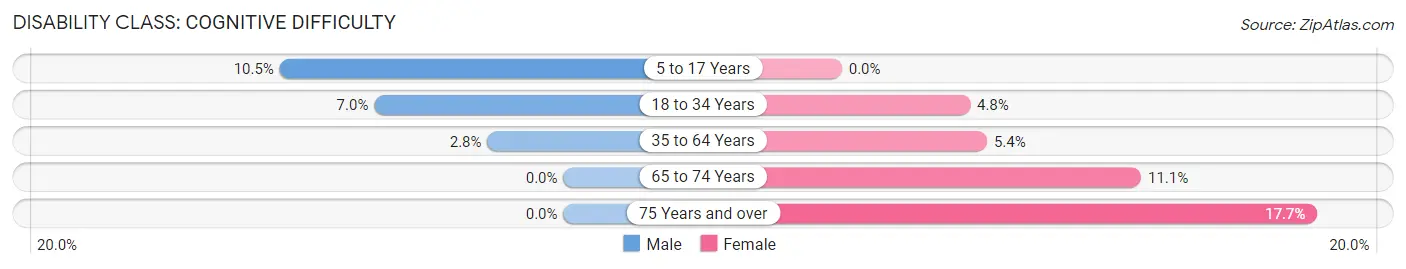
| Age Bracket | Male | Female |
| 5 to 17 Years | 10 (10.5%) | 0 (0.0%) |
| 18 to 34 Years | 8 (7.0%) | 3 (4.8%) |
| 35 to 64 Years | 5 (2.8%) | 9 (5.4%) |
| 65 to 74 Years | 0 (0.0%) | 3 (11.1%) |
| 75 Years and over | 0 (0.0%) | 3 (17.6%) |
Disability Class: Ambulatory Difficulty
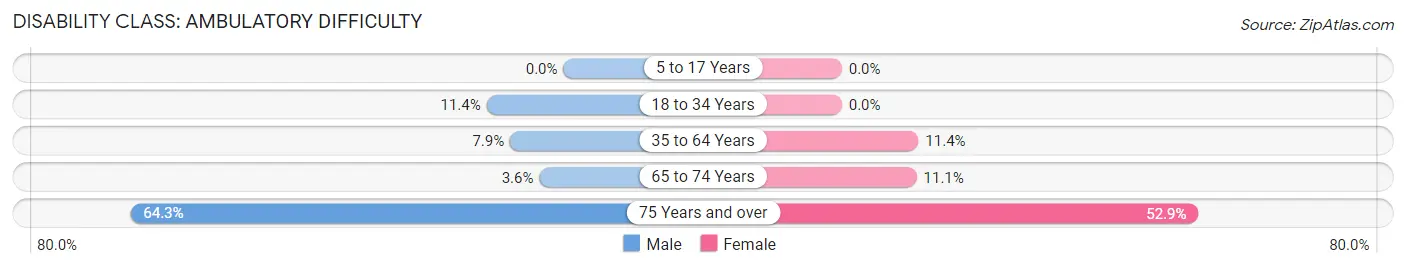
| Age Bracket | Male | Female |
| 5 to 17 Years | 0 (0.0%) | 0 (0.0%) |
| 18 to 34 Years | 13 (11.4%) | 0 (0.0%) |
| 35 to 64 Years | 14 (7.9%) | 19 (11.4%) |
| 65 to 74 Years | 1 (3.6%) | 3 (11.1%) |
| 75 Years and over | 9 (64.3%) | 9 (52.9%) |
Disability Class: Self-Care Difficulty
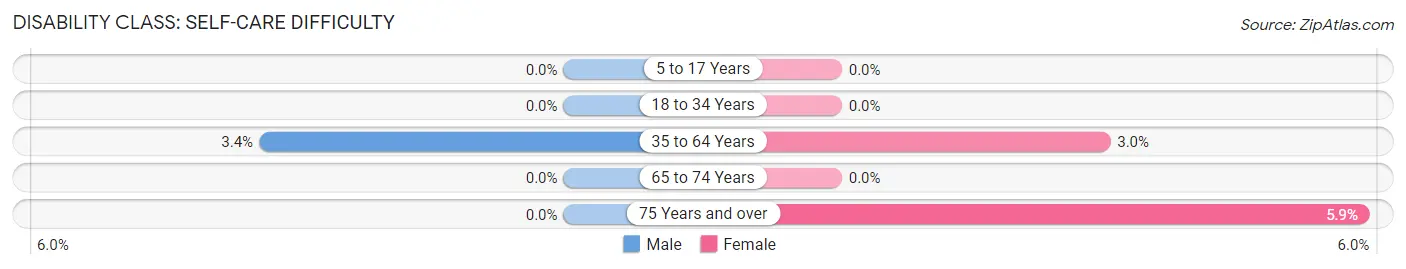
| Age Bracket | Male | Female |
| 5 to 17 Years | 0 (0.0%) | 0 (0.0%) |
| 18 to 34 Years | 0 (0.0%) | 0 (0.0%) |
| 35 to 64 Years | 6 (3.4%) | 5 (3.0%) |
| 65 to 74 Years | 0 (0.0%) | 0 (0.0%) |
| 75 Years and over | 0 (0.0%) | 1 (5.9%) |
Technology Access in Abbottstown borough
Computing Device Access in Abbottstown borough
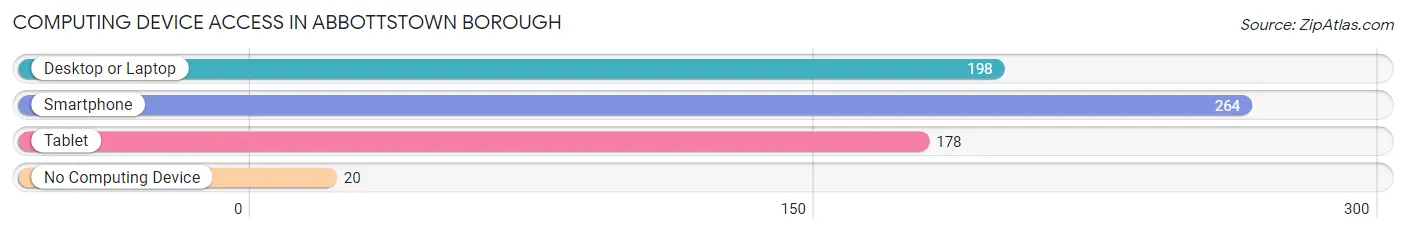
| Device Type | # Households | % Households |
| Desktop or Laptop | 198 | 65.1% |
| Smartphone | 264 | 86.8% |
| Tablet | 178 | 58.6% |
| No Computing Device | 20 | 6.6% |
| Total | 304 | 100.0% |
Internet Access in Abbottstown borough
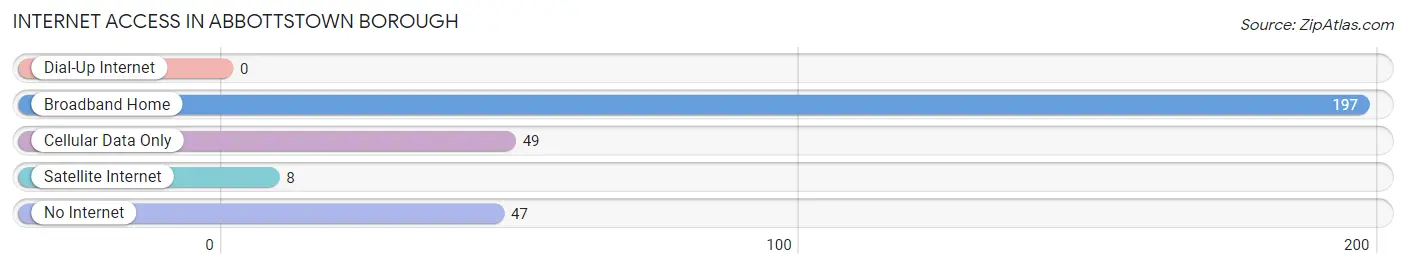
| Internet Type | # Households | % Households |
| Dial-Up Internet | 0 | 0.0% |
| Broadband Home | 197 | 64.8% |
| Cellular Data Only | 49 | 16.1% |
| Satellite Internet | 8 | 2.6% |
| No Internet | 47 | 15.5% |
| Total | 304 | 100.0% |
Abbottstown borough Summary
Abbottstown Borough is a small borough located in Adams County, Pennsylvania. It is situated in the south-central part of the state, approximately 20 miles west of the state capital of Harrisburg. The borough is home to a population of approximately 1,000 people, and is part of the larger Gettysburg metropolitan area.
History
Abbottstown Borough was founded in 1814 by John Abbott, a local landowner. The borough was named after him, and was incorporated in 1845. The borough was originally a farming community, and the main industry was the production of grain and livestock. In the late 19th century, the borough began to develop into a small industrial center, with several factories and mills being established. The borough also became a popular tourist destination, with several hotels and resorts being built in the area.
Geography
Abbottstown Borough is located in south-central Pennsylvania, approximately 20 miles west of the state capital of Harrisburg. The borough is situated in the Appalachian Mountains, and is surrounded by rolling hills and forests. The borough is located on the banks of the Conewago Creek, which flows through the borough and is a popular spot for fishing and other recreational activities.
The borough has a total area of 1.2 square miles, all of which is land. The borough is located in a humid continental climate zone, with hot summers and cold winters. The average annual temperature is around 50 degrees Fahrenheit, and the average annual precipitation is around 40 inches.
Economy
The economy of Abbottstown Borough is largely based on tourism and agriculture. The borough is home to several tourist attractions, including the Gettysburg National Military Park, the Gettysburg National Cemetery, and the Gettysburg Battlefield. The borough also has several wineries and breweries, as well as several restaurants and shops.
Agriculture is also an important part of the local economy. The borough is home to several farms, which produce a variety of crops, including corn, soybeans, wheat, and hay. Livestock is also raised in the area, including cattle, sheep, and pigs.
Demographics
As of the 2010 census, the population of Abbottstown Borough was 1,000, with a population density of 830 people per square mile. The median age of the population was 43.7 years, and the median household income was $50,000. The racial makeup of the borough was 97.2% White, 0.7% African American, 0.3% Native American, 0.3% Asian, and 1.5% from other races.
The majority of the population (90.2%) was born in the United States, and the largest ancestry groups were German (37.2%), Irish (17.2%), and English (14.2%). The majority of the population (90.2%) spoke English as their primary language, and the other most common languages spoken were Spanish (3.2%) and German (2.2%).
The majority of the population (90.2%) identified as Christian, with the largest denominations being Catholic (37.2%), Lutheran (17.2%), and Methodist (14.2%). The median household income was $50,000, and the median value of owner-occupied housing units was $150,000. The per capita income was $25,000.
Common Questions
What is Per Capita Income in Abbottstown borough?
Per Capita income in Abbottstown borough is $29,785.
What is the Median Family Income in Abbottstown borough?
Median Family Income in Abbottstown borough is $85,438.
What is the Median Household income in Abbottstown borough?
Median Household Income in Abbottstown borough is $70,469.
What is Income or Wage Gap in Abbottstown borough?
Income or Wage Gap in Abbottstown borough is 30.4%.
Women in Abbottstown borough earn 69.6 cents for every dollar earned by a man.
What is Inequality or Gini Index in Abbottstown borough?
Inequality or Gini Index in Abbottstown borough is 0.36.
What is the Total Population of Abbottstown borough?
Total Population of Abbottstown borough is 850.
What is the Total Male Population of Abbottstown borough?
Total Male Population of Abbottstown borough is 445.
What is the Total Female Population of Abbottstown borough?
Total Female Population of Abbottstown borough is 405.
What is the Ratio of Males per 100 Females in Abbottstown borough?
There are 109.88 Males per 100 Females in Abbottstown borough.
What is the Ratio of Females per 100 Males in Abbottstown borough?
There are 91.01 Females per 100 Males in Abbottstown borough.
What is the Median Population Age in Abbottstown borough?
Median Population Age in Abbottstown borough is 36.7 Years.
What is the Average Family Size in Abbottstown borough
Average Family Size in Abbottstown borough is 3.4 People.
What is the Average Household Size in Abbottstown borough
Average Household Size in Abbottstown borough is 2.8 People.
How Large is the Labor Force in Abbottstown borough?
There are 467 People in the Labor Forcein in Abbottstown borough.
What is the Percentage of People in the Labor Force in Abbottstown borough?
74.0% of People are in the Labor Force in Abbottstown borough.
What is the Unemployment Rate in Abbottstown borough?
Unemployment Rate in Abbottstown borough is 3.6%.