Cities with the Highest Percentage of Population Employed in Administrative & Support Services in Utah
RELATED REPORTS & OPTIONS
Administrative & Support Services
Utah
Compare Cities
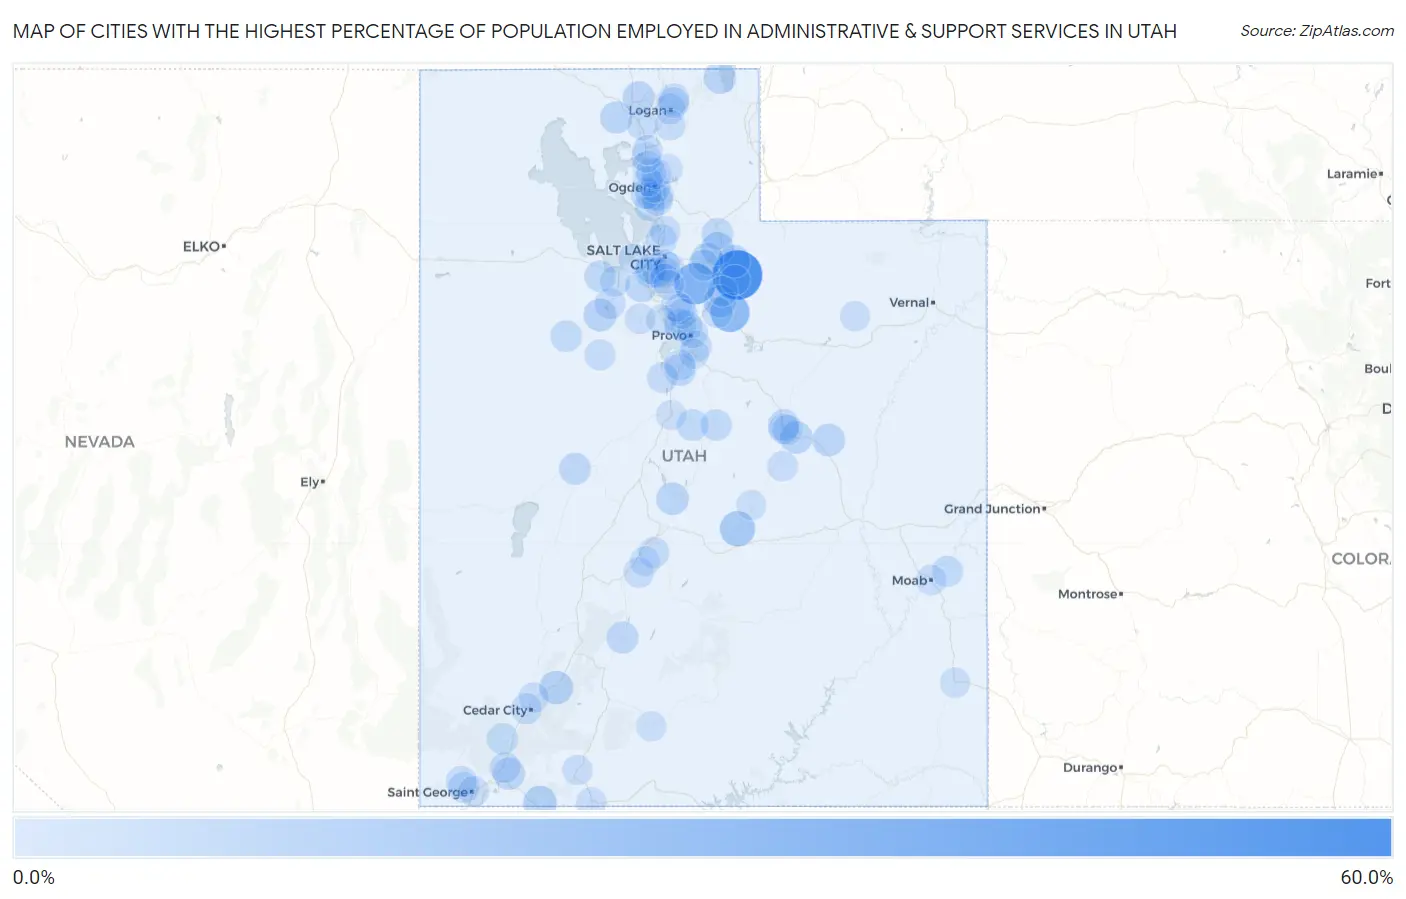
Map of Cities with the Highest Percentage of Population Employed in Administrative & Support Services in Utah
0.0%
60.0%
Cities with the Highest Percentage of Population Employed in Administrative & Support Services in Utah
| City | % Employed | vs State | vs National | |
| 1. | Samak | 51.2% | 4.3%(+46.9)#1 | 4.1%(+47.0)#54 |
| 2. | Alta | 30.6% | 4.3%(+26.3)#2 | 4.1%(+26.4)#176 |
| 3. | Independence | 25.0% | 4.3%(+20.7)#3 | 4.1%(+20.9)#280 |
| 4. | Emery | 16.0% | 4.3%(+11.7)#4 | 4.1%(+11.9)#685 |
| 5. | Parowan | 11.7% | 4.3%(+7.39)#5 | 4.1%(+7.53)#1,382 |
| 6. | Hildale | 11.6% | 4.3%(+7.35)#6 | 4.1%(+7.50)#1,396 |
| 7. | Wanship | 10.9% | 4.3%(+6.65)#7 | 4.1%(+6.79)#1,575 |
| 8. | Oakley | 10.6% | 4.3%(+6.31)#8 | 4.1%(+6.45)#1,668 |
| 9. | Rush Valley | 10.4% | 4.3%(+6.15)#9 | 4.1%(+6.29)#1,724 |
| 10. | Daniel | 9.9% | 4.3%(+5.65)#10 | 4.1%(+5.79)#1,937 |
| 11. | East Carbon | 9.9% | 4.3%(+5.58)#11 | 4.1%(+5.72)#1,962 |
| 12. | Centerfield | 9.8% | 4.3%(+5.55)#12 | 4.1%(+5.69)#1,974 |
| 13. | Garden City | 9.4% | 4.3%(+5.14)#13 | 4.1%(+5.28)#2,150 |
| 14. | Wellington | 9.4% | 4.3%(+5.12)#14 | 4.1%(+5.26)#2,160 |
| 15. | Thatcher | 9.2% | 4.3%(+4.88)#15 | 4.1%(+5.03)#2,275 |
| 16. | Brighton | 9.0% | 4.3%(+4.70)#16 | 4.1%(+4.84)#2,380 |
| 17. | Fielding | 8.9% | 4.3%(+4.62)#17 | 4.1%(+4.76)#2,422 |
| 18. | La Verkin | 8.8% | 4.3%(+4.54)#18 | 4.1%(+4.68)#2,479 |
| 19. | Silver Summit | 8.6% | 4.3%(+4.29)#19 | 4.1%(+4.43)#2,630 |
| 20. | Hinckley | 8.4% | 4.3%(+4.08)#20 | 4.1%(+4.22)#2,752 |
| 21. | Riverdale | 8.3% | 4.3%(+4.05)#21 | 4.1%(+4.19)#2,769 |
| 22. | Circleville | 8.2% | 4.3%(+3.88)#22 | 4.1%(+4.03)#2,885 |
| 23. | Spring Lake | 8.1% | 4.3%(+3.81)#23 | 4.1%(+3.95)#2,929 |
| 24. | Vineyard | 8.1% | 4.3%(+3.79)#24 | 4.1%(+3.93)#2,937 |
| 25. | Copperton | 8.0% | 4.3%(+3.69)#25 | 4.1%(+3.83)#3,006 |
| 26. | South Ogden | 7.8% | 4.3%(+3.51)#26 | 4.1%(+3.66)#3,141 |
| 27. | Carbonville | 7.7% | 4.3%(+3.39)#27 | 4.1%(+3.53)#3,240 |
| 28. | Dugway | 7.6% | 4.3%(+3.26)#28 | 4.1%(+3.40)#3,334 |
| 29. | Fountain Green | 7.5% | 4.3%(+3.21)#29 | 4.1%(+3.35)#3,389 |
| 30. | Coalville | 7.5% | 4.3%(+3.18)#30 | 4.1%(+3.32)#3,423 |
| 31. | Grantsville | 7.4% | 4.3%(+3.11)#31 | 4.1%(+3.25)#3,498 |
| 32. | Orem | 7.3% | 4.3%(+3.00)#32 | 4.1%(+3.14)#3,595 |
| 33. | Fairview | 6.9% | 4.3%(+2.61)#33 | 4.1%(+2.75)#3,989 |
| 34. | New Harmony | 6.8% | 4.3%(+2.56)#34 | 4.1%(+2.70)#4,048 |
| 35. | Springville | 6.6% | 4.3%(+2.32)#35 | 4.1%(+2.46)#4,299 |
| 36. | Woods Cross | 6.6% | 4.3%(+2.29)#36 | 4.1%(+2.43)#4,349 |
| 37. | Castle Valley | 6.4% | 4.3%(+2.13)#37 | 4.1%(+2.27)#4,553 |
| 38. | Snyderville | 6.4% | 4.3%(+2.11)#38 | 4.1%(+2.26)#4,566 |
| 39. | South Salt Lake | 6.3% | 4.3%(+2.05)#39 | 4.1%(+2.19)#4,634 |
| 40. | South Weber | 6.2% | 4.3%(+1.94)#40 | 4.1%(+2.09)#4,791 |
| 41. | Kearns | 6.2% | 4.3%(+1.88)#41 | 4.1%(+2.02)#4,881 |
| 42. | Vernon | 6.0% | 4.3%(+1.73)#42 | 4.1%(+1.87)#5,107 |
| 43. | Stockton | 5.8% | 4.3%(+1.53)#43 | 4.1%(+1.67)#5,427 |
| 44. | Santa Clara | 5.8% | 4.3%(+1.50)#44 | 4.1%(+1.64)#5,477 |
| 45. | Toquerville | 5.8% | 4.3%(+1.48)#45 | 4.1%(+1.62)#5,496 |
| 46. | Hyde Park | 5.8% | 4.3%(+1.48)#46 | 4.1%(+1.62)#5,501 |
| 47. | Glenwood | 5.7% | 4.3%(+1.46)#47 | 4.1%(+1.60)#5,536 |
| 48. | Goshen | 5.7% | 4.3%(+1.45)#48 | 4.1%(+1.59)#5,555 |
| 49. | Cedar City | 5.7% | 4.3%(+1.43)#49 | 4.1%(+1.58)#5,577 |
| 50. | Clearfield | 5.7% | 4.3%(+1.43)#50 | 4.1%(+1.58)#5,578 |
| 51. | West Valley City | 5.7% | 4.3%(+1.43)#51 | 4.1%(+1.57)#5,581 |
| 52. | White | 5.7% | 4.3%(+1.36)#52 | 4.1%(+1.50)#5,706 |
| 53. | Payson | 5.6% | 4.3%(+1.34)#53 | 4.1%(+1.48)#5,748 |
| 54. | Honeyville | 5.6% | 4.3%(+1.32)#54 | 4.1%(+1.46)#5,777 |
| 55. | Ivins | 5.5% | 4.3%(+1.25)#55 | 4.1%(+1.39)#5,912 |
| 56. | Logan | 5.5% | 4.3%(+1.21)#56 | 4.1%(+1.35)#5,999 |
| 57. | Roy | 5.4% | 4.3%(+1.14)#57 | 4.1%(+1.28)#6,133 |
| 58. | Provo | 5.4% | 4.3%(+1.07)#58 | 4.1%(+1.21)#6,258 |
| 59. | Erda | 5.3% | 4.3%(+1.02)#59 | 4.1%(+1.16)#6,368 |
| 60. | North Logan | 5.3% | 4.3%(+1.02)#60 | 4.1%(+1.16)#6,381 |
| 61. | Moab | 5.3% | 4.3%(+1.01)#61 | 4.1%(+1.15)#6,389 |
| 62. | Highland | 5.2% | 4.3%(+0.944)#62 | 4.1%(+1.09)#6,548 |
| 63. | Ogden | 5.2% | 4.3%(+0.920)#63 | 4.1%(+1.06)#6,594 |
| 64. | Hyrum | 5.2% | 4.3%(+0.894)#64 | 4.1%(+1.04)#6,640 |
| 65. | Murray | 5.1% | 4.3%(+0.854)#65 | 4.1%(+0.996)#6,726 |
| 66. | Cedar Hills | 5.1% | 4.3%(+0.828)#66 | 4.1%(+0.969)#6,776 |
| 67. | West Wood | 5.0% | 4.3%(+0.731)#67 | 4.1%(+0.873)#6,997 |
| 68. | Cleveland | 5.0% | 4.3%(+0.731)#68 | 4.1%(+0.873)#6,998 |
| 69. | Wallsburg | 5.0% | 4.3%(+0.708)#69 | 4.1%(+0.850)#7,058 |
| 70. | Heber | 5.0% | 4.3%(+0.698)#70 | 4.1%(+0.840)#7,084 |
| 71. | Magna | 5.0% | 4.3%(+0.666)#71 | 4.1%(+0.807)#7,150 |
| 72. | Cedar Fort | 4.9% | 4.3%(+0.647)#72 | 4.1%(+0.788)#7,198 |
| 73. | Taylorsville | 4.9% | 4.3%(+0.629)#73 | 4.1%(+0.771)#7,231 |
| 74. | St George | 4.9% | 4.3%(+0.627)#74 | 4.1%(+0.769)#7,236 |
| 75. | Monroe | 4.9% | 4.3%(+0.613)#75 | 4.1%(+0.755)#7,268 |
| 76. | Kanab | 4.9% | 4.3%(+0.598)#76 | 4.1%(+0.739)#7,307 |
| 77. | South Willard | 4.9% | 4.3%(+0.563)#77 | 4.1%(+0.705)#7,399 |
| 78. | North Ogden | 4.8% | 4.3%(+0.532)#78 | 4.1%(+0.673)#7,461 |
| 79. | Enoch | 4.7% | 4.3%(+0.431)#79 | 4.1%(+0.572)#7,723 |
| 80. | Price | 4.7% | 4.3%(+0.426)#80 | 4.1%(+0.568)#7,734 |
| 81. | Millcreek | 4.7% | 4.3%(+0.400)#81 | 4.1%(+0.542)#7,797 |
| 82. | Centerville | 4.6% | 4.3%(+0.334)#82 | 4.1%(+0.476)#7,967 |
| 83. | Pleasant Grove | 4.6% | 4.3%(+0.292)#83 | 4.1%(+0.434)#8,072 |
| 84. | Midvale | 4.6% | 4.3%(+0.278)#84 | 4.1%(+0.419)#8,114 |
| 85. | Orderville | 4.5% | 4.3%(+0.254)#85 | 4.1%(+0.396)#8,174 |
| 86. | Bluebell | 4.5% | 4.3%(+0.254)#86 | 4.1%(+0.396)#8,186 |
| 87. | Spanish Fork | 4.5% | 4.3%(+0.171)#87 | 4.1%(+0.313)#8,407 |
| 88. | Liberty | 4.4% | 4.3%(+0.123)#88 | 4.1%(+0.264)#8,541 |
| 89. | Saratoga Springs | 4.4% | 4.3%(+0.082)#89 | 4.1%(+0.224)#8,666 |
| 90. | Pleasant View | 4.3% | 4.3%(+0.049)#90 | 4.1%(+0.191)#8,779 |
| 91. | Annabella | 4.3% | 4.3%(+0.016)#91 | 4.1%(+0.158)#8,899 |
| 92. | Marriott Slaterville | 4.3% | 4.3%(-0.010)#92 | 4.1%(+0.132)#8,984 |
| 93. | Willard | 4.3% | 4.3%(-0.015)#93 | 4.1%(+0.126)#9,000 |
| 94. | Francis | 4.3% | 4.3%(-0.039)#94 | 4.1%(+0.103)#9,071 |
| 95. | Sandy | 4.2% | 4.3%(-0.067)#95 | 4.1%(+0.075)#9,155 |
| 96. | Monticello | 4.2% | 4.3%(-0.089)#96 | 4.1%(+0.053)#9,215 |
| 97. | Nephi | 4.2% | 4.3%(-0.101)#97 | 4.1%(+0.040)#9,251 |
| 98. | Perry | 4.1% | 4.3%(-0.154)#98 | 4.1%(-0.012)#9,415 |
| 99. | Henrieville | 4.1% | 4.3%(-0.154)#99 | 4.1%(-0.012)#9,418 |
| 100. | Ferron | 4.1% | 4.3%(-0.159)#100 | 4.1%(-0.018)#9,428 |
Common Questions
What are the Top 10 Cities with the Highest Percentage of Population Employed in Administrative & Support Services in Utah?
Top 10 Cities with the Highest Percentage of Population Employed in Administrative & Support Services in Utah are:
#1
51.2%
#2
30.6%
#3
25.0%
#4
16.0%
#5
11.7%
#6
11.6%
#7
10.9%
#8
10.6%
#9
10.4%
#10
9.9%
What city has the Highest Percentage of Population Employed in Administrative & Support Services in Utah?
Samak has the Highest Percentage of Population Employed in Administrative & Support Services in Utah with 51.2%.
What is the Percentage of Population Employed in Administrative & Support Services in the State of Utah?
Percentage of Population Employed in Administrative & Support Services in Utah is 4.3%.
What is the Percentage of Population Employed in Administrative & Support Services in the United States?
Percentage of Population Employed in Administrative & Support Services in the United States is 4.1%.