Cities with the Highest Percentage of Population Employed in Administrative & Support Services in New Mexico
RELATED REPORTS & OPTIONS
Administrative & Support Services
New Mexico
Compare Cities
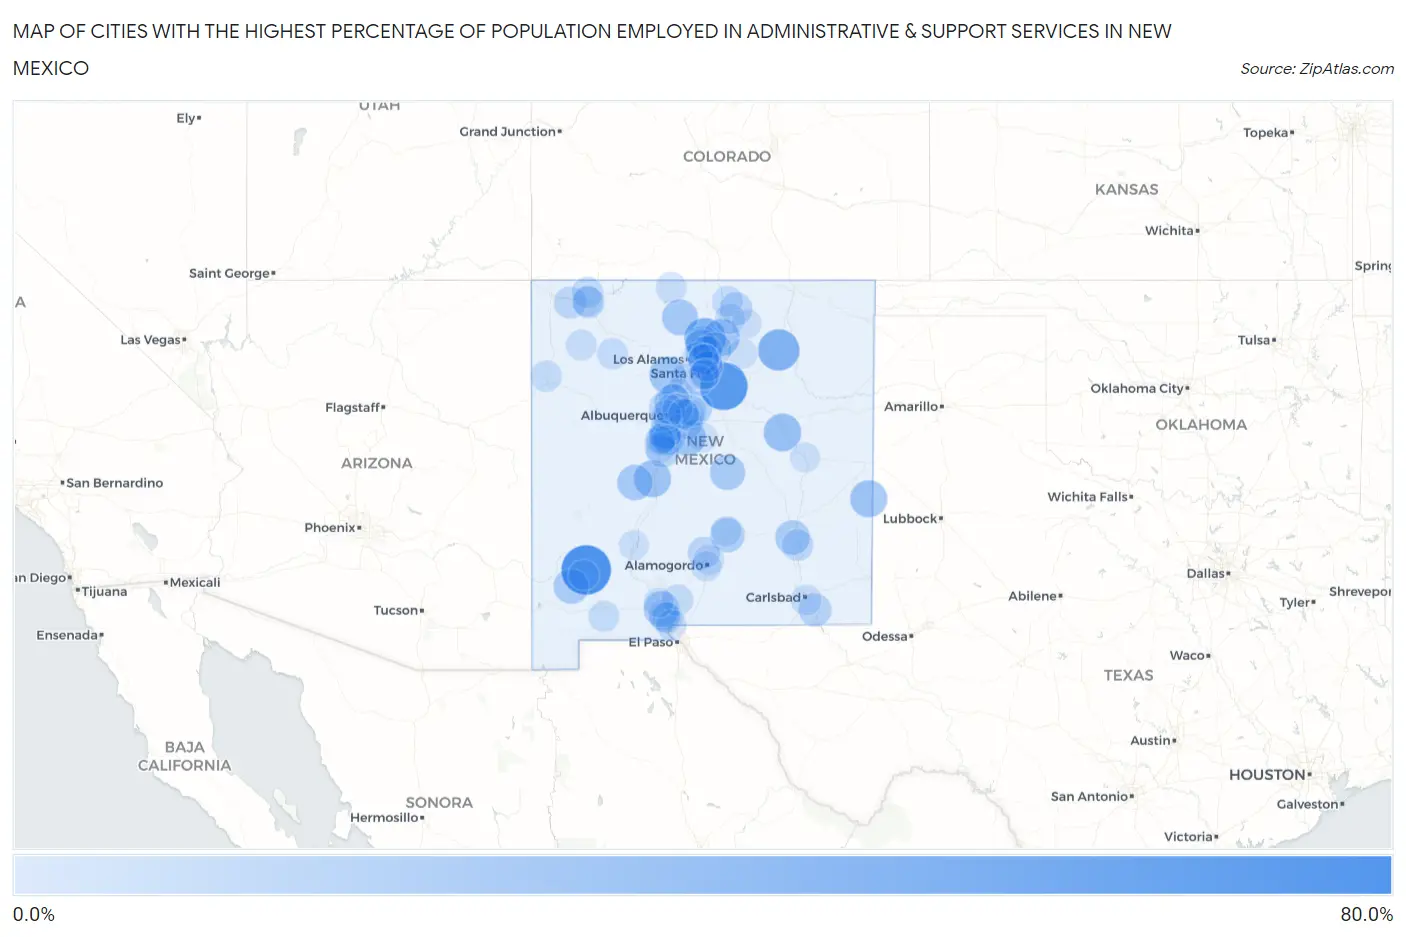
Map of Cities with the Highest Percentage of Population Employed in Administrative & Support Services in New Mexico
0.0%
80.0%
Cities with the Highest Percentage of Population Employed in Administrative & Support Services in New Mexico
| City | % Employed | vs State | vs National | |
| 1. | Hanover | 76.5% | 3.9%(+72.5)#1 | 4.1%(+72.3)#18 |
| 2. | Rowe | 69.3% | 3.9%(+65.4)#2 | 4.1%(+65.2)#26 |
| 3. | Wagon Mound | 45.2% | 3.9%(+41.2)#3 | 4.1%(+41.0)#76 |
| 4. | Canova | 44.9% | 3.9%(+41.0)#4 | 4.1%(+40.8)#78 |
| 5. | Canada De Los Alamos | 33.9% | 3.9%(+30.0)#5 | 4.1%(+29.8)#136 |
| 6. | Puerto De Luna | 31.2% | 3.9%(+27.3)#6 | 4.1%(+27.1)#167 |
| 7. | Picuris Pueblo | 29.0% | 3.9%(+25.1)#7 | 4.1%(+24.9)#204 |
| 8. | Lemitar | 29.0% | 3.9%(+25.1)#8 | 4.1%(+24.9)#205 |
| 9. | Causey | 28.8% | 3.9%(+24.9)#9 | 4.1%(+24.7)#209 |
| 10. | Tajique | 27.5% | 3.9%(+23.6)#10 | 4.1%(+23.4)#231 |
| 11. | Ponderosa | 26.9% | 3.9%(+22.9)#11 | 4.1%(+22.7)#242 |
| 12. | Las Tusas | 25.0% | 3.9%(+21.1)#12 | 4.1%(+20.9)#274 |
| 13. | Canjilon | 25.0% | 3.9%(+21.1)#13 | 4.1%(+20.9)#279 |
| 14. | Pueblo Of Sandia Village | 24.9% | 3.9%(+20.9)#14 | 4.1%(+20.7)#294 |
| 15. | Magdalena | 23.0% | 3.9%(+19.1)#15 | 4.1%(+18.9)#344 |
| 16. | San Pablo | 22.8% | 3.9%(+18.9)#16 | 4.1%(+18.7)#351 |
| 17. | El Valle De Arroyo Seco | 22.8% | 3.9%(+18.9)#17 | 4.1%(+18.7)#352 |
| 18. | White Signal | 22.4% | 3.9%(+18.4)#18 | 4.1%(+18.2)#363 |
| 19. | Corona | 22.2% | 3.9%(+18.3)#19 | 4.1%(+18.1)#367 |
| 20. | Monterey Park | 21.6% | 3.9%(+17.7)#20 | 4.1%(+17.5)#390 |
| 21. | Midway | 20.7% | 3.9%(+16.7)#21 | 4.1%(+16.5)#418 |
| 22. | Williams Acres | 19.5% | 3.9%(+15.5)#22 | 4.1%(+15.3)#461 |
| 23. | Ruidoso Downs | 19.5% | 3.9%(+15.5)#23 | 4.1%(+15.3)#463 |
| 24. | Cedar Grove | 17.9% | 3.9%(+13.9)#24 | 4.1%(+13.7)#551 |
| 25. | Los Luceros | 16.6% | 3.9%(+12.6)#25 | 4.1%(+12.4)#644 |
| 26. | Gamerco | 16.5% | 3.9%(+12.6)#26 | 4.1%(+12.4)#646 |
| 27. | Golden Acres | 16.3% | 3.9%(+12.4)#27 | 4.1%(+12.2)#659 |
| 28. | Ponderosa Pine | 15.5% | 3.9%(+11.6)#28 | 4.1%(+11.4)#733 |
| 29. | Cuyamungue Grant | 15.5% | 3.9%(+11.5)#29 | 4.1%(+11.3)#738 |
| 30. | Truchas | 14.9% | 3.9%(+10.9)#30 | 4.1%(+10.7)#815 |
| 31. | Malaga | 14.3% | 3.9%(+10.3)#31 | 4.1%(+10.1)#903 |
| 32. | Taos Ski Valley | 13.3% | 3.9%(+9.38)#32 | 4.1%(+9.18)#1,060 |
| 33. | Tesuque Pueblo | 13.2% | 3.9%(+9.22)#33 | 4.1%(+9.02)#1,086 |
| 34. | Casa Colorada | 12.8% | 3.9%(+8.83)#34 | 4.1%(+8.63)#1,158 |
| 35. | Middle Mesa | 12.4% | 3.9%(+8.41)#35 | 4.1%(+8.21)#1,232 |
| 36. | Edith Enclave | 12.1% | 3.9%(+8.17)#36 | 4.1%(+7.97)#1,283 |
| 37. | Valencia | 11.7% | 3.9%(+7.80)#37 | 4.1%(+7.60)#1,367 |
| 38. | Peralta | 11.2% | 3.9%(+7.29)#38 | 4.1%(+7.09)#1,481 |
| 39. | Lindrith | 11.2% | 3.9%(+7.27)#39 | 4.1%(+7.07)#1,489 |
| 40. | Ojo Amarillo | 11.1% | 3.9%(+7.16)#40 | 4.1%(+6.96)#1,513 |
| 41. | Tularosa | 11.0% | 3.9%(+7.05)#41 | 4.1%(+6.85)#1,556 |
| 42. | Paradise Hills | 10.5% | 3.9%(+6.51)#42 | 4.1%(+6.31)#1,717 |
| 43. | Tijeras | 10.4% | 3.9%(+6.46)#43 | 4.1%(+6.26)#1,741 |
| 44. | Placitas Cdp Sandoval County | 10.1% | 3.9%(+6.13)#44 | 4.1%(+5.93)#1,868 |
| 45. | West Hammond | 10.0% | 3.9%(+6.04)#45 | 4.1%(+5.84)#1,921 |
| 46. | Dexter | 9.7% | 3.9%(+5.70)#46 | 4.1%(+5.50)#2,051 |
| 47. | El Cerro | 9.2% | 3.9%(+5.25)#47 | 4.1%(+5.05)#2,264 |
| 48. | Sedillo | 9.2% | 3.9%(+5.25)#48 | 4.1%(+5.05)#2,266 |
| 49. | Alcalde | 8.9% | 3.9%(+4.94)#49 | 4.1%(+4.74)#2,441 |
| 50. | Spencerville | 8.9% | 3.9%(+4.94)#50 | 4.1%(+4.73)#2,447 |
| 51. | San Miguel | 8.8% | 3.9%(+4.85)#51 | 4.1%(+4.65)#2,494 |
| 52. | White Sands | 8.4% | 3.9%(+4.48)#52 | 4.1%(+4.28)#2,713 |
| 53. | Yah Ta Hey | 8.2% | 3.9%(+4.26)#53 | 4.1%(+4.06)#2,868 |
| 54. | South River | 8.2% | 3.9%(+4.25)#54 | 4.1%(+4.05)#2,872 |
| 55. | Pueblo Pintado | 7.8% | 3.9%(+3.89)#55 | 4.1%(+3.69)#3,117 |
| 56. | Edgewood | 7.7% | 3.9%(+3.73)#56 | 4.1%(+3.53)#3,241 |
| 57. | Rio Rancho Estates | 7.6% | 3.9%(+3.63)#57 | 4.1%(+3.43)#3,318 |
| 58. | Lee Acres | 7.5% | 3.9%(+3.60)#58 | 4.1%(+3.40)#3,337 |
| 59. | Cuyamungue | 7.1% | 3.9%(+3.19)#59 | 4.1%(+2.99)#3,741 |
| 60. | Sunshine | 7.1% | 3.9%(+3.16)#60 | 4.1%(+2.96)#3,786 |
| 61. | Questa | 7.1% | 3.9%(+3.11)#61 | 4.1%(+2.91)#3,832 |
| 62. | South Valley | 7.1% | 3.9%(+3.10)#62 | 4.1%(+2.90)#3,850 |
| 63. | Lake Valley | 7.0% | 3.9%(+3.03)#63 | 4.1%(+2.83)#3,930 |
| 64. | Chama | 6.8% | 3.9%(+2.90)#64 | 4.1%(+2.70)#4,047 |
| 65. | Espanola | 6.5% | 3.9%(+2.58)#65 | 4.1%(+2.38)#4,390 |
| 66. | Pueblitos | 6.3% | 3.9%(+2.36)#66 | 4.1%(+2.16)#4,688 |
| 67. | Chimayo | 6.3% | 3.9%(+2.36)#67 | 4.1%(+2.16)#4,695 |
| 68. | La Luz | 6.3% | 3.9%(+2.32)#68 | 4.1%(+2.12)#4,745 |
| 69. | Carlsbad | 6.2% | 3.9%(+2.24)#69 | 4.1%(+2.04)#4,859 |
| 70. | Angustura | 6.2% | 3.9%(+2.22)#70 | 4.1%(+2.02)#4,883 |
| 71. | Vado | 6.1% | 3.9%(+2.15)#71 | 4.1%(+1.95)#4,980 |
| 72. | La Mesa | 6.1% | 3.9%(+2.11)#72 | 4.1%(+1.91)#5,040 |
| 73. | Anthony | 5.9% | 3.9%(+1.91)#73 | 4.1%(+1.71)#5,372 |
| 74. | Taos Pueblo | 5.8% | 3.9%(+1.83)#74 | 4.1%(+1.63)#5,485 |
| 75. | San Ildefonso Pueblo | 5.8% | 3.9%(+1.80)#75 | 4.1%(+1.60)#5,526 |
| 76. | Algodones | 5.7% | 3.9%(+1.75)#76 | 4.1%(+1.54)#5,637 |
| 77. | Cochiti | 5.6% | 3.9%(+1.65)#77 | 4.1%(+1.45)#5,791 |
| 78. | Peak Place | 5.5% | 3.9%(+1.58)#78 | 4.1%(+1.38)#5,943 |
| 79. | Pena Blanca | 5.4% | 3.9%(+1.41)#79 | 4.1%(+1.21)#6,260 |
| 80. | Pojoaque | 5.4% | 3.9%(+1.41)#80 | 4.1%(+1.20)#6,279 |
| 81. | La Cienega | 5.3% | 3.9%(+1.32)#81 | 4.1%(+1.12)#6,451 |
| 82. | Bernalillo | 5.2% | 3.9%(+1.29)#82 | 4.1%(+1.09)#6,551 |
| 83. | North Valley | 4.9% | 3.9%(+0.999)#83 | 4.1%(+0.799)#7,166 |
| 84. | Alamogordo | 4.9% | 3.9%(+0.987)#84 | 4.1%(+0.786)#7,199 |
| 85. | Sandia Heights | 4.9% | 3.9%(+0.944)#85 | 4.1%(+0.743)#7,297 |
| 86. | Agua Fria | 4.9% | 3.9%(+0.933)#86 | 4.1%(+0.732)#7,328 |
| 87. | Bayard | 4.9% | 3.9%(+0.907)#87 | 4.1%(+0.706)#7,392 |
| 88. | Santa Fe | 4.7% | 3.9%(+0.741)#88 | 4.1%(+0.540)#7,804 |
| 89. | Ruidoso | 4.7% | 3.9%(+0.728)#89 | 4.1%(+0.527)#7,833 |
| 90. | Albuquerque | 4.6% | 3.9%(+0.666)#90 | 4.1%(+0.465)#8,001 |
| 91. | Estancia | 4.6% | 3.9%(+0.616)#91 | 4.1%(+0.415)#8,129 |
| 92. | Las Maravillas | 4.6% | 3.9%(+0.615)#92 | 4.1%(+0.414)#8,133 |
| 93. | Las Cruces | 4.4% | 3.9%(+0.439)#93 | 4.1%(+0.239)#8,619 |
| 94. | Los Chaves | 4.3% | 3.9%(+0.318)#94 | 4.1%(+0.118)#9,026 |
| 95. | Cedar Crest | 4.3% | 3.9%(+0.316)#95 | 4.1%(+0.116)#9,034 |
| 96. | Belen | 4.2% | 3.9%(+0.228)#96 | 4.1%(+0.028)#9,292 |
| 97. | Fort Sumner | 4.1% | 3.9%(+0.183)#97 | 4.1%(-0.018)#9,429 |
| 98. | Mora | 4.0% | 3.9%(+0.094)#98 | 4.1%(-0.107)#9,697 |
| 99. | Truth Or Consequences | 4.0% | 3.9%(+0.087)#99 | 4.1%(-0.114)#9,719 |
| 100. | Angel Fire | 4.0% | 3.9%(+0.074)#100 | 4.1%(-0.127)#9,773 |
Common Questions
What are the Top 10 Cities with the Highest Percentage of Population Employed in Administrative & Support Services in New Mexico?
Top 10 Cities with the Highest Percentage of Population Employed in Administrative & Support Services in New Mexico are:
#1
76.5%
#2
69.3%
#3
45.2%
#4
44.9%
#5
31.2%
#6
29.0%
#7
29.0%
#8
28.8%
#9
27.5%
#10
26.9%
What city has the Highest Percentage of Population Employed in Administrative & Support Services in New Mexico?
Hanover has the Highest Percentage of Population Employed in Administrative & Support Services in New Mexico with 76.5%.
What is the Percentage of Population Employed in Administrative & Support Services in the State of New Mexico?
Percentage of Population Employed in Administrative & Support Services in New Mexico is 3.9%.
What is the Percentage of Population Employed in Administrative & Support Services in the United States?
Percentage of Population Employed in Administrative & Support Services in the United States is 4.1%.