Zip Codes with the Highest Percentage of Population Employed in Administrative & Support Services in Allentown, PA
RELATED REPORTS & OPTIONS
Administrative & Support Services
Allentown
Compare Zip Codes
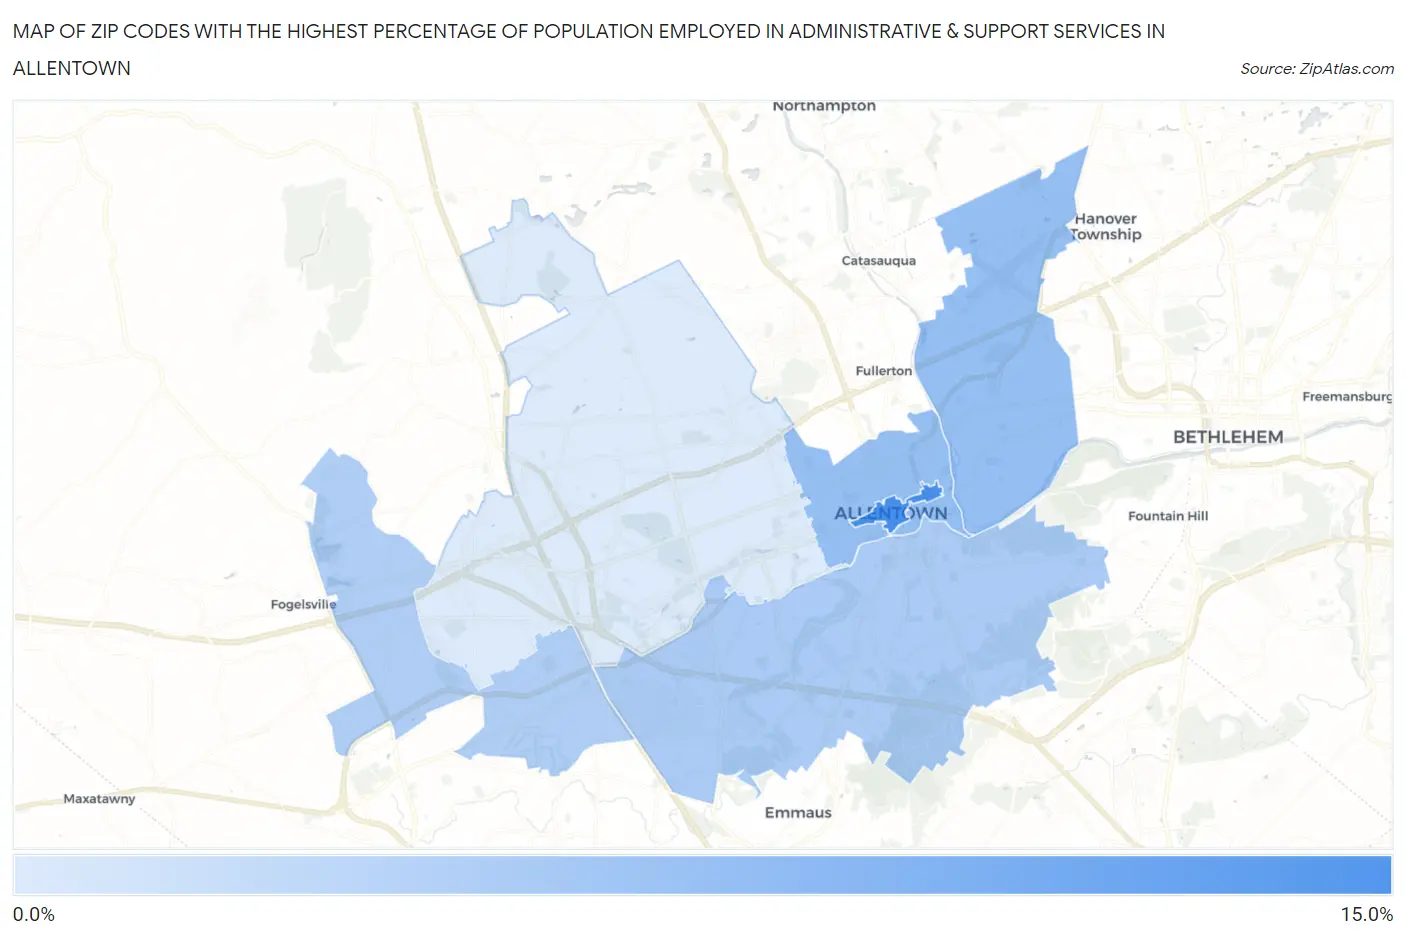
Map of Zip Codes with the Highest Percentage of Population Employed in Administrative & Support Services in Allentown
2.1%
11.6%
Zip Codes with the Highest Percentage of Population Employed in Administrative & Support Services in Allentown, PA
| Zip Code | % Employed | vs State | vs National | |
| 1. | 18101 | 11.6% | 3.6%(+7.97)#59 | 4.1%(+7.40)#916 |
| 2. | 18102 | 6.6% | 3.6%(+2.97)#172 | 4.1%(+2.40)#3,834 |
| 3. | 18109 | 6.5% | 3.6%(+2.92)#176 | 4.1%(+2.35)#3,905 |
| 4. | 18103 | 5.3% | 3.6%(+1.71)#300 | 4.1%(+1.15)#6,337 |
| 5. | 18106 | 5.0% | 3.6%(+1.39)#341 | 4.1%(+0.827)#7,173 |
| 6. | 18104 | 2.1% | 3.6%(-1.45)#1,102 | 4.1%(-2.02)#19,988 |
1
Common Questions
What are the Top 5 Zip Codes with the Highest Percentage of Population Employed in Administrative & Support Services in Allentown, PA?
Top 5 Zip Codes with the Highest Percentage of Population Employed in Administrative & Support Services in Allentown, PA are:
What zip code has the Highest Percentage of Population Employed in Administrative & Support Services in Allentown, PA?
18101 has the Highest Percentage of Population Employed in Administrative & Support Services in Allentown, PA with 11.6%.
What is the Percentage of Population Employed in Administrative & Support Services in Allentown, PA?
Percentage of Population Employed in Administrative & Support Services in Allentown is 6.0%.
What is the Percentage of Population Employed in Administrative & Support Services in Pennsylvania?
Percentage of Population Employed in Administrative & Support Services in Pennsylvania is 3.6%.
What is the Percentage of Population Employed in Administrative & Support Services in the United States?
Percentage of Population Employed in Administrative & Support Services in the United States is 4.1%.