Cities with the Highest Percentage of Population Employed in Administrative & Support Services in Indiana
RELATED REPORTS & OPTIONS
Administrative & Support Services
Indiana
Compare Cities
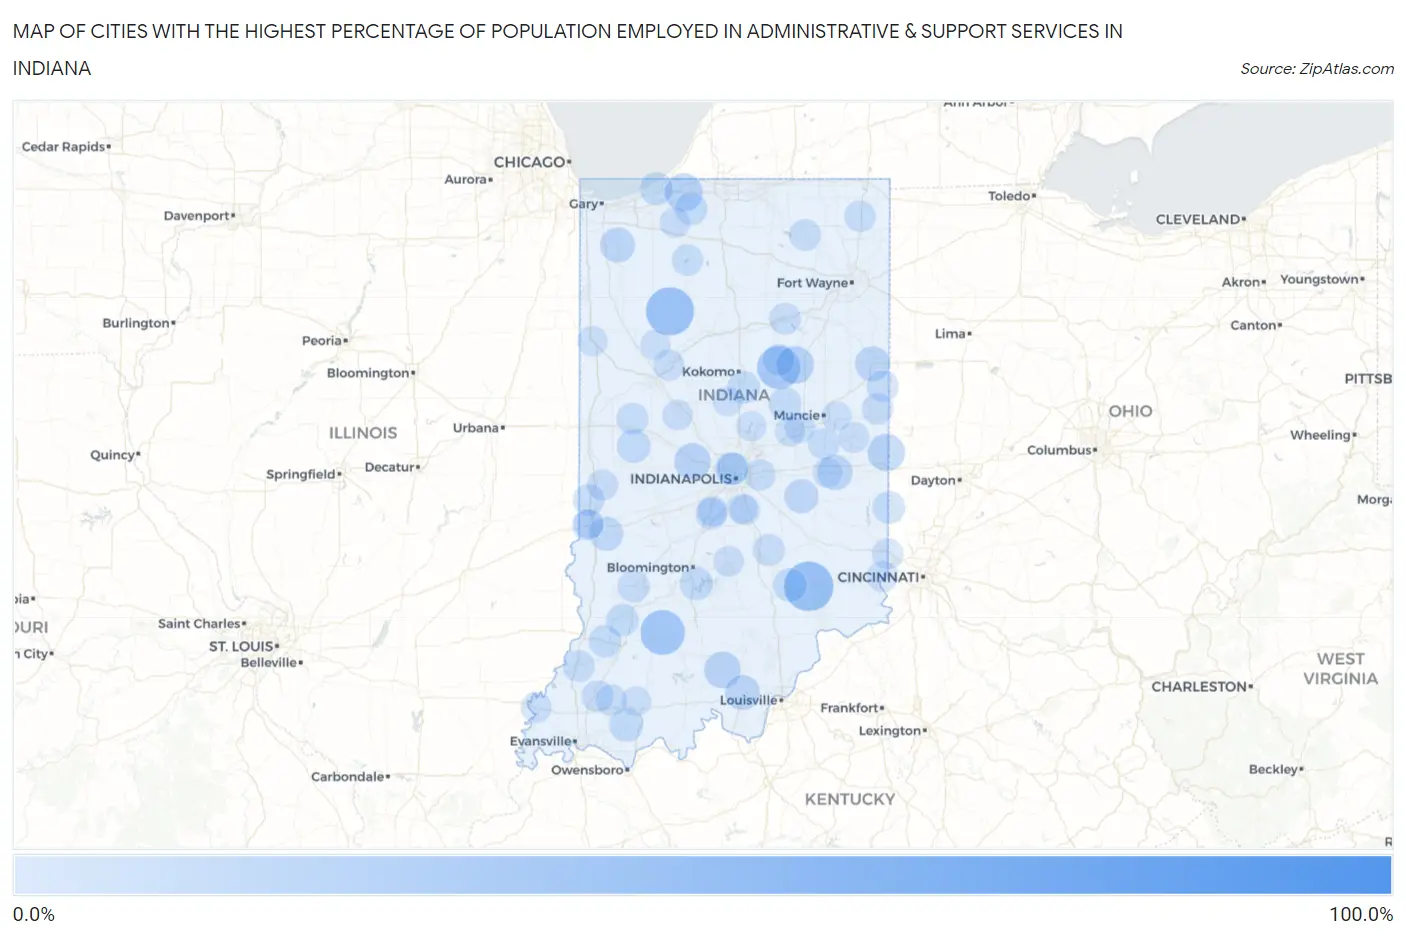
Map of Cities with the Highest Percentage of Population Employed in Administrative & Support Services in Indiana
0.0%
100.0%
Cities with the Highest Percentage of Population Employed in Administrative & Support Services in Indiana
| City | % Employed | vs State | vs National | |
| 1. | Huron | 100.0% | 3.5%(+96.5)#1 | 4.1%(+95.9)#3 |
| 2. | Beaver Dam | 51.9% | 3.5%(+48.3)#2 | 4.1%(+47.7)#53 |
| 3. | Midland | 47.3% | 3.5%(+43.8)#3 | 4.1%(+43.1)#70 |
| 4. | Butlerville | 43.2% | 3.5%(+39.7)#4 | 4.1%(+39.1)#84 |
| 5. | Buffalo | 40.5% | 3.5%(+37.0)#5 | 4.1%(+36.4)#105 |
| 6. | Dover Hill | 34.1% | 3.5%(+30.6)#6 | 4.1%(+30.0)#134 |
| 7. | Mays | 33.3% | 3.5%(+29.8)#7 | 4.1%(+29.2)#139 |
| 8. | Marietta | 33.0% | 3.5%(+29.5)#8 | 4.1%(+28.9)#147 |
| 9. | Pulaski | 31.2% | 3.5%(+27.7)#9 | 4.1%(+27.1)#169 |
| 10. | Herbst | 31.2% | 3.5%(+27.6)#10 | 4.1%(+27.0)#171 |
| 11. | Fountaintown | 29.3% | 3.5%(+25.7)#11 | 4.1%(+25.1)#199 |
| 12. | Ontario | 24.4% | 3.5%(+20.9)#12 | 4.1%(+20.3)#301 |
| 13. | Blairsville | 22.9% | 3.5%(+19.3)#13 | 4.1%(+18.7)#349 |
| 14. | Grantsburg | 21.4% | 3.5%(+17.9)#14 | 4.1%(+17.3)#394 |
| 15. | Rolling Prairie | 21.2% | 3.5%(+17.6)#15 | 4.1%(+17.0)#401 |
| 16. | Marion | 21.1% | 3.5%(+17.6)#16 | 4.1%(+17.0)#403 |
| 17. | Ora | 20.0% | 3.5%(+16.5)#17 | 4.1%(+15.9)#436 |
| 18. | Whitewater | 20.0% | 3.5%(+16.5)#18 | 4.1%(+15.9)#441 |
| 19. | Hardinsburg | 19.1% | 3.5%(+15.6)#19 | 4.1%(+15.0)#481 |
| 20. | Twelve Mile | 18.7% | 3.5%(+15.2)#20 | 4.1%(+14.5)#501 |
| 21. | Williamsburg | 18.5% | 3.5%(+15.0)#21 | 4.1%(+14.3)#507 |
| 22. | Arcola | 18.5% | 3.5%(+15.0)#22 | 4.1%(+14.3)#509 |
| 23. | Lizton | 18.4% | 3.5%(+14.9)#23 | 4.1%(+14.3)#510 |
| 24. | Straughn | 16.3% | 3.5%(+12.7)#24 | 4.1%(+12.1)#666 |
| 25. | Bryant | 15.9% | 3.5%(+12.4)#25 | 4.1%(+11.8)#689 |
| 26. | New Salisbury | 15.8% | 3.5%(+12.3)#26 | 4.1%(+11.6)#697 |
| 27. | Abington | 15.6% | 3.5%(+12.1)#27 | 4.1%(+11.5)#720 |
| 28. | Hebron | 15.5% | 3.5%(+12.0)#28 | 4.1%(+11.4)#730 |
| 29. | Browns Crossing | 15.0% | 3.5%(+11.5)#29 | 4.1%(+10.9)#789 |
| 30. | Prairieton | 14.8% | 3.5%(+11.3)#30 | 4.1%(+10.7)#820 |
| 31. | Riley | 14.4% | 3.5%(+10.9)#31 | 4.1%(+10.3)#875 |
| 32. | Folsomville | 14.4% | 3.5%(+10.9)#32 | 4.1%(+10.3)#876 |
| 33. | Arlington | 14.3% | 3.5%(+10.8)#33 | 4.1%(+10.1)#900 |
| 34. | Hoffman Lake | 14.1% | 3.5%(+10.6)#34 | 4.1%(+9.99)#924 |
| 35. | Gilmer Park | 14.1% | 3.5%(+10.6)#35 | 4.1%(+9.99)#925 |
| 36. | Country Squire Lakes | 13.5% | 3.5%(+9.94)#36 | 4.1%(+9.32)#1,037 |
| 37. | Palestine | 13.4% | 3.5%(+9.92)#37 | 4.1%(+9.30)#1,042 |
| 38. | Tennyson | 13.4% | 3.5%(+9.90)#38 | 4.1%(+9.28)#1,044 |
| 39. | Needmore | 13.2% | 3.5%(+9.65)#39 | 4.1%(+9.03)#1,085 |
| 40. | Perkinsville | 13.2% | 3.5%(+9.63)#40 | 4.1%(+9.01)#1,088 |
| 41. | Alamo | 13.0% | 3.5%(+9.51)#41 | 4.1%(+8.89)#1,114 |
| 42. | Smithville Sanders | 12.8% | 3.5%(+9.25)#42 | 4.1%(+8.63)#1,160 |
| 43. | Trail Creek | 12.6% | 3.5%(+9.12)#43 | 4.1%(+8.50)#1,185 |
| 44. | Wynnedale | 12.2% | 3.5%(+8.64)#44 | 4.1%(+8.02)#1,273 |
| 45. | Orestes | 11.9% | 3.5%(+8.42)#45 | 4.1%(+7.80)#1,322 |
| 46. | Oswego | 11.7% | 3.5%(+8.19)#46 | 4.1%(+7.57)#1,376 |
| 47. | Blue Ridge | 11.5% | 3.5%(+7.95)#47 | 4.1%(+7.33)#1,428 |
| 48. | Sharpsville | 11.5% | 3.5%(+7.93)#48 | 4.1%(+7.31)#1,432 |
| 49. | West College Corner | 11.4% | 3.5%(+7.84)#49 | 4.1%(+7.22)#1,451 |
| 50. | Plainville | 11.3% | 3.5%(+7.81)#50 | 4.1%(+7.19)#1,460 |
| 51. | Wheatland | 11.3% | 3.5%(+7.79)#51 | 4.1%(+7.17)#1,463 |
| 52. | Tippecanoe | 11.3% | 3.5%(+7.78)#52 | 4.1%(+7.16)#1,465 |
| 53. | Foxcliff Estates | 11.3% | 3.5%(+7.73)#53 | 4.1%(+7.11)#1,475 |
| 54. | Fish Lake | 11.2% | 3.5%(+7.63)#54 | 4.1%(+7.01)#1,501 |
| 55. | Chain-O-Lakes | 11.0% | 3.5%(+7.51)#55 | 4.1%(+6.89)#1,542 |
| 56. | Wingate | 10.5% | 3.5%(+6.96)#56 | 4.1%(+6.34)#1,702 |
| 57. | Putnamville | 10.5% | 3.5%(+6.94)#57 | 4.1%(+6.32)#1,708 |
| 58. | Clifford | 10.4% | 3.5%(+6.89)#58 | 4.1%(+6.27)#1,732 |
| 59. | Somerville | 10.3% | 3.5%(+6.78)#59 | 4.1%(+6.16)#1,779 |
| 60. | Kimmell | 10.2% | 3.5%(+6.70)#60 | 4.1%(+6.08)#1,806 |
| 61. | Mount Summit | 10.1% | 3.5%(+6.60)#61 | 4.1%(+5.98)#1,848 |
| 62. | Switz City | 10.1% | 3.5%(+6.53)#62 | 4.1%(+5.91)#1,877 |
| 63. | Lagro | 10.1% | 3.5%(+6.53)#63 | 4.1%(+5.91)#1,878 |
| 64. | Hazleton | 10.0% | 3.5%(+6.47)#64 | 4.1%(+5.85)#1,904 |
| 65. | Spring Hill | 10.0% | 3.5%(+6.47)#65 | 4.1%(+5.85)#1,914 |
| 66. | Salamonia | 9.6% | 3.5%(+6.05)#66 | 4.1%(+5.42)#2,088 |
| 67. | Newbern | 9.6% | 3.5%(+6.05)#67 | 4.1%(+5.42)#2,089 |
| 68. | Sweetser | 9.6% | 3.5%(+6.04)#68 | 4.1%(+5.42)#2,090 |
| 69. | Saratoga | 9.6% | 3.5%(+6.04)#69 | 4.1%(+5.42)#2,091 |
| 70. | Bethany | 9.5% | 3.5%(+5.99)#70 | 4.1%(+5.37)#2,119 |
| 71. | Bass Lake | 9.5% | 3.5%(+5.95)#71 | 4.1%(+5.33)#2,129 |
| 72. | Universal | 9.4% | 3.5%(+5.90)#72 | 4.1%(+5.28)#2,152 |
| 73. | Hortonville | 9.4% | 3.5%(+5.87)#73 | 4.1%(+5.25)#2,168 |
| 74. | Spurgeon | 9.2% | 3.5%(+5.68)#74 | 4.1%(+5.06)#2,259 |
| 75. | Ashley | 9.2% | 3.5%(+5.65)#75 | 4.1%(+5.03)#2,273 |
| 76. | Cumberland | 9.1% | 3.5%(+5.59)#76 | 4.1%(+4.97)#2,301 |
| 77. | Americus | 8.9% | 3.5%(+5.41)#77 | 4.1%(+4.79)#2,413 |
| 78. | West Harrison | 8.8% | 3.5%(+5.31)#78 | 4.1%(+4.69)#2,471 |
| 79. | Mecca | 8.8% | 3.5%(+5.29)#79 | 4.1%(+4.67)#2,483 |
| 80. | Lawrenceburg | 8.8% | 3.5%(+5.23)#80 | 4.1%(+4.61)#2,519 |
| 81. | Modoc | 8.3% | 3.5%(+4.80)#81 | 4.1%(+4.18)#2,784 |
| 82. | Toad Hop | 8.2% | 3.5%(+4.72)#82 | 4.1%(+4.10)#2,836 |
| 83. | Lamb | 8.0% | 3.5%(+4.47)#83 | 4.1%(+3.85)#2,990 |
| 84. | Kingsford Heights | 8.0% | 3.5%(+4.46)#84 | 4.1%(+3.84)#2,998 |
| 85. | Nashville | 7.9% | 3.5%(+4.39)#85 | 4.1%(+3.76)#3,054 |
| 86. | Griffin | 7.9% | 3.5%(+4.37)#86 | 4.1%(+3.74)#3,073 |
| 87. | Chesterfield | 7.9% | 3.5%(+4.34)#87 | 4.1%(+3.72)#3,093 |
| 88. | Colfax | 7.8% | 3.5%(+4.29)#88 | 4.1%(+3.67)#3,134 |
| 89. | Brooklyn | 7.6% | 3.5%(+4.04)#89 | 4.1%(+3.42)#3,324 |
| 90. | Chalmers | 7.4% | 3.5%(+3.85)#90 | 4.1%(+3.23)#3,519 |
| 91. | Cicero | 7.3% | 3.5%(+3.77)#91 | 4.1%(+3.15)#3,592 |
| 92. | Lewisville | 7.2% | 3.5%(+3.70)#92 | 4.1%(+3.08)#3,657 |
| 93. | Whiteland | 7.2% | 3.5%(+3.67)#93 | 4.1%(+3.05)#3,684 |
| 94. | Anderson | 7.2% | 3.5%(+3.66)#94 | 4.1%(+3.04)#3,692 |
| 95. | Earl Park | 7.1% | 3.5%(+3.61)#95 | 4.1%(+2.99)#3,744 |
| 96. | West Terre Haute | 6.9% | 3.5%(+3.42)#96 | 4.1%(+2.79)#3,952 |
| 97. | New Whiteland | 6.8% | 3.5%(+3.29)#97 | 4.1%(+2.67)#4,080 |
| 98. | Selma | 6.7% | 3.5%(+3.19)#98 | 4.1%(+2.56)#4,176 |
| 99. | Holland | 6.7% | 3.5%(+3.16)#99 | 4.1%(+2.54)#4,202 |
| 100. | Kempton | 6.7% | 3.5%(+3.14)#100 | 4.1%(+2.52)#4,229 |
Common Questions
What are the Top 10 Cities with the Highest Percentage of Population Employed in Administrative & Support Services in Indiana?
Top 10 Cities with the Highest Percentage of Population Employed in Administrative & Support Services in Indiana are:
#1
43.2%
#2
40.5%
#3
34.1%
#4
31.2%
#5
21.2%
#6
21.1%
#7
20.0%
#8
19.1%
#9
18.4%
#10
16.3%
What city has the Highest Percentage of Population Employed in Administrative & Support Services in Indiana?
Butlerville has the Highest Percentage of Population Employed in Administrative & Support Services in Indiana with 43.2%.
What is the Percentage of Population Employed in Administrative & Support Services in the State of Indiana?
Percentage of Population Employed in Administrative & Support Services in Indiana is 3.5%.
What is the Percentage of Population Employed in Administrative & Support Services in the United States?
Percentage of Population Employed in Administrative & Support Services in the United States is 4.1%.