Cities with the Highest Percentage of Population Employed in Administrative & Support Services in Georgia
RELATED REPORTS & OPTIONS
Administrative & Support Services
Georgia
Compare Cities
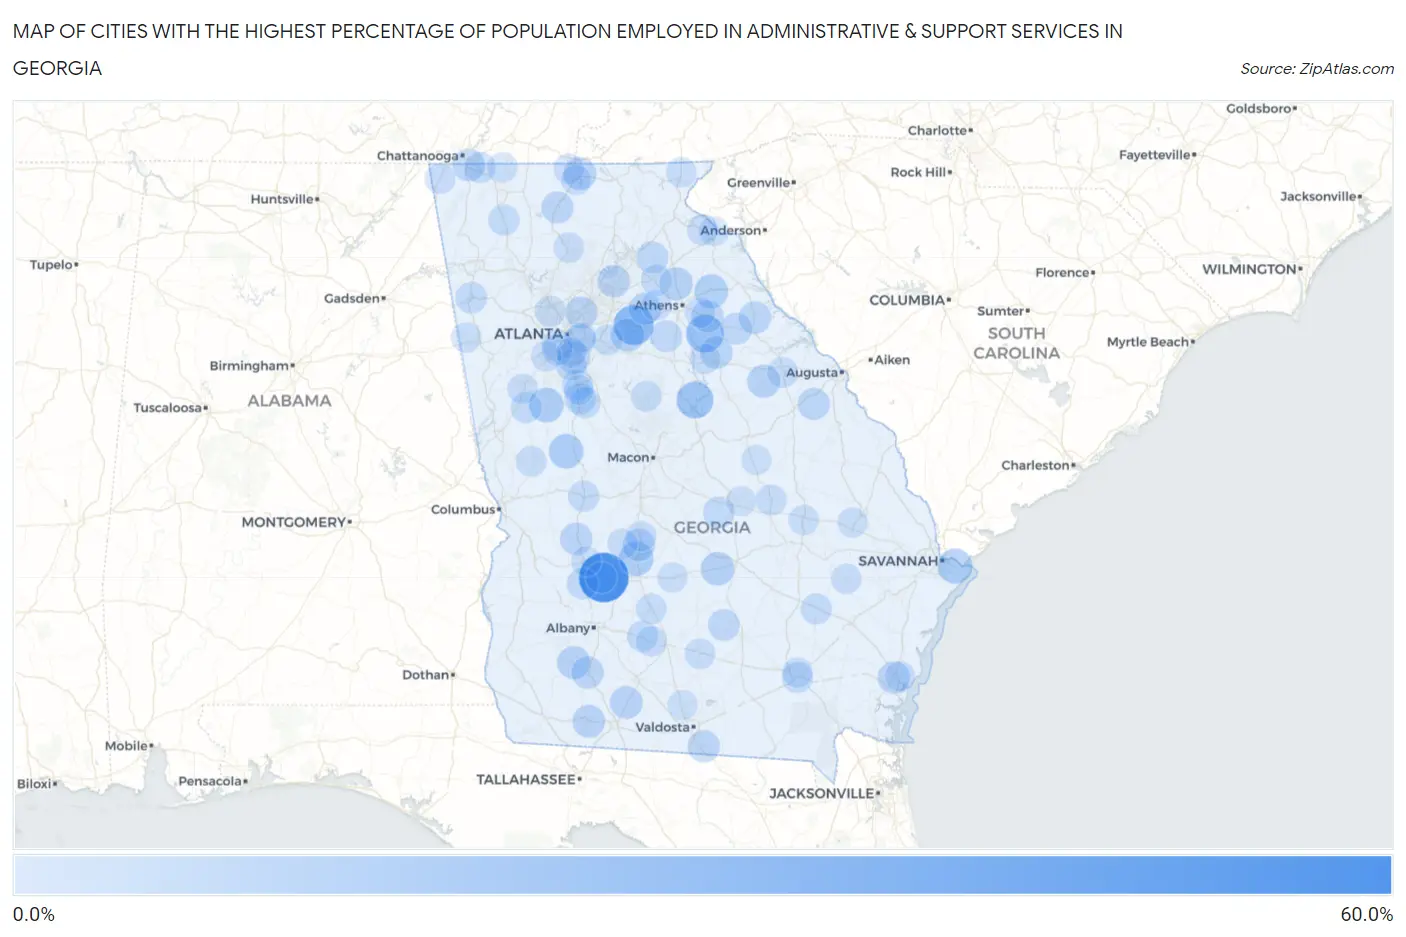
Map of Cities with the Highest Percentage of Population Employed in Administrative & Support Services in Georgia
0.0%
60.0%
Cities with the Highest Percentage of Population Employed in Administrative & Support Services in Georgia
| City | % Employed | vs State | vs National | |
| 1. | De Soto | 58.1% | 4.8%(+53.2)#1 | 4.1%(+53.9)#35 |
| 2. | Sterling | 35.5% | 4.8%(+30.7)#2 | 4.1%(+31.3)#127 |
| 3. | Between | 33.0% | 4.8%(+28.2)#3 | 4.1%(+28.8)#148 |
| 4. | Maxeys | 26.9% | 4.8%(+22.1)#4 | 4.1%(+22.8)#241 |
| 5. | Box Springs | 25.0% | 4.8%(+20.2)#5 | 4.1%(+20.9)#276 |
| 6. | Crooked Creek | 24.5% | 4.8%(+19.7)#6 | 4.1%(+20.4)#298 |
| 7. | Naylor | 22.2% | 4.8%(+17.4)#7 | 4.1%(+18.1)#369 |
| 8. | Talahi Island | 19.4% | 4.8%(+14.6)#8 | 4.1%(+15.2)#466 |
| 9. | Haralson | 18.9% | 4.8%(+14.1)#9 | 4.1%(+14.7)#488 |
| 10. | Sunset Village | 18.9% | 4.8%(+14.0)#10 | 4.1%(+14.7)#492 |
| 11. | Vienna | 18.4% | 4.8%(+13.6)#11 | 4.1%(+14.2)#515 |
| 12. | Comer | 17.1% | 4.8%(+12.2)#12 | 4.1%(+12.9)#605 |
| 13. | Milan | 16.1% | 4.8%(+11.3)#13 | 4.1%(+12.0)#677 |
| 14. | Walnut Grove | 15.5% | 4.8%(+10.6)#14 | 4.1%(+11.3)#740 |
| 15. | Nicholson | 15.3% | 4.8%(+10.5)#15 | 4.1%(+11.2)#763 |
| 16. | Crescent | 15.0% | 4.8%(+10.2)#16 | 4.1%(+10.9)#791 |
| 17. | Newton | 14.8% | 4.8%(+10.0)#17 | 4.1%(+10.7)#819 |
| 18. | Warrenton | 14.8% | 4.8%(+9.98)#18 | 4.1%(+10.6)#827 |
| 19. | Morrow | 14.4% | 4.8%(+9.58)#19 | 4.1%(+10.3)#883 |
| 20. | Mineral Bluff | 14.2% | 4.8%(+9.34)#20 | 4.1%(+10.0)#920 |
| 21. | Cairo | 14.1% | 4.8%(+9.30)#21 | 4.1%(+9.97)#928 |
| 22. | Coolidge | 14.0% | 4.8%(+9.21)#22 | 4.1%(+9.88)#939 |
| 23. | Union Point | 13.8% | 4.8%(+9.03)#23 | 4.1%(+9.70)#966 |
| 24. | Lakeview | 13.5% | 4.8%(+8.72)#24 | 4.1%(+9.39)#1,030 |
| 25. | Pinehurst | 13.4% | 4.8%(+8.58)#25 | 4.1%(+9.25)#1,046 |
| 26. | Dock Junction | 13.3% | 4.8%(+8.47)#26 | 4.1%(+9.13)#1,067 |
| 27. | Tignall | 13.2% | 4.8%(+8.37)#27 | 4.1%(+9.03)#1,083 |
| 28. | Ellaville | 13.2% | 4.8%(+8.35)#28 | 4.1%(+9.02)#1,087 |
| 29. | Bethlehem | 13.1% | 4.8%(+8.31)#29 | 4.1%(+8.98)#1,091 |
| 30. | Crawford | 13.1% | 4.8%(+8.24)#30 | 4.1%(+8.90)#1,106 |
| 31. | Rest Haven | 13.0% | 4.8%(+8.23)#31 | 4.1%(+8.89)#1,115 |
| 32. | Camilla | 12.9% | 4.8%(+8.11)#32 | 4.1%(+8.78)#1,132 |
| 33. | Lake Park | 12.9% | 4.8%(+8.06)#33 | 4.1%(+8.72)#1,141 |
| 34. | Keysville | 12.8% | 4.8%(+8.03)#34 | 4.1%(+8.69)#1,146 |
| 35. | Doraville | 12.7% | 4.8%(+7.91)#35 | 4.1%(+8.57)#1,169 |
| 36. | East Ellijay | 12.5% | 4.8%(+7.68)#36 | 4.1%(+8.35)#1,204 |
| 37. | Rayle | 12.1% | 4.8%(+7.30)#37 | 4.1%(+7.97)#1,286 |
| 38. | Cusseta Chattahoochee County Unified Government | 12.0% | 4.8%(+7.23)#38 | 4.1%(+7.90)#1,301 |
| 39. | Bostwick | 12.0% | 4.8%(+7.21)#39 | 4.1%(+7.88)#1,305 |
| 40. | Gillsville | 11.9% | 4.8%(+7.12)#40 | 4.1%(+7.79)#1,325 |
| 41. | Ambrose | 11.7% | 4.8%(+6.88)#41 | 4.1%(+7.55)#1,379 |
| 42. | Cedartown | 11.4% | 4.8%(+6.53)#42 | 4.1%(+7.20)#1,459 |
| 43. | Milstead | 11.2% | 4.8%(+6.42)#43 | 4.1%(+7.09)#1,480 |
| 44. | Smithville | 10.7% | 4.8%(+5.90)#44 | 4.1%(+6.56)#1,634 |
| 45. | Experiment | 10.7% | 4.8%(+5.89)#45 | 4.1%(+6.56)#1,637 |
| 46. | Dexter | 10.6% | 4.8%(+5.79)#46 | 4.1%(+6.46)#1,665 |
| 47. | Indian Springs | 10.6% | 4.8%(+5.75)#47 | 4.1%(+6.42)#1,674 |
| 48. | Butler | 10.5% | 4.8%(+5.67)#48 | 4.1%(+6.33)#1,704 |
| 49. | Hampton | 10.5% | 4.8%(+5.66)#49 | 4.1%(+6.32)#1,706 |
| 50. | Jefferson | 10.5% | 4.8%(+5.65)#50 | 4.1%(+6.32)#1,710 |
| 51. | Resaca | 10.4% | 4.8%(+5.63)#51 | 4.1%(+6.30)#1,721 |
| 52. | Luthersville | 10.4% | 4.8%(+5.56)#52 | 4.1%(+6.22)#1,748 |
| 53. | Sumner | 10.4% | 4.8%(+5.55)#53 | 4.1%(+6.22)#1,754 |
| 54. | Panthersville | 10.3% | 4.8%(+5.52)#54 | 4.1%(+6.18)#1,771 |
| 55. | Jonesboro | 10.0% | 4.8%(+5.20)#55 | 4.1%(+5.87)#1,890 |
| 56. | Waycross | 10.0% | 4.8%(+5.16)#56 | 4.1%(+5.83)#1,926 |
| 57. | Leslie | 10.0% | 4.8%(+5.14)#57 | 4.1%(+5.80)#1,932 |
| 58. | East Griffin | 10.0% | 4.8%(+5.13)#58 | 4.1%(+5.80)#1,933 |
| 59. | Surrency | 9.8% | 4.8%(+5.00)#59 | 4.1%(+5.67)#1,984 |
| 60. | Fair Oaks | 9.6% | 4.8%(+4.80)#60 | 4.1%(+5.47)#2,069 |
| 61. | Adrian | 9.6% | 4.8%(+4.77)#61 | 4.1%(+5.44)#2,080 |
| 62. | Avalon | 9.6% | 4.8%(+4.75)#62 | 4.1%(+5.42)#2,092 |
| 63. | East Point | 9.5% | 4.8%(+4.64)#63 | 4.1%(+5.30)#2,145 |
| 64. | Thomson | 9.2% | 4.8%(+4.37)#64 | 4.1%(+5.04)#2,272 |
| 65. | Alapaha | 9.2% | 4.8%(+4.34)#65 | 4.1%(+5.00)#2,284 |
| 66. | Monticello | 9.1% | 4.8%(+4.32)#66 | 4.1%(+4.99)#2,291 |
| 67. | College Park | 9.1% | 4.8%(+4.32)#67 | 4.1%(+4.98)#2,295 |
| 68. | Ashburn | 9.1% | 4.8%(+4.31)#68 | 4.1%(+4.98)#2,299 |
| 69. | Ty Ty | 9.1% | 4.8%(+4.31)#69 | 4.1%(+4.97)#2,302 |
| 70. | Shiloh | 9.0% | 4.8%(+4.16)#70 | 4.1%(+4.83)#2,386 |
| 71. | Lakeview Estates | 8.9% | 4.8%(+4.08)#71 | 4.1%(+4.75)#2,431 |
| 72. | Nelson | 8.9% | 4.8%(+4.05)#72 | 4.1%(+4.72)#2,460 |
| 73. | Oak Park | 8.8% | 4.8%(+3.99)#73 | 4.1%(+4.66)#2,490 |
| 74. | Union City | 8.8% | 4.8%(+3.99)#74 | 4.1%(+4.66)#2,491 |
| 75. | Arnoldsville | 8.8% | 4.8%(+3.97)#75 | 4.1%(+4.64)#2,502 |
| 76. | Epworth | 8.6% | 4.8%(+3.74)#76 | 4.1%(+4.41)#2,646 |
| 77. | Cohutta | 8.5% | 4.8%(+3.70)#77 | 4.1%(+4.37)#2,671 |
| 78. | Greensboro | 8.5% | 4.8%(+3.68)#78 | 4.1%(+4.35)#2,680 |
| 79. | Unadilla | 8.5% | 4.8%(+3.67)#79 | 4.1%(+4.33)#2,691 |
| 80. | Glennville | 8.4% | 4.8%(+3.63)#80 | 4.1%(+4.30)#2,703 |
| 81. | Trenton | 8.4% | 4.8%(+3.63)#81 | 4.1%(+4.30)#2,704 |
| 82. | Mountain City | 8.4% | 4.8%(+3.62)#82 | 4.1%(+4.29)#2,711 |
| 83. | East Newnan | 8.4% | 4.8%(+3.57)#83 | 4.1%(+4.24)#2,742 |
| 84. | Deenwood | 8.4% | 4.8%(+3.56)#84 | 4.1%(+4.23)#2,747 |
| 85. | Statham | 8.4% | 4.8%(+3.55)#85 | 4.1%(+4.21)#2,754 |
| 86. | Byromville | 8.3% | 4.8%(+3.48)#86 | 4.1%(+4.15)#2,810 |
| 87. | Blue Ridge | 8.2% | 4.8%(+3.40)#87 | 4.1%(+4.07)#2,857 |
| 88. | Tallapoosa | 8.2% | 4.8%(+3.35)#88 | 4.1%(+4.02)#2,892 |
| 89. | Americus | 8.1% | 4.8%(+3.33)#89 | 4.1%(+4.00)#2,901 |
| 90. | Country Club Estates | 8.1% | 4.8%(+3.26)#90 | 4.1%(+3.93)#2,938 |
| 91. | Rochelle | 8.1% | 4.8%(+3.26)#91 | 4.1%(+3.92)#2,943 |
| 92. | Register | 8.1% | 4.8%(+3.25)#92 | 4.1%(+3.91)#2,954 |
| 93. | Harrison | 8.0% | 4.8%(+3.22)#93 | 4.1%(+3.89)#2,970 |
| 94. | Augusta-Richmond County Consolidated Government (Balance) | 8.0% | 4.8%(+3.19)#94 | 4.1%(+3.86)#2,983 |
| 95. | Forest Park | 7.9% | 4.8%(+3.12)#95 | 4.1%(+3.78)#3,044 |
| 96. | Hahira | 7.9% | 4.8%(+3.11)#96 | 4.1%(+3.78)#3,048 |
| 97. | East Dublin | 7.8% | 4.8%(+3.01)#97 | 4.1%(+3.68)#3,128 |
| 98. | Sunny Side | 7.8% | 4.8%(+3.00)#98 | 4.1%(+3.66)#3,135 |
| 99. | Gumlog | 7.7% | 4.8%(+2.86)#99 | 4.1%(+3.53)#3,244 |
| 100. | Candler Mcafee | 7.6% | 4.8%(+2.83)#100 | 4.1%(+3.49)#3,274 |
Common Questions
What are the Top 10 Cities with the Highest Percentage of Population Employed in Administrative & Support Services in Georgia?
Top 10 Cities with the Highest Percentage of Population Employed in Administrative & Support Services in Georgia are:
#1
58.1%
#2
33.0%
#3
26.9%
#4
24.5%
#5
19.4%
#6
18.9%
#7
18.9%
#8
18.4%
#9
17.1%
#10
16.1%
What city has the Highest Percentage of Population Employed in Administrative & Support Services in Georgia?
De Soto has the Highest Percentage of Population Employed in Administrative & Support Services in Georgia with 58.1%.
What is the Percentage of Population Employed in Administrative & Support Services in the State of Georgia?
Percentage of Population Employed in Administrative & Support Services in Georgia is 4.8%.
What is the Percentage of Population Employed in Administrative & Support Services in the United States?
Percentage of Population Employed in Administrative & Support Services in the United States is 4.1%.