Linwood, PA Map & Demographics
Linwood Map
Linwood Overview
$32,203
PER CAPITA INCOME
$80,238
AVG FAMILY INCOME
$69,728
AVG HOUSEHOLD INCOME
17.1%
WAGE / INCOME GAP [ % ]
82.9¢/ $1
WAGE / INCOME GAP [ $ ]
0.39
INEQUALITY / GINI INDEX
3,287
TOTAL POPULATION
1,334
MALE POPULATION
1,953
FEMALE POPULATION
68.31
MALES / 100 FEMALES
146.40
FEMALES / 100 MALES
41.2
MEDIAN AGE
2.7
AVG FAMILY SIZE
2.4
AVG HOUSEHOLD SIZE
2,075
LABOR FORCE [ PEOPLE ]
75.3%
PERCENT IN LABOR FORCE
7.2%
UNEMPLOYMENT RATE
Linwood Area Codes
Income in Linwood
Income Overview in Linwood
Per Capita Income in Linwood is $32,203, while median incomes of families and households are $80,238 and $69,728 respectively.
| Characteristic | Number | Measure |
| Per Capita Income | 3,287 | $32,203 |
| Median Family Income | 960 | $80,238 |
| Mean Family Income | 960 | $80,076 |
| Median Household Income | 1,379 | $69,728 |
| Mean Household Income | 1,379 | $73,611 |
| Income Deficit | 960 | $0 |
| Wage / Income Gap (%) | 3,287 | 17.12% |
| Wage / Income Gap ($) | 3,287 | 82.88¢ per $1 |
| Gini / Inequality Index | 3,287 | 0.39 |
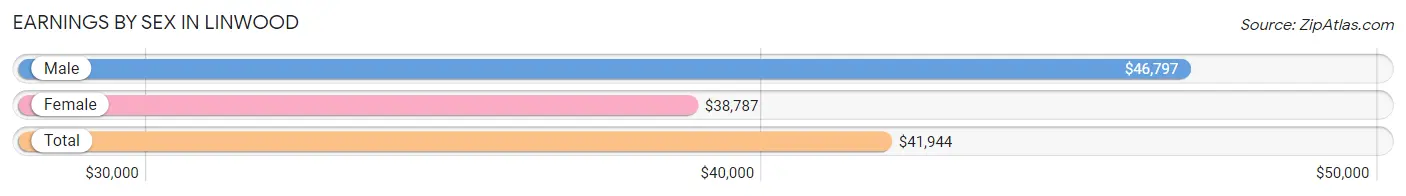
Earnings by Sex in Linwood
Average Earnings in Linwood are $41,944, $46,797 for men and $38,787 for women, a difference of 17.1%.
| Sex | Number | Average Earnings |
| Male | 859 (42.7%) | $46,797 |
| Female | 1,153 (57.3%) | $38,787 |
| Total | 2,012 (100.0%) | $41,944 |
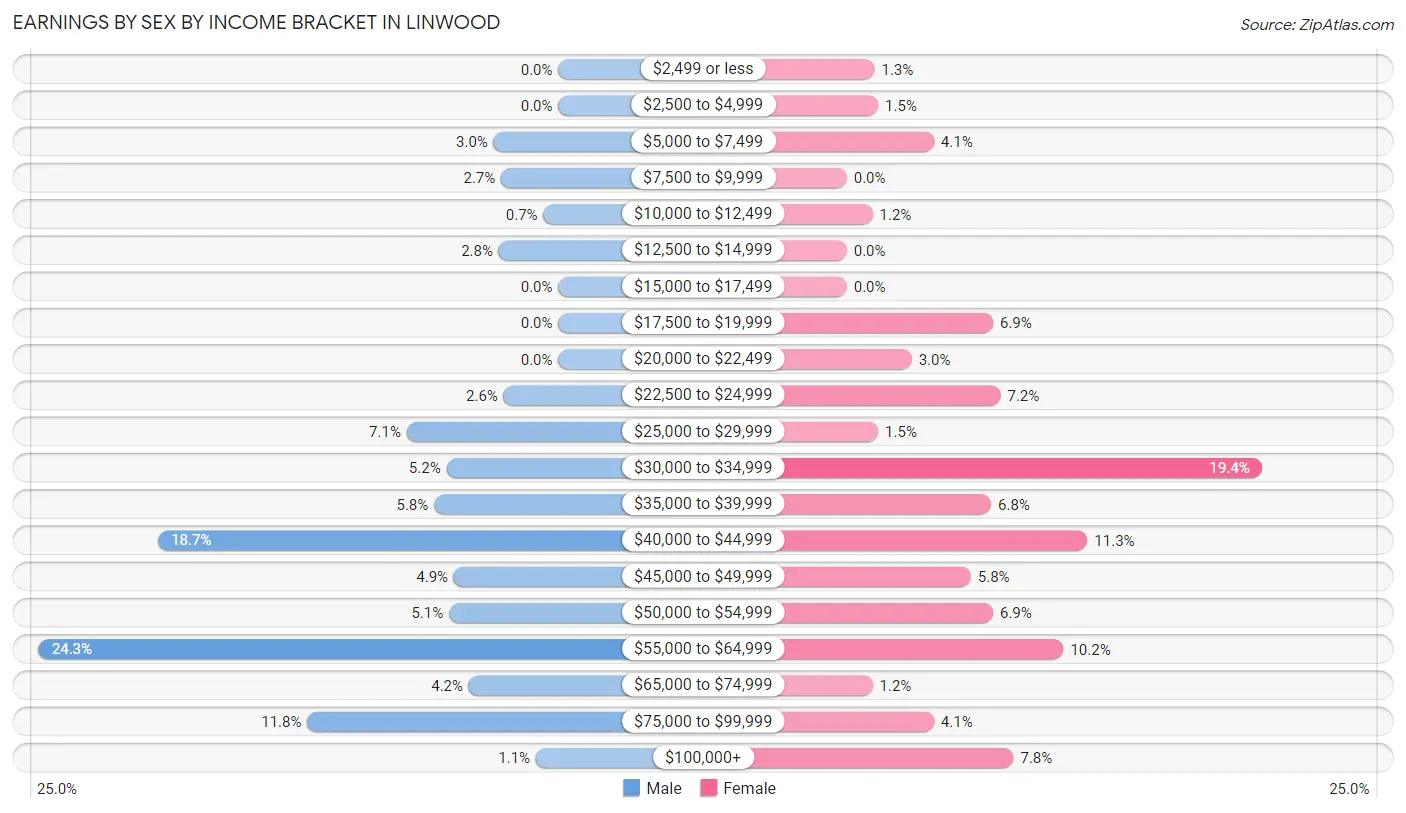
Earnings by Sex by Income Bracket in Linwood
The most common earnings brackets in Linwood are $55,000 to $64,999 for men (209 | 24.3%) and $30,000 to $34,999 for women (224 | 19.4%).
| Income | Male | Female |
| $2,499 or less | 0 (0.0%) | 15 (1.3%) |
| $2,500 to $4,999 | 0 (0.0%) | 17 (1.5%) |
| $5,000 to $7,499 | 26 (3.0%) | 47 (4.1%) |
| $7,500 to $9,999 | 23 (2.7%) | 0 (0.0%) |
| $10,000 to $12,499 | 6 (0.7%) | 14 (1.2%) |
| $12,500 to $14,999 | 24 (2.8%) | 0 (0.0%) |
| $15,000 to $17,499 | 0 (0.0%) | 0 (0.0%) |
| $17,500 to $19,999 | 0 (0.0%) | 79 (6.9%) |
| $20,000 to $22,499 | 0 (0.0%) | 35 (3.0%) |
| $22,500 to $24,999 | 22 (2.6%) | 83 (7.2%) |
| $25,000 to $29,999 | 61 (7.1%) | 17 (1.5%) |
| $30,000 to $34,999 | 45 (5.2%) | 224 (19.4%) |
| $35,000 to $39,999 | 50 (5.8%) | 78 (6.8%) |
| $40,000 to $44,999 | 161 (18.7%) | 130 (11.3%) |
| $45,000 to $49,999 | 42 (4.9%) | 67 (5.8%) |
| $50,000 to $54,999 | 44 (5.1%) | 79 (6.9%) |
| $55,000 to $64,999 | 209 (24.3%) | 117 (10.2%) |
| $65,000 to $74,999 | 36 (4.2%) | 14 (1.2%) |
| $75,000 to $99,999 | 101 (11.8%) | 47 (4.1%) |
| $100,000+ | 9 (1.1%) | 90 (7.8%) |
| Total | 859 (100.0%) | 1,153 (100.0%) |
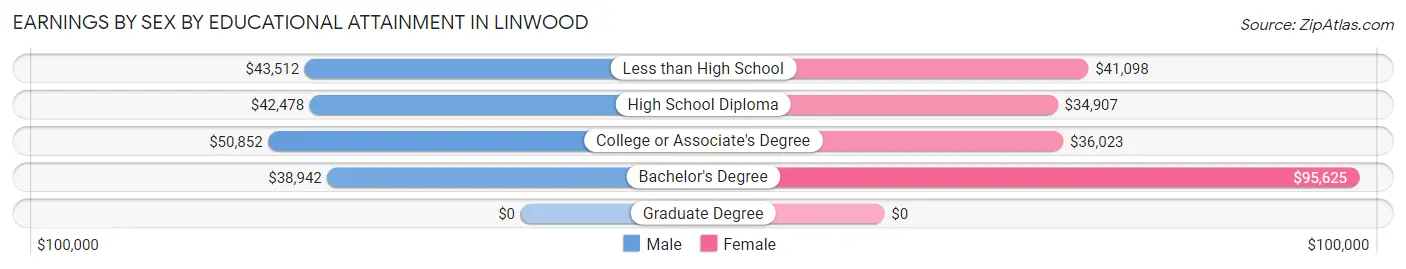
Earnings by Sex by Educational Attainment in Linwood
Average earnings in Linwood are $43,139 for men and $39,795 for women, a difference of 7.7%. Men with an educational attainment of college or associate's degree enjoy the highest average annual earnings of $50,852, while those with bachelor's degree education earn the least with $38,942. Women with an educational attainment of bachelor's degree earn the most with the average annual earnings of $95,625, while those with high school diploma education have the smallest earnings of $34,907.
| Educational Attainment | Male Income | Female Income |
| Less than High School | $43,512 | $41,098 |
| High School Diploma | $42,478 | $34,907 |
| College or Associate's Degree | $50,852 | $36,023 |
| Bachelor's Degree | $38,942 | $95,625 |
| Graduate Degree | - | - |
| Total | $43,139 | $39,795 |
Family Income in Linwood
Family Income Brackets in Linwood
According to the Linwood family income data, there are 272 families falling into the $75,000 to $99,999 income range, which is the most common income bracket and makes up 28.3% of all families.
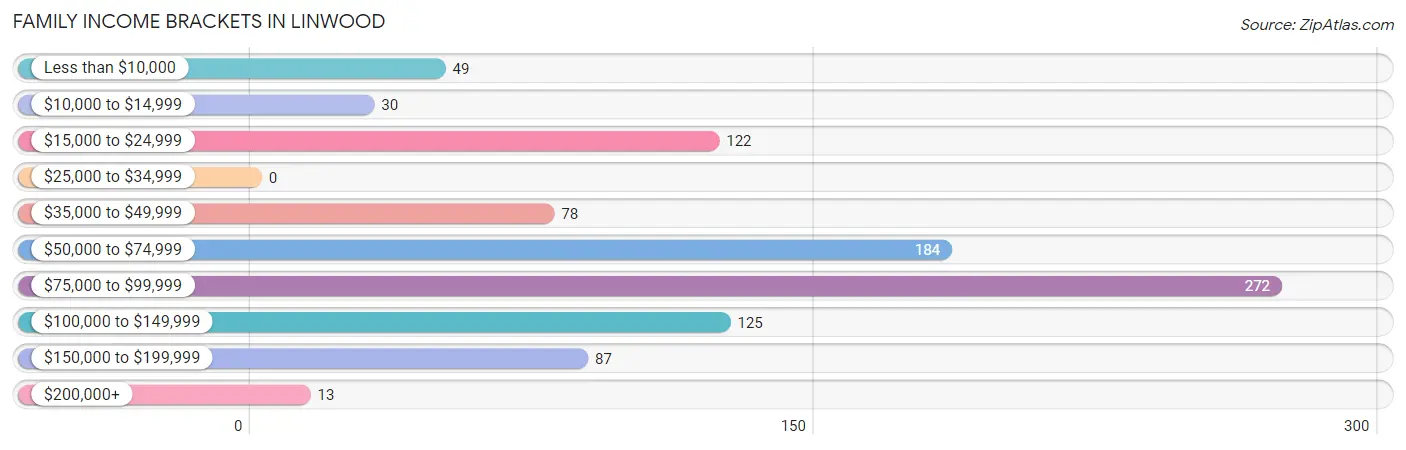
| Income Bracket | # Families | % Families |
| Less than $10,000 | 49 | 5.1% |
| $10,000 to $14,999 | 30 | 3.1% |
| $15,000 to $24,999 | 122 | 12.7% |
| $25,000 to $34,999 | 0 | 0.0% |
| $35,000 to $49,999 | 78 | 8.1% |
| $50,000 to $74,999 | 184 | 19.2% |
| $75,000 to $99,999 | 272 | 28.3% |
| $100,000 to $149,999 | 125 | 13.0% |
| $150,000 to $199,999 | 87 | 9.1% |
| $200,000+ | 13 | 1.4% |
Family Income by Famaliy Size in Linwood
2-person families (559 | 58.2%) account for the highest median family income in Linwood with $89,063 per family, while 2-person families (559 | 58.2%) have the highest median income of $44,532 per family member.
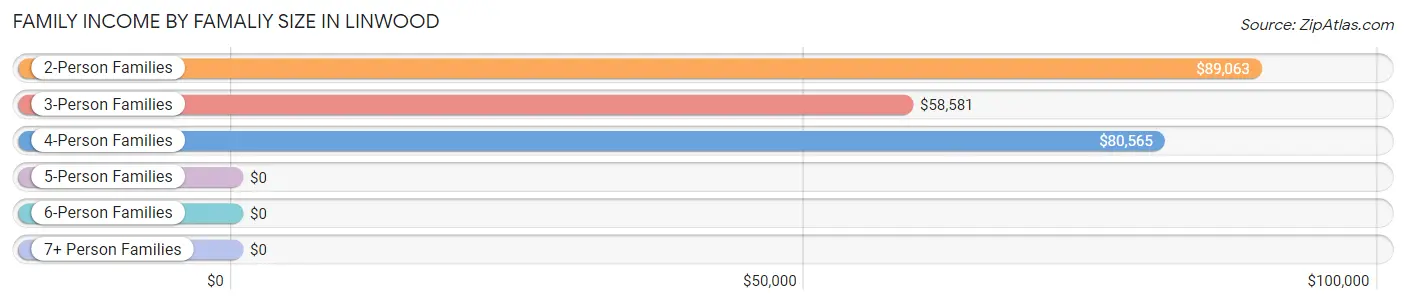
| Income Bracket | # Families | Median Income |
| 2-Person Families | 559 (58.2%) | $89,063 |
| 3-Person Families | 230 (24.0%) | $58,581 |
| 4-Person Families | 145 (15.1%) | $80,565 |
| 5-Person Families | 13 (1.3%) | $0 |
| 6-Person Families | 0 (0.0%) | $0 |
| 7+ Person Families | 13 (1.3%) | $0 |
| Total | 960 (100.0%) | $80,238 |
Family Income by Number of Earners in Linwood
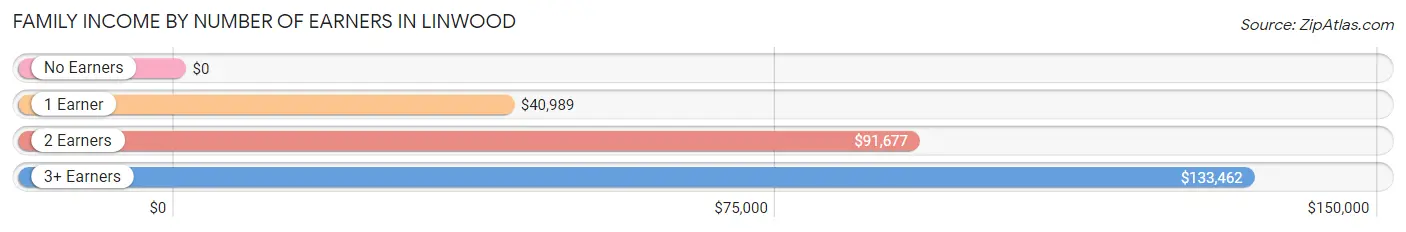
| Number of Earners | # Families | Median Income |
| No Earners | 61 (6.4%) | $0 |
| 1 Earner | 369 (38.4%) | $40,989 |
| 2 Earners | 488 (50.8%) | $91,677 |
| 3+ Earners | 42 (4.4%) | $133,462 |
| Total | 960 (100.0%) | $80,238 |
Household Income in Linwood
Household Income Brackets in Linwood
With 319 households falling in the category, the $50,000 to $74,999 income range is the most frequent in Linwood, accounting for 23.1% of all households. In contrast, only 44 households (3.2%) fall into the $10,000 to $14,999 income bracket, making it the least populous group.
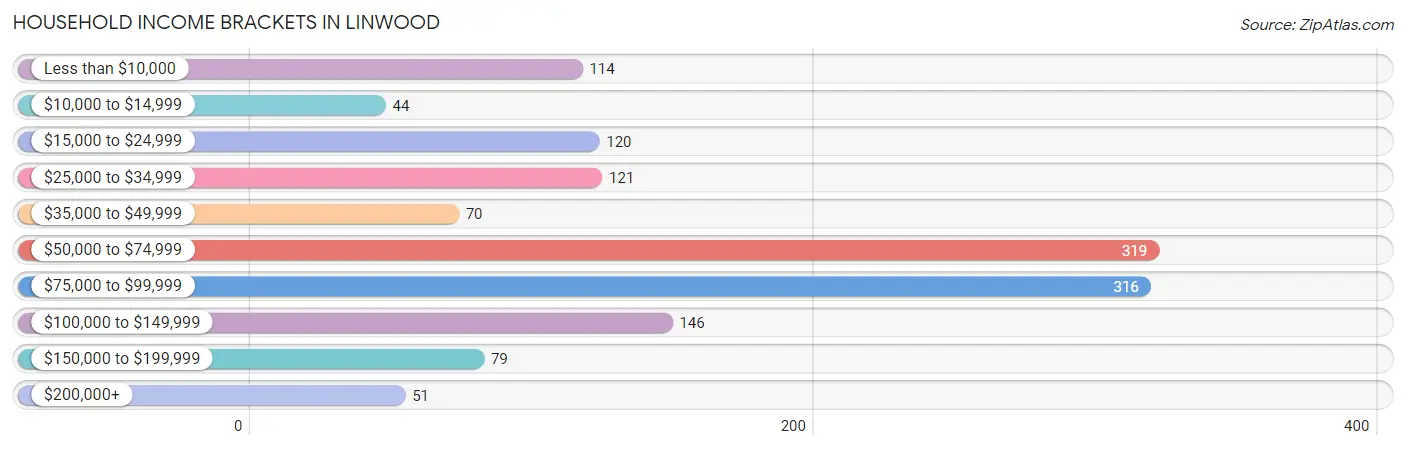
| Income Bracket | # Households | % Households |
| Less than $10,000 | 114 | 8.3% |
| $10,000 to $14,999 | 44 | 3.2% |
| $15,000 to $24,999 | 120 | 8.7% |
| $25,000 to $34,999 | 121 | 8.8% |
| $35,000 to $49,999 | 70 | 5.1% |
| $50,000 to $74,999 | 319 | 23.1% |
| $75,000 to $99,999 | 316 | 22.9% |
| $100,000 to $149,999 | 146 | 10.6% |
| $150,000 to $199,999 | 79 | 5.7% |
| $200,000+ | 51 | 3.7% |
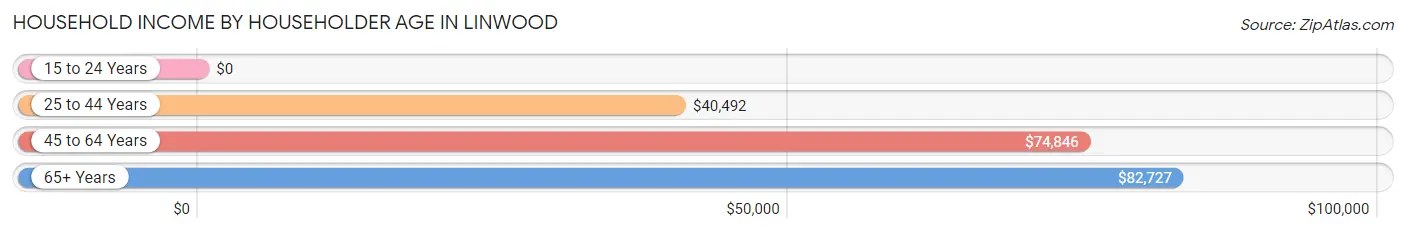
Household Income by Householder Age in Linwood
The median household income in Linwood is $69,728, with the highest median household income of $82,727 found in the 65+ years age bracket for the primary householder. A total of 234 households (17.0%) fall into this category.
| Income Bracket | # Households | Median Income |
| 15 to 24 Years | 0 (0.0%) | $0 |
| 25 to 44 Years | 377 (27.3%) | $40,492 |
| 45 to 64 Years | 768 (55.7%) | $74,846 |
| 65+ Years | 234 (17.0%) | $82,727 |
| Total | 1,379 (100.0%) | $69,728 |
Poverty in Linwood
Income Below Poverty by Sex and Age in Linwood
With 12.7% poverty level for males and 18.3% for females among the residents of Linwood, 15 year old males and 5 year old females are the most vulnerable to poverty, with 15 males (100.0%) and 54 females (100.0%) in their respective age groups living below the poverty level.
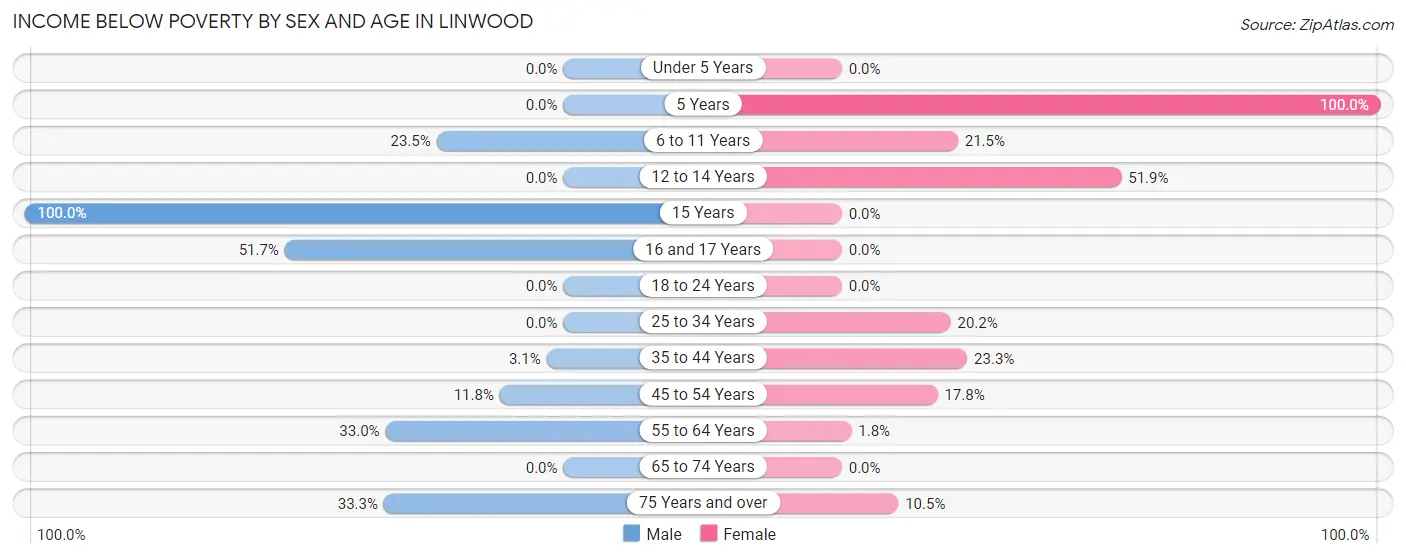
| Age Bracket | Male | Female |
| Under 5 Years | 0 (0.0%) | 0 (0.0%) |
| 5 Years | 0 (0.0%) | 54 (100.0%) |
| 6 to 11 Years | 20 (23.5%) | 31 (21.5%) |
| 12 to 14 Years | 0 (0.0%) | 69 (51.9%) |
| 15 Years | 15 (100.0%) | 0 (0.0%) |
| 16 and 17 Years | 15 (51.7%) | 0 (0.0%) |
| 18 to 24 Years | 0 (0.0%) | 0 (0.0%) |
| 25 to 34 Years | 0 (0.0%) | 66 (20.2%) |
| 35 to 44 Years | 6 (3.1%) | 64 (23.3%) |
| 45 to 54 Years | 32 (11.8%) | 54 (17.8%) |
| 55 to 64 Years | 72 (33.0%) | 6 (1.8%) |
| 65 to 74 Years | 0 (0.0%) | 0 (0.0%) |
| 75 Years and over | 10 (33.3%) | 13 (10.5%) |
| Total | 170 (12.7%) | 357 (18.3%) |
Income Above Poverty by Sex and Age in Linwood
According to the poverty statistics in Linwood, males aged 5 years and females aged under 5 years are the age groups that are most secure financially, with 100.0% of males and 100.0% of females in these age groups living above the poverty line.
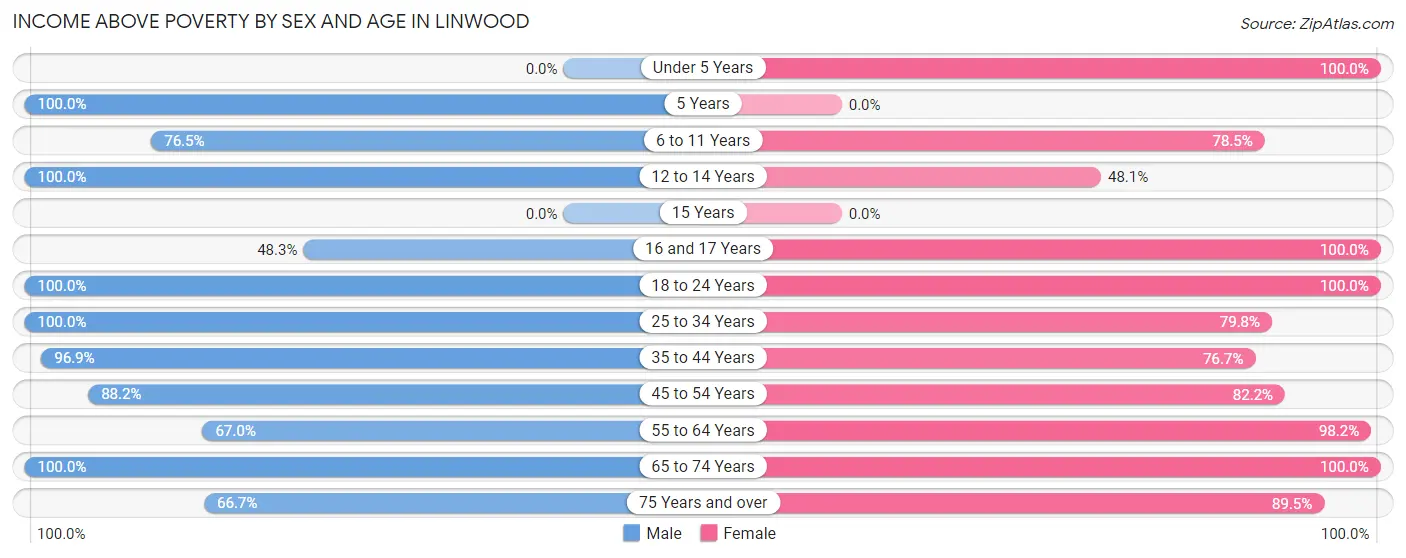
| Age Bracket | Male | Female |
| Under 5 Years | 0 (0.0%) | 63 (100.0%) |
| 5 Years | 14 (100.0%) | 0 (0.0%) |
| 6 to 11 Years | 65 (76.5%) | 113 (78.5%) |
| 12 to 14 Years | 23 (100.0%) | 64 (48.1%) |
| 15 Years | 0 (0.0%) | 0 (0.0%) |
| 16 and 17 Years | 14 (48.3%) | 42 (100.0%) |
| 18 to 24 Years | 237 (100.0%) | 56 (100.0%) |
| 25 to 34 Years | 143 (100.0%) | 261 (79.8%) |
| 35 to 44 Years | 186 (96.9%) | 211 (76.7%) |
| 45 to 54 Years | 239 (88.2%) | 250 (82.2%) |
| 55 to 64 Years | 146 (67.0%) | 333 (98.2%) |
| 65 to 74 Years | 77 (100.0%) | 92 (100.0%) |
| 75 Years and over | 20 (66.7%) | 111 (89.5%) |
| Total | 1,164 (87.3%) | 1,596 (81.7%) |
Income Below Poverty Among Married-Couple Families in Linwood
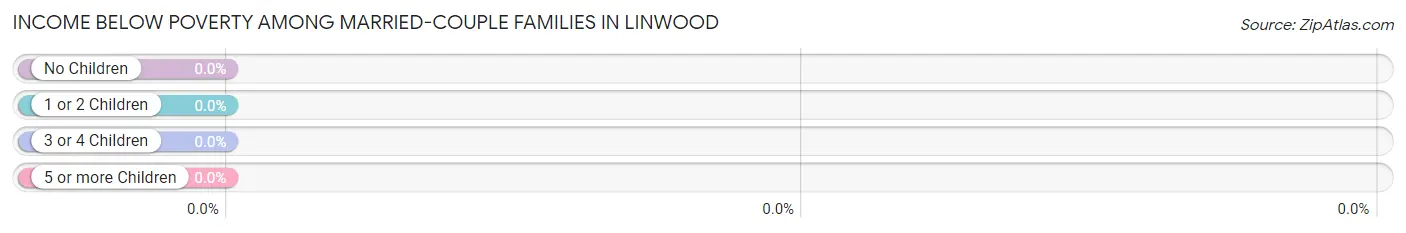
| Children | Above Poverty | Below Poverty |
| No Children | 253 (100.0%) | 0 (0.0%) |
| 1 or 2 Children | 84 (100.0%) | 0 (0.0%) |
| 3 or 4 Children | 0 (0.0%) | 0 (0.0%) |
| 5 or more Children | 0 (0.0%) | 0 (0.0%) |
| Total | 337 (100.0%) | 0 (0.0%) |
Income Below Poverty Among Single-Parent Households in Linwood
According to the poverty data in Linwood, 59.7% or 37 single-father households and 19.3% or 108 single-mother households are living below the poverty line. Among single-father households, those with 1 or 2 children have the highest poverty rate, with 24 households (66.7%) experiencing poverty. Likewise, among single-mother households, those with 1 or 2 children have the highest poverty rate, with 88 households (37.9%) falling below the poverty line.
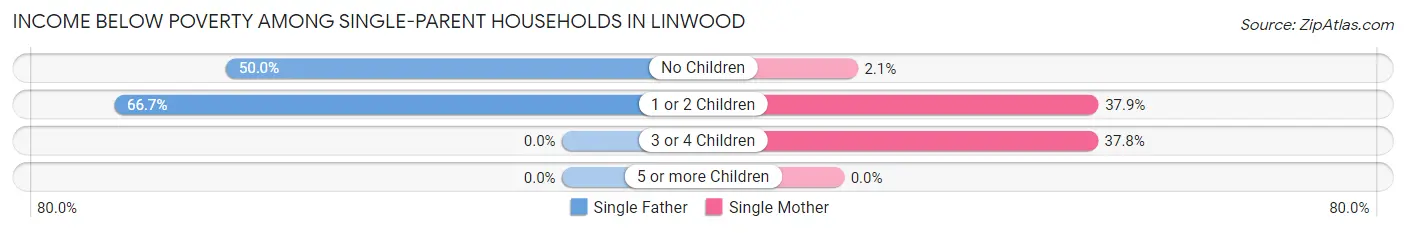
| Children | Single Father | Single Mother |
| No Children | 13 (50.0%) | 6 (2.1%) |
| 1 or 2 Children | 24 (66.7%) | 88 (37.9%) |
| 3 or 4 Children | 0 (0.0%) | 14 (37.8%) |
| 5 or more Children | 0 (0.0%) | 0 (0.0%) |
| Total | 37 (59.7%) | 108 (19.3%) |
Income Below Poverty Among Married-Couple vs Single-Parent Households in Linwood
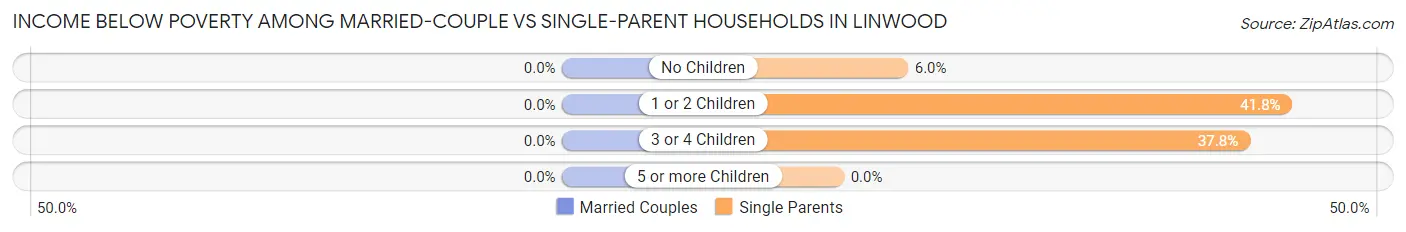
| Children | Married-Couple Families | Single-Parent Households |
| No Children | 0 (0.0%) | 19 (6.0%) |
| 1 or 2 Children | 0 (0.0%) | 112 (41.8%) |
| 3 or 4 Children | 0 (0.0%) | 14 (37.8%) |
| 5 or more Children | 0 (0.0%) | 0 (0.0%) |
| Total | 0 (0.0%) | 145 (23.3%) |
Race in Linwood
The most populous races in Linwood are White / Caucasian (2,715 | 82.6%), Black / African American (377 | 11.5%), and Two or more Races (152 | 4.6%).
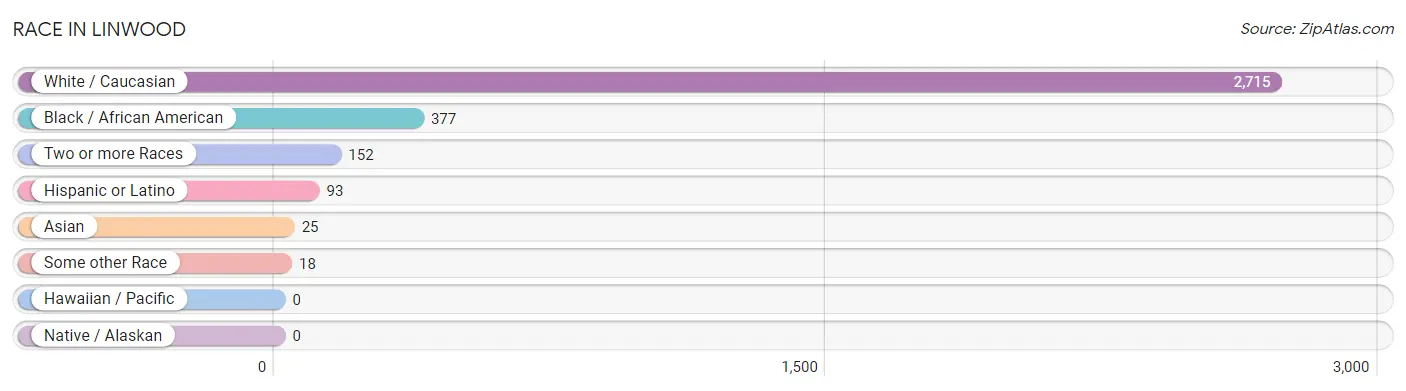
| Race | # Population | % Population |
| Asian | 25 | 0.8% |
| Black / African American | 377 | 11.5% |
| Hawaiian / Pacific | 0 | 0.0% |
| Hispanic or Latino | 93 | 2.8% |
| Native / Alaskan | 0 | 0.0% |
| White / Caucasian | 2,715 | 82.6% |
| Two or more Races | 152 | 4.6% |
| Some other Race | 18 | 0.5% |
| Total | 3,287 | 100.0% |
Ancestry in Linwood
The most populous ancestries reported in Linwood are German (700 | 21.3%), Irish (624 | 19.0%), English (305 | 9.3%), Italian (168 | 5.1%), and Scottish (102 | 3.1%), together accounting for 57.8% of all Linwood residents.
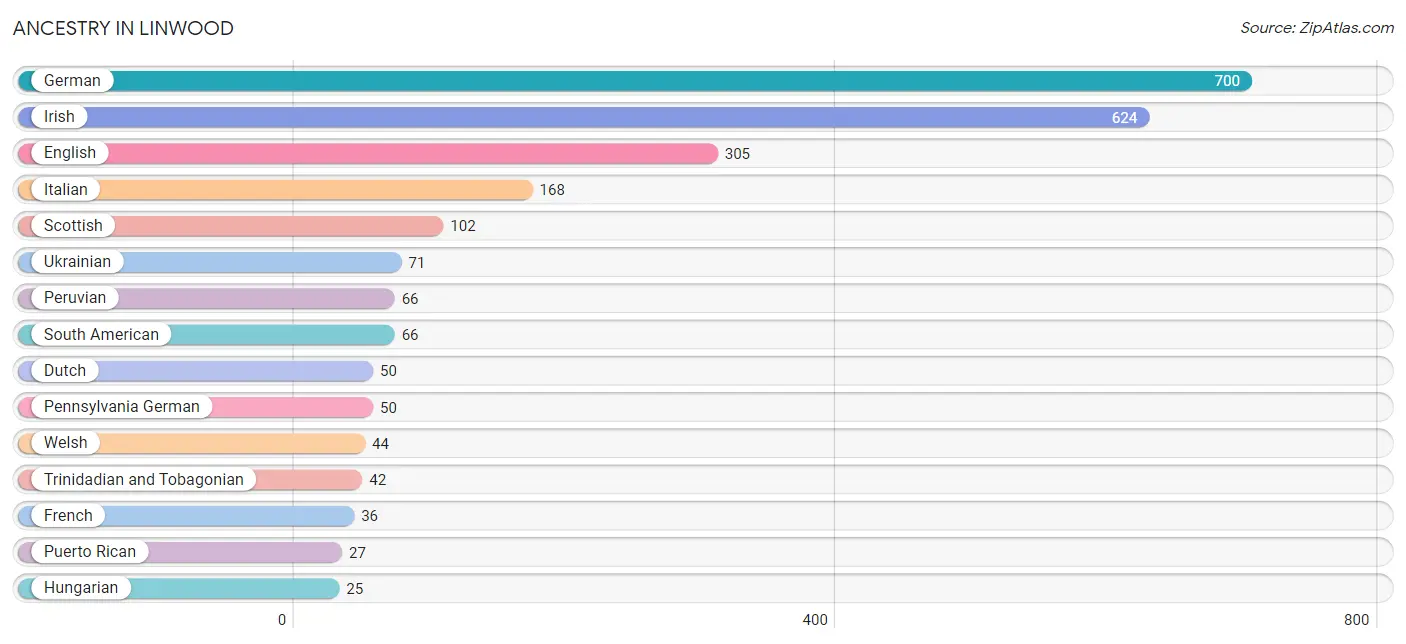
| Ancestry | # Population | % Population |
| American | 6 | 0.2% |
| Bhutanese | 10 | 0.3% |
| British | 13 | 0.4% |
| Cherokee | 12 | 0.4% |
| Dutch | 50 | 1.5% |
| English | 305 | 9.3% |
| French | 36 | 1.1% |
| German | 700 | 21.3% |
| Hungarian | 25 | 0.8% |
| Irish | 624 | 19.0% |
| Italian | 168 | 5.1% |
| Japanese | 25 | 0.8% |
| Pennsylvania German | 50 | 1.5% |
| Peruvian | 66 | 2.0% |
| Polish | 24 | 0.7% |
| Puerto Rican | 27 | 0.8% |
| Russian | 12 | 0.4% |
| Scottish | 102 | 3.1% |
| South American | 66 | 2.0% |
| Swedish | 8 | 0.2% |
| Trinidadian and Tobagonian | 42 | 1.3% |
| Ukrainian | 71 | 2.2% |
| Welsh | 44 | 1.3% |
| West Indian | 14 | 0.4% | View All 24 Rows |
Immigrants in Linwood
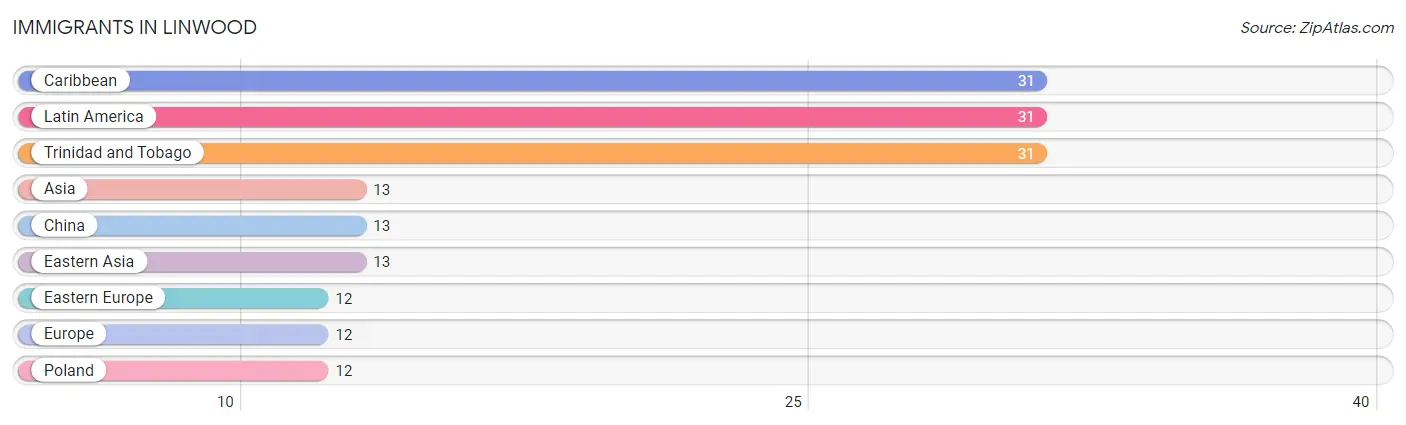
The most numerous immigrant groups reported in Linwood came from Caribbean (31 | 0.9%), Latin America (31 | 0.9%), Trinidad and Tobago (31 | 0.9%), Asia (13 | 0.4%), and China (13 | 0.4%), together accounting for 3.6% of all Linwood residents.
| Immigration Origin | # Population | % Population |
| Asia | 13 | 0.4% |
| Caribbean | 31 | 0.9% |
| China | 13 | 0.4% |
| Eastern Asia | 13 | 0.4% |
| Eastern Europe | 12 | 0.4% |
| Europe | 12 | 0.4% |
| Latin America | 31 | 0.9% |
| Poland | 12 | 0.4% |
| Trinidad and Tobago | 31 | 0.9% | View All 9 Rows |
Sex and Age in Linwood
Sex and Age in Linwood
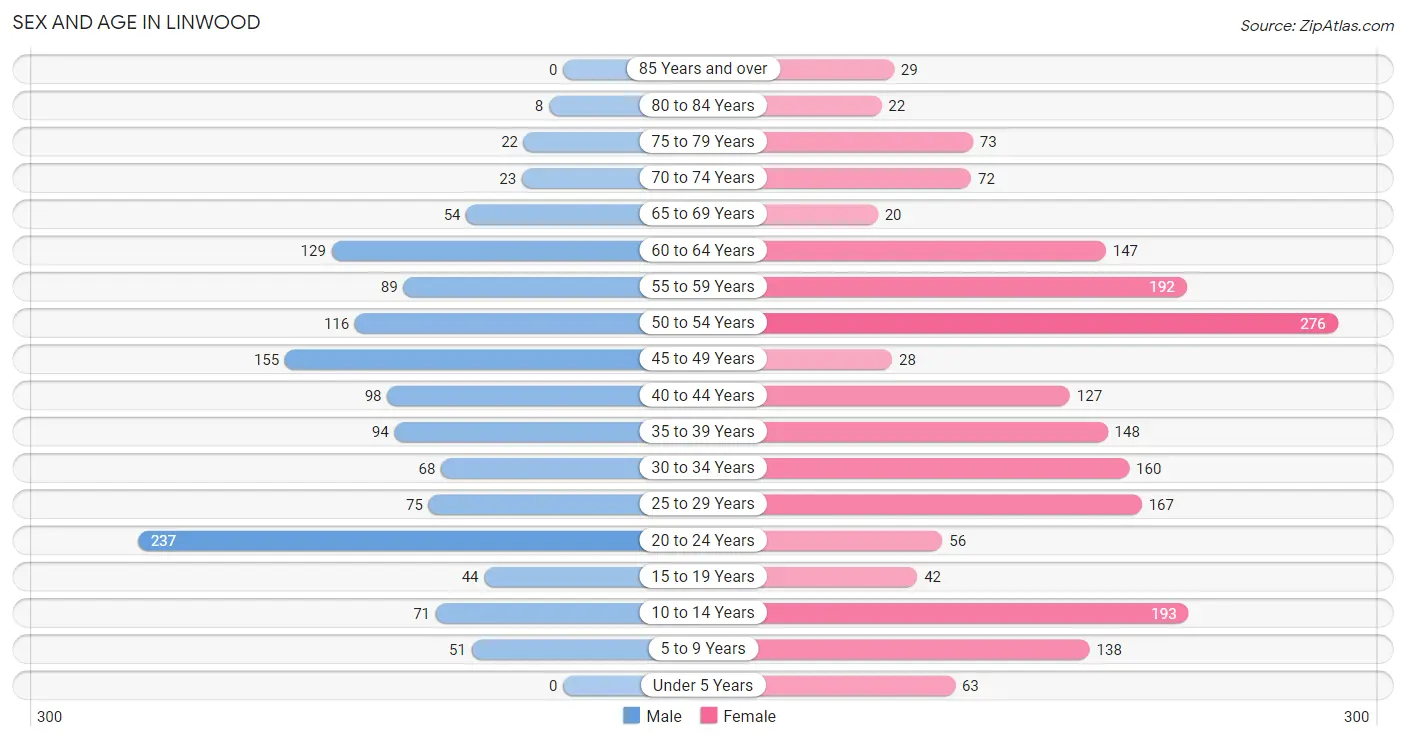
The most populous age groups in Linwood are 20 to 24 Years (237 | 17.8%) for men and 50 to 54 Years (276 | 14.1%) for women.
| Age Bracket | Male | Female |
| Under 5 Years | 0 (0.0%) | 63 (3.2%) |
| 5 to 9 Years | 51 (3.8%) | 138 (7.1%) |
| 10 to 14 Years | 71 (5.3%) | 193 (9.9%) |
| 15 to 19 Years | 44 (3.3%) | 42 (2.1%) |
| 20 to 24 Years | 237 (17.8%) | 56 (2.9%) |
| 25 to 29 Years | 75 (5.6%) | 167 (8.6%) |
| 30 to 34 Years | 68 (5.1%) | 160 (8.2%) |
| 35 to 39 Years | 94 (7.0%) | 148 (7.6%) |
| 40 to 44 Years | 98 (7.3%) | 127 (6.5%) |
| 45 to 49 Years | 155 (11.6%) | 28 (1.4%) |
| 50 to 54 Years | 116 (8.7%) | 276 (14.1%) |
| 55 to 59 Years | 89 (6.7%) | 192 (9.8%) |
| 60 to 64 Years | 129 (9.7%) | 147 (7.5%) |
| 65 to 69 Years | 54 (4.1%) | 20 (1.0%) |
| 70 to 74 Years | 23 (1.7%) | 72 (3.7%) |
| 75 to 79 Years | 22 (1.7%) | 73 (3.7%) |
| 80 to 84 Years | 8 (0.6%) | 22 (1.1%) |
| 85 Years and over | 0 (0.0%) | 29 (1.5%) |
| Total | 1,334 (100.0%) | 1,953 (100.0%) |
Families and Households in Linwood
Median Family Size in Linwood
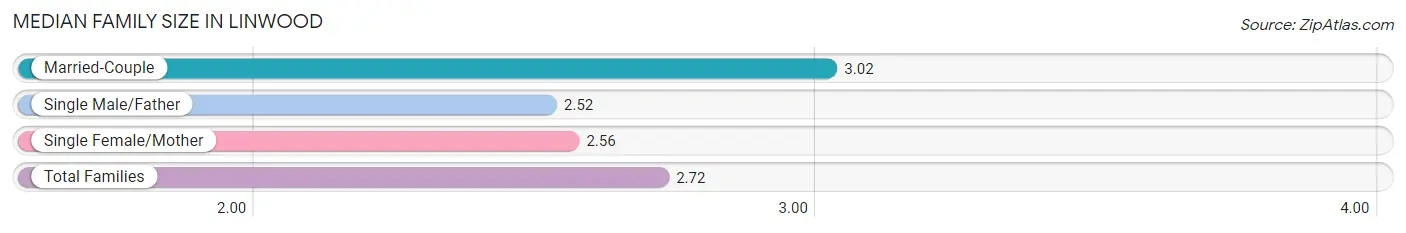
The median family size in Linwood is 2.72 persons per family, with married-couple families (337 | 35.1%) accounting for the largest median family size of 3.02 persons per family. On the other hand, single male/father families (62 | 6.5%) represent the smallest median family size with 2.52 persons per family.
| Family Type | # Families | Family Size |
| Married-Couple | 337 (35.1%) | 3.02 |
| Single Male/Father | 62 (6.5%) | 2.52 |
| Single Female/Mother | 561 (58.4%) | 2.56 |
| Total Families | 960 (100.0%) | 2.72 |
Median Household Size in Linwood
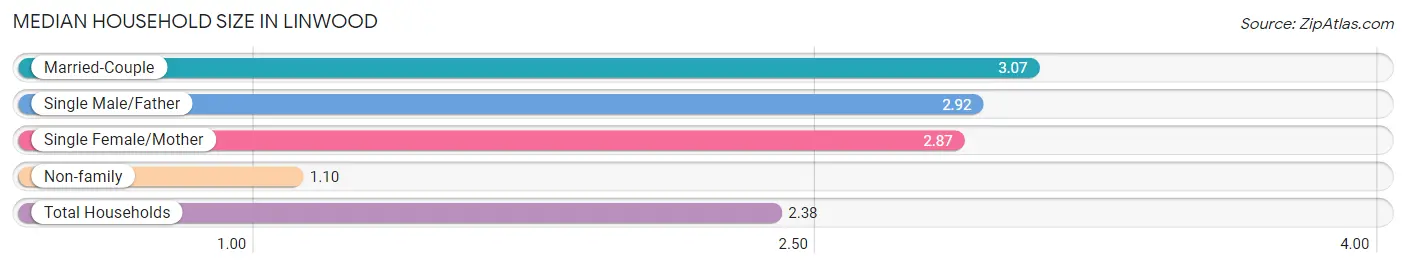
The median household size in Linwood is 2.38 persons per household, with married-couple households (337 | 24.4%) accounting for the largest median household size of 3.07 persons per household. non-family households (419 | 30.4%) represent the smallest median household size with 1.10 persons per household.
| Household Type | # Households | Household Size |
| Married-Couple | 337 (24.4%) | 3.07 |
| Single Male/Father | 62 (4.5%) | 2.92 |
| Single Female/Mother | 561 (40.7%) | 2.87 |
| Non-family | 419 (30.4%) | 1.10 |
| Total Households | 1,379 (100.0%) | 2.38 |
Household Size by Marriage Status in Linwood
Out of a total of 1,379 households in Linwood, 960 (69.6%) are family households, while 419 (30.4%) are nonfamily households. The most numerous type of family households are 2-person households, comprising 470, and the most common type of nonfamily households are 1-person households, comprising 376.
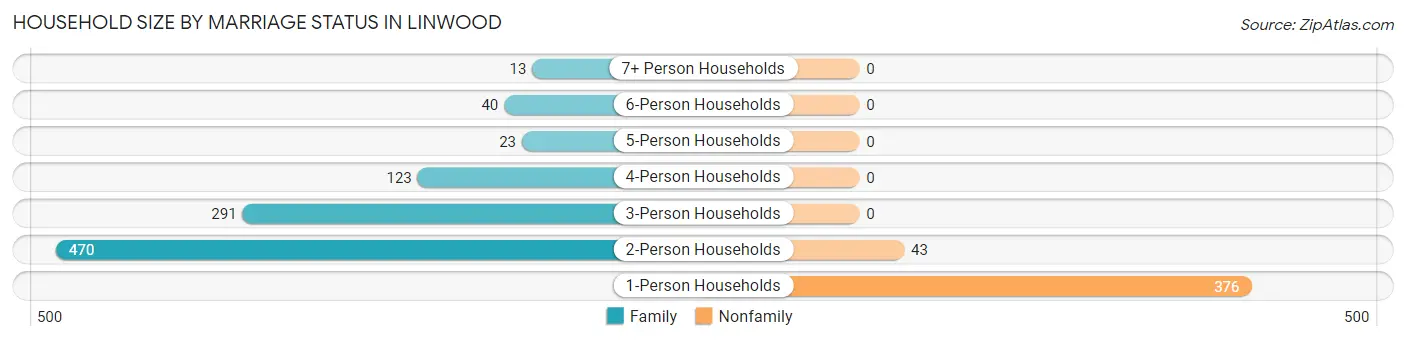
| Household Size | Family Households | Nonfamily Households |
| 1-Person Households | - | 376 (27.3%) |
| 2-Person Households | 470 (34.1%) | 43 (3.1%) |
| 3-Person Households | 291 (21.1%) | 0 (0.0%) |
| 4-Person Households | 123 (8.9%) | 0 (0.0%) |
| 5-Person Households | 23 (1.7%) | 0 (0.0%) |
| 6-Person Households | 40 (2.9%) | 0 (0.0%) |
| 7+ Person Households | 13 (0.9%) | 0 (0.0%) |
| Total | 960 (69.6%) | 419 (30.4%) |
Female Fertility in Linwood
Fertility by Age in Linwood
Average fertility rate in Linwood is 22.0 births per 1,000 women. Women in the age bracket of 20 to 34 years have the highest fertility rate with 44.0 births per 1,000 women. Women in the age bracket of 20 to 34 years acount for 100.0% of all women with births.
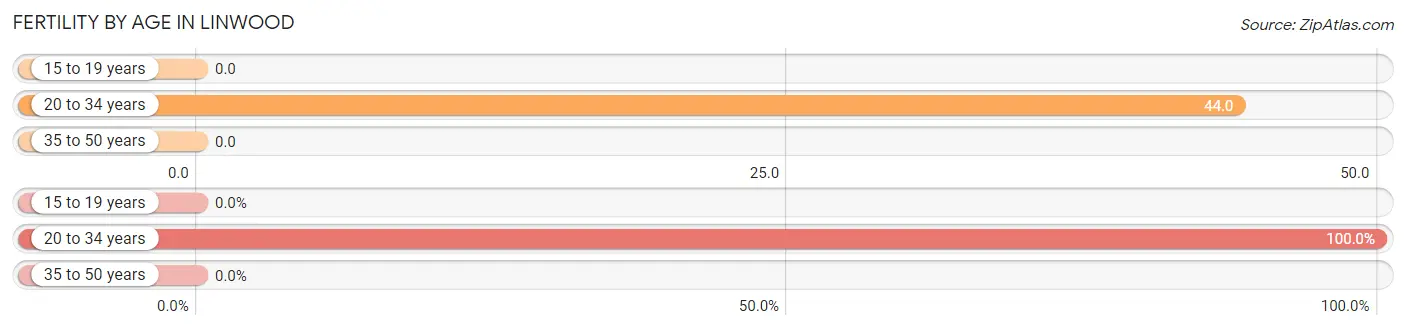
| Age Bracket | Women with Births | Births / 1,000 Women |
| 15 to 19 years | 0 (0.0%) | 0.0 |
| 20 to 34 years | 17 (100.0%) | 44.0 |
| 35 to 50 years | 0 (0.0%) | 0.0 |
| Total | 17 (100.0%) | 22.0 |
Fertility by Age by Marriage Status in Linwood
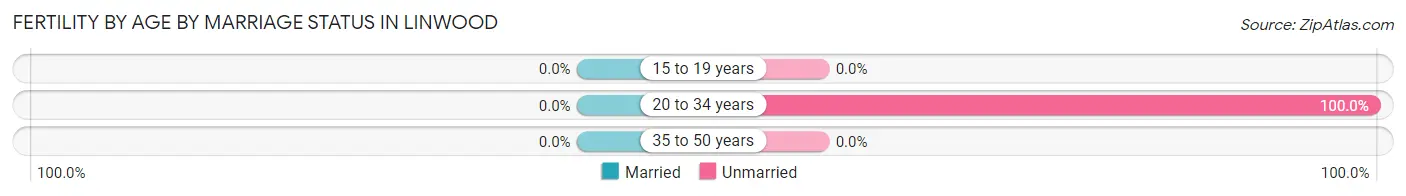
| Age Bracket | Married | Unmarried |
| 15 to 19 years | 0 (0.0%) | 0 (0.0%) |
| 20 to 34 years | 0 (0.0%) | 17 (100.0%) |
| 35 to 50 years | 0 (0.0%) | 0 (0.0%) |
| Total | 0 (0.0%) | 17 (100.0%) |
Fertility by Education in Linwood
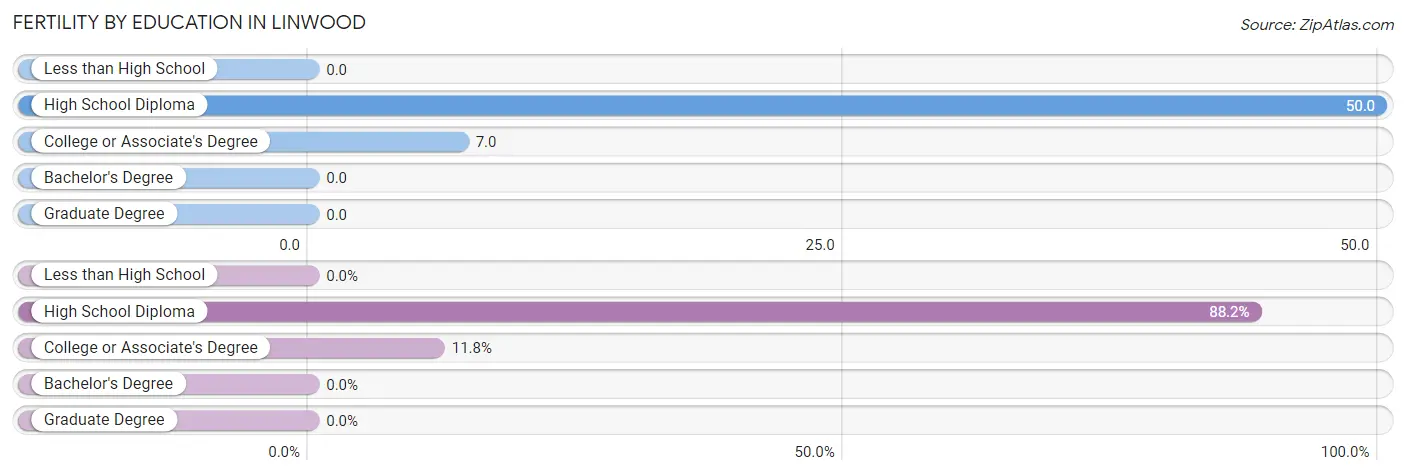
| Educational Attainment | Women with Births | Births / 1,000 Women |
| Less than High School | 0 (0.0%) | 0.0 |
| High School Diploma | 15 (88.2%) | 50.0 |
| College or Associate's Degree | 2 (11.8%) | 7.0 |
| Bachelor's Degree | 0 (0.0%) | 0.0 |
| Graduate Degree | 0 (0.0%) | 0.0 |
| Total | 17 (100.0%) | 22.0 |
Fertility by Education by Marriage Status in Linwood
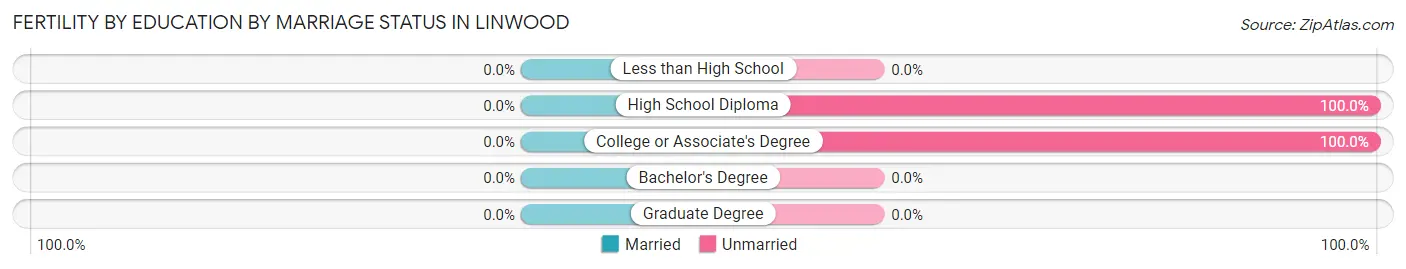
| Educational Attainment | Married | Unmarried |
| Less than High School | 0 (0.0%) | 0 (0.0%) |
| High School Diploma | 0 (0.0%) | 15 (100.0%) |
| College or Associate's Degree | 0 (0.0%) | 2 (100.0%) |
| Bachelor's Degree | 0 (0.0%) | 0 (0.0%) |
| Graduate Degree | 0 (0.0%) | 0 (0.0%) |
| Total | 0 (0.0%) | 17 (100.0%) |
Employment Characteristics in Linwood
Employment by Class of Employer in Linwood
Among the 1,863 employed individuals in Linwood, private company employees (1,419 | 76.2%), local government employees (259 | 13.9%), and not-for-profit organizations (115 | 6.2%) make up the most common classes of employment.
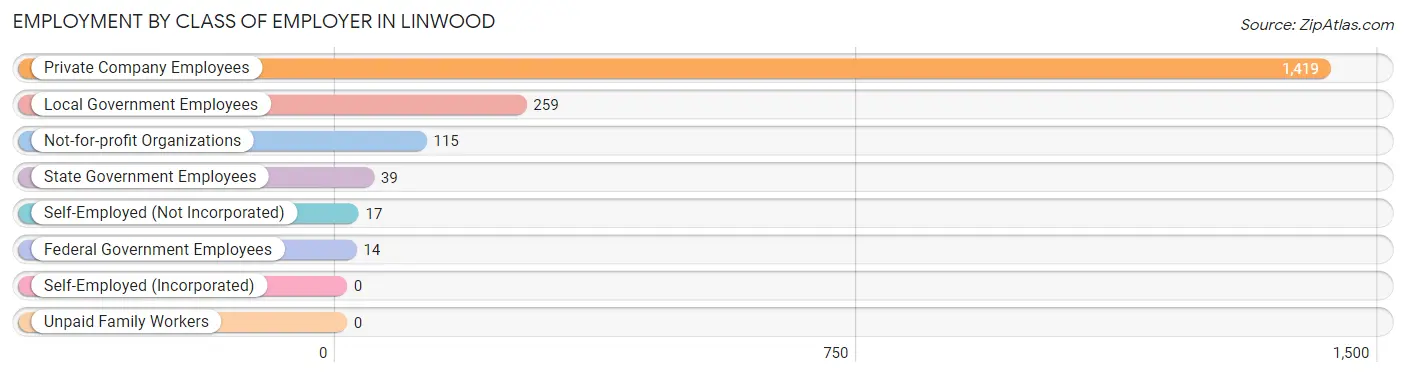
| Employer Class | # Employees | % Employees |
| Private Company Employees | 1,419 | 76.2% |
| Self-Employed (Incorporated) | 0 | 0.0% |
| Self-Employed (Not Incorporated) | 17 | 0.9% |
| Not-for-profit Organizations | 115 | 6.2% |
| Local Government Employees | 259 | 13.9% |
| State Government Employees | 39 | 2.1% |
| Federal Government Employees | 14 | 0.7% |
| Unpaid Family Workers | 0 | 0.0% |
| Total | 1,863 | 100.0% |
Employment Status by Age in Linwood
According to the labor force statistics for Linwood, out of the total population over 16 years of age (2,756), 75.3% or 2,075 individuals are in the labor force, with 7.2% or 149 of them unemployed. The age group with the highest labor force participation rate is 25 to 29 years, with 100.0% or 242 individuals in the labor force. Within the labor force, the 60 to 64 years age range has the highest percentage of unemployed individuals, with 24.6% or 47 of them being unemployed.
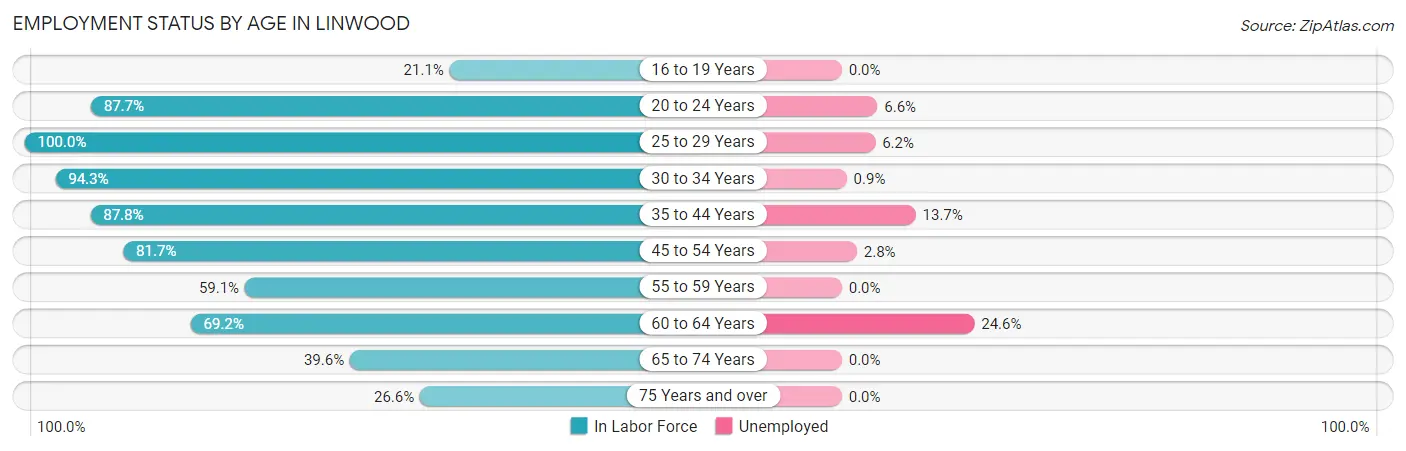
| Age Bracket | In Labor Force | Unemployed |
| 16 to 19 Years | 15 (21.1%) | 0 (0.0%) |
| 20 to 24 Years | 257 (87.7%) | 17 (6.6%) |
| 25 to 29 Years | 242 (100.0%) | 15 (6.2%) |
| 30 to 34 Years | 215 (94.3%) | 2 (0.9%) |
| 35 to 44 Years | 410 (87.8%) | 56 (13.7%) |
| 45 to 54 Years | 470 (81.7%) | 13 (2.8%) |
| 55 to 59 Years | 166 (59.1%) | 0 (0.0%) |
| 60 to 64 Years | 191 (69.2%) | 47 (24.6%) |
| 65 to 74 Years | 67 (39.6%) | 0 (0.0%) |
| 75 Years and over | 41 (26.6%) | 0 (0.0%) |
| Total | 2,075 (75.3%) | 149 (7.2%) |
Employment Status by Educational Attainment in Linwood
According to labor force statistics for Linwood, 81.9% of individuals (1,695) out of the total population between 25 and 64 years of age (2,069) are in the labor force, with 7.9% or 134 of them being unemployed. The group with the highest labor force participation rate are those with the educational attainment of bachelor's degree or higher, with 94.6% or 226 individuals in the labor force. Within the labor force, individuals with less than high school education have the highest percentage of unemployment, with 12.7% or 13 of them being unemployed.
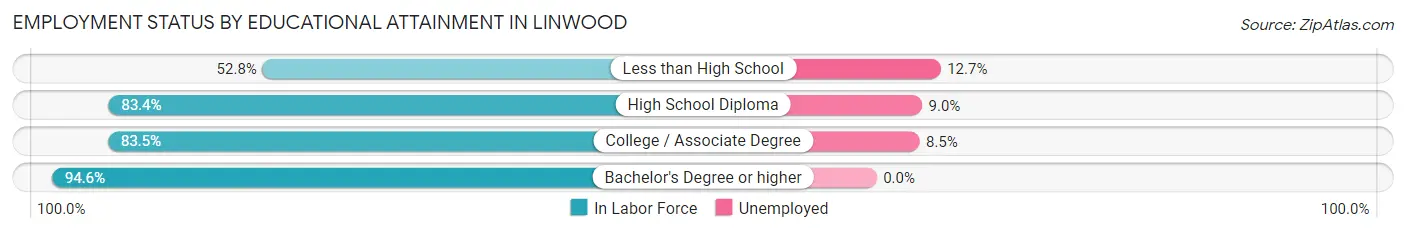
| Educational Attainment | In Labor Force | Unemployed |
| Less than High School | 102 (52.8%) | 25 (12.7%) |
| High School Diploma | 846 (83.4%) | 91 (9.0%) |
| College / Associate Degree | 520 (83.5%) | 53 (8.5%) |
| Bachelor's Degree or higher | 226 (94.6%) | 0 (0.0%) |
| Total | 1,695 (81.9%) | 163 (7.9%) |
Employment Occupations by Sex in Linwood
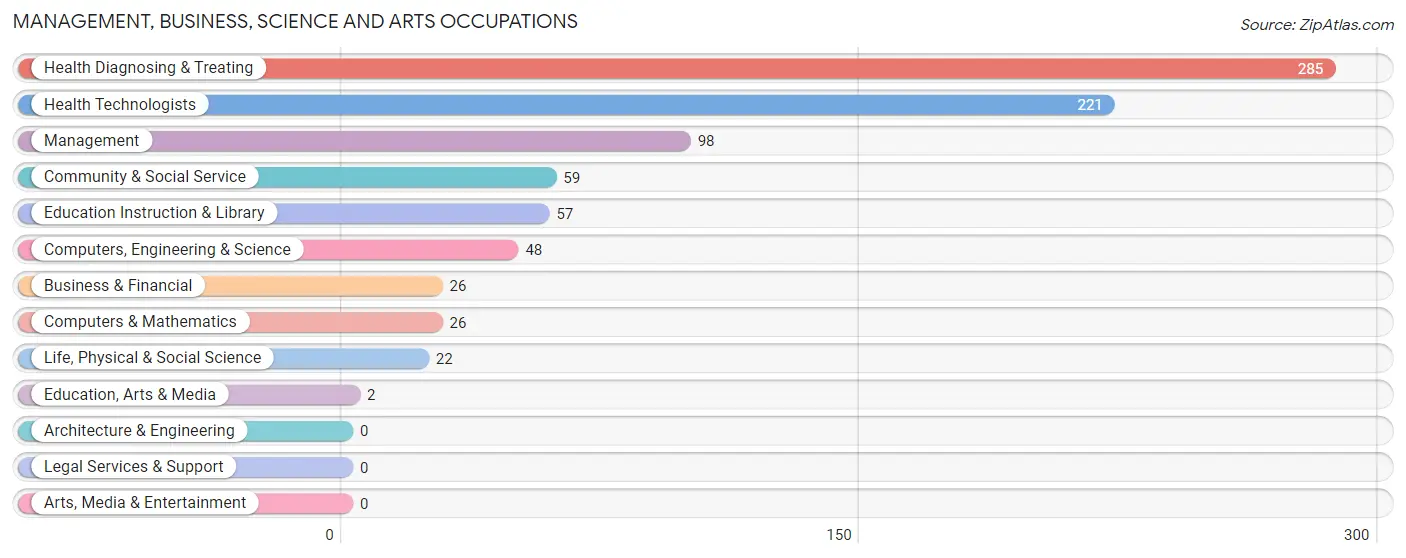
Management, Business, Science and Arts Occupations
The most common Management, Business, Science and Arts occupations in Linwood are Health Diagnosing & Treating (285 | 14.8%), Health Technologists (221 | 11.5%), Management (98 | 5.1%), Community & Social Service (59 | 3.1%), and Education Instruction & Library (57 | 3.0%).
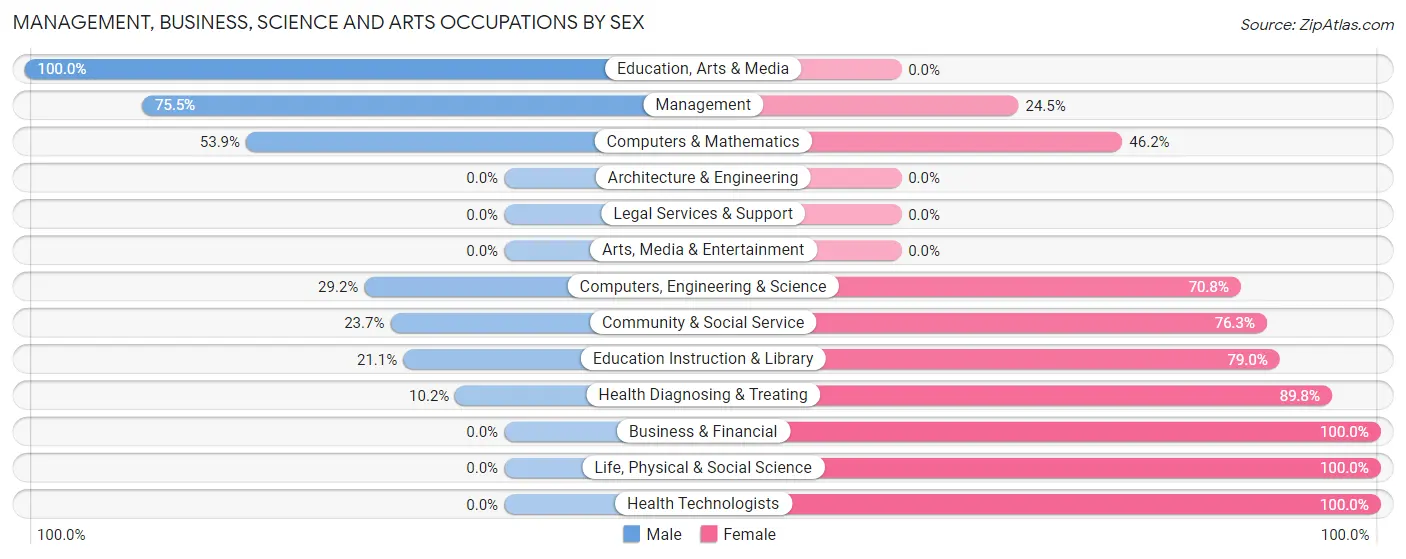
Management, Business, Science and Arts Occupations by Sex
Within the Management, Business, Science and Arts occupations in Linwood, the most male-oriented occupations are Education, Arts & Media (100.0%), Management (75.5%), and Computers & Mathematics (53.8%), while the most female-oriented occupations are Business & Financial (100.0%), Life, Physical & Social Science (100.0%), and Health Technologists (100.0%).
| Occupation | Male | Female |
| Management | 74 (75.5%) | 24 (24.5%) |
| Business & Financial | 0 (0.0%) | 26 (100.0%) |
| Computers, Engineering & Science | 14 (29.2%) | 34 (70.8%) |
| Computers & Mathematics | 14 (53.8%) | 12 (46.2%) |
| Architecture & Engineering | 0 (0.0%) | 0 (0.0%) |
| Life, Physical & Social Science | 0 (0.0%) | 22 (100.0%) |
| Community & Social Service | 14 (23.7%) | 45 (76.3%) |
| Education, Arts & Media | 2 (100.0%) | 0 (0.0%) |
| Legal Services & Support | 0 (0.0%) | 0 (0.0%) |
| Education Instruction & Library | 12 (21.0%) | 45 (78.9%) |
| Arts, Media & Entertainment | 0 (0.0%) | 0 (0.0%) |
| Health Diagnosing & Treating | 29 (10.2%) | 256 (89.8%) |
| Health Technologists | 0 (0.0%) | 221 (100.0%) |
| Total (Category) | 131 (25.4%) | 385 (74.6%) |
| Total (Overall) | 836 (43.4%) | 1,088 (56.6%) |
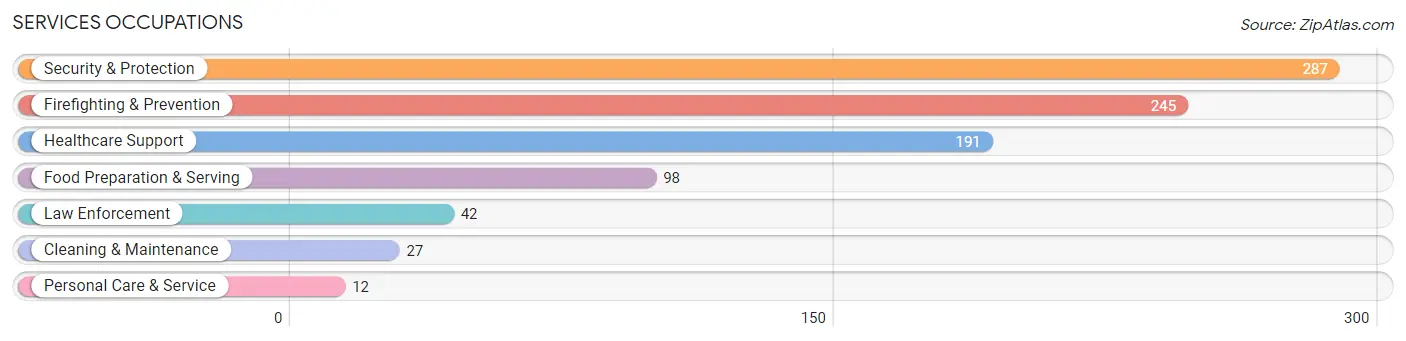
Services Occupations
The most common Services occupations in Linwood are Security & Protection (287 | 14.9%), Firefighting & Prevention (245 | 12.7%), Healthcare Support (191 | 9.9%), Food Preparation & Serving (98 | 5.1%), and Law Enforcement (42 | 2.2%).
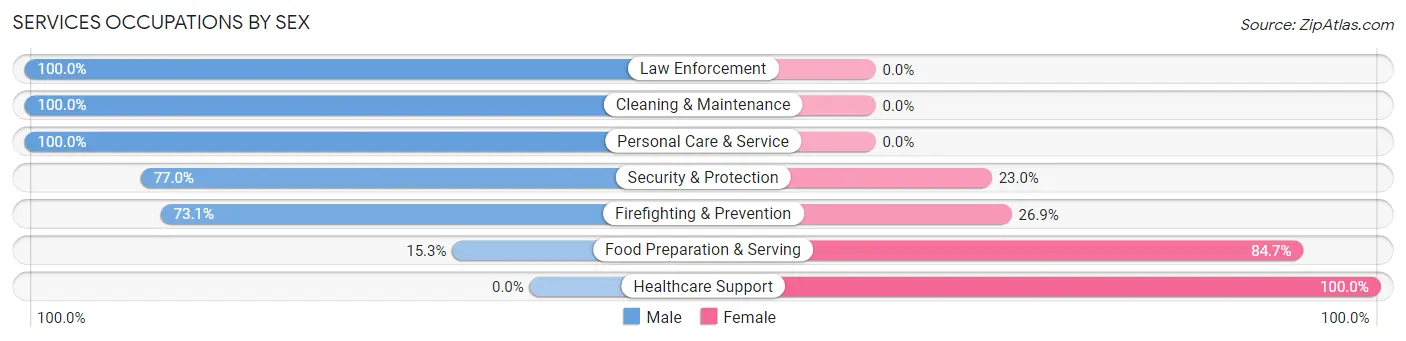
Services Occupations by Sex
Within the Services occupations in Linwood, the most male-oriented occupations are Law Enforcement (100.0%), Cleaning & Maintenance (100.0%), and Personal Care & Service (100.0%), while the most female-oriented occupations are Healthcare Support (100.0%), Food Preparation & Serving (84.7%), and Firefighting & Prevention (26.9%).
| Occupation | Male | Female |
| Healthcare Support | 0 (0.0%) | 191 (100.0%) |
| Security & Protection | 221 (77.0%) | 66 (23.0%) |
| Firefighting & Prevention | 179 (73.1%) | 66 (26.9%) |
| Law Enforcement | 42 (100.0%) | 0 (0.0%) |
| Food Preparation & Serving | 15 (15.3%) | 83 (84.7%) |
| Cleaning & Maintenance | 27 (100.0%) | 0 (0.0%) |
| Personal Care & Service | 12 (100.0%) | 0 (0.0%) |
| Total (Category) | 275 (44.7%) | 340 (55.3%) |
| Total (Overall) | 836 (43.4%) | 1,088 (56.6%) |
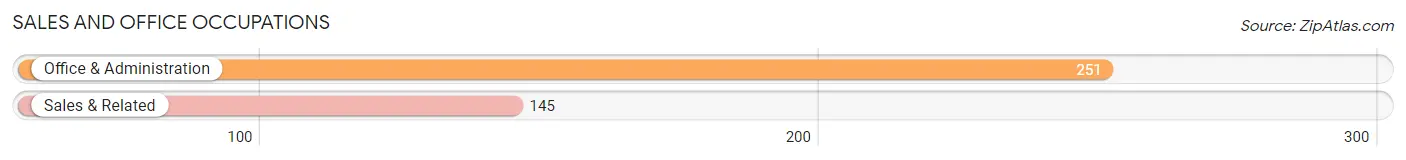
Sales and Office Occupations
The most common Sales and Office occupations in Linwood are Office & Administration (251 | 13.1%), and Sales & Related (145 | 7.5%).
Sales and Office Occupations by Sex
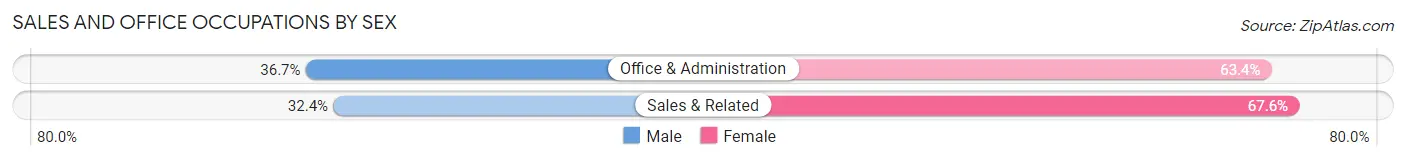
| Occupation | Male | Female |
| Sales & Related | 47 (32.4%) | 98 (67.6%) |
| Office & Administration | 92 (36.6%) | 159 (63.3%) |
| Total (Category) | 139 (35.1%) | 257 (64.9%) |
| Total (Overall) | 836 (43.4%) | 1,088 (56.6%) |
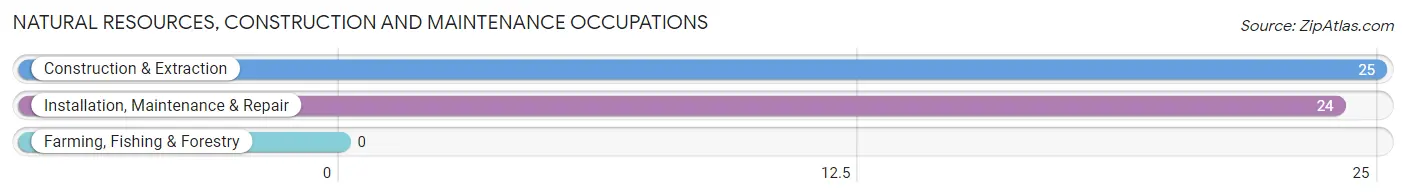
Natural Resources, Construction and Maintenance Occupations
The most common Natural Resources, Construction and Maintenance occupations in Linwood are Construction & Extraction (25 | 1.3%), and Installation, Maintenance & Repair (24 | 1.3%).
Natural Resources, Construction and Maintenance Occupations by Sex
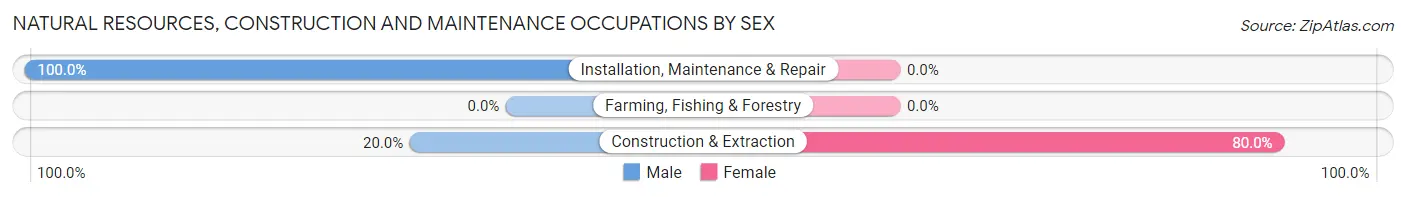
| Occupation | Male | Female |
| Farming, Fishing & Forestry | 0 (0.0%) | 0 (0.0%) |
| Construction & Extraction | 5 (20.0%) | 20 (80.0%) |
| Installation, Maintenance & Repair | 24 (100.0%) | 0 (0.0%) |
| Total (Category) | 29 (59.2%) | 20 (40.8%) |
| Total (Overall) | 836 (43.4%) | 1,088 (56.6%) |
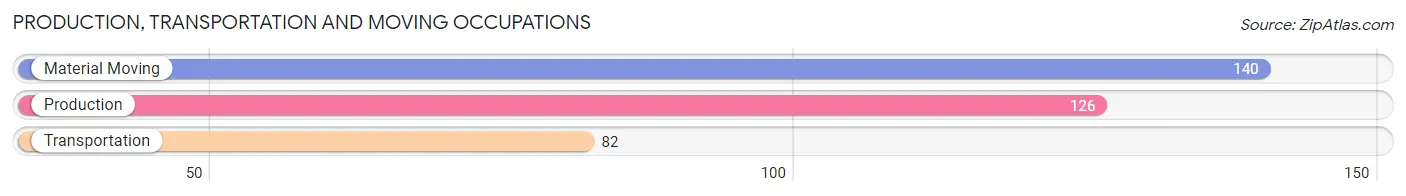
Production, Transportation and Moving Occupations
The most common Production, Transportation and Moving occupations in Linwood are Material Moving (140 | 7.3%), Production (126 | 6.6%), and Transportation (82 | 4.3%).
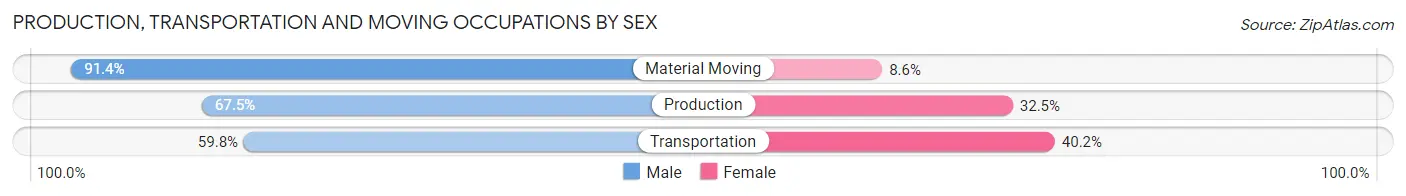
Production, Transportation and Moving Occupations by Sex
| Occupation | Male | Female |
| Production | 85 (67.5%) | 41 (32.5%) |
| Transportation | 49 (59.8%) | 33 (40.2%) |
| Material Moving | 128 (91.4%) | 12 (8.6%) |
| Total (Category) | 262 (75.3%) | 86 (24.7%) |
| Total (Overall) | 836 (43.4%) | 1,088 (56.6%) |
Employment Industries by Sex in Linwood
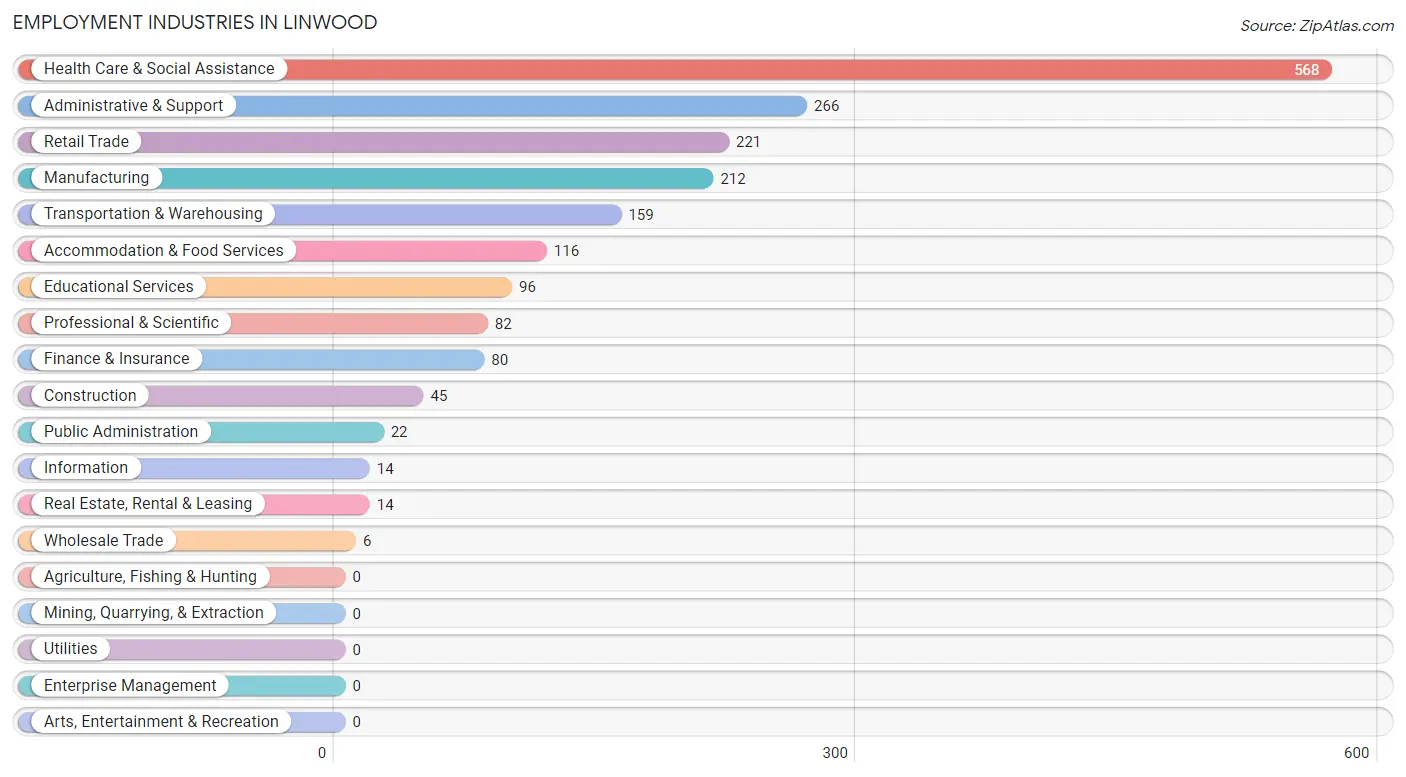
Employment Industries in Linwood
The major employment industries in Linwood include Health Care & Social Assistance (568 | 29.5%), Administrative & Support (266 | 13.8%), Retail Trade (221 | 11.5%), Manufacturing (212 | 11.0%), and Transportation & Warehousing (159 | 8.3%).
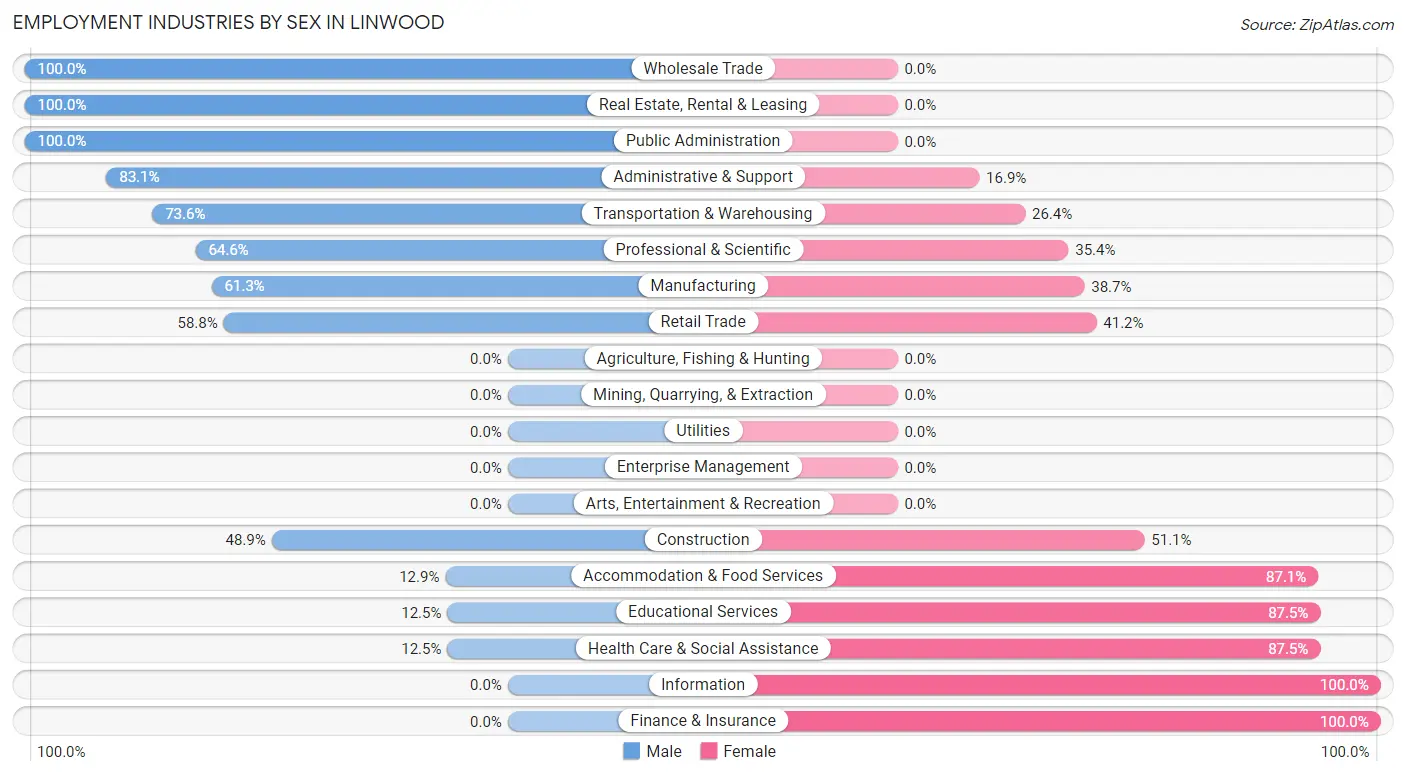
Employment Industries by Sex in Linwood
The Linwood industries that see more men than women are Wholesale Trade (100.0%), Real Estate, Rental & Leasing (100.0%), and Public Administration (100.0%), whereas the industries that tend to have a higher number of women are Information (100.0%), Finance & Insurance (100.0%), and Educational Services (87.5%).
| Industry | Male | Female |
| Agriculture, Fishing & Hunting | 0 (0.0%) | 0 (0.0%) |
| Mining, Quarrying, & Extraction | 0 (0.0%) | 0 (0.0%) |
| Construction | 22 (48.9%) | 23 (51.1%) |
| Manufacturing | 130 (61.3%) | 82 (38.7%) |
| Wholesale Trade | 6 (100.0%) | 0 (0.0%) |
| Retail Trade | 130 (58.8%) | 91 (41.2%) |
| Transportation & Warehousing | 117 (73.6%) | 42 (26.4%) |
| Utilities | 0 (0.0%) | 0 (0.0%) |
| Information | 0 (0.0%) | 14 (100.0%) |
| Finance & Insurance | 0 (0.0%) | 80 (100.0%) |
| Real Estate, Rental & Leasing | 14 (100.0%) | 0 (0.0%) |
| Professional & Scientific | 53 (64.6%) | 29 (35.4%) |
| Enterprise Management | 0 (0.0%) | 0 (0.0%) |
| Administrative & Support | 221 (83.1%) | 45 (16.9%) |
| Educational Services | 12 (12.5%) | 84 (87.5%) |
| Health Care & Social Assistance | 71 (12.5%) | 497 (87.5%) |
| Arts, Entertainment & Recreation | 0 (0.0%) | 0 (0.0%) |
| Accommodation & Food Services | 15 (12.9%) | 101 (87.1%) |
| Public Administration | 22 (100.0%) | 0 (0.0%) |
| Total | 836 (43.4%) | 1,088 (56.6%) |
Education in Linwood
School Enrollment in Linwood
The most common levels of schooling among the 661 students in Linwood are high school (182 | 27.5%), middle school (152 | 23.0%), and kindergarten (107 | 16.2%).
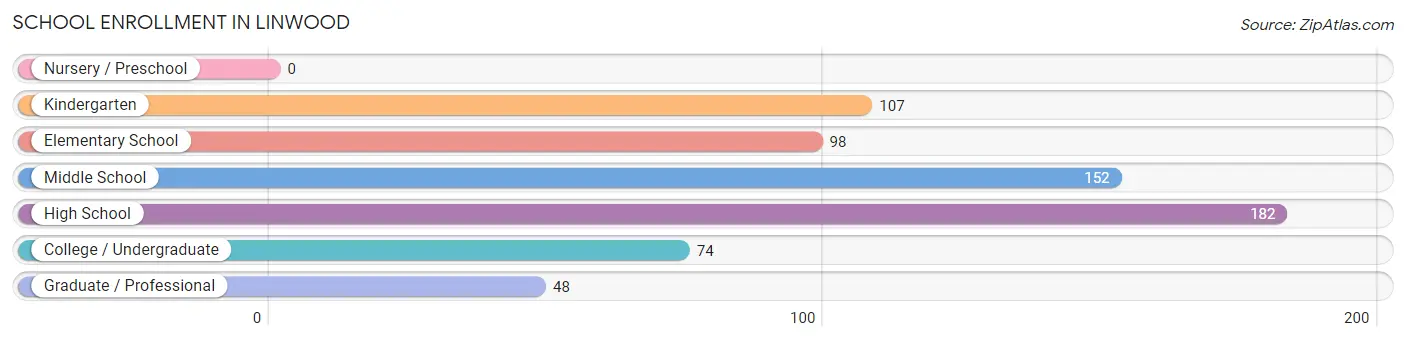
| School Level | # Students | % Students |
| Nursery / Preschool | 0 | 0.0% |
| Kindergarten | 107 | 16.2% |
| Elementary School | 98 | 14.8% |
| Middle School | 152 | 23.0% |
| High School | 182 | 27.5% |
| College / Undergraduate | 74 | 11.2% |
| Graduate / Professional | 48 | 7.3% |
| Total | 661 | 100.0% |
School Enrollment by Age by Funding Source in Linwood
Out of a total of 661 students who are enrolled in schools in Linwood, 79 (12.0%) attend a private institution, while the remaining 582 (88.0%) are enrolled in public schools. The age group of 20 to 24 year olds has the highest likelihood of being enrolled in private schools, with 17 (100.0% in the age bracket) enrolled. Conversely, the age group of 5 to 9 year old has the lowest likelihood of being enrolled in a private school, with 189 (100.0% in the age bracket) attending a public institution.
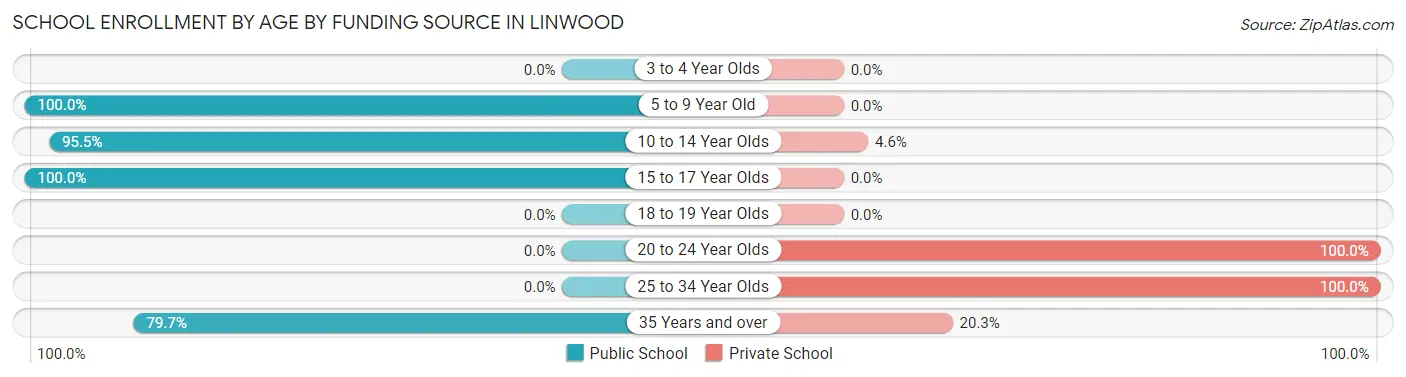
| Age Bracket | Public School | Private School |
| 3 to 4 Year Olds | 0 (0.0%) | 0 (0.0%) |
| 5 to 9 Year Old | 189 (100.0%) | 0 (0.0%) |
| 10 to 14 Year Olds | 252 (95.5%) | 12 (4.5%) |
| 15 to 17 Year Olds | 86 (100.0%) | 0 (0.0%) |
| 18 to 19 Year Olds | 0 (0.0%) | 0 (0.0%) |
| 20 to 24 Year Olds | 0 (0.0%) | 17 (100.0%) |
| 25 to 34 Year Olds | 0 (0.0%) | 36 (100.0%) |
| 35 Years and over | 55 (79.7%) | 14 (20.3%) |
| Total | 582 (88.0%) | 79 (12.0%) |
Educational Attainment by Field of Study in Linwood
Literature & languages (72 | 24.6%), engineering (67 | 22.9%), science & technology (39 | 13.3%), arts & humanities (36 | 12.3%), and social sciences (23 | 7.9%) are the most common fields of study among 293 individuals in Linwood who have obtained a bachelor's degree or higher.
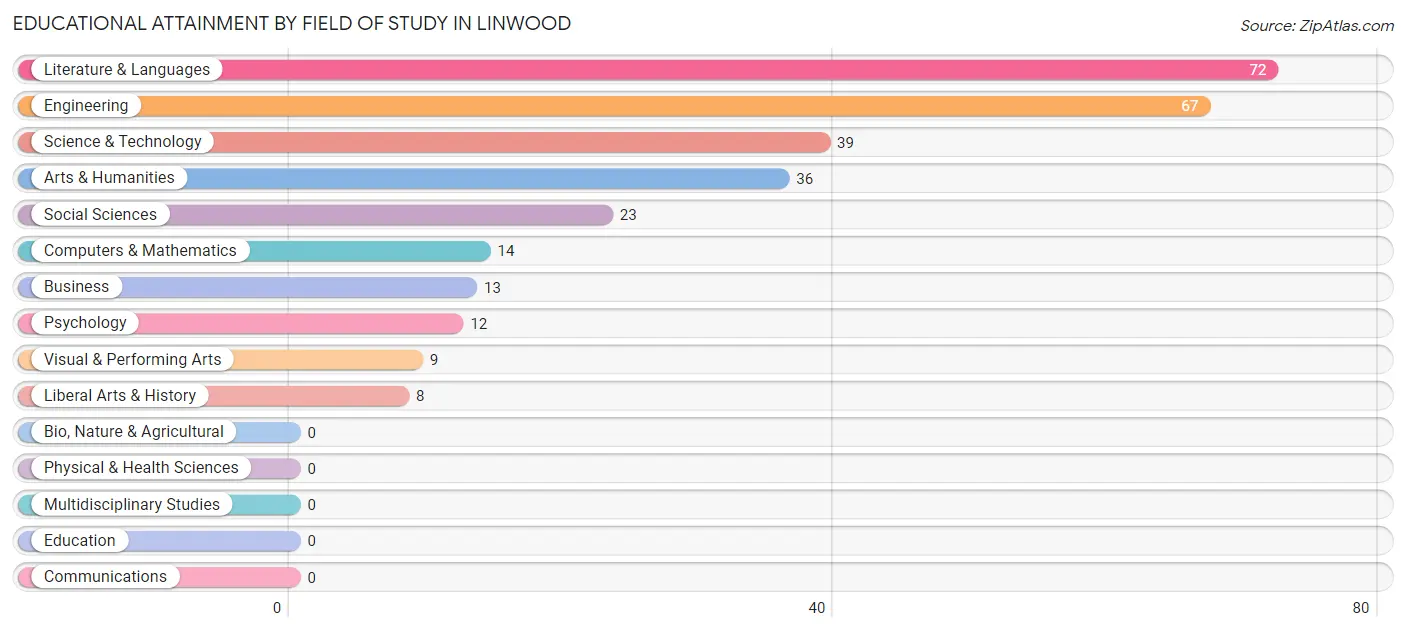
| Field of Study | # Graduates | % Graduates |
| Computers & Mathematics | 14 | 4.8% |
| Bio, Nature & Agricultural | 0 | 0.0% |
| Physical & Health Sciences | 0 | 0.0% |
| Psychology | 12 | 4.1% |
| Social Sciences | 23 | 7.9% |
| Engineering | 67 | 22.9% |
| Multidisciplinary Studies | 0 | 0.0% |
| Science & Technology | 39 | 13.3% |
| Business | 13 | 4.4% |
| Education | 0 | 0.0% |
| Literature & Languages | 72 | 24.6% |
| Liberal Arts & History | 8 | 2.7% |
| Visual & Performing Arts | 9 | 3.1% |
| Communications | 0 | 0.0% |
| Arts & Humanities | 36 | 12.3% |
| Total | 293 | 100.0% |
Transportation & Commute in Linwood
Vehicle Availability by Sex in Linwood
The most prevalent vehicle ownership categories in Linwood are males with 3 vehicles (276, accounting for 33.6%) and females with 3 vehicles (345, making up 26.6%).
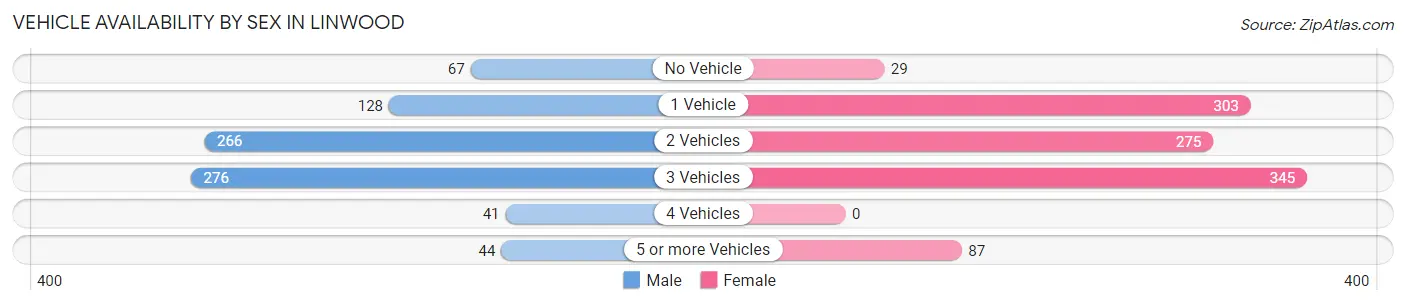
| Vehicles Available | Male | Female |
| No Vehicle | 67 (8.2%) | 29 (2.8%) |
| 1 Vehicle | 128 (15.6%) | 303 (29.2%) |
| 2 Vehicles | 266 (32.4%) | 275 (26.5%) |
| 3 Vehicles | 276 (33.6%) | 345 (33.2%) |
| 4 Vehicles | 41 (5.0%) | 0 (0.0%) |
| 5 or more Vehicles | 44 (5.3%) | 87 (8.4%) |
| Total | 822 (100.0%) | 1,039 (100.0%) |
Commute Time in Linwood
The most frequently occuring commute durations in Linwood are 15 to 19 minutes (368 commuters, 23.4%), 20 to 24 minutes (310 commuters, 19.7%), and 5 to 9 minutes (211 commuters, 13.4%).
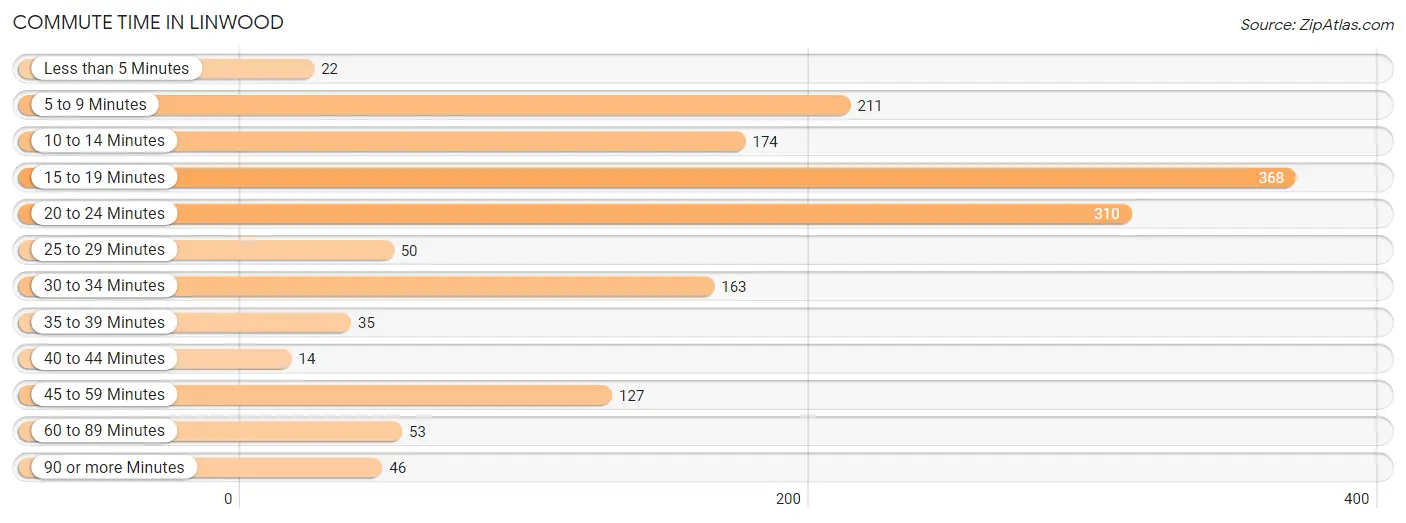
| Commute Time | # Commuters | % Commuters |
| Less than 5 Minutes | 22 | 1.4% |
| 5 to 9 Minutes | 211 | 13.4% |
| 10 to 14 Minutes | 174 | 11.1% |
| 15 to 19 Minutes | 368 | 23.4% |
| 20 to 24 Minutes | 310 | 19.7% |
| 25 to 29 Minutes | 50 | 3.2% |
| 30 to 34 Minutes | 163 | 10.4% |
| 35 to 39 Minutes | 35 | 2.2% |
| 40 to 44 Minutes | 14 | 0.9% |
| 45 to 59 Minutes | 127 | 8.1% |
| 60 to 89 Minutes | 53 | 3.4% |
| 90 or more Minutes | 46 | 2.9% |
Commute Time by Sex in Linwood
The most common commute times in Linwood are 20 to 24 minutes (181 commuters, 28.1%) for males and 15 to 19 minutes (346 commuters, 37.3%) for females.
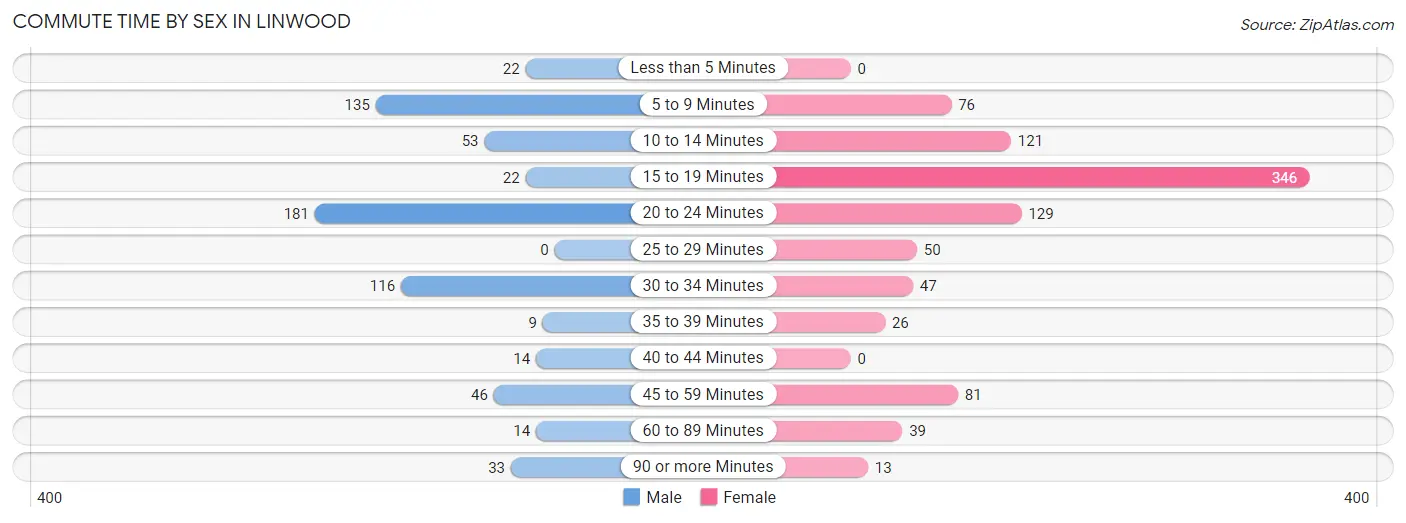
| Commute Time | Male | Female |
| Less than 5 Minutes | 22 (3.4%) | 0 (0.0%) |
| 5 to 9 Minutes | 135 (20.9%) | 76 (8.2%) |
| 10 to 14 Minutes | 53 (8.2%) | 121 (13.0%) |
| 15 to 19 Minutes | 22 (3.4%) | 346 (37.3%) |
| 20 to 24 Minutes | 181 (28.1%) | 129 (13.9%) |
| 25 to 29 Minutes | 0 (0.0%) | 50 (5.4%) |
| 30 to 34 Minutes | 116 (18.0%) | 47 (5.1%) |
| 35 to 39 Minutes | 9 (1.4%) | 26 (2.8%) |
| 40 to 44 Minutes | 14 (2.2%) | 0 (0.0%) |
| 45 to 59 Minutes | 46 (7.1%) | 81 (8.7%) |
| 60 to 89 Minutes | 14 (2.2%) | 39 (4.2%) |
| 90 or more Minutes | 33 (5.1%) | 13 (1.4%) |
Time of Departure to Work by Sex in Linwood
The most frequent times of departure to work in Linwood are 4:00 PM to 11:59 PM (158, 24.5%) for males and 8:00 AM to 8:29 AM (200, 21.5%) for females.
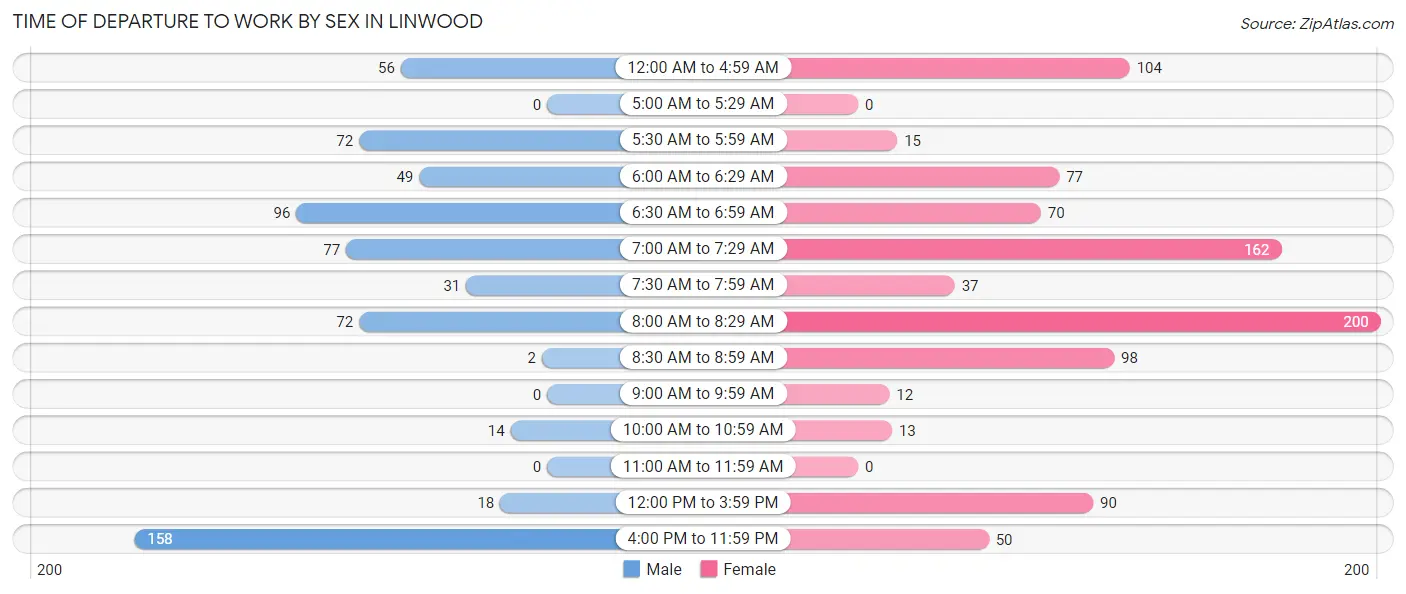
| Time of Departure | Male | Female |
| 12:00 AM to 4:59 AM | 56 (8.7%) | 104 (11.2%) |
| 5:00 AM to 5:29 AM | 0 (0.0%) | 0 (0.0%) |
| 5:30 AM to 5:59 AM | 72 (11.2%) | 15 (1.6%) |
| 6:00 AM to 6:29 AM | 49 (7.6%) | 77 (8.3%) |
| 6:30 AM to 6:59 AM | 96 (14.9%) | 70 (7.5%) |
| 7:00 AM to 7:29 AM | 77 (11.9%) | 162 (17.5%) |
| 7:30 AM to 7:59 AM | 31 (4.8%) | 37 (4.0%) |
| 8:00 AM to 8:29 AM | 72 (11.2%) | 200 (21.5%) |
| 8:30 AM to 8:59 AM | 2 (0.3%) | 98 (10.6%) |
| 9:00 AM to 9:59 AM | 0 (0.0%) | 12 (1.3%) |
| 10:00 AM to 10:59 AM | 14 (2.2%) | 13 (1.4%) |
| 11:00 AM to 11:59 AM | 0 (0.0%) | 0 (0.0%) |
| 12:00 PM to 3:59 PM | 18 (2.8%) | 90 (9.7%) |
| 4:00 PM to 11:59 PM | 158 (24.5%) | 50 (5.4%) |
| Total | 645 (100.0%) | 928 (100.0%) |
Housing Occupancy in Linwood
Occupancy by Ownership in Linwood
Of the total 1,379 dwellings in Linwood, owner-occupied units account for 678 (49.2%), while renter-occupied units make up 701 (50.8%).
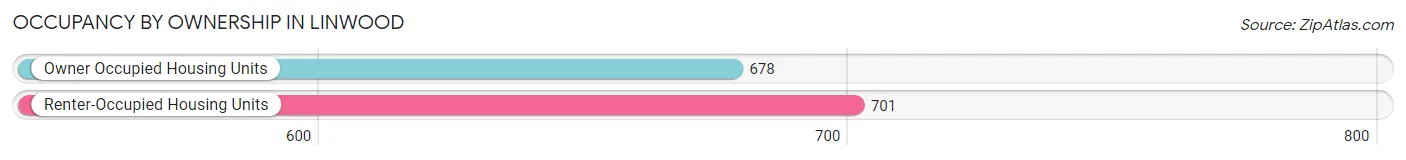
| Occupancy | # Housing Units | % Housing Units |
| Owner Occupied Housing Units | 678 | 49.2% |
| Renter-Occupied Housing Units | 701 | 50.8% |
| Total Occupied Housing Units | 1,379 | 100.0% |
Occupancy by Household Size in Linwood
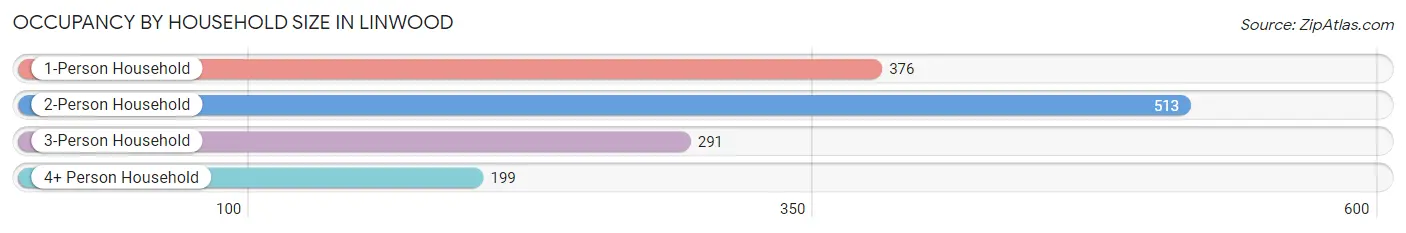
| Household Size | # Housing Units | % Housing Units |
| 1-Person Household | 376 | 27.3% |
| 2-Person Household | 513 | 37.2% |
| 3-Person Household | 291 | 21.1% |
| 4+ Person Household | 199 | 14.4% |
| Total Housing Units | 1,379 | 100.0% |
Occupancy by Ownership by Household Size in Linwood
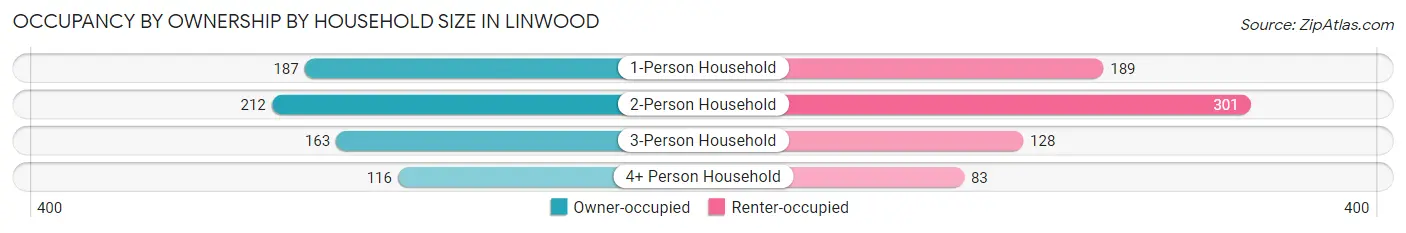
| Household Size | Owner-occupied | Renter-occupied |
| 1-Person Household | 187 (49.7%) | 189 (50.3%) |
| 2-Person Household | 212 (41.3%) | 301 (58.7%) |
| 3-Person Household | 163 (56.0%) | 128 (44.0%) |
| 4+ Person Household | 116 (58.3%) | 83 (41.7%) |
| Total Housing Units | 678 (49.2%) | 701 (50.8%) |
Occupancy by Educational Attainment in Linwood
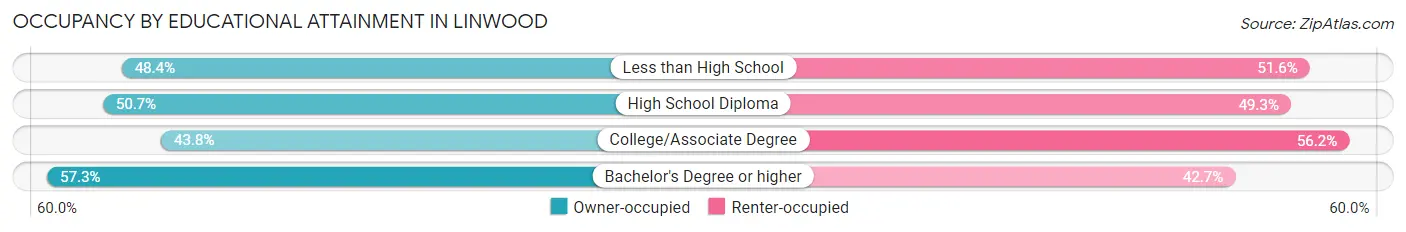
| Household Size | Owner-occupied | Renter-occupied |
| Less than High School | 62 (48.4%) | 66 (51.6%) |
| High School Diploma | 332 (50.7%) | 323 (49.3%) |
| College/Associate Degree | 186 (43.8%) | 239 (56.2%) |
| Bachelor's Degree or higher | 98 (57.3%) | 73 (42.7%) |
Occupancy by Age of Householder in Linwood
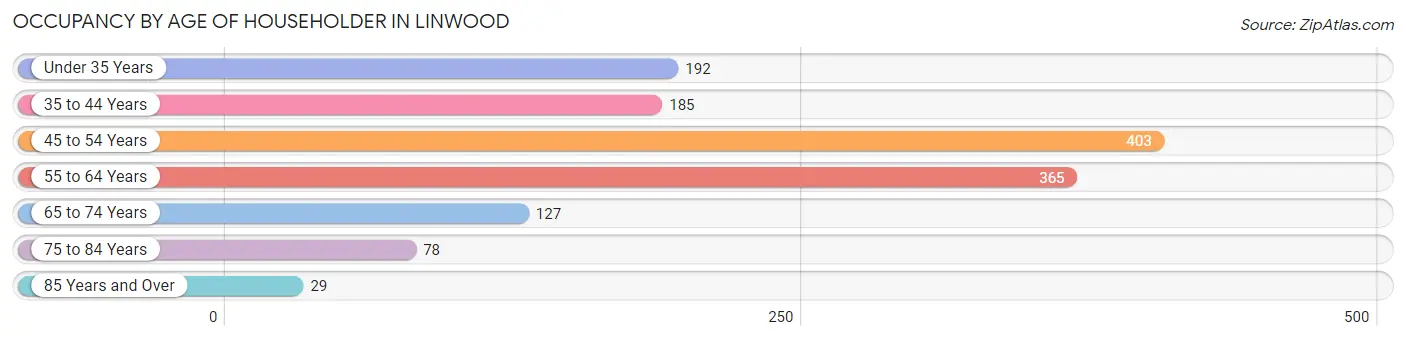
| Age Bracket | # Households | % Households |
| Under 35 Years | 192 | 13.9% |
| 35 to 44 Years | 185 | 13.4% |
| 45 to 54 Years | 403 | 29.2% |
| 55 to 64 Years | 365 | 26.5% |
| 65 to 74 Years | 127 | 9.2% |
| 75 to 84 Years | 78 | 5.7% |
| 85 Years and Over | 29 | 2.1% |
| Total | 1,379 | 100.0% |
Housing Finances in Linwood
Median Income by Occupancy in Linwood
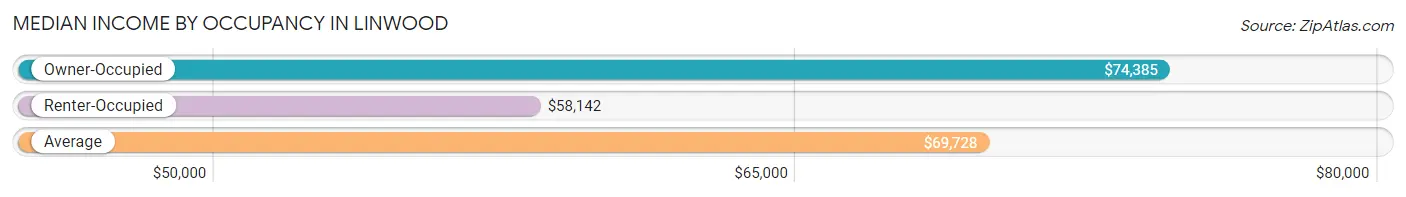
| Occupancy Type | # Households | Median Income |
| Owner-Occupied | 678 (49.2%) | $74,385 |
| Renter-Occupied | 701 (50.8%) | $58,142 |
| Average | 1,379 (100.0%) | $69,728 |
Occupancy by Householder Income Bracket in Linwood
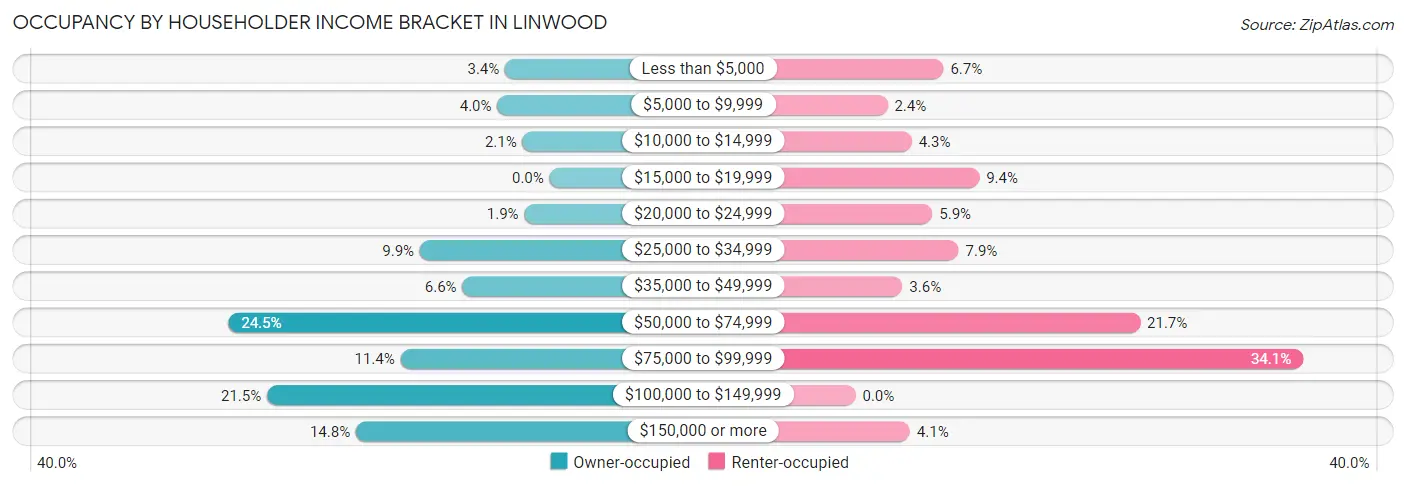
| Income Bracket | Owner-occupied | Renter-occupied |
| Less than $5,000 | 23 (3.4%) | 47 (6.7%) |
| $5,000 to $9,999 | 27 (4.0%) | 17 (2.4%) |
| $10,000 to $14,999 | 14 (2.1%) | 30 (4.3%) |
| $15,000 to $19,999 | 0 (0.0%) | 66 (9.4%) |
| $20,000 to $24,999 | 13 (1.9%) | 41 (5.9%) |
| $25,000 to $34,999 | 67 (9.9%) | 55 (7.9%) |
| $35,000 to $49,999 | 45 (6.6%) | 25 (3.6%) |
| $50,000 to $74,999 | 166 (24.5%) | 152 (21.7%) |
| $75,000 to $99,999 | 77 (11.4%) | 239 (34.1%) |
| $100,000 to $149,999 | 146 (21.5%) | 0 (0.0%) |
| $150,000 or more | 100 (14.7%) | 29 (4.1%) |
| Total | 678 (100.0%) | 701 (100.0%) |
Monthly Housing Cost Tiers in Linwood
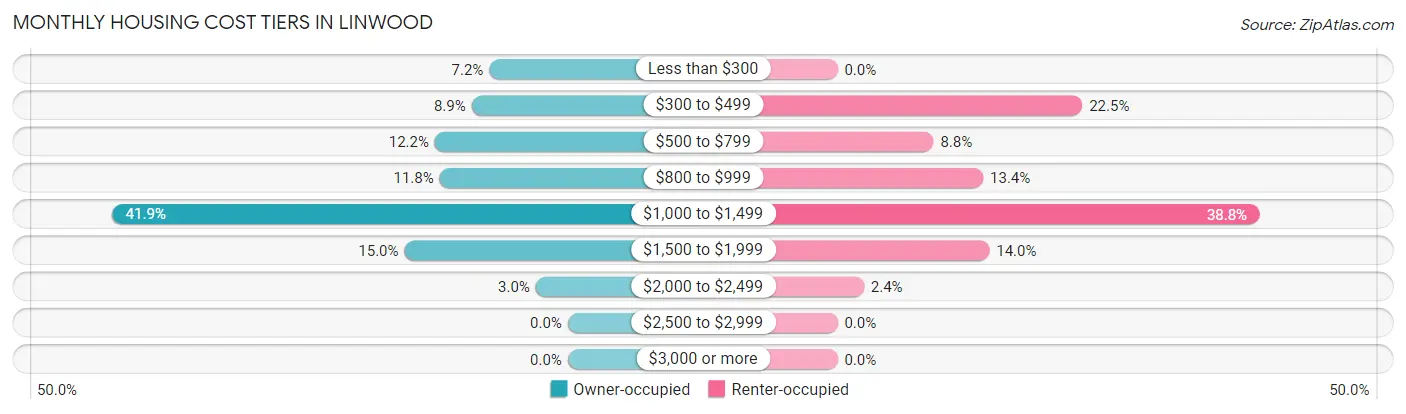
| Monthly Cost | Owner-occupied | Renter-occupied |
| Less than $300 | 49 (7.2%) | 0 (0.0%) |
| $300 to $499 | 60 (8.8%) | 158 (22.5%) |
| $500 to $799 | 83 (12.2%) | 62 (8.8%) |
| $800 to $999 | 80 (11.8%) | 94 (13.4%) |
| $1,000 to $1,499 | 284 (41.9%) | 272 (38.8%) |
| $1,500 to $1,999 | 102 (15.0%) | 98 (14.0%) |
| $2,000 to $2,499 | 20 (2.9%) | 17 (2.4%) |
| $2,500 to $2,999 | 0 (0.0%) | 0 (0.0%) |
| $3,000 or more | 0 (0.0%) | 0 (0.0%) |
| Total | 678 (100.0%) | 701 (100.0%) |
Physical Housing Characteristics in Linwood
Housing Structures in Linwood
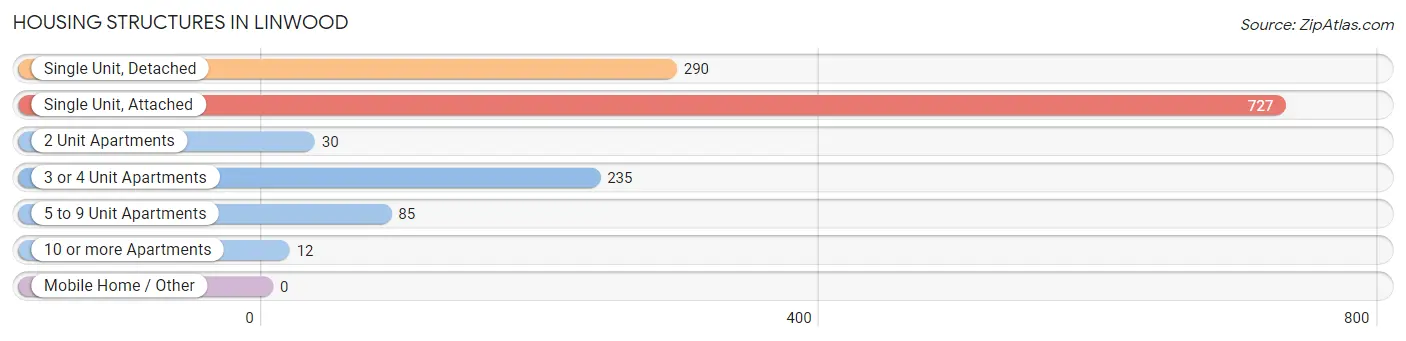
| Structure Type | # Housing Units | % Housing Units |
| Single Unit, Detached | 290 | 21.0% |
| Single Unit, Attached | 727 | 52.7% |
| 2 Unit Apartments | 30 | 2.2% |
| 3 or 4 Unit Apartments | 235 | 17.0% |
| 5 to 9 Unit Apartments | 85 | 6.2% |
| 10 or more Apartments | 12 | 0.9% |
| Mobile Home / Other | 0 | 0.0% |
| Total | 1,379 | 100.0% |
Housing Structures by Occupancy in Linwood
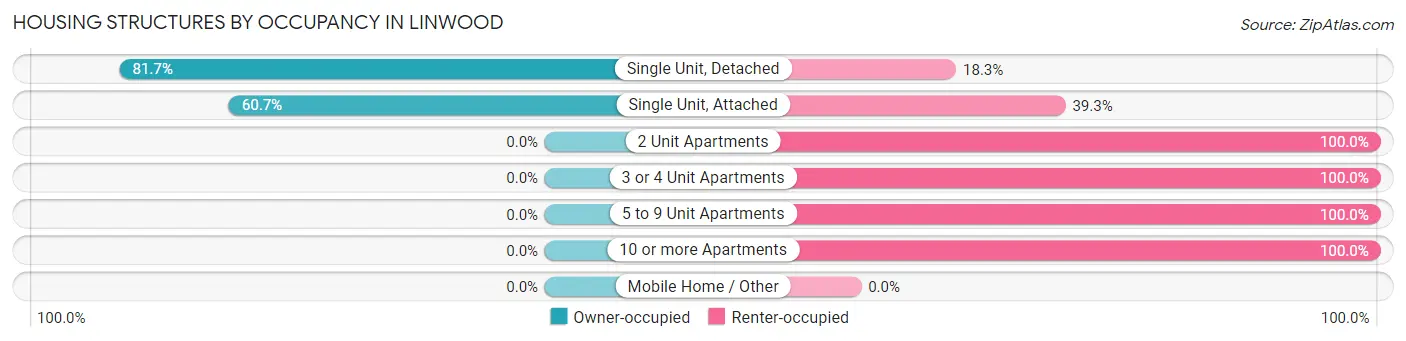
| Structure Type | Owner-occupied | Renter-occupied |
| Single Unit, Detached | 237 (81.7%) | 53 (18.3%) |
| Single Unit, Attached | 441 (60.7%) | 286 (39.3%) |
| 2 Unit Apartments | 0 (0.0%) | 30 (100.0%) |
| 3 or 4 Unit Apartments | 0 (0.0%) | 235 (100.0%) |
| 5 to 9 Unit Apartments | 0 (0.0%) | 85 (100.0%) |
| 10 or more Apartments | 0 (0.0%) | 12 (100.0%) |
| Mobile Home / Other | 0 (0.0%) | 0 (0.0%) |
| Total | 678 (49.2%) | 701 (50.8%) |
Housing Structures by Number of Rooms in Linwood
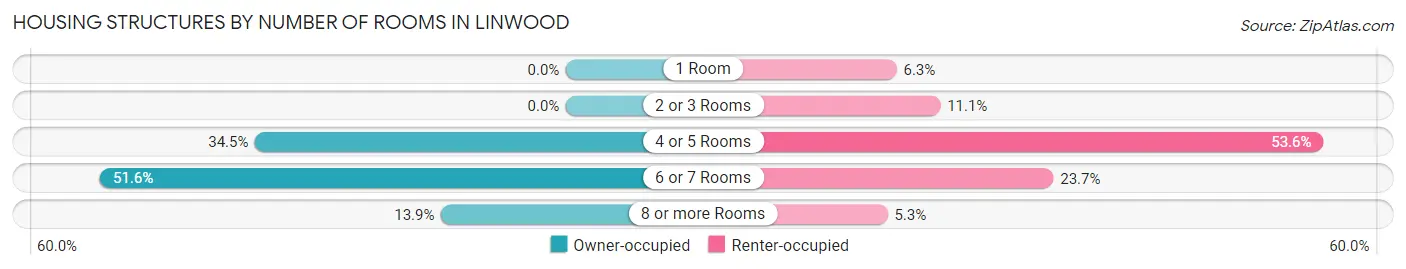
| Number of Rooms | Owner-occupied | Renter-occupied |
| 1 Room | 0 (0.0%) | 44 (6.3%) |
| 2 or 3 Rooms | 0 (0.0%) | 78 (11.1%) |
| 4 or 5 Rooms | 234 (34.5%) | 376 (53.6%) |
| 6 or 7 Rooms | 350 (51.6%) | 166 (23.7%) |
| 8 or more Rooms | 94 (13.9%) | 37 (5.3%) |
| Total | 678 (100.0%) | 701 (100.0%) |
Housing Structure by Heating Type in Linwood
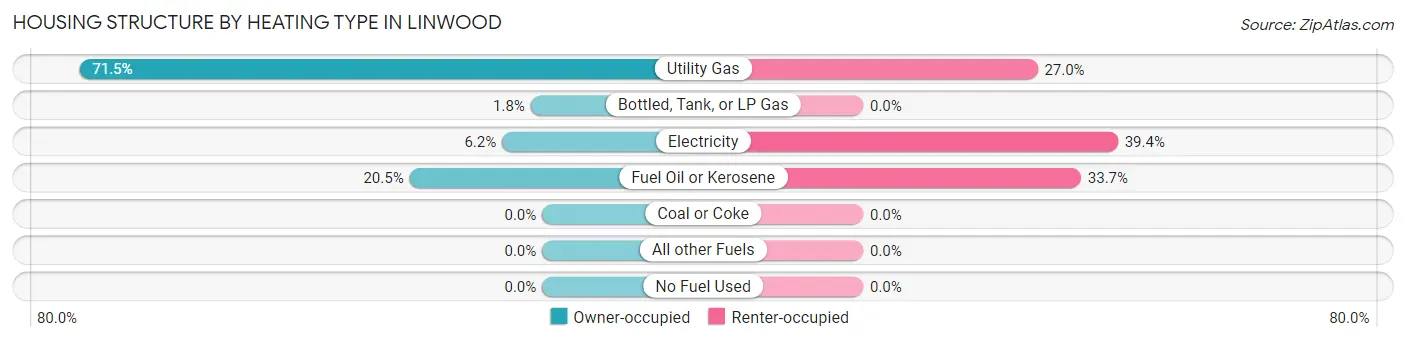
| Heating Type | Owner-occupied | Renter-occupied |
| Utility Gas | 485 (71.5%) | 189 (27.0%) |
| Bottled, Tank, or LP Gas | 12 (1.8%) | 0 (0.0%) |
| Electricity | 42 (6.2%) | 276 (39.4%) |
| Fuel Oil or Kerosene | 139 (20.5%) | 236 (33.7%) |
| Coal or Coke | 0 (0.0%) | 0 (0.0%) |
| All other Fuels | 0 (0.0%) | 0 (0.0%) |
| No Fuel Used | 0 (0.0%) | 0 (0.0%) |
| Total | 678 (100.0%) | 701 (100.0%) |
Household Vehicle Usage in Linwood
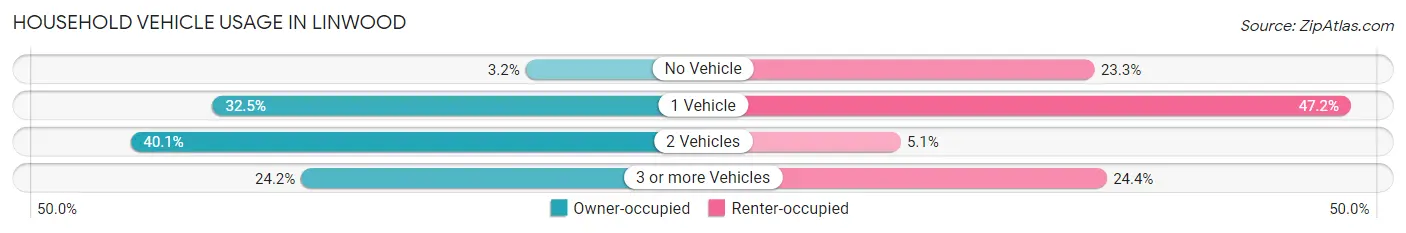
| Vehicles per Household | Owner-occupied | Renter-occupied |
| No Vehicle | 22 (3.2%) | 163 (23.3%) |
| 1 Vehicle | 220 (32.5%) | 331 (47.2%) |
| 2 Vehicles | 272 (40.1%) | 36 (5.1%) |
| 3 or more Vehicles | 164 (24.2%) | 171 (24.4%) |
| Total | 678 (100.0%) | 701 (100.0%) |
Real Estate & Mortgages in Linwood
Real Estate and Mortgage Overview in Linwood
| Characteristic | Without Mortgage | With Mortgage |
| Housing Units | 191 | 487 |
| Median Property Value | $104,900 | $94,600 |
| Median Household Income | $74,196 | $77 |
| Monthly Housing Costs | $499 | $0 |
| Real Estate Taxes | - | - |
Property Value by Mortgage Status in Linwood
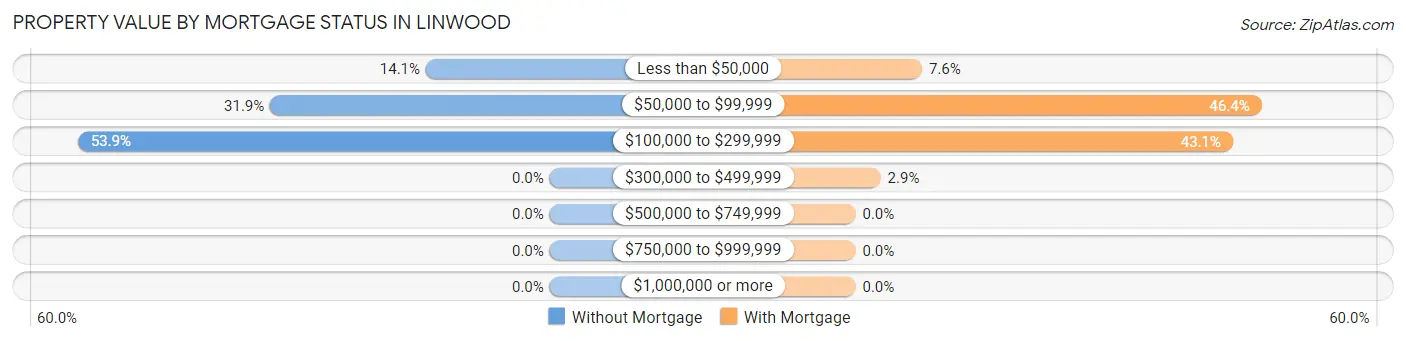
| Property Value | Without Mortgage | With Mortgage |
| Less than $50,000 | 27 (14.1%) | 37 (7.6%) |
| $50,000 to $99,999 | 61 (31.9%) | 226 (46.4%) |
| $100,000 to $299,999 | 103 (53.9%) | 210 (43.1%) |
| $300,000 to $499,999 | 0 (0.0%) | 14 (2.9%) |
| $500,000 to $749,999 | 0 (0.0%) | 0 (0.0%) |
| $750,000 to $999,999 | 0 (0.0%) | 0 (0.0%) |
| $1,000,000 or more | 0 (0.0%) | 0 (0.0%) |
| Total | 191 (100.0%) | 487 (100.0%) |
Household Income by Mortgage Status in Linwood
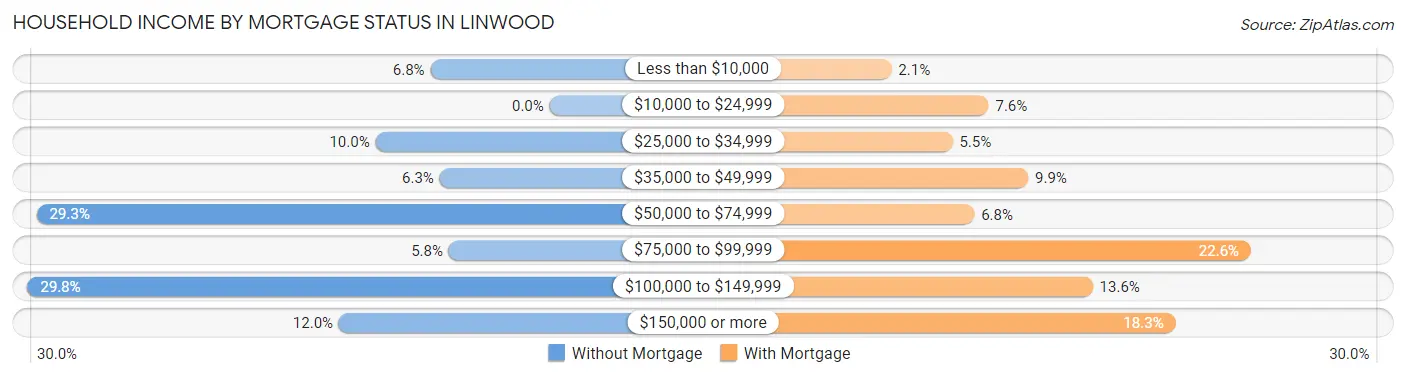
| Household Income | Without Mortgage | With Mortgage |
| Less than $10,000 | 13 (6.8%) | 10 (2.1%) |
| $10,000 to $24,999 | 0 (0.0%) | 37 (7.6%) |
| $25,000 to $34,999 | 19 (10.0%) | 27 (5.5%) |
| $35,000 to $49,999 | 12 (6.3%) | 48 (9.9%) |
| $50,000 to $74,999 | 56 (29.3%) | 33 (6.8%) |
| $75,000 to $99,999 | 11 (5.8%) | 110 (22.6%) |
| $100,000 to $149,999 | 57 (29.8%) | 66 (13.6%) |
| $150,000 or more | 23 (12.0%) | 89 (18.3%) |
| Total | 191 (100.0%) | 487 (100.0%) |
Property Value to Household Income Ratio in Linwood
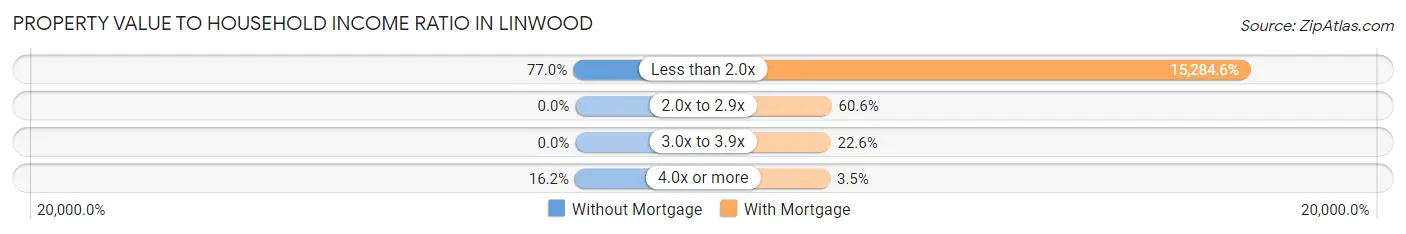
| Value-to-Income Ratio | Without Mortgage | With Mortgage |
| Less than 2.0x | 147 (77.0%) | 74,436 (15,284.6%) |
| 2.0x to 2.9x | 0 (0.0%) | 295 (60.6%) |
| 3.0x to 3.9x | 0 (0.0%) | 110 (22.6%) |
| 4.0x or more | 31 (16.2%) | 17 (3.5%) |
| Total | 191 (100.0%) | 487 (100.0%) |
Real Estate Taxes by Mortgage Status in Linwood
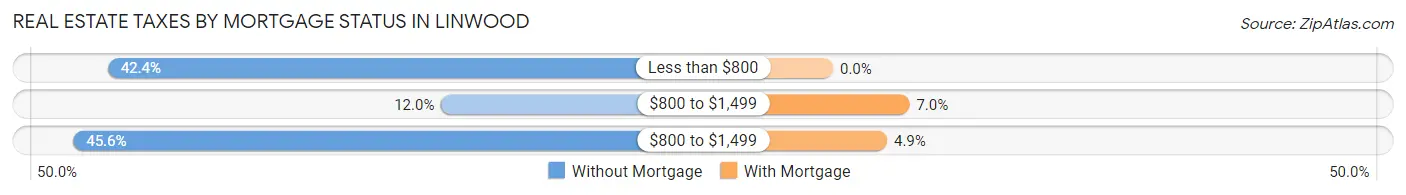
| Property Taxes | Without Mortgage | With Mortgage |
| Less than $800 | 81 (42.4%) | 0 (0.0%) |
| $800 to $1,499 | 23 (12.0%) | 34 (7.0%) |
| $800 to $1,499 | 87 (45.6%) | 24 (4.9%) |
| Total | 191 (100.0%) | 487 (100.0%) |
Health & Disability in Linwood
Health Insurance Coverage by Age in Linwood
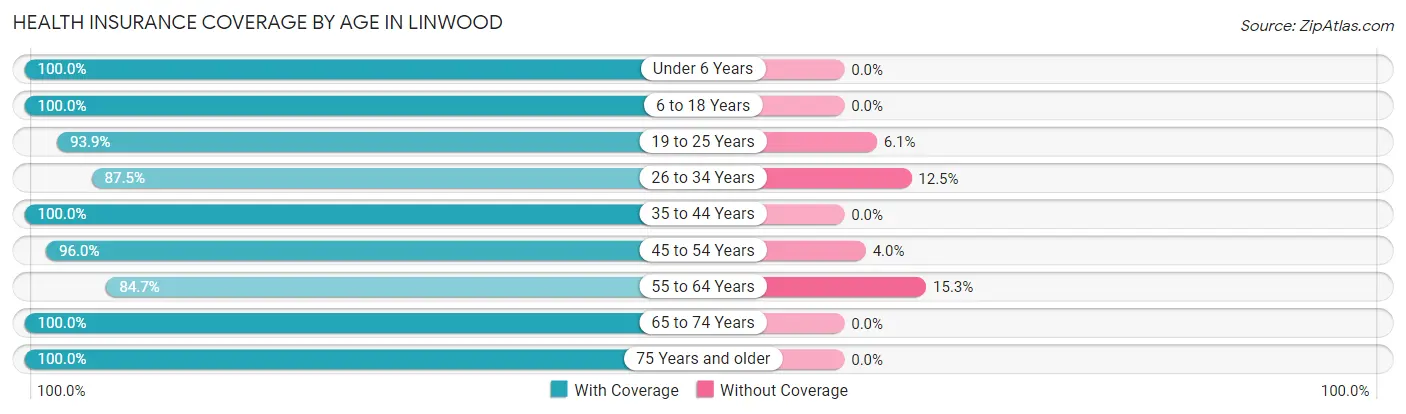
| Age Bracket | With Coverage | Without Coverage |
| Under 6 Years | 131 (100.0%) | 0 (0.0%) |
| 6 to 18 Years | 471 (100.0%) | 0 (0.0%) |
| 19 to 25 Years | 341 (93.9%) | 22 (6.1%) |
| 26 to 34 Years | 350 (87.5%) | 50 (12.5%) |
| 35 to 44 Years | 467 (100.0%) | 0 (0.0%) |
| 45 to 54 Years | 552 (96.0%) | 23 (4.0%) |
| 55 to 64 Years | 472 (84.7%) | 85 (15.3%) |
| 65 to 74 Years | 169 (100.0%) | 0 (0.0%) |
| 75 Years and older | 154 (100.0%) | 0 (0.0%) |
| Total | 3,107 (94.5%) | 180 (5.5%) |
Health Insurance Coverage by Citizenship Status in Linwood
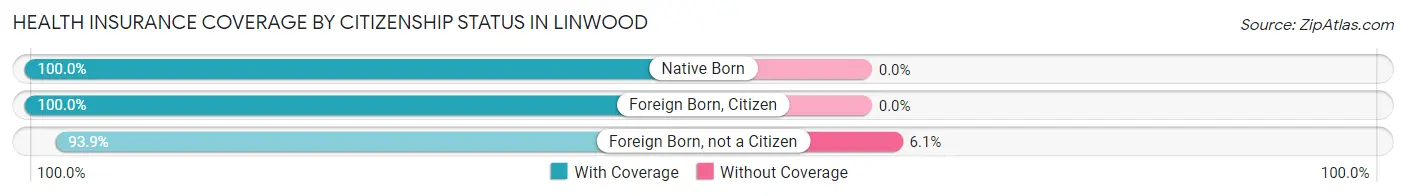
| Citizenship Status | With Coverage | Without Coverage |
| Native Born | 131 (100.0%) | 0 (0.0%) |
| Foreign Born, Citizen | 471 (100.0%) | 0 (0.0%) |
| Foreign Born, not a Citizen | 341 (93.9%) | 22 (6.1%) |
Health Insurance Coverage by Household Income in Linwood
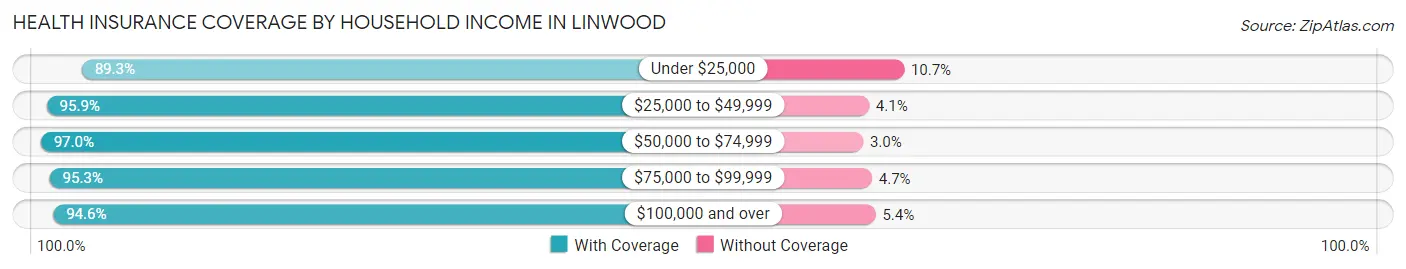
| Household Income | With Coverage | Without Coverage |
| Under $25,000 | 500 (89.3%) | 60 (10.7%) |
| $25,000 to $49,999 | 255 (95.9%) | 11 (4.1%) |
| $50,000 to $74,999 | 736 (97.0%) | 23 (3.0%) |
| $75,000 to $99,999 | 731 (95.3%) | 36 (4.7%) |
| $100,000 and over | 881 (94.6%) | 50 (5.4%) |
Public vs Private Health Insurance Coverage by Age in Linwood
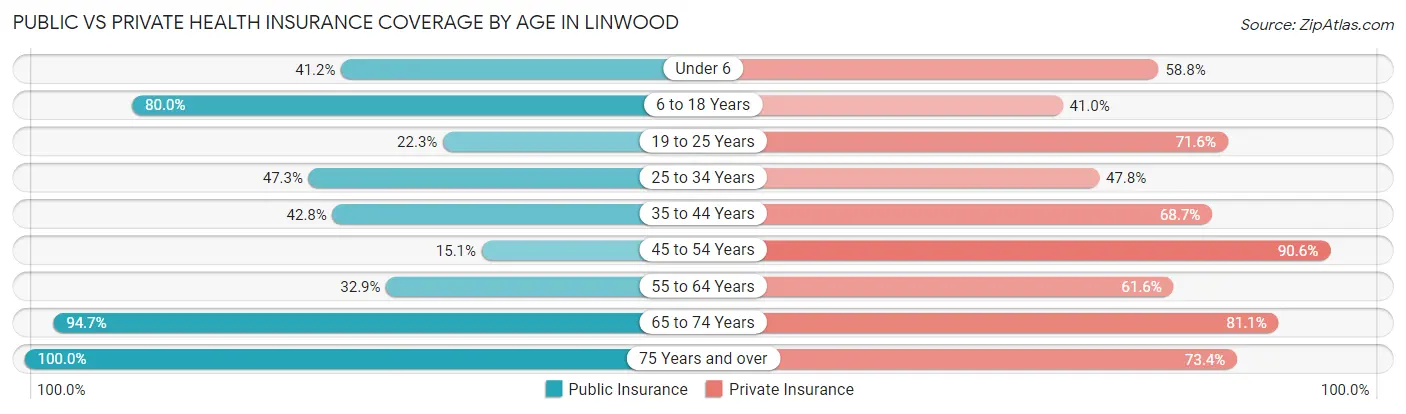
| Age Bracket | Public Insurance | Private Insurance |
| Under 6 | 54 (41.2%) | 77 (58.8%) |
| 6 to 18 Years | 377 (80.0%) | 193 (41.0%) |
| 19 to 25 Years | 81 (22.3%) | 260 (71.6%) |
| 25 to 34 Years | 189 (47.2%) | 191 (47.7%) |
| 35 to 44 Years | 200 (42.8%) | 321 (68.7%) |
| 45 to 54 Years | 87 (15.1%) | 521 (90.6%) |
| 55 to 64 Years | 183 (32.9%) | 343 (61.6%) |
| 65 to 74 Years | 160 (94.7%) | 137 (81.1%) |
| 75 Years and over | 154 (100.0%) | 113 (73.4%) |
| Total | 1,485 (45.2%) | 2,156 (65.6%) |
Disability Status by Sex by Age in Linwood
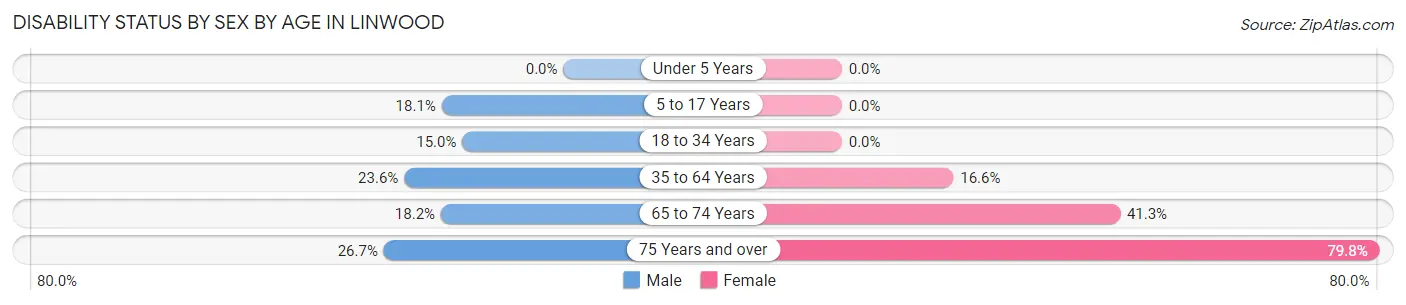
| Age Bracket | Male | Female |
| Under 5 Years | 0 (0.0%) | 0 (0.0%) |
| 5 to 17 Years | 30 (18.1%) | 0 (0.0%) |
| 18 to 34 Years | 57 (15.0%) | 0 (0.0%) |
| 35 to 64 Years | 161 (23.6%) | 152 (16.6%) |
| 65 to 74 Years | 14 (18.2%) | 38 (41.3%) |
| 75 Years and over | 8 (26.7%) | 99 (79.8%) |
Disability Class by Sex by Age in Linwood
Disability Class: Hearing Difficulty
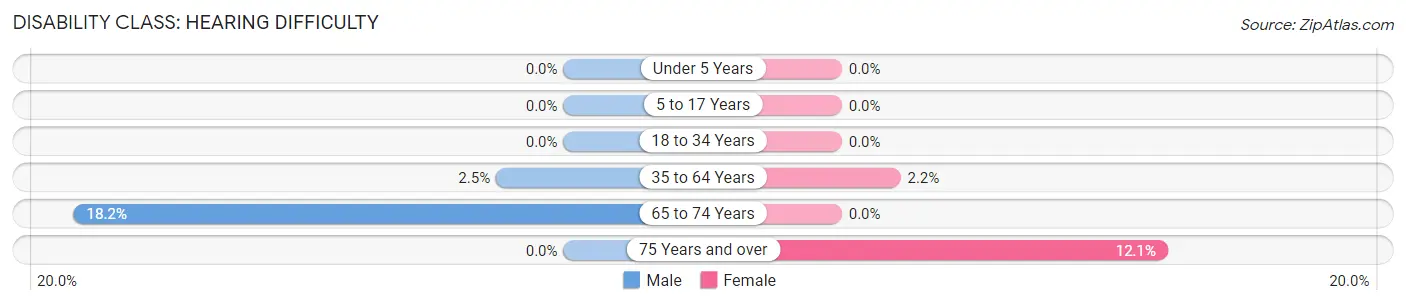
| Age Bracket | Male | Female |
| Under 5 Years | 0 (0.0%) | 0 (0.0%) |
| 5 to 17 Years | 0 (0.0%) | 0 (0.0%) |
| 18 to 34 Years | 0 (0.0%) | 0 (0.0%) |
| 35 to 64 Years | 17 (2.5%) | 20 (2.2%) |
| 65 to 74 Years | 14 (18.2%) | 0 (0.0%) |
| 75 Years and over | 0 (0.0%) | 15 (12.1%) |
Disability Class: Vision Difficulty
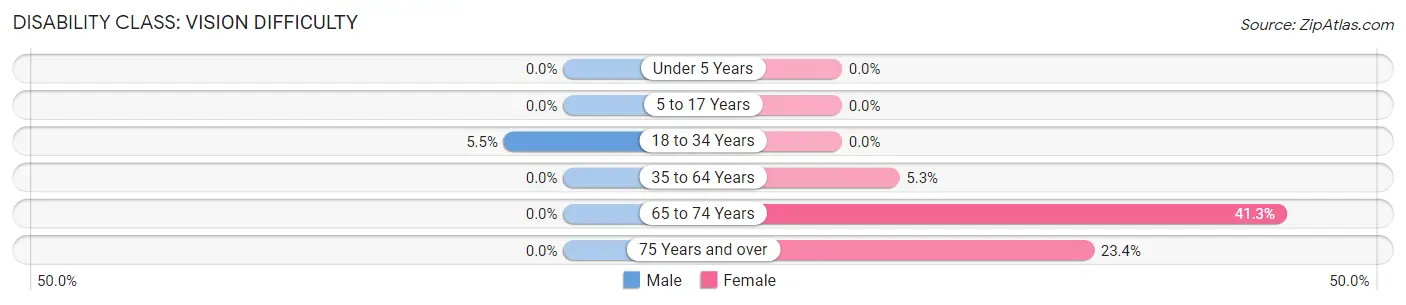
| Age Bracket | Male | Female |
| Under 5 Years | 0 (0.0%) | 0 (0.0%) |
| 5 to 17 Years | 0 (0.0%) | 0 (0.0%) |
| 18 to 34 Years | 21 (5.5%) | 0 (0.0%) |
| 35 to 64 Years | 0 (0.0%) | 49 (5.3%) |
| 65 to 74 Years | 0 (0.0%) | 38 (41.3%) |
| 75 Years and over | 0 (0.0%) | 29 (23.4%) |
Disability Class: Cognitive Difficulty
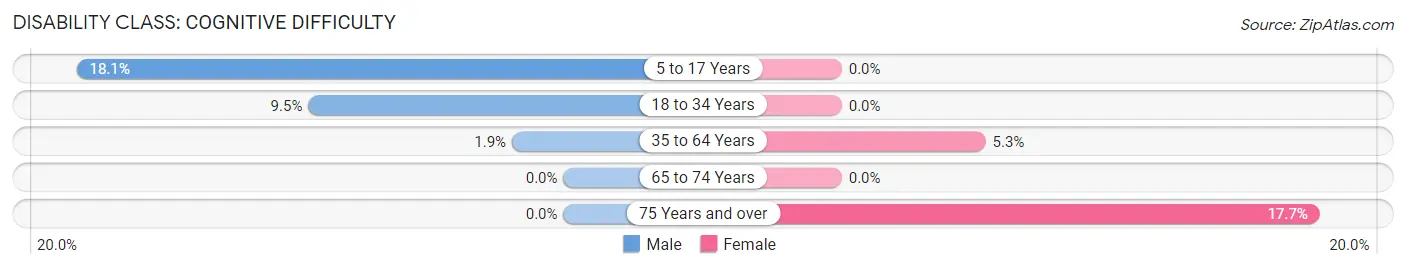
| Age Bracket | Male | Female |
| 5 to 17 Years | 30 (18.1%) | 0 (0.0%) |
| 18 to 34 Years | 36 (9.5%) | 0 (0.0%) |
| 35 to 64 Years | 13 (1.9%) | 49 (5.3%) |
| 65 to 74 Years | 0 (0.0%) | 0 (0.0%) |
| 75 Years and over | 0 (0.0%) | 22 (17.7%) |
Disability Class: Ambulatory Difficulty
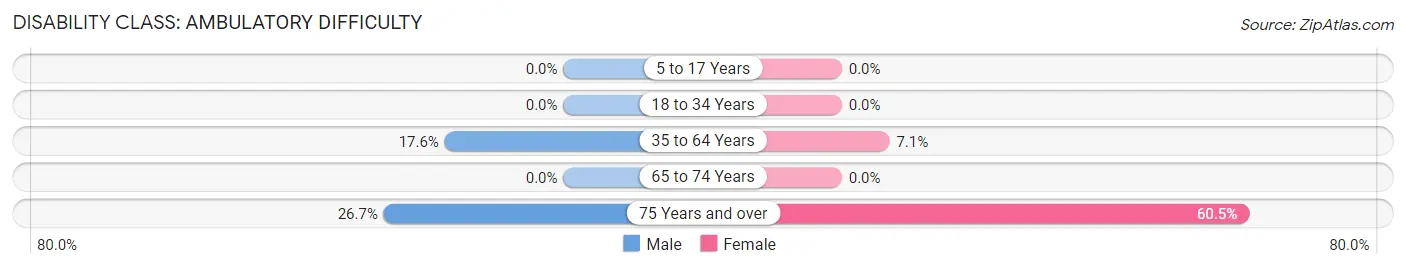
| Age Bracket | Male | Female |
| 5 to 17 Years | 0 (0.0%) | 0 (0.0%) |
| 18 to 34 Years | 0 (0.0%) | 0 (0.0%) |
| 35 to 64 Years | 120 (17.6%) | 65 (7.1%) |
| 65 to 74 Years | 0 (0.0%) | 0 (0.0%) |
| 75 Years and over | 8 (26.7%) | 75 (60.5%) |
Disability Class: Self-Care Difficulty
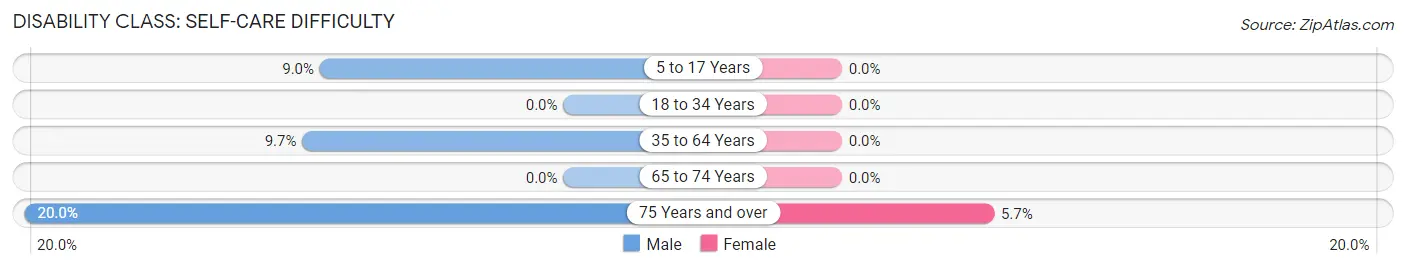
| Age Bracket | Male | Female |
| 5 to 17 Years | 15 (9.0%) | 0 (0.0%) |
| 18 to 34 Years | 0 (0.0%) | 0 (0.0%) |
| 35 to 64 Years | 66 (9.7%) | 0 (0.0%) |
| 65 to 74 Years | 0 (0.0%) | 0 (0.0%) |
| 75 Years and over | 6 (20.0%) | 7 (5.7%) |
Technology Access in Linwood
Computing Device Access in Linwood
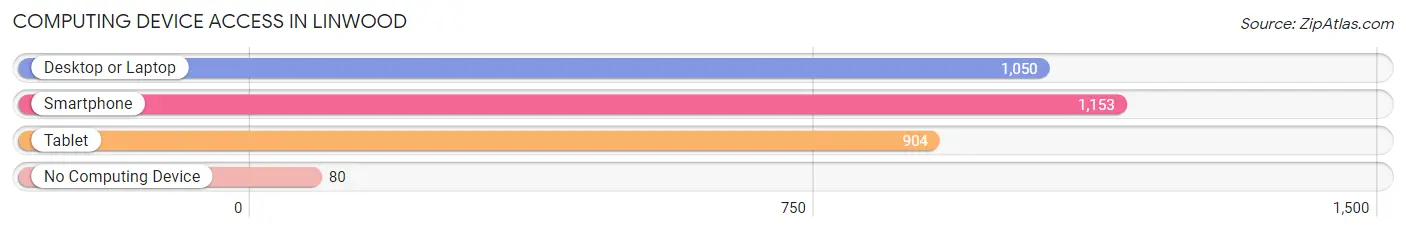
| Device Type | # Households | % Households |
| Desktop or Laptop | 1,050 | 76.1% |
| Smartphone | 1,153 | 83.6% |
| Tablet | 904 | 65.5% |
| No Computing Device | 80 | 5.8% |
| Total | 1,379 | 100.0% |
Internet Access in Linwood
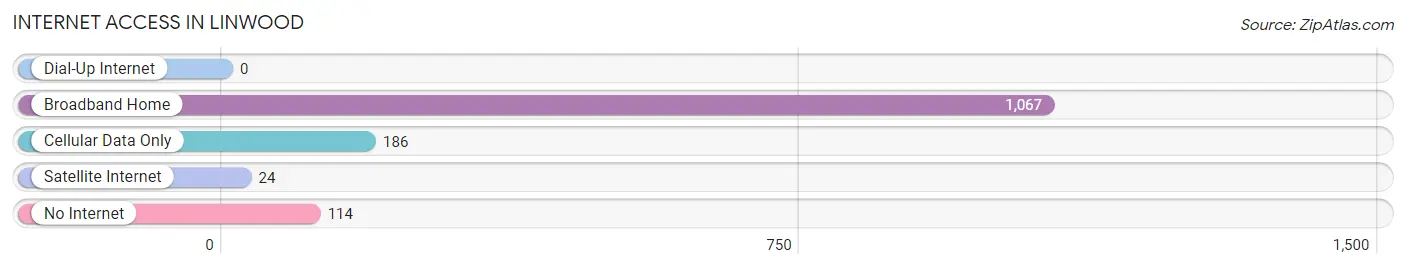
| Internet Type | # Households | % Households |
| Dial-Up Internet | 0 | 0.0% |
| Broadband Home | 1,067 | 77.4% |
| Cellular Data Only | 186 | 13.5% |
| Satellite Internet | 24 | 1.7% |
| No Internet | 114 | 8.3% |
| Total | 1,379 | 100.0% |
Linwood Summary
Linwood, Pennsylvania is a small borough located in Delaware County, Pennsylvania. It is situated on the western edge of the county, just south of the city of Philadelphia. The population of Linwood was 2,845 at the 2010 census.
Geography
Linwood is located at 39°53'45" North, 75°17'45" West (39.895833, -75.295833). It is situated on the western edge of Delaware County, just south of the city of Philadelphia. The borough is bordered by the boroughs of Collingdale to the north, Darby to the east, and Ridley Park to the south. The borough is also bordered by the townships of Nether Providence to the west and Upper Darby to the east.
Linwood is located in the Delaware Valley, a region of the United States that is known for its rich history and culture. The borough is situated on the banks of the Delaware River, which provides a scenic backdrop to the borough. The borough is also located near several major highways, including Interstate 95, the Pennsylvania Turnpike, and the Schuylkill Expressway.
History
Linwood was founded in 1876 by a group of Quakers who had migrated from the nearby borough of Darby. The borough was named after the Linwood family, who were among the first settlers of the area. The borough was incorporated in 1887.
Linwood was originally a rural farming community, but it began to experience rapid growth in the early 20th century. The borough was home to several factories, including a paper mill, a brickyard, and a canning factory. The borough also had a thriving business district, which included several stores, restaurants, and a movie theater.
Economy
Linwood is a primarily residential community, but it does have a few businesses. The borough is home to several small businesses, including a grocery store, a hardware store, and a few restaurants. The borough also has a few professional offices, including a law firm and a real estate office.
The borough is also home to a few industrial businesses, including a printing company and a metal fabrication shop. The borough is also home to a few light industrial businesses, including a plastics manufacturer and a machine shop.
Demographics
As of the 2010 census, the population of Linwood was 2,845. The racial makeup of the borough was 79.3% White, 15.2% African American, 0.3% Native American, 1.2% Asian, and 3.9% from other races. Hispanic or Latino of any race were 5.2% of the population.
The median household income in Linwood was $45,938, and the median family income was $54,844. The per capita income in the borough was $21,945. About 8.3% of families and 10.2% of the population were below the poverty line, including 14.2% of those under age 18 and 6.2% of those age 65 or over.
Common Questions
What is Per Capita Income in Linwood?
Per Capita income in Linwood is $32,203.
What is the Median Family Income in Linwood?
Median Family Income in Linwood is $80,238.
What is the Median Household income in Linwood?
Median Household Income in Linwood is $69,728.
What is Income or Wage Gap in Linwood?
Income or Wage Gap in Linwood is 17.1%.
Women in Linwood earn 82.9 cents for every dollar earned by a man.
What is Inequality or Gini Index in Linwood?
Inequality or Gini Index in Linwood is 0.39.
What is the Total Population of Linwood?
Total Population of Linwood is 3,287.
What is the Total Male Population of Linwood?
Total Male Population of Linwood is 1,334.
What is the Total Female Population of Linwood?
Total Female Population of Linwood is 1,953.
What is the Ratio of Males per 100 Females in Linwood?
There are 68.31 Males per 100 Females in Linwood.
What is the Ratio of Females per 100 Males in Linwood?
There are 146.40 Females per 100 Males in Linwood.
What is the Median Population Age in Linwood?
Median Population Age in Linwood is 41.2 Years.
What is the Average Family Size in Linwood
Average Family Size in Linwood is 2.7 People.
What is the Average Household Size in Linwood
Average Household Size in Linwood is 2.4 People.
How Large is the Labor Force in Linwood?
There are 2,075 People in the Labor Forcein in Linwood.
What is the Percentage of People in the Labor Force in Linwood?
75.3% of People are in the Labor Force in Linwood.
What is the Unemployment Rate in Linwood?
Unemployment Rate in Linwood is 7.2%.