Zip Codes with the Highest Percentage of Population Employed in Administrative & Support Services in Norristown, PA
RELATED REPORTS & OPTIONS
Administrative & Support Services
Norristown
Compare Zip Codes
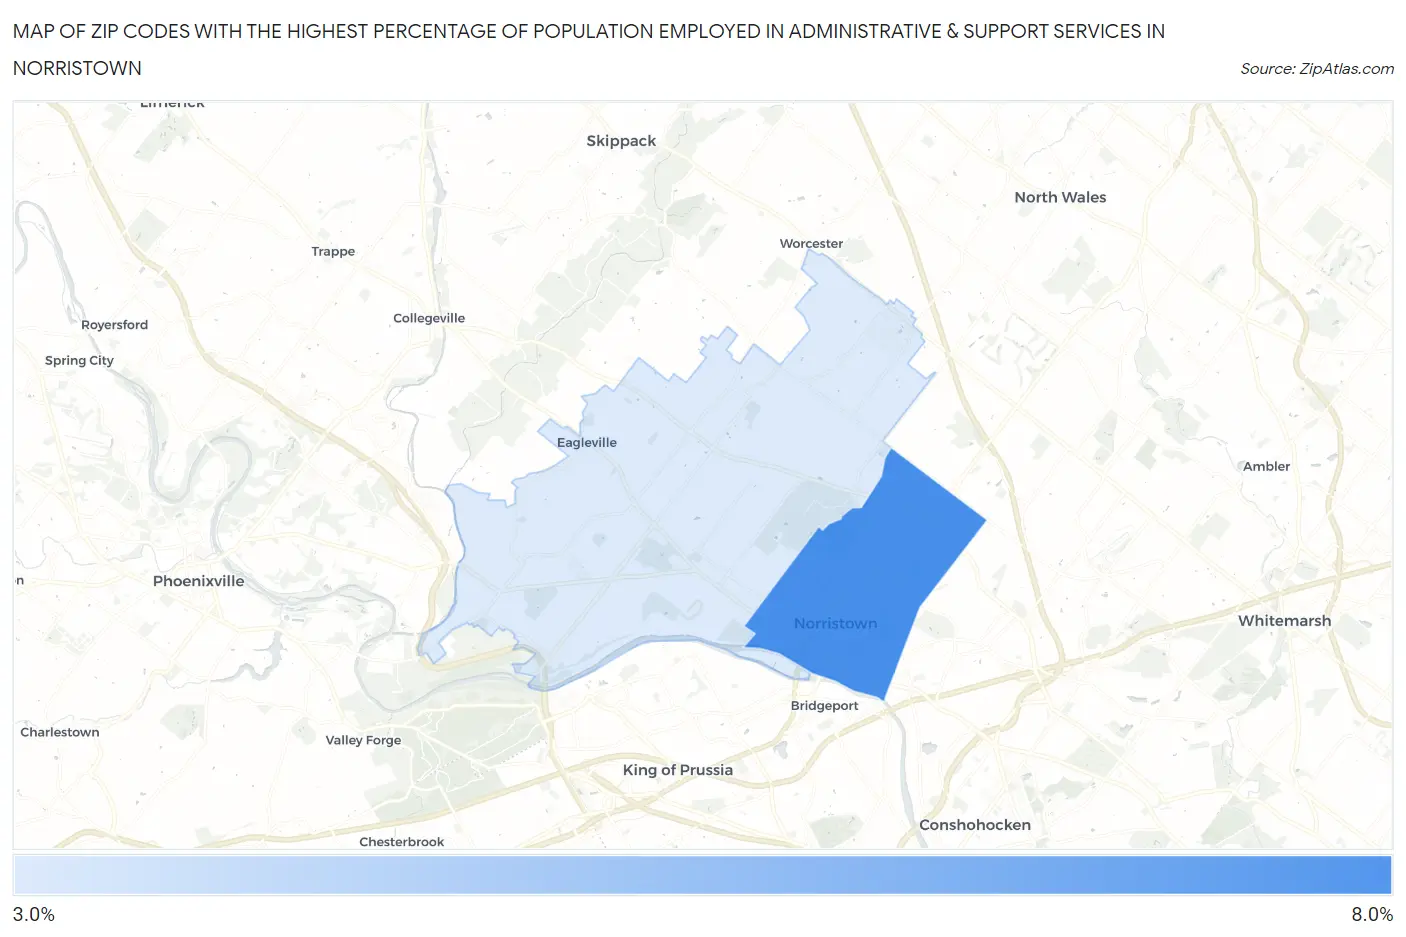
Map of Zip Codes with the Highest Percentage of Population Employed in Administrative & Support Services in Norristown
3.8%
6.4%
Zip Codes with the Highest Percentage of Population Employed in Administrative & Support Services in Norristown, PA
| Zip Code | % Employed | vs State | vs National | |
| 1. | 19401 | 6.4% | 3.6%(+2.80)#182 | 4.1%(+2.24)#4,096 |
| 2. | 19403 | 3.8% | 3.6%(+0.170)#572 | 4.1%(-0.395)#11,737 |
1
Common Questions
What are the Top Zip Codes with the Highest Percentage of Population Employed in Administrative & Support Services in Norristown, PA?
Top Zip Codes with the Highest Percentage of Population Employed in Administrative & Support Services in Norristown, PA are:
What zip code has the Highest Percentage of Population Employed in Administrative & Support Services in Norristown, PA?
19401 has the Highest Percentage of Population Employed in Administrative & Support Services in Norristown, PA with 6.4%.
What is the Percentage of Population Employed in Administrative & Support Services in Pennsylvania?
Percentage of Population Employed in Administrative & Support Services in Pennsylvania is 3.6%.
What is the Percentage of Population Employed in Administrative & Support Services in the United States?
Percentage of Population Employed in Administrative & Support Services in the United States is 4.1%.