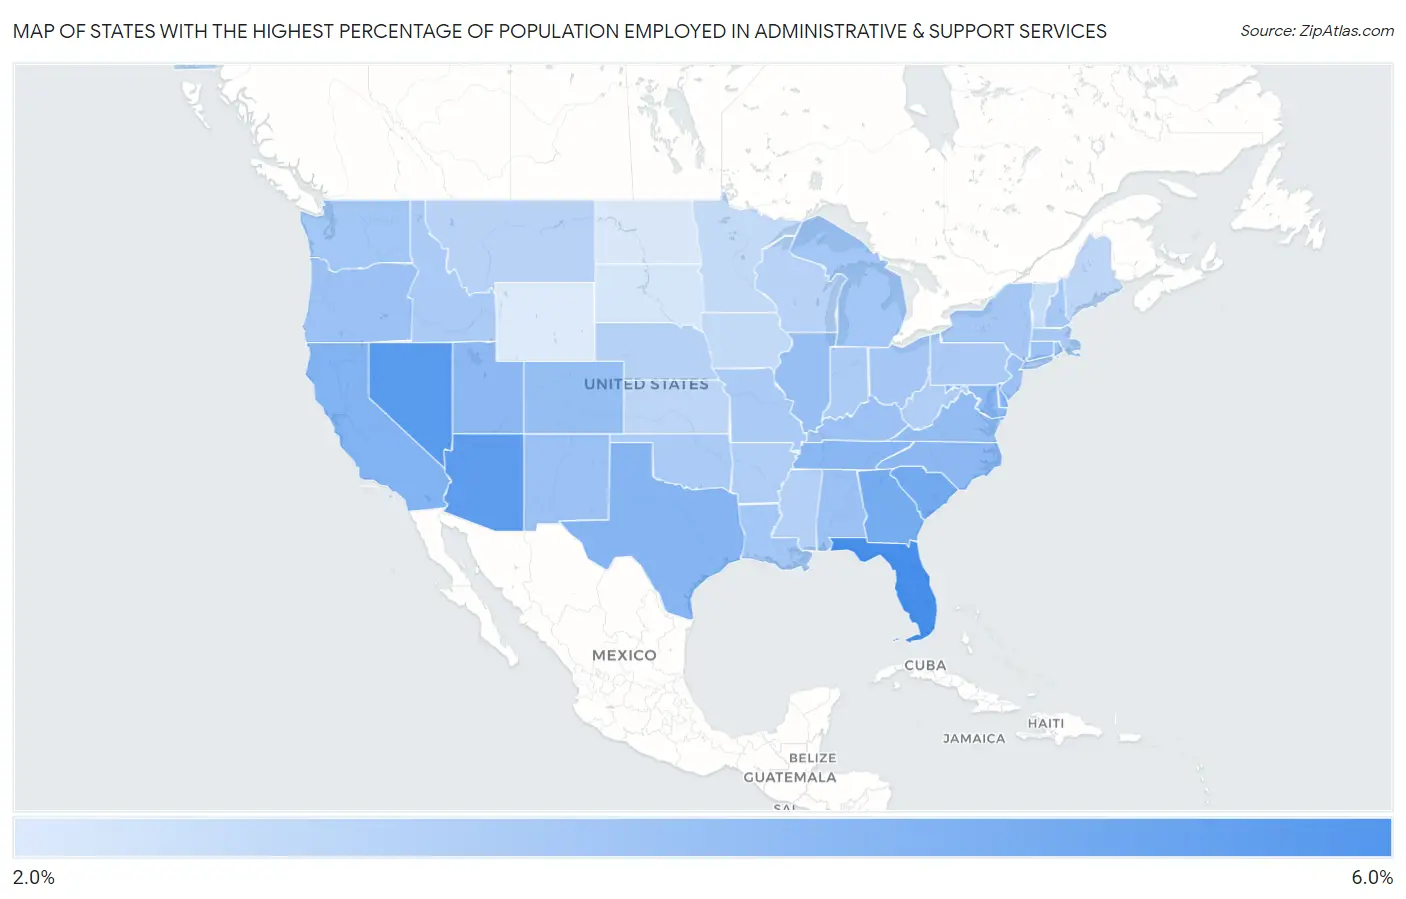
States with the Highest Percentage of Population Employed in Administrative & Support Services
RELATED REPORTS & OPTIONS
Administrative & Support Services
United States
Compare States
Map of States with the Highest Percentage of Population Employed in Administrative & Support Services
2.0%
6.0%

States with the Highest Percentage of Population Employed in Administrative & Support Services in the United States
| State | % Employed | vs State Median | vs National | |
| 1. | Florida | 5.9% | 3.7% (+2.13) | 4.1%(+1.73) |
| 2. | Nevada | 5.5% | 3.7% (+1.77) | 4.1%(+1.37) |
| 3. | Arizona | 5.4% | 3.7% (+1.61) | 4.1%(+1.20) |
| 4. | South Carolina | 4.8% | 3.7% (+1.10) | 4.1%(+0.694) |
| 5. | Georgia | 4.8% | 3.7% (+1.07) | 4.1%(+0.667) |
| 6. | Hawaii | 4.7% | 3.7% (+0.999) | 4.1%(+0.596) |
| 7. | California | 4.6% | 3.7% (+0.823) | 4.1%(+0.420) |
| 8. | Texas | 4.4% | 3.7% (+0.669) | 4.1%(+0.266) |
| 9. | Delaware | 4.4% | 3.7% (+0.643) | 4.1%(+0.240) |
| 10. | Tennessee | 4.4% | 3.7% (+0.606) | 4.1%(+0.203) |
| 11. | Utah | 4.3% | 3.7% (+0.545) | 4.1%(+0.142) |
| 12. | North Carolina | 4.3% | 3.7% (+0.518) | 4.1%(+0.115) |
| 13. | Maryland | 4.2% | 3.7% (+0.486) | 4.1%(+0.083) |
| 14. | Virginia | 4.1% | 3.7% (+0.390) | 4.1%(-0.013) |
| 15. | Colorado | 4.1% | 3.7% (+0.345) | 4.1%(-0.058) |
| 16. | Illinois | 4.0% | 3.7% (+0.271) | 4.1%(-0.133) |
| 17. | Alabama | 4.0% | 3.7% (+0.222) | 4.1%(-0.181) |
| 18. | Connecticut | 4.0% | 3.7% (+0.214) | 4.1%(-0.189) |
| 19. | Kentucky | 4.0% | 3.7% (+0.212) | 4.1%(-0.191) |
| 20. | New Jersey | 3.9% | 3.7% (+0.203) | 4.1%(-0.200) |
| 21. | New Mexico | 3.9% | 3.7% (+0.203) | 4.1%(-0.201) |
| 22. | Oregon | 3.9% | 3.7% (+0.197) | 4.1%(-0.206) |
| 23. | Rhode Island | 3.9% | 3.7% (+0.171) | 4.1%(-0.233) |
| 24. | Louisiana | 3.8% | 3.7% (+0.021) | 4.1%(-0.382) |
| 25. | Washington | 3.8% | 3.7% (+0.019) | 4.1%(-0.384) |
| 26. | Michigan | 3.7% | 3.7% (-0.019) | 4.1%(-0.422) |
| 27. | Ohio | 3.7% | 3.7% (-0.022) | 4.1%(-0.426) |
| 28. | New York | 3.7% | 3.7% (-0.058) | 4.1%(-0.462) |
| 29. | New Hampshire | 3.7% | 3.7% (-0.067) | 4.1%(-0.470) |
| 30. | Massachusetts | 3.6% | 3.7% (-0.101) | 4.1%(-0.505) |
| 31. | Oklahoma | 3.6% | 3.7% (-0.129) | 4.1%(-0.532) |
| 32. | Idaho | 3.6% | 3.7% (-0.148) | 4.1%(-0.552) |
| 33. | Pennsylvania | 3.6% | 3.7% (-0.161) | 4.1%(-0.565) |
| 34. | Missouri | 3.6% | 3.7% (-0.163) | 4.1%(-0.566) |
| 35. | Indiana | 3.5% | 3.7% (-0.218) | 4.1%(-0.621) |
| 36. | Arkansas | 3.4% | 3.7% (-0.317) | 4.1%(-0.720) |
| 37. | West Virginia | 3.4% | 3.7% (-0.323) | 4.1%(-0.726) |
| 38. | Mississippi | 3.4% | 3.7% (-0.342) | 4.1%(-0.745) |
| 39. | Nebraska | 3.4% | 3.7% (-0.393) | 4.1%(-0.796) |
| 40. | Wisconsin | 3.3% | 3.7% (-0.453) | 4.1%(-0.856) |
| 41. | Montana | 3.3% | 3.7% (-0.481) | 4.1%(-0.884) |
| 42. | Kansas | 3.2% | 3.7% (-0.559) | 4.1%(-0.963) |
| 43. | Maine | 3.2% | 3.7% (-0.565) | 4.1%(-0.968) |
| 44. | Alaska | 3.0% | 3.7% (-0.703) | 4.1%(-1.11) |
| 45. | Minnesota | 3.0% | 3.7% (-0.704) | 4.1%(-1.11) |
| 46. | Iowa | 3.0% | 3.7% (-0.718) | 4.1%(-1.12) |
| 47. | Vermont | 3.0% | 3.7% (-0.762) | 4.1%(-1.17) |
| 48. | South Dakota | 2.6% | 3.7% (-1.15) | 4.1%(-1.56) |
| 49. | North Dakota | 2.5% | 3.7% (-1.22) | 4.1%(-1.62) |
| 50. | Wyoming | 2.4% | 3.7% (-1.30) | 4.1%(-1.70) |
1
Common Questions
What are the Top 10 States with the Highest Percentage of Population Employed in Administrative & Support Services in the United States?
Top 10 States with the Highest Percentage of Population Employed in Administrative & Support Services in the United States are:
#1
5.9%
#2
5.5%
#3
5.4%
#4
4.8%
#5
4.8%
#6
4.7%
#7
4.6%
#8
4.4%
#9
4.4%
#10
4.4%
What state has the Highest Percentage of Population Employed in Administrative & Support Services in the United States?
Florida has the Highest Percentage of Population Employed in Administrative & Support Services in the United States with 5.9%.
What is the Percentage of Population Employed in Administrative & Support Services in the United States?
Percentage of Population Employed in Administrative & Support Services in the United States is 4.1%.